Release – Tonix Pharmaceuticals Announces Pricing of $15 Million Private Placement of Convertible Redeemable Preferred Stock

Research, News, and Market Data on TNXP

October 25, 2022 7:00am EDT

CHATHAM, N.J., Oct. 25, 2022 (GLOBE NEWSWIRE) — Tonix Pharmaceuticals Holding Corp. (Nasdaq: TNXP), a clinical-stage biopharmaceutical company, today announced that it has entered into a securities purchase agreement with certain institutional investors to purchase 1,400,000 shares of Series A convertible redeemable preferred stock and 100,000 shares of Series B convertible redeemable preferred stock. Each share of Series A and Series B preferred stock has a purchase price of $9.50, representing an original issue discount of 5% of the $10.00 stated value of each share. Each share of Series A and Series B preferred stock is convertible into shares of the Company’s common stock at an initial conversion price of $1.00 per share. Shares of the Series A and Series B preferred stock are convertible at the option of the holder at any time following the Company’s receipt of shareholder approval for an increase to the authorized shares of common stock of the Company from 150 million to 1 billion. The Company and the holders of the Series A and Series B preferred stock also entered into a registration rights agreement to register the resale of the shares of common stock issuable upon conversion of the Series A and Series B preferred stock. Total gross proceeds from the offerings, before deducting discounts, placement agent’s fees and other estimated offering expenses, is $15 million.

The Series A and Series B preferred stock permits the holders thereof to vote together with the holders of the Company’s common stock on a proposal to effectuate an increase to the authorized shares of common stock of the Company at a special meeting of Company shareholders. The Series B preferred stock permits the holder to cast 2,500 votes per share of Series B preferred stock on such proposal, provided, that such votes must be cast in the same proportions as the shares of common stock and Series A preferred stock are voted on that proposal. Except as required by law or expressly provided by the certificate of designation, holders of the Series A and Series B preferred stock will not be permitted to vote on any other matters. The holders of the Series A and Series B preferred stock agreed not to transfer, offer, sell, contract to sell, hypothecate, pledge or otherwise dispose of their shares of preferred stock until after the special meeting. The holders of the Series A and Series B preferred stock have the right to require the Company to redeem their shares of preferred stock for cash at 105% of the stated value of such shares commencing after the earlier of (i) the date on which the Company’s receives shareholder approval to increase the Company’s authorized shares of common stock or (ii) 60 days after the closing of the issuances of the Series A and Series B preferred stock and ending 90 days after such closing. The Company has the option to redeem the Series A and Series B preferred stock for cash at 105% of the stated value commencing after the Company’s shareholders’ approval of the increase to the authorized shares of common stock of the Company, subject to the holders’ rights to convert the shares prior to a redemption at the option of the Company.

The closing of the offering is expected to occur on or about October 26, 2022, subject to the satisfaction of customary closing conditions. Additional information regarding the securities described above and the terms of the offering are included in a Current Report on Form 8-K to be filed with the United States Securities and Exchange Commission (“SEC”).

A.G.P./Alliance Global Partners is acting as the sole placement agent in connection with the offering.

The Series A and Series B preferred stock and shares of common stock into which these preferred shares are convertible are being issued in reliance upon the exemption from the securities registration afforded by Section 4(a)(2) of the Securities Act of 1933, as amended (the “1933 Act”) and/or Rule 506 of Regulation D as promulgated by SEC under the 1933 Act.

This press release shall not constitute an offer to sell or a solicitation of an offer to buy these securities, nor shall there be any sale of these securities in any state or other jurisdiction in which such offer, solicitation or sale would be unlawful prior to the registration or qualification under the securities laws of any such state or other jurisdiction.

About Tonix Pharmaceuticals Holding Corp.*

Tonix is a clinical-stage biopharmaceutical company focused on discovering, licensing, acquiring and developing therapeutics to treat and prevent human disease and alleviate suffering. Tonix’s portfolio is composed of central nervous system (CNS), rare disease, immunology and infectious disease product candidates. Tonix’s CNS portfolio includes both small molecules and biologics to treat pain, neurologic, psychiatric and addiction conditions. Tonix’s lead CNS candidate, TNX-102 SL (cyclobenzaprine HCl sublingual tablet), is in mid-Phase 3 development for the management of fibromyalgia with a new Phase 3 study launched in the second quarter of 2022 and interim data expected in the second quarter of 2023. TNX-102 SL is also being developed to treat Long COVID, a chronic post-acute COVID-19 condition. Tonix initiated a Phase 2 study in Long COVID in the third quarter of 2022 and expects interim data in the first half of 2023. TNX-1300 (cocaine esterase) is a biologic designed to treat cocaine intoxication and has been granted Breakthrough Therapy designation by the FDA. A Phase 2 study of TNX-1300 is expected to be initiated in the first quarter of 2023. TNX-1900 (intranasal potentiated oxytocin), a small molecule in development for chronic migraine, is expected to enter the clinic with a Phase 2 study in the fourth quarter of 2022. TNX-601 ER (tianeptine hemioxalate extended-release tablets) is a once-daily formulation of tianeptine being developed as a potential treatment for major depressive disorder (MDD) with a Phase 2 study expected to be initiated in the first quarter of 2023. Tonix’s rare disease portfolio includes TNX-2900 (intranasal potentiated oxytocin) for the treatment of Prader-Willi syndrome. TNX-2900 has been granted Orphan Drug designation by the FDA. Tonix’s immunology portfolio includes biologics to address organ transplant rejection, autoimmunity and cancer, including TNX-1500, which is a humanized monoclonal antibody targeting CD40-ligand (CD40L or CD154) being developed for the prevention of allograft and xenograft rejection and for the treatment of autoimmune diseases. A Phase 1 study of TNX-1500 is expected to be initiated in the first half of 2023. Tonix’s infectious disease pipeline consists of a vaccine in development to prevent smallpox and monkeypox, next-generation vaccines to prevent COVID-19, and a platform to make fully human monoclonal antibodies to treat COVID-19. TNX-801, Tonix’s vaccine in development to prevent smallpox and monkeypox, also serves as the live virus vaccine platform or recombinant pox vaccine (RPV) platform for other infectious diseases. A Phase 1 study of TNX-801 is expected to be initiated in Kenya in the first half of 2023. Tonix’s lead vaccine candidate for COVID-19 is TNX-1850, a live virus vaccines based on Tonix’s recombinant pox live virus vector vaccine platform.

*All of Tonix’s product candidates are investigational new drugs or biologics and none have been approved for any indication

This press release and further information about Tonix can be found at www.tonixpharma.com.

Forward Looking Statements

Certain statements in this press release are forward-looking within the meaning of the Private Securities Litigation Reform Act of 1995. These statements may be identified by the use of forward-looking words such as “anticipate,” “believe,” “forecast,” “estimate,” “expect,” and “intend,” among others. These forward-looking statements are based on Tonix’s current expectations and actual results could differ materially. There are a number of factors that could cause actual events to differ materially from those indicated by such forward-looking statements. These factors include, but are not limited to, risks related to the failure to obtain FDA clearances or approvals and noncompliance with FDA regulations; delays and uncertainties caused by the global COVID-19 pandemic; risks related to the timing and progress of clinical development of our product candidates; our need for additional financing; uncertainties of patent protection and litigation; uncertainties of government or third party payor reimbursement; limited research and development efforts and dependence upon third parties; and substantial competition. As with any pharmaceutical under development, there are significant risks in the development, regulatory approval and commercialization of new products. Tonix does not undertake an obligation to update or revise any forward-looking statement. Investors should read the risk factors set forth in the Annual Report on Form 10-K for the year ended December 31, 2021, as filed with the Securities and Exchange Commission (the “SEC”) on March 14, 2022, and periodic reports filed with the SEC on or after the date thereof. All of Tonix’s forward-looking statements are expressly qualified by all such risk factors and other cautionary statements. The information set forth herein speaks only as of the date thereof.

Contacts

Jessica Morris (corporate)
Tonix Pharmaceuticals
investor.relations@tonixpharma.com
(862) 799-8599

Olipriya Das, Ph.D. (media)
Russo Partners
Olipriya.Das@russopartnersllc.com
(646) 942-5588

Peter Vozzo (investors)
ICR Westwicke
peter.vozzo@westwicke.com
(443) 213-0505

Source: Tonix Pharmaceuticals Holding Corp.

Released October 25, 2022

Avivagen Inc. (VIVXF) – Securing More Financing


Tuesday, October 25, 2022
Avivagen is a life sciences corporation focused on developing and commercializing products for livestock, companion animal and human applications that, by safely supporting immune function, promote general health and performance. It is a public corporation traded on the TSX Venture Exchange under the symbol VIV and is headquartered in Ottawa, Canada, based in partnership facilities of the National Research Council of Canada. For more information, visit www.avivagen.com. The contents of the website are expressly not incorporated by reference in this press release.

Joe Gomes, Senior Research Analyst, Noble Capital Markets, Inc.

Joshua Zoepfel, Research Associate, Noble Capital Markets, Inc.

Refer to the full report for the price target, fundamental analysis, and rating.

Issuing New Shares. Last Friday, Avivagen announced the closing of a first tranche of a non-brokered private placement of shares. The total amount of common shares issued in the first tranche was 2.15 million for approximately $430,000, or $0.20 per share. The total amount of the placement financing is up to $1 million. We expect the Company to issue the full amount in the private placement.

Use of Financing. The use of the funds will be for funding research and development expenses, sales and marketing costs, product registration, interest expense, working capital, and general corporate purposes. We anticipate the use of the funding will be for product expansion as the Company is continuing to work towards a No Objection Letter in the U.S., targeting an expansion in the European Union, and is seeing increased interest in South America.


Get the Full Report

This Company Sponsored Research is provided by Noble Capital Markets, Inc., a FINRA and S.E.C. registered broker-dealer (B/D).

*Analyst certification and important disclosures included in the full report. NOTE: investment decisions should not be based upon the content of this research summary. Proper due diligence is required before making any investment decision. 

The Truth About the Fed Pivot Rumors

Image Credit: Camilo Rueda López (Flickr)

A Lack of Fed Pivot Doesn’t Have to Equate to Lower Stock Prices

The Fed is not likely to have suddenly indicated a pivot.

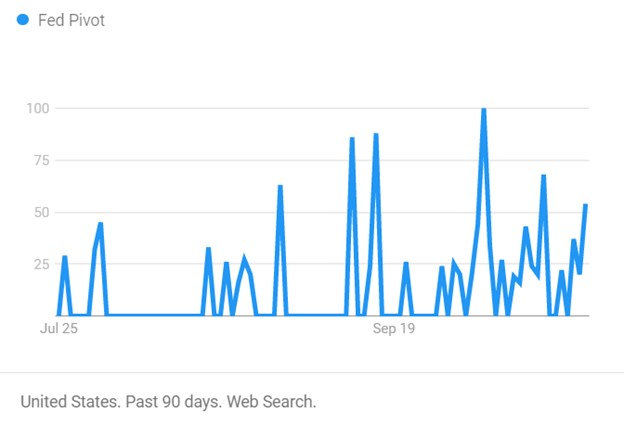
Despite the stock market rally and fresh news stories suggesting the Fed is indicating a more dovish stance, the notion has one problem. There are limits placed on Federal Open Market Committee (FOMC) participants and whether they can grant interviews or give speeches before policy-setting meetings. They can not interact on the subject of policy. The current blackout period began October 22nd and will carry through the November 2nd final meeting day. So, investors may wish to consider other reasons if the stock market is rallying. Earnings, oversold conditions, year-end rally, perhaps news stories created by bloggers or journalists that don’t possess experience or understanding.

Image: Number of times “Fed Pivot” was searched using Google 

Current State of Tightening

This year the Fed has been tightening aggressively after having brought interest rates down aggressively a couple of years back. For many investors, a tightening cycle, ending with interest rates a safe margin above the inflation rate, is not something they can recall. This is because the Fed has been stabilizing employment during tricky times in a way that has lifted the markets out of whatever trouble there may have been. Rates have been well below the average 6% to 8% range. This has been going on since at least 2008 –  by some measures, way before.

There have been five times since late Spring that investors and TV’s talking heads were convinced the Fed has gone too far and will now begin bringing rates back. So far, all the hoping has done nothing to help; the track record stands at zero for five. While it remains to be seen and heard what to expect from monetary policy starting mid-next week, the current inflation rate and words that the Fed board members have said indicate another 75 bp hike in funds.

Looking Forward

Can this change? We get a look at third-quarter GDP on Thursday. This measures U.S. domestic production. A bad number could cause the Fed to rethink aggressive tightening. However, the expectations are that it will be higher than it has been all year (2.3% growth rate) which gives the Fed even greater ability to hit the brakes. Also, the PCE Price Index, viewed as the Fed’s preferred inflation indicator, is released Friday (6.3% YoY expected).

The Federal Reserve’s, monetary policy does not cater to the stock market. It does consider it because, of the wealth effect. The wealth effect is where consumers feel poorer because of declines in asset values, and while their disposable income may not have changed, they hunker down and spend less. This secondary impact to spending is the only attention the Fed officially pays to stocks.

Interest Rates

Real interest rates are still negative. Imagine buying a bond knowing that despite being exposed to maturity and credit risk, while tying up money, your spending power will almost certainly be less when it matures. This isn’t why people invest; in fact, if that scenario remains and inflation persists, the best use of savings may be to consider any large purchases you think you may incur in the coming few years and make them now. At the moment, inflation hasn’t shown signs of abating, something has to give; bond investors are going to require higher yields, Japan has already experienced a bond-buyer “strike.”

Where Do We Go from Here

For now, the consensus view is that inflation should drift back down to 3% or even lower by 2025. If energy continues to decline, supply-chain issues are resolved, and a strong U.S. dollar persists, the consensus may be correct. But one should be aware there are very bright economists that deviate from the consensus by plus or minus 300 bp or more.  

The markets may have already priced in bad news; rates heading back to normalcy (upward) doesn’t immediately mean a bad stock market. We can easily rally through the end of the year and still experience a sixth time the Fed has refrained from pivoting but instead has made sure its words were cleansed of anything that can be construed as reversing course.

Paul Hoffman

Managing Editor, Channelchek

We’re in an Energy Crisis According to the IEA

Image Credit: Steve Jurvetson (Flickr)

How Deep and How Long Will the Global Energy Crisis Last?

Are we in a global energy crisis? The Executive Director of the International Energy Agency (IEA), Dr. Fatih Birol, is sure of it. He referred to the global situation as a crisis on Tuesday (Oct. 25), speaking first at a conference, and later in an interview on CNBC. He explained that tighter markets for liquefied natural gas (LNG) worldwide and major oil producers cutting supply, have put the world in the middle of “the first truly global energy crisis.”

Our world has never witnessed an energy crisis with this depth and complexity,” according to the IEA head. He explained that until February 24, 2022, Russia was the number one fossil fuel exporter in the world. What has occurred since has been a major turn in oil and natural gas markets. Birol expects the volatility in oil and gas markets will continue throughout the world. When asked on CNBC Internaational if he thought it would be a prolonged war, he made clear that this is not his area of expertise; however, he believes there won’t be a “smooth transition into the next chapter for both oil and natural gas of the energy event.”

U.S. vs OPEC+

As it relates to the U.S. and OPEC being at odds, with OPEC managing toward supply-demand issues, and the U.S. being challenged by inflation, Birol says the two billion barrels cut by the oil-exporting nations is unprecedented. He believes it goes against their ambition to maximize profits as it works against economic growth in a world that is flirting with recession. He also pointed out it isn’t the U.S. that will experience hardship, rather, the emerging and developing countries will be hit hardest.

Image: Fatih Birol, IAEA Imagebank (November 2021)

On the same day, speaking at the Singapore International Energy Week, he shared that higher oil prices would push inflation higher and growth and production to shrink.

IEA projections show global oil consumption growing by 1.7 million barrels a day in 2023. Russian crude will be needed to bridge the gap between demand and supply, Birol said.

Russian Connection

The reduced Russian supply is a result of U.S. and the European Union’s decisions to place partial bans on Russian oil imports after Russia’s invasion of its neighboring country. The current proposed plan as the region heads into the heating season is to institute price caps on Russian resources. That would limit Moscow’s potential profits from oil exports while still allowing modest deliveries. Estimates are that these measures would leave space for between 80% and 90% of Russian oil to flow outside of the price cap. Birol expects this would help to make up for expected shortfalls. “I think this is good, because the world still needs Russian oil to flow into the market for now,” he said.

Oil Reserves

IEA members have built a stockpile of oil reserves that can be released if there’s a need to boost supply or temper prices, according to Birol. “We still have a huge amount of stocks to be released in case we see supply disruptions,” he said. “Currently, it is not on the agenda, but it can come anytime.”

The IEA head says that Europe will get through the winter if the weather remains mild, though somewhat battered. Birol said. “Unless we will have an extremely cold and long winter, unless there will be any surprises in terms of what we have seen, for example, Nord Stream pipeline explosion, Europe should go through this winter with some economic and social bruises.”

Take Away

The Executive Director of the IEA was in Singapore, speaking at a conference and giving media interviews. He did not sugarcoat his expectations. He expects oil and natural gas prices to remain volatile, and believes the emerging markets will be hurt most by OPECs cutting output. As for the upcoming winter, Birol says we are experiencing the worst global energy crisis in history, and it won’t resolve itself soon.

Paul Hoffman

Managing Editor, Channelchek

Sources

https://bdnews24.com/business/7y637b19aj

https://www.iea.org/contributors/dr-fatih-birol

https://www.usnews.com/news/top-news/articles/2022-10-24/world-is-in-its-first-truly-global-energy-crisis-ieas-birol

https://www.youtube.com/watch?v=RZEYUXbcYzI

Release – BioSig Signs Master Research Agreement with Cleveland Clinic to Explore Expanded Applications for its Digital Signal Processing Technology

Research News and Market Data on BSGM

October 24, 2022

Westport, CT, Oct. 24, 2022 (GLOBE NEWSWIRE) —

  • Medical Center of Excellence to leverage the Company’s PURE EP™ System to further its research and educational objectives as a leader in cardiac electrophysiology
  • Clinical investigations conducted by Cleveland Clinic could expand clinical parameters of BioSig’s digital signal processing technology for arrhythmia care

BioSig Technologies, Inc. (NASDAQ: BSGM) (“BioSig” or the “Company”) an advanced digital signal processing technology company delivering unprecedented accuracy and precision to intracardiac signal visualization with its proprietary PURE EP™ System, today announced that it will sponsor a research agreement with Cleveland Clinic Foundation (CCF) to investigate expanded clinical applications for the intracardiac signals acquired by its PURE EP™ System.

Under the terms of the research agreement, Cleveland Clinic will conduct physician initiated scientific research investigating PURE EP™’s potential to address common limitations of signal processing and signal use expansion during— but not limited to— electrophysiology ablation procedures. Results from this research could elucidate new clinical workflow methods impacting the ablation process for numerous arrhythmia types.

The Company has selected Cleveland Clinic, a leading medical center of excellence, based on their world-class physician faculty, research competency, and mutual interest in leveraging digital signal processing technology to further advance the field of cardiac electrophysiology. 

“As a non-profit, research, education, and healthcare institution, Cleveland Clinic has a long legacy of innovation in cardiovascular disease, and specifically in the field of electrophysiology. At BioSig, we embody their commitment to clinical discovery and ensuring that optimal treatments are made available to patients with efficiency and efficacy,” said Gray Fleming, Chief Commercialization Officer, BioSig Technologies, Inc. “We are honored to align ourselves with Cleveland Clinic’s expertise as we discover new ways to positively impact procedural workflows by leveraging digital signal processing technology.”

BioSig’s PURE EP™ System is currently under evaluation at both Main and Fairview campuses of Cleveland Clinic’s Heart, Vascular & Thoracic Institute.  

About Cleveland Clinic

Cleveland Clinic is a nonprofit multispecialty academic medical center that integrates clinical and hospital care with research and education. U.S. News & World Report consistently names Cleveland Clinic as one of the nation’s best hospitals in its annual “America’s Best Hospitals” survey. As a leader in arrhythmia treatment and diagnosis, Cleveland Clinic medical centers include state-of-the-art electrophysiology laboratories, world-class physicians and researchers, and the latest cutting-edge technologies and protocols deployed for the treatment of heart abnormalities. To learn more, visit clevelandclinic.org.

About BioSig Technologies

BioSig Technologies is an advanced digital signal processing technology company bringing never-before-seen insights to the treatment of cardiovascular arrhythmias. Through collaboration with physicians, experts, and healthcare leaders across the field of electrophysiology (EP), BioSig is committed to addressing healthcare’s biggest priorities — saving time, saving costs, and saving lives.

The Company’s first product, the PURE EP™ System, an FDA 510(k) cleared non-invasive class II device, provides superior, real-time signal visualization allowing physicians to perform insight-based, highly targeted cardiac ablation procedures with increased procedural efficiency and efficacy.

The PURE EP™ System is currently in a national commercial launch and an integral part of well-respected healthcare systems, such as Mayo Clinic, Texas Cardiac Arrhythmia Institute, Cleveland Clinic, and Kansas City Heart Rhythm Institute. In a blinded clinical study recently published in the Journal of Cardiovascular Electrophysiology, electrophysiologists rated PURE EP™ as equivalent or superior to conventional systems for 93.6% of signal samples, with 75.2% earning a superior rating.

The global EP market is projected to reach $16B in 2028 with a 11.2% growth rate.[1]

Forward-looking Statements

This press release contains “forward-looking statements.” Such statements may be preceded by the words “intends,” “may,” “will,” “plans,” “expects,” “anticipates,” “projects,” “predicts,” “estimates,” “aims,” “believes,” “hopes,” “potential” or similar words. Forward- looking statements are not guarantees of future performance, are based on certain assumptions and are subject to various known and unknown risks and uncertainties, many of which are beyond the Company’s control, and cannot be predicted or quantified and consequently, actual results may differ materially from those expressed or implied by such forward-looking statements. Such risks and uncertainties include, without limitation, risks and uncertainties associated with (i) market conditions and the Company’s intended use of proceeds, (ii) the geographic, social and economic impact of COVID-19 on our ability to conduct our business and raise capital in the future when needed, (iii) our inability to manufacture our products and product candidates on a commercial scale on our own, or in collaboration with third parties; (iv) difficulties in obtaining financing on commercially reasonable terms; (v) changes in the size and nature of our competition; (vi) loss of one or more key executives or scientists; and (vii) difficulties in securing regulatory approval to market our products and product candidates. More detailed information about the Company and the risk factors that may affect the realization of forward-looking statements is set forth in the Company’s filings with the Securities and Exchange Commission (SEC), including the Company’s Annual Report on Form 10-K and its Quarterly Reports on Form 10-Q. Investors and security holders are urged to read these documents free of charge on the SEC’s website at http://www.sec.gov. The Company assumes no obligation to publicly update or revise its forward-looking statements as a result of new information, future events or otherwise.

1 Global Market Insights Inc. March 08, 2022.

Andrew Ballou

BioSig Technologies, Inc.

Vice President, Investor Relations

55 Greens Farms Road, 1st Floor

Westport, CT 06880

aballou@biosigtech.com

203-409-5444, x133

Source: BioSig Technologies, Inc.

Released October 24, 2022

Release – FAT Brands Inc. Announces Redemption of $43.2 Million of Series B Cumulative Preferred Stock at $23.69 Per Share

Research, News, and Market Data on FAT

OCTOBER 24, 2022

LOS ANGELES, Oct. 24, 2022 (GLOBE NEWSWIRE) — FAT (Fresh. Authentic. Tasty.) Brands Inc. (NASDAQ: FAT) (“FAT Brands” or the “Company”), a leading global franchising company and parent company of iconic brands including Round Table Pizza, Fatburger, Johnny Rockets, Twin Peaks, Fazoli’s and 12 other restaurant concepts, today announced the redemption of 1,821,831 shares of its 8.25% Series B Cumulative Preferred Stock (NASDAQ: FATBP) from an affiliate of Garnett Station Partners, for $43.2 million.

The shares of Series B Preferred Stock were redeemed at a price of $23.69 per share plus accrued and unpaid dividends to the date of redemption.

“The redemption of this Tranche of Series B Preferred Stock will yield significant cash flow savings for FAT Brands as our securitization facility, which funded the transaction, has a lower cost of capital than the effective dividend rate on the redeemed preferred stock,” noted Andy Wiederhorn, CEO of FAT Brands.

About FAT (Fresh. Authentic. Tasty.) Brands

FAT Brands (NASDAQ: FAT) is a leading global franchising company that strategically acquires, markets, and develops fast casual, quick-service, casual dining, and polished casual dining concepts around the world. The Company currently owns 17 restaurant brands: Round Table Pizza, Fatburger, Marble Slab Creamery, Johnny Rockets, Fazoli’s, Twin Peaks, Great American Cookies, Hot Dog on a Stick, Buffalo’s Cafe & Express, Hurricane Grill & Wings, Pretzelmaker, Elevation Burger, Native Grill & Wings, Yalla Mediterranean and Ponderosa and Bonanza Steakhouses, and franchises and owns over 2,300 units worldwide. For more information on FAT Brands, please visit www.fatbrands.com.

Forward Looking Statements

This press release contains forward-looking statements within the meaning of the Private Securities Litigation Reform Act of 1995. Forward-looking statements reflect expectations of FAT Brands Inc. (“we”, “our” or the “Company”) concerning the future and are subject to significant business, economic and competitive risks, uncertainties and contingencies, including but not limited to uncertainties surrounding the severity, duration and effects of the COVID-19 pandemic. These factors are difficult to predict and beyond our control, and could cause our actual results to differ materially from those expressed or implied in such forward-looking statements. We refer you to the documents that we file from time to time with the Securities and Exchange Commission, such as our reports on Form 10-K, Form 10-Q and Form 8-K, for a discussion of these and other factors. We undertake no obligation to update any forward-looking statement to reflect events or circumstances occurring after the date of this press release.

Investor Relations:
ICR
Michelle Michalski
IR-FATBrands@icrinc.com
646-277-1224

Media Relations:

Erin Mandzik
emandzik@fatbrands.com
860-212-6509

FAT Brands Inc. (FAT) – Third Quarter Results


Monday, October 24, 2022

FAT Brands (NASDAQ: FAT) is a leading global franchising company that strategically acquires, markets, and develops fast casual, quick-service, casual dining, and polished casual dining concepts around the world. The Company currently owns 17 restaurant brands: Round Table Pizza, Fatburger, Marble Slab Creamery, Johnny Rockets, Fazoli’s, Twin Peaks, Great American Cookies, Hot Dog on a Stick, Buffalo’s Cafe & Express, Hurricane Grill & Wings, Pretzelmaker, Elevation Burger, Native Grill & Wings, Yalla Mediterranean and Ponderosa and Bonanza Steakhouses, and franchises and owns over 2,300 units worldwide. For more information on FAT Brands, please visit www.fatbrands.com.

Joe Gomes, Senior Research Analyst, Noble Capital Markets, Inc.

Joshua Zoepfel, Research Associate, Noble Capital Markets, Inc.

Refer to the full report for the price target, fundamental analysis, and rating.

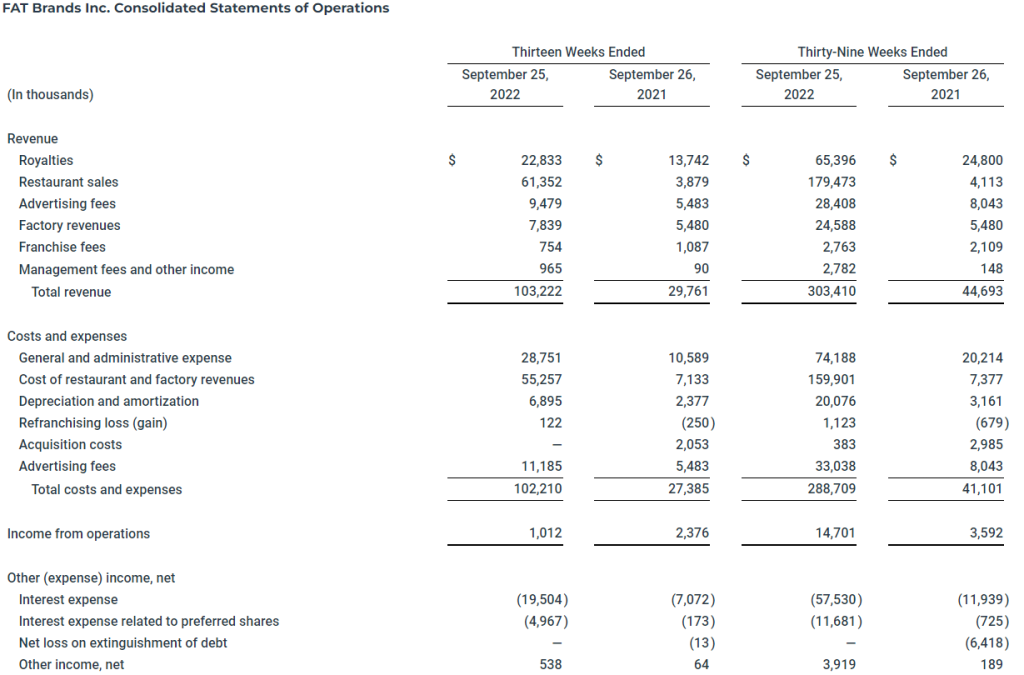
3Q22 Results. FAT Brands reported 3Q22 revenue of $103.2 million, up from $102.8 million in the second quarter, and compared with $29.8 million in 3Q21. The increased revenue reflects the 2021 acquisitions. FAT reported adjusted EBITDA of $24.6 million in the quarter, down from $29.5 million in 2Q22. Net loss for the quarter was $23.5 million, or $1.42 per share and adjusted net loss was $16.3 million, or $0.98 per share. We had projected revenue of $104.3 million and a net loss of $14.9 million, or $0.90 per share.

Expanding Organic Growth Opportunities. FAT reported another 38 restaurants opened in the third quarter with over 100 opened year-to-date. Management is expecting an additional 25 units to open in 4Q22. The pipeline now exceeds 1,000 units, which will add some $60 million of incremental adjusted EBITDA once opened.


Get the Full Report

This Company Sponsored Research is provided by Noble Capital Markets, Inc., a FINRA and S.E.C. registered broker-dealer (B/D).

*Analyst certification and important disclosures included in the full report. NOTE: investment decisions should not be based upon the content of this research summary. Proper due diligence is required before making any investment decision. 

Your Genome is Partially Built by Ancient Viruses

Image: Plum Island (USDA – Public Domain)

Humans are 8% Virus – How the Ancient Viral DNA in Your Genome Plays a Role in Human Disease and Development

HERVs, or human endogenous retroviruses, make up around 8% of the human genome, left behind as a result of infections that humanity’s primate ancestors suffered millions of years ago. They became part of the human genome due to how they replicate.

Like modern HIV, these ancient retroviruses had to insert their genetic material into their host’s genome to replicate. Usually this kind of viral genetic material isn’t passed down from generation to generation. But some ancient retroviruses gained the ability to infect germ cells, such as egg or sperm, that do pass their DNA down to future generations. By targeting germ cells, these retroviruses became incorporated into human ancestral genomes over the course of millions of years and may have implications for how researchers screen and test for diseases today.

Active Viral Genes in the Human Genome

Viruses insert their genomes into their hosts in the form of a provirus. There are around 30 different kinds of human endogenous retroviruses in people today, amounting to over 60,000 proviruses in the human genome. They demonstrate the long history of the many pandemics humanity has been subjected to over the course of evolution. Scientists think these viruses once widely infected the population, since they have become fixed in not only the human genome but also in chimpanzee, gorilla and other primate genomes.

This article was republished with permission from The Conversation, a news site dedicated to sharing ideas from academic experts. It represents the research-based findings and thoughts of Seth Blumsack, Professor of Energy and Environmental Economics and International Affairs, Penn State and Aidan Burn, PhD Candidate in Genetics, Tufts University.

Research from our lab and others has demonstrated that HERV genes are active in diseased tissue, such as tumors, as well as during human embryonic development. But how active HERV genes are in healthy tissue was still largely unknown.

To answer this question, our lab decided to focus on one group of HERVs known as HML-2. This group is the most recently active of the HERVs, having gone extinct less than 5 million years ago. Even now, some of its proviruses within the human genome still retain the ability to make viral proteins.

We examined the genetic material in a database containing over 14,000 donated tissue samples from all across the body. We looked for sequences that matched each HML-2 provirus in the genome and found 37 different HML-2 proviruses that were still active. All 54 tissue samples we analyzed had some evidence of activity of one or more of these proviruses. Furthermore, each tissue sample also contained genetic material from at least one provirus that could still produce viral proteins.

The Role of HERVs in Human Health and Disease

The fact that thousands of pieces of ancient viruses still exist in the human genome and can even create protein has drawn a considerable amount of attention from researchers, particularly since related viruses still active today can cause breast cancer and AIDS-like disease in animals.

Whether the genetic remnants of human endogenous retroviruses can cause disease in people is still under study. Researchers have spotted virus-like particles from HML-2 in cancer cells, and the presence of HERV genetic material in diseased tissue has been associated with conditions such as Lou Gehrig’s disease, or amyotrophic lateral sclerosis, as well as multiple sclerosis and even schizophrenia.

Our study adds a new angle to this data by showing that HERV genes are present even in healthy tissue. This means that the presence of HERV RNA may not be enough to connect the virus to a disease.

Importantly, it also means that HERV genes or proteins may no longer be good targets for drugs. HERVs have been explored as a target for a number of potential drugs, including antiretroviral medication, antibodies for breast cancer and T-cell therapies for melanoma. Treatments using HERV genes as a cancer biomarker will also need to take into account their activity in healthy tissue.

On the other hand, our research also suggests that HERVs could even be beneficial to people. The most famous HERV embedded in human and animal genomes, syncytin, is a gene derived from an ancient retrovirus that plays an important role in the formation of the placenta. Pregnancy in all mammals is dependent on the virus-derived protein coded in this gene.

Similarly, mice, cats and sheep also found a way to use endogenous retroviruses to protect themselves against the original ancient virus that created them. While these embedded viral genes are unable to use their host’s machinery to create a full virus, enough of their damaged pieces circulate in the body to interfere with the replication cycle of their ancestral virus if the host encounters it. Scientists theorize that one HERV may have played this protective role in people millions of years ago. Our study highlights a few more HERVs that could have been claimed or co-opted by the human body much more recently for this same purpose.

Unknowns Remain

Our research reveals a level of HERV activity in the human body that was previously unknown, raising as many questions as it answered.

There is still much to learn about the ancient viruses that linger in the human genome, including whether their presence is beneficial and what mechanism drives their activity. Seeing if any of these genes are actually made into proteins will also be important.

Answering these questions could reveal previously unknown functions for these ancient viral genes and better help researchers understand how the human body reacts to evolution alongside these vestiges of ancient pandemics.

The Coming Market Hiccups, What’s Your Strategy?

Image Credit: Mateusz Dach(Pexels)

Planning for a Changing Market Environment is Not Without Risks

There are two upcoming events, one scheduled and one not. They each have the potential and perhaps are even likely, to jolt or shift financial markets for a period longer than the ordinary disruptions traders and investors experience over the course of any month. These two items are the U.S. elections, which are approaching quickly, and a resolution of the Russia and Ukraine war.

Mid-Terms

On the U.S. side of the Atlantic, the mid-term election is thought of as a referendum on the person in the Oval Office and their party. The democrats who are in power in both legislative branches and also hold the executive branch are likely to lose the House and perhaps the Senate. The gridlock that would unfold if this occurs would include many government spending plans that have helped drive some investment sectors since January 2021. However, the party currently controlling both are viewed by many market participants as not “Wall Street-friendly,” so this could also weigh into market direction. And just as critical for investors, it would have the ability to shift which sectors are winners and which investments one may wish to lighten up in.

European War

In Europe, the war means a lot of things to those that live there. Focusing only from a global investor standpoint, one’s mind first turns to the energy sector. If the outcome is one where Russia largely has its way and annexes a large portion of Ukraine, how long would it take for normalcy to resume? And what would that look like? If, instead, Putin, who is leading the charge, loses power or his resolve, what would this mean for stocks, commodity prices, and overall investor mood? Should investors pre-think all scenarios and have a plan for each?

What Investment Experts Say

Channelchek spoke to a couple of highly respected, highly credentialed money managers and investment experts and asked about pre-planning.

Eric Lutton, CFA is Chief Investment Officer, at Sound Income Strategies. Eric doesn’t expect Putin to be removed, but cautions that if he is, depending on what follows, it may not automatically be good for markets. He said, “If Putin was “pushed” out of power,  a highly unlikely scenario, but if it were to happen, it would mean more unknowns for the market, which would probably be taken as another negative.” Lutton, who has spent a great deal of time in Russia and Northern Europe, explains,  “A vacuum of power in Russia would not be a good thing and could escalate the current situation.” Eric believes if a leader chosen by the West was installed, “inflation would fall, and the Fed could ease up on the rate increases.” Lutton does not think that is a scenario we will see any time soon.

The Sound Income Strategies CIO thinks the media overplays any real risk of Putin dropping a nuclear device so close to Russia on land it seeks to annex. But he did entertain the thought, as I pressured him for hypothetical scenario analysis and investment planning thoughts. “As for investors, if a bomb falls, either Putin or a false flag operation, you’d want to be in 100% cash! No place would be safe other than perhaps a handful of industrial defense or war contractors,” Said Eric Lutton.

As it relates to the November 8th mid-term elections, Eric Lutton isn’t expecting a huge “red wave” win. He points to the notion that there are people that would avoid voting red even if it was clear that the policies would better serve the populace.   Eric does, however expect Republicans to gain a majority in the House and Senate. Even if they only gain a majority in one branch, Lutton says, “I do think there will be a slight pop in the market, but short-lived as the main factors will be the Fed, inflation, supply chain and ongoing conflict in Ukraine.”

Robert Johnson, PhD, CFA, CAIA, is the CEO and Chair at Economic Index Associates. He apologetically offered conventional wisdom, suggesting that it could be a mistake for investors to, “…concern themselves with broad market moves or the crisis du jour.” Johnson, instead, recommends more tried and true portfolio implementation. This includes suggesting the creation of an Investment Policy Statement (IPS). Dr. Johnson explains that clearly defining, in advance, and in accordance with one’s time horizon and other specifics, such as liquidity needs and tax situation, will define the ground rules necessary during temporary hiccups in the market.

As it relates to a personal investment policy statement, the Chair of Economic Index Associates says it is best to develop a policy statement in calm, less volatile markets. He says’ “The whole point of an IPS is to guide you through changing market conditions. It should not be changed as a result of market fluctuations.” He did allow for individual changes in circumstances,” It only needs to be revised when your individual circumstances change — perhaps a divorce or other unanticipated life change.”

As added testimony to what Dr. Johnson knew was less than groundbreaking thoughts on the subject of the two future events and what to do in each, he offered, “ I had a former co-worker who, in the run-up to the 2016 election, was convinced that Hillary Clinton was going to win and the stock market was going to crash. So, immediately prior to the election, he sold out of stocks and went to cash. Stocks surged the day following Trump’s victory, and my co-worker bought back into the market — at a higher price.”

Take-Away

Market hiccups are often short-lived.

While it is prudent to keep your eyes open and know what risks and potential rewards may be, it may also be smart to keep investing within specific boundaries. Those boundaries are best defined when volatility and predictability are average. Within the boundaries, there can be room to lighten up or overweight, but not in ways that pull the investor substantially out of line with their original goal while using the predefined arsenal of stocks, bonds, or other financial products.

Paul Hoffman

Managing Editor, Channelchek

Sources

Eric Lutton, CFA

Robert Johnson, CFA

The Week Ahead – Fed Muzzled on Rate Talk, Third Quarter Growth, Earnings

If the U.S. Was in a Recession, This Week’s Numbers May Show It Has grown Out of It

A big focus of traders this week will be positioning for the FOMC meeting next week and its announcement on Wednesday, November 2nd. Members of the committee that have commented in recent weeks have left little doubt that the Federal Reserve’s fight against inflation is continuing, and a 75 bp hike can be expected. Additional comments on monetary policy from Fed governors aren’t expected this week as there is a communications blackout period in effect (midnight Saturday, October 22nd through midnight Thursday, October 27th).

There will be global interest rate commotion as more rate hikes outside the U.S. are likely. The first is on Wednesday by the Bank of Canada, followed on Thursday by the European Central Bank. The forecast consensus for each is 75bp upward.

The conversation on Thursday may move from “is the U.S. going into a recession to, has the U.S. just come out of a recession?” While the first two-quarters of receding growth have never officially been declared a recession, the first look at GDP for the third quarter is out on Thursday, and it is expected to show growth during the quarter. If this occurs markets, the stock market could trade, either way, a sigh of relief that the economy is growing or fear that the Fed now has the room it needs to keep applying the interest rate brakes.

What’s on Tap for investors:

Monday 10/24

•             At 9:45 AM Purchasing Managers Index (PMI) flash report will be released. Expectations are for the number to come in around 51.2. This leading indicator of economic activity is an early estimate of private sector output. It contains information from surveys of around 1,000 manufacturing and service sector companies. The flash data are released ten days ahead of the final report and are based on 85 percent of the full survey.

Tuesday 10/25

•             At 10:00 AM, the Consumer Confidence survey will be released. Expectations are for a decline of 2.0 points to 106.0 in October, this would be after it exceeded expectations in September and August.

•             At  10 AM, the  Richmond Fed Manufacturing Index will be reported. The consensus is -3. Last month the report came in at 0.0, which was above the consensus estimates. The headline index number is a composite of the new orders, shipments, and employment indexes in the Richmond Fed’s manufacturing sector. It provides insight into the state of the manufacturing sector.

•             At 1 PM, U.S. Money Supply is released for September. During August M2 rose by $1.8 billion.

•             Noble Capital Markets will host a roadshow in St. Louis with Harte Hanks (HHS). Qualified Investors of all levels, including registered representatives, are welcome to attend at no cost, and with no obligation to invest. More information here.

Wednesday 10/26

•             At 8:30 AM, International Trade in Goods (advance) will be reported. The consensus is for a U.S. trade deficit of 87.8 billion. This would represent a widening of more dollars spent purchasing goods from abroad than goods purchased from the U.S. The numbers may offer insight into the impact that the strong dollar has had on reducing demand for U.S.-made products.

•             At 8:30 AM, Wholesale Inventories (Advance) for September are expected to have shown an increase of 1.1%. If inventories are growing fast relative to GDP, then both production and employment may have to slow down the road. And if inventories are lagging behind growth, there may be an undersupply to be made up for later.

•             At 10:00 PM, New Home Sales are expected to show a rate of 585 thousand during September. This number surprised to the upside the previous period. The report is important to those trading securities as it indicates economic momentum, future demand for goods, and confidence in the ability to afford a big expense. New home sales multiply through other areas of the economy as new homeowners set their homes with furniture, appliances, and services.

Thursday 10/27

•             At 8:30 AM, investors will get their first look at GDP for the third quarter. The number is supposed to show the first sign of growth in 2022. Consensus expectations are for growth of 2.3% during the third quarter. Stock market investors may wrestle with whether the good news is bad news or bad news is good news as the market finds a direction after this report and ahead of a rate decision the following week.

•             At 8:30 AM, Durable Goods Orders are released. The consensus is for a .6% increase in the headline number and .2% ex-transportation. Durable goods are new orders placed with U.S. manufacturers for factory hard goods. The report also contains information on shipments, unfilled orders, and inventories. Investors get insight into how busy factories will be in the coming months. This is a leading indicator with direct implications for economic growth

•             At 8:30 AM Jobless Claims are reported for the week ending 10/22/22. The expectations are for there to be 223,000 new claims. Surprises on one side or the other are important as healthy employment is one the Federal Reserve mandates.

•             At 10:30 AM, The U.S. Energy Information Administration (EIA) releases its weekly report on natural gas. Energy supply and demand balance impact prices of fuel that can ripple through the entire economy.

Friday 10/28

•             At 8:30 AM, Personal Income and Outlays are reported. This report includes the PCE Price index that is considered to be the Feds preferred inflation indicator. The consensus for Personal Income is +.3%. The consensus for the PCE gauge is +.3% which would equate to a year-over-year inflation rate of +6.3%.

•             At 10:00 AM, Consumer Sentiment is expected to come in at 59.7; the previous month the number reported was 59.8. Consumer spending accounts for 66% of the economy. Consumer appetite is a big influencer on investments. For stocks, strong economic growth translates to healthy corporate profits and higher stock prices. For bonds, the focus is whether economic growth goes overboard and leads to inflation.

What Else

It’s earnings season, and big market moves can occur should closely watch names miss their expected earnings numbers. On Tuesday this could include GE, Microsoft, and GM. Wednesday Ford reports, Thursday MacDonalds, Merck, Mastercard, and U.S. Steel. On Friday Exxon and Alliance Bernstein will make public their third quarter earnings.

Paul Hoffman

Managing Editor, Channelchek

Sources

https://us.econoday.com/byweek.asp?cust=us&lid=0

www.EIA.gov

New Home Size as a Leading Indicator for Recession

Image Credit: Tannert11 (Flickr)

Housing Is Getting Less Affordable. Governments Are Making It Worse

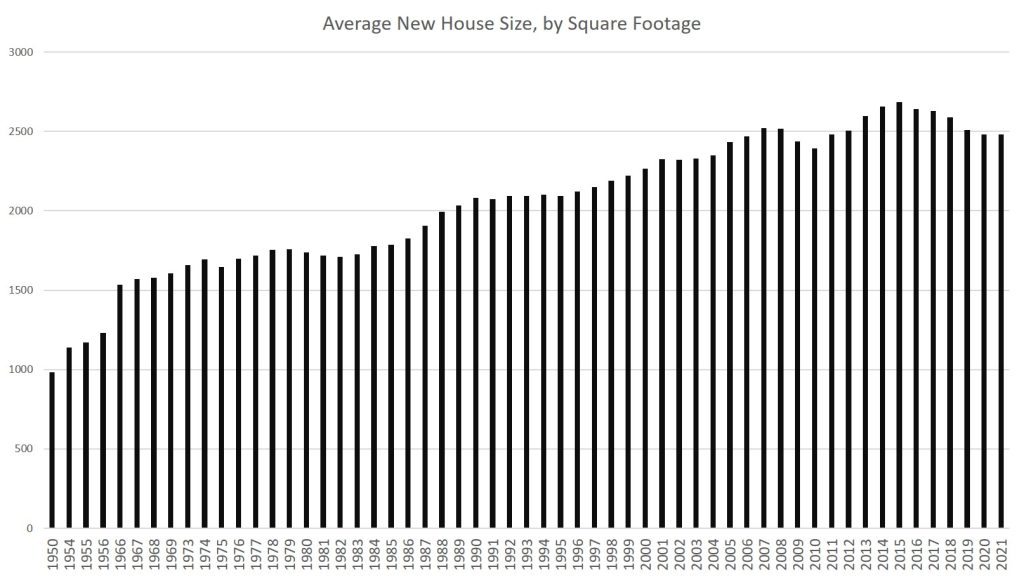
The average square footage in new single-family houses has been declining since 2015. House sizes tend to fall just during recessionary periods. It happened from 2008 to 2009, from 2001 to 2002, and from 1990 to 1991.

But even with strong economic-growth numbers well into 2019, it looks like demand for houses of historically large size may have finally peaked even before the 2020 recession and our current economic malaise.  (Square footage in new multifamily construction has also increased.)

According to Census Bureau data, the average size of new houses in 2021 was 2,480 square feet. That’s down 7 percent from the 2015 peak of 2,687.

2015’s average, by the way, was an all-time high and represented decades of near-relentless growth in house sizes in the United States since the Second World War. Indeed, in the 48 years from 1973 to 2015, the average size of new houses increased by 62 percent from 1,660 to 2,687 square feet. At the same time, the quality of housing also increased substantially in everything from insulation, to roofing materials, to windows, and to the size and availability of garages.

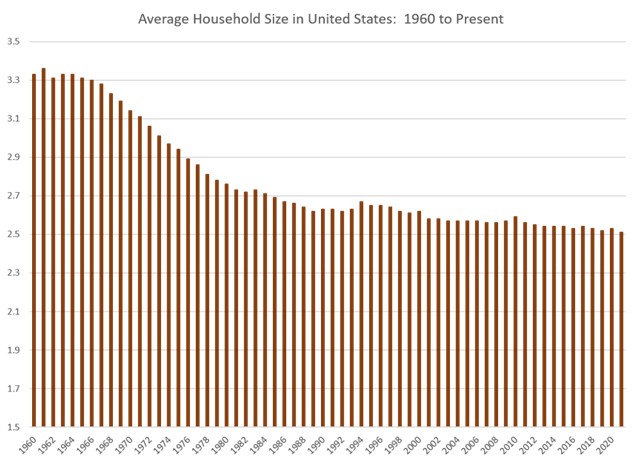
Meanwhile, the size of American households during this period decreased 16 percent from 3.01 to 2.51 people.

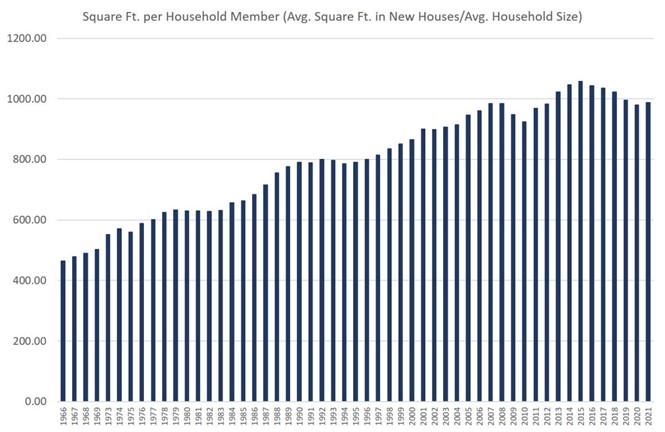
Yet, even with that 7 percent decline in house size since 2015, the average new home in America as of 2021 was still well over 50 percent larger than they were in the 1960s. Home size isn’t exactly falling off a cliff. US homes, on a square-foot-per-person basis, remain quite large by historical standards. Since 1973, square footage per person in new houses has nearly doubled, rising from 503 square feet per person in 1973 to 988 square feet person in 2021. By this measure, new house size actually increased from 2020 to 2021.

This continued drive upward in new home size can be attributed in part to the persistence of easy money over the past decade. Even as homes continued to stay big—and thus stay comparatively expensive—it was not difficult to find buyers for them. Continually falling mortgage rates to historical lows below even 3 percent in many cases meant buyers could simply borrow more money to buy big houses.

But we may have finally hit the wall on home size. In recent months we’re finally starting to see evidence of falling home sales and falling home prices. It’s only now, with mortgage rates surging, inflation soaring, and real wages falling—and thus home price affordability falling—that there are now good reasons for builders to think “wow, maybe we need to build some smaller, less costly homes.”  There are many reasons to think that they won’t, and that for-purchase homes will simply become less affordable. But it’s not the fault of the builders.

This wouldn’t be a problem in a mostly-free market in which builders could easily adjust their products to meet the market where it’s at. In a flexible and generally free market, builders would flock to build homes at a price level at which a large segment of the population could afford to buy those houses.  But that’s not the sort of economy we live in. Rather, real estate and housing development are highly regulated industries at both the federal level and at the local level. Thanks to this, it is becoming more and more difficult for builders to build smaller houses at a time when millions of potential first-time home buyers would gladly snatch them up.

How Government Policy Led to a Codification of Larger, More Expensive Houses

In recent decades, local governments have continued to ratchet up mandates as to how many units can be built per acre, and what size those new houses can be. As The Washington Post reported in 2019, various government regulations and fees, such as “impact fees,” which are the same regardless of the size of the unit, “incentivize developers to build big.” The Post continues, “if zoning allows no more than two units per acre, the incentive will be to build the biggest, most expensive units possible.”

Moreover, community groups opposed to anything that sounds like “density” or “upzoning” will use the power of local governments to crush developer attempts to build more affordable housing. However, as The Post notes, at least one developer has found “where his firm has been able to encourage cities to allow smaller buildings the demand has been strong. For those building small, demand doesn’t seem to be an issue.”

Similarly, in an article last month at The New York Times, Emily Badger notes the central role of government regulations in keeping houses big and ultimately increasingly unaffordable. She writes how in recent decades,

“Land grew more expensive. But communities didn’t respond by allowing housing on smaller pieces of it. They broadly did the opposite, ratcheting up rules that ensured builders couldn’t construct smaller, more affordable homes. They required pricier materials and minimum home sizes. They wanted architectural flourishes, not flat facades. …”

It is true that in many places empty land has increased in price, but in areas where the regulatory burden is relatively low—such as Houston—builders have nonetheless responded with more building of housing such as townhouses.

In many places, however, regulations continue to push up the prices of homes.

Badger notes that in Portland, Oregon, for example, “Permits add $40,000-$50,000. Removing a fir tree 36 inches in diameter costs another $16,000 in fees.” A lack of small “starter homes” is not due to an unwillingness on the part of builders. Governments have simply made smaller home unprofitable.

“You’ve basically regulated me out of anything remotely on the affordable side,” said Justin Wood, the owner of Fish Construction NW.

In Savannah, Ga., Jerry Konter began building three-bed, two-bath, 1,350-square-foot homes in 1977 for $36,500. But he moved upmarket as costs and design mandates pushed him there.

“It’s not that I don’t want to build entry-level homes,” said Mr. Konter, the chairman of the National Association of Home Builders. “It’s that I can’t produce one that I can make a profit on and sell to that potential purchaser.”

Those familiar with how local governments zone land and set building standards will not be surprised by this. Local governments, pressured by local homeowners, will intervene to keep lot sizes large, and to pass ordinances that keep out housing that might be seen by voters as “too dense” or “too cheap-looking.”

Yet, as much as existing homeowners and city planners would love to see nothing but upper middle-class housing with three-car garages along every street, the fact is that not everyone can afford this sort of housing. But that doesn’t mean people in the middle can only afford a shack in a shanty town either — so long as governments will allow more basic housing to be built.

But there are few signs of many local governments relenting on their exclusionary housing policies, and the result has been an ossified housing policy designed to reinforce existing housing, while denying new types of housing that is perhaps more suitable to smaller households and a more stagnant economic environment.

Eventually, though, something has to give. Either governments persist indefinitely with restrictions on “undesirable” housing — which means housing costs skyrocket — or local governments finally start to allow builders to build housing more appropriate to the needs of the middle class.

If current trends continue, we may finally see real pressure to get local governments to allow more building of more affordable single-family homes, or duplexes, or townhouses. If interest rates continue to march upward, this need will become only more urgent. Moreover, as homebuilding materials continue to become more expensive thanks to 40-year highs in inflation—thanks to the Federal Reserve—there will be even more need to find ways to cut regulatory costs in other areas.

For now, the results have been spotty. But where developers are allowed to actually build for a middle-class clientele, it looks like there’s plenty of demand.

About the Author

Ryan McMaken (@ryanmcmaken) is a senior editor at the Mises Institute. Ryan has a bachelor’s degree in economics and a master’s degree in public policy and international relations from the University of Colorado. He is the author of Breaking Away: The Case for Secession, Radical Decentralization, and Smaller Polities (forthcoming) and Commie Cowboys: The Bourgeoisie and the Nation-State in the Western Genre. He was a housing economist for the State of Colorado. 

Release – Fat brands Inc. Reports third quarter 2022 financial results

Research, News, and Market Data on FAT

Fat brands inc. Reports third quarter 2022 financial results

OCTOBER 20, 2022

Conference call and webcast today at 5:00 p.m. ET

LOS ANGELES, Oct. 20, 2022 (GLOBE NEWSWIRE) — FAT (Fresh. Authentic. Tasty.) Brands Inc. (NASDAQ: FAT) (“FAT Brands” or the “Company”) today reported fiscal third quarter 2022 financial results for the 13-week period ending September 25, 2022.

Andy Wiederhorn, President and CEO of FAT Brands, commented, “We are impressed with the strong performance FAT Brands experienced in the third quarter as evidenced by our robust unit development and profitable revenue growth. Our sales resilience is a testament to our diverse portfolio of brands with average checks ranging from approximately $8 to $37.”

“Our organic growth strategy remains strong with 38 store openings in the third quarter. This week, we are set to surpass 100 openings for the year and remain on track to open 125 new restaurants in 2022, a new milestone for FAT Brands. Looking ahead to 2023, we plan to continue this robust unit growth with over 130 units slated to open. Additionally, during the third quarter, we signed 180 new franchise agreements bringing our total pipeline to over 1,000 new locations which is expected to represent a 60% increase in EBITDA over the next several years.”

“We are also extremely impressed with how our 2021 acquisitions have seamlessly fit into our portfolio and the demand we are experiencing for them from our franchisee base. We will continue to evaluate strategic acquisitions, particularly, brands that fit within our current operations that have a proven track record of long-term, sustainable and profitable operating performance or that provide us with the opportunity to expand our factory business.”

“We also continue to work on reducing our cost of capital. To that end, we expect to redeem shares of our Series B Cumulative Preferred Stock in the coming weeks. This will yield significant cash flow savings as our securitization facility, which will fund the transaction, has a lower cost of capital than the preferred share dividend rate.”

Fiscal Third Quarter 2022 Highlights

  • Total revenue improved 247% to $103.2 million compared to $29.8 million in the third quarter of 2021
    • System-wide sales growth of 57% in the third quarter of 2022 compared to the prior year quarter
    • Year-to-date system-wide same-store sales growth of 7.0% in the third quarter of 2022 compared to the prior year
    • 38 new store openings during the third quarter of 2022
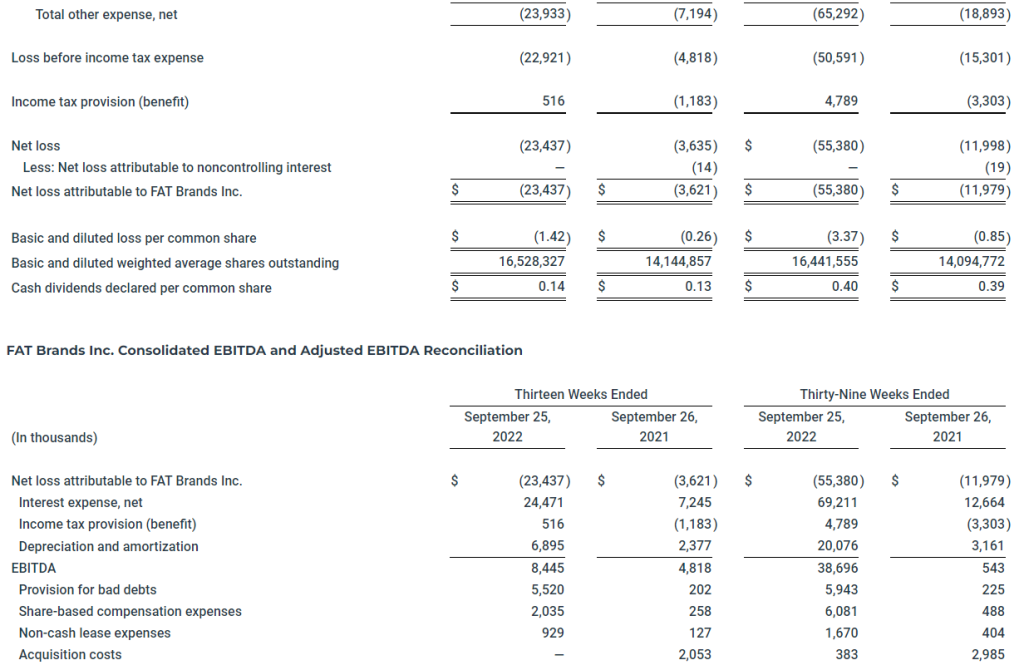
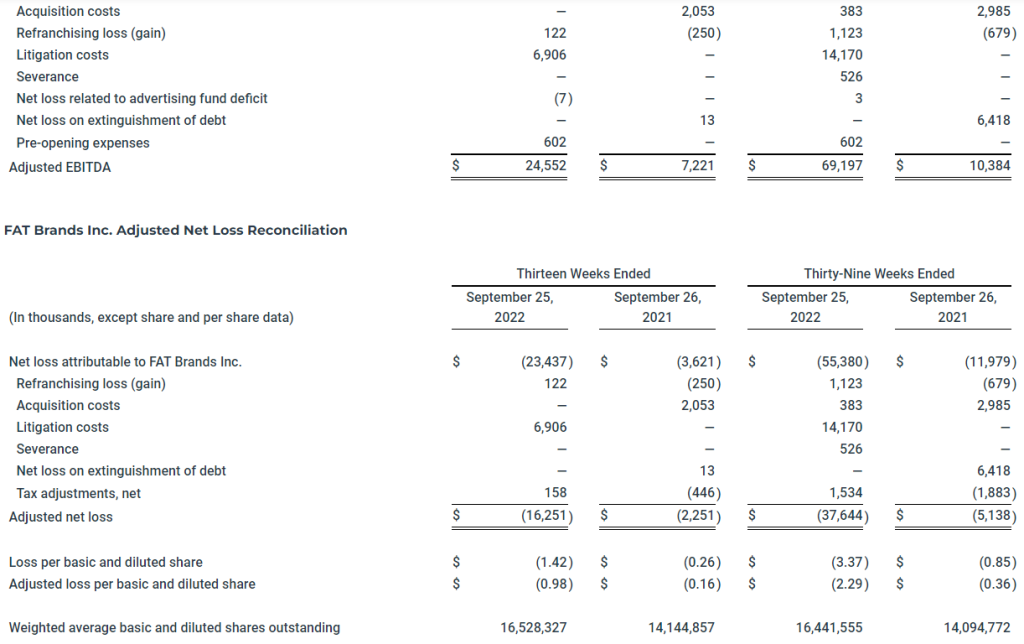
  • Net loss of $23.4 million, or $1.42 per diluted share, compared to $3.6 million, or $0.26 per diluted share, in the third quarter of 2021
  • Adjusted EBITDA(1) of $24.6 million compared to $7.2 million in the third quarter of 2021
  • Adjusted net loss(1) of $16.3 million, or $0.98 per diluted share, compared to $2.3 million, or $0.16 per diluted share, in the third quarter of 2021

(1)   EBITDA, Adjusted EBITDA and adjusted net loss are non-GAAP measures defined below, under “Non-GAAP Measures”. Reconciliation of GAAP net loss to EBITDA, adjusted EBITDA and adjusted net loss are included in the accompanying financial tables.

Summary of Third Quarter 2022 Financial Results

Total revenue increased $73.5 million, or 247%, in the third quarter of 2022, to $103.2 million compared to $29.8 million in the same period of 2021. The increase reflects revenue from the acquisition of Global Franchise Group in July 2021, the acquisition of Twin Peaks in October 2021, the acquisitions of Fazoli’s and Native Grill & Wings in December 2021 (collectively, the “2021 Acquisitions”) and the continuing recovery from the negative effects of the COVID-19 pandemic on royalties from restaurant sales.

Costs and expenses increased $74.8 million, or 273%, in the third quarter of 2022 to $102.2 million compared to the same period in the prior year, primarily due to the 2021 Acquisitions.

General and administrative expense increased $18.2 million, or 172%, in the third quarter of 2022 compared to the same period in the prior year, primarily due to the 2021 Acquisitions, increased compensation costs, professional fees related to pending litigation and government investigations, and travel, reflecting the significant expansion of the organization.

Cost of restaurant and factory revenues totaled $55.3 million in the third quarter of 2022 and was related to the operations of the company-owned restaurant locations and the dough factory operated by Global Franchise Group associated with the 2021 Acquisitions.

Depreciation and amortization increased $4.5 million, or 190% in the third quarter of 2022 compared to the same period in the prior year, primarily due to depreciation of company-owned restaurant property and equipment and amortizing intangible assets related to the 2021 Acquisitions.

Refranchising losses in the third quarter of 2022 were $0.1 million and were comprised of restaurant costs and expenses, net of food sales. Refranchising gains in the third quarter of 2021 were $0.3 million and were comprised of $0.5 million in net gains related to refranchised restaurants, partially offset by $0.2 million in restaurant operating costs, net of food sales.

Advertising expenses increased $5.7 million in the third quarter of 2022 compared to the prior year period. These expenses vary in relation to advertising revenues and reflect advertising expenses related to the 2021 Acquisitions and the increase in customer activity as the recovery from COVID continues.

Total other expense, net for the third quarters of 2022 and 2021 was $23.9 million and $7.2 million, respectively, primarily comprised of net interest expense of $24.5 million and $7.2 million, respectively.

Adjusted net loss was $16.3 million, or $0.98 per diluted share, in the third quarter of 2022 compared to $2.3 million, or $0.16 per diluted share, in the third quarter of 2021.

Key Financial Definitions

New store openings – The number of new store openings reflects the number of stores opened during a particular reporting period. The total number of new stores per reporting period and the timing of stores openings has, and will continue to have, an impact on our results.

Same-store sales growth – Same-store sales growth reflects the change in year-over-year sales for the comparable store base, which we define as the number of stores open and in the FAT Brands system for at least one full fiscal year. For stores that were temporarily closed, sales in the current and prior period are adjusted accordingly. Given our focused marketing efforts and public excitement surrounding each opening, new stores often experience an initial start-up period with considerably higher than average sales volumes, which subsequently decrease to stabilized levels after three to six months. Additionally, when we acquire a brand, it may take several months to integrate fully each location of said brand into the FAT Brands platform. Thus, we do not include stores in the comparable base until they have been open and in the FAT Brands system for at least one full fiscal year. For 2022, the comparable store base does not include concepts acquired during fiscal 2021.

System-wide sales growth – System wide sales growth reflects the percentage change in sales in any given fiscal period compared to the prior fiscal period for all stores in that brand only when the brand is owned by FAT Brands. Because of acquisitions, new store openings and store closures, the stores open throughout both fiscal periods being compared may be different from period to period.

Conference Call and Webcast

FAT Brands will host a conference call and webcast to discuss its fiscal third quarter 2022 financial results today at 5:00 PM ET. Hosting the conference call and webcast will be Andy Wiederhorn, President and Chief Executive Officer, and Ken Kuick, Chief Financial Officer.

The conference call can be accessed live over the phone by dialing 1-877-704-4453 from the U.S. or 1-201-389-0920 internationally. A replay will be available after the call until Thursday, October 27, 2022, and can be accessed by dialing 1-844-512-2921 from the U.S. or 1-412-317-6671 internationally. The passcode is 13733381. The webcast will be available at www.fatbrands.com under the “Investors” section and will be archived on the site shortly after the call has concluded.

About FAT (Fresh. Authentic. Tasty.) Brands

FAT Brands (NASDAQ: FAT) is a leading global franchising company that strategically acquires, markets, and develops fast casual, quick-service, casual dining, and polished casual dining concepts around the world. The Company currently owns 17 restaurant brands: Round Table Pizza, Fatburger, Marble Slab Creamery, Johnny Rockets, Fazoli’s, Twin Peaks, Great American Cookies, Hot Dog on a Stick, Buffalo’s Cafe & Express, Hurricane Grill & Wings, Pretzelmaker, Elevation Burger, Native Grill & Wings, Yalla Mediterranean and Ponderosa and Bonanza Steakhouses and franchises and owns over 2,300 units worldwide. For more information, please visit www.fatbrands.com.

Forward-Looking Statements

This press release contains forward-looking statements within the meaning of the Private Securities Litigation Reform Act of 1995, including statements relating to the future financial and operating results of the Company, estimates of future EBITDA, the timing and performance of new store openings, our expected redemption of Series B Cumulative Preferred Stock, our ability to conduct future accretive acquisitions, our pipeline of new store locations, and the recovery of our business from the COVID-19 pandemic. Forward-looking statements generally use words such as “expect,” “foresee,” “anticipate,” “believe,” “project,” “should,” “estimate,” “will,” “plans,” “forecast,” and similar expressions, and reflect our expectations concerning the future. Forward-looking statements are subject to significant business, economic and competitive risks, uncertainties and contingencies, many of which are difficult to predict and beyond our control, which could cause our actual results to differ materially from the results expressed or implied in such forward-looking statements. We refer you to the documents that we file from time to time with the Securities and Exchange Commission, such as our reports on Form 10-K, Form 10-Q and Form 8-K, for a discussion of these and other risks and uncertainties that could cause our actual results to differ materially from our current expectations and from the forward-looking statements contained in this press release. We undertake no obligation to update any forward-looking statements to reflect events or circumstances occurring after the date of this press release.

Non-GAAP Measures (Unaudited)

This press release includes the non-GAAP financial measures of EBITDA, adjusted EBITDA and adjusted net loss.

EBITDA is defined as earnings before interest, taxes, and depreciation and amortization. We use the term EBITDA, as opposed to income from operations, as it is widely used by analysts, investors, and other interested parties to evaluate companies in our industry. We believe that EBITDA is an appropriate measure of operating performance because it eliminates the impact of expenses that do not relate to business performance. EBITDA is not a measure of our financial performance or liquidity that is determined in accordance with generally accepted accounting principles (“GAAP”), and should not be considered as an alternative to net income (loss) as a measure of financial performance or cash flows from operations as measures of liquidity, or any other performance measure derived in accordance with GAAP.

Adjusted EBITDA is defined as EBITDA (as defined above), excluding expenses related to acquisitions, refranchising gain or losses, impairment charges, and certain non-recurring or non-cash items that the Company does not believe directly reflect its core operations and may not be indicative of the Company’s recurring business operations.

Adjusted net loss is a supplemental measure of financial performance that is not required by or presented in accordance with GAAP. Adjusted net loss is defined as net loss plus the impact of adjustments and the tax effects of such adjustments. Adjusted net loss is presented because we believe it helps convey supplemental information to investors regarding our performance, excluding the impact of special items that affect the comparability of results in past quarters to expected results in future quarters. Adjusted net loss as presented may not be comparable to other similarly titled measures of other companies, and our presentation of adjusted net loss should not be construed as an inference that our future results will be unaffected by excluded or unusual items. Our management uses this non-GAAP financial measure to analyze changes in our underlying business from quarter to quarter based on comparable financial results.

Reconciliations of net loss attributable to FAT Brands Inc. presented in accordance with GAAP to EBITDA, adjusted EBITDA, and adjusted net loss are set forth in the tables below.

Investor Relations:

ICR
Michelle Michalski
ir-fatbrands@icrinc.com
646-277-1224

Media Relations:

Erin Mandzik
emandzik@fatbrands.com
860-212-6509

(1)     Reflects the tax impact of the adjustments using the effective tax rate for the respective periods

Seanergy Maritime (SHIP) – Model Fine Tuned For Lower Shipping Rates and Higher Interest Rates


Friday, October 21, 2022

Seanergy Maritime Holdings Corp. is the only pure-play Capesize ship-owner publicly listed in the US. Seanergy provides marine dry bulk transportation services through a modern fleet of Capesize vessels. The Company’s operating fleet consists of 17 Capesize vessels with an average age of approximately 12 years and aggregate cargo carrying capacity of approximately 3,011,083 dwt. The Company is incorporated in the Marshall Islands and has executive offices in Glyfada, Greece. The Company’s common shares trade on the Nasdaq Capital Market under the symbol “SHIP” and its Class B warrants under “SHIPZ”.

Michael Heim, CFA, Senior Research Analyst, Noble Capital Markets, Inc.

Refer to the full report for the price target, fundamental analysis, and rating.

We are making adjustments to our models to reflect lower shipping rates. Dry bulk shipping rates have been weak in the third quarter. As a result, we are lowering the assumed rate for uncommitted ships to $19,500/day from $23,650/day. Management guided analysts to a $23,650/day number when reporting second quarter results but now believes the rate will be below $20,000/day. Every $1,000 reduction in uncommitted daily TCE rates reduces net income by $1.1 million or $0.01 per share.

We are also raising our interest expense estimate to reflect higher interest rates. We are raising our third quarter interest expense estimate to $5.0 million from $3.5 million to reflect higher LIBOR rates. LIBOR rates have increased from 0.1% to more than 4.0% in the last twelve months.  We are also formally incorporating the $28 million term loan that was announced last week into our models.


Get the Full Report

This Research is provided by Noble Capital Markets, Inc., a FINRA and S.E.C. registered broker-dealer (B/D).

*Analyst certification and important disclosures included in the full report. NOTE: investment decisions should not be based upon the content of this research summary. Proper due diligence is required before making any investment decision.