China and Japan are actively defending their currencies against the rising US dollar, sparking inflation concerns. Both the yen and yuan have depreciated significantly due to market expectations of prolonged higher interest rates by the US Federal Reserve.
In response, China’s central bank is providing robust guidance through its daily yuan reference rate to prevent excessive weakening. Japan has issued a stern warning against rapid yen depreciation, signaling readiness for intervention.
Despite these efforts, doubts linger about their effectiveness, especially if the Federal Reserve maintains a hawkish stance or China’s economic recovery remains sluggish. The strong US dollar also affects European currencies, with the euro and pound hitting their lowest levels since June, raising concerns of quicker rate cuts by eurozone and UK central banks to counter rising borrowing costs. Investors globally watch closely as central banks and the Federal Reserve navigate these currency dynamics, with potential implications for inflation and future monetary policies.
Pennsylvania instrumentation company AMETEK (NYSE: AME) is expanding its testing and measurement capabilities with the acquisition of United Electronic Industries.
Massachusetts-based UEI is a leader in data acquisition and control solutions for aerospace, defense, energy and semiconductor sectors. Its products enable customers to build robust systems for simulation, monitoring and automated testing.
AMETEK CEO David Zapico expressed excitement about bringing UEI’s innovative solutions into the company’s Power Systems and Instruments division. He said the $35 million deal broadens AMETEK’s presence in attractive markets that complement existing strengths.
UEI will join AMETEK’s Electronic Instruments Group, known for analytical, calibration and display instruments. The acquisition aligns with AMETEK’s growth strategy of targeting niche segments and making strategic buys.
Headquartered near Philadelphia, AMETEK has annual sales over $6 billion globally. The 90-year-old firm focuses on cash flow and capital deployment to drive double-digit earnings growth.
Take a moment to learn about Kratos Defense & Security Solutions, a company that specializes in satellite communications, missile defense, and hypersonic systems.
Western Midstream Partners, LP (NYSE: WES) is set to expand its footprint in the Powder River Basin through the acquisition of Meritage Midstream Services II, LLC (Meritage). This all-cash transaction comes with a price tag of $885 million and is expected to close in the fourth quarter of 2023, subject to regulatory approvals.
Meritage, headquartered in Denver, Colorado, operates a substantial natural gas gathering and processing business in Wyoming’s Powder River Basin. The acquisition will significantly increase WES’s natural gas processing capacity, taking it to 440 MMcf/d. Additionally, it will diversify WES’s customer base with long-term contracts and acreage dedications from reputable counterparties.
The Powder River Basin has attracted considerable investment due to its multi-stacked pay horizon potential, making it an appealing prospect for energy companies. As part of this acquisition, WES aims to enhance its position in the basin and pursue additional acreage dedications and business development opportunities.
Upon completing the transaction, WES anticipates recommending a Base Distribution increase of $0.0125 per unit, providing a potential boost for its investors.
This strategic move represents a significant step for WES in expanding its presence in a region with promising energy prospects.
Shareholders of Digital World Acquisition (DWAC), the investment partner of former President Donald Trump’s media venture, have granted an extension to the company’s merger deadline. This extension allows the special purpose acquisition company (SPAC) more time to complete its long-pending merger with Truth Social, a social network with pro-Trump leanings.
The extension comes after a concerted effort to secure shareholder approval, arriving just three days before the liquidation deadline of Truth Social on September 8. A failure to secure shareholder approval would have compelled the SPAC to dissolve, resulting in the return of $300 million to shareholders, depriving Trump Media & Technology Group of the funds associated with the deal.
However, the merger still faces challenges, including meeting closing conditions and resolving issues raised by the Securities and Exchange Commission (SEC). In July, the SEC alleged that Digital World had misled investors in its official merger documents. Correcting these inaccuracies and resubmitting the filings is necessary before the merger process can proceed. Additionally, required quarterly financial statements covering operations in the first half of 2023 have not been filed with the SEC.
Digital World Acquisition had initially anticipated a year for the merger process when it went public in September 2021 but has encountered several hurdles necessitating deadline extensions, including a previous one in September 2022.
Following the news of the extension, Digital World’s shares experienced a rise to over $18 before settling at $16.80 per share at 11 a.m. The stock had reached its peak at approximately $175 per share in 2021.
Explore other SPAC Mergers via SPACtrac reports from Noble Capital Markets
SoftBank Group’s Arm is gearing up for its highly-anticipated initial public offering (IPO), with ambitions to secure a valuation exceeding $52 billion. In an announcement made on Tuesday, the renowned chip designer unveiled plans to issue 95.5 million American depository shares, priced between $47 and $51 each, with a target of raising up to $4.87 billion at the upper end of this range.
While this valuation marks a decline from the $64 billion that SoftBank paid last month to acquire the remaining 25% stake in Arm from its $100 billion Vision Fund, it still surpasses the abandoned $40 billion sale of Arm to Nvidia Corp, which fell through last year due to opposition from antitrust regulators.
Arm, headquartered in Cambridge, England, holds a dominant position in the global technology landscape, powering over 99% of the world’s smartphones. Its innovative designs are also integral to a wide array of devices, spanning from tablets and laptops to servers and automobiles. Notably, Arm maintains a substantial presence in the United States.
Expected to be the largest IPO in the United States this year, Arm’s public offering carries significant weight as a litmus test for an IPO market grappling with challenges such as rising interest rates and geopolitical tensions stemming from the Ukraine conflict.
Despite these obstacles, investors are likely to welcome Arm’s IPO with open arms. The company boasts profitability and a remarkable history of technological innovation. Furthermore, Arm’s designs play a pivotal role in advancing emerging technologies like artificial intelligence and the metaverse.
For SoftBank, this IPO represents a major triumph. The Japanese conglomerate has been under pressure to enhance its investment returns, and while the sale of Arm would have been a monumental windfall, the IPO is a noteworthy achievement in its own right.
The success of Arm’s IPO hinges on several key factors:
1. IPO Market Conditions: The strength of the overall IPO market will play a vital role in determining Arm’s success.
2. Investor Appetite for Tech Stocks: As a technology company, Arm’s fate will be closely tied to investor sentiment towards tech stocks.
3. Valuation of Arm: The company’s valuation must be attractive to prospective investors.
4. Demand for Arm’s Shares: The level of demand for Arm’s shares will significantly impact the outcome.
If Arm’s IPO prevails, it could usher in a new era for the IPO market, potentially inspiring other startups to pursue public offerings. This success story would also bolster SoftBank’s financial standing and burnish its reputation as a savvy investor. Moreover, the technology industry would reap the rewards of heightened visibility and liquidity associated with Arm’s shares.
However, should Arm’s IPO falter, it could stymie the company’s growth prospects due to a lack of capital infusion. SoftBank would bear the financial brunt, and its reputation as an investor might suffer. Additionally, the technology sector would miss out on the potential benefits of Arm’s IPO.
In conclusion, Arm’s IPO is a watershed moment poised to leave an indelible mark on the company, SoftBank, and the technology sector at large. Its success will pivot on a complex interplay of factors, but if it prospers, it promises significant advantages for all stakeholders involved.
The Timken Company (NYSE: TKR), a global leader in engineered bearings and industrial motion products, has announced its acquisition of Des-Case Corp., a Nashville-based manufacturer specializing in filtration products for industrial lubricants. Founded in 1983, Des-Case serves various industrial sectors, and it is expected to generate approximately $40 million in revenue in 2023.
Des-Case is recognized for its innovative filtration solutions that complement Timken’s automatic lubrication systems. This acquisition opens up opportunities for synergy, such as cross-selling and international expansion. Des-Case’s product range includes breathers, filter elements, condition monitoring, lubrication storage, and filter systems, all of which play a crucial role in improving equipment reliability, reducing downtime, and extending the lifespan of customer systems.
Des-Case employs around 120 individuals and operates manufacturing facilities in both Tennessee and the Netherlands. The acquisition was funded through a combination of cash reserves and Timken’s existing revolving credit facility.
Timken, with over a century of experience and innovation, designs and manufactures engineered bearings and industrial motion products. In 2022, the company achieved $4.5 billion in sales and has a global workforce of more than 19,000 employees across 46 countries. Timken has received recognition as one of America’s Most Responsible Companies, World’s Most Ethical Companies, America’s Most Innovative Companies, and America’s Best Large Employers by various prestigious organizations.
Limited Time Menu ReintroducesItalian Chain’s Most Popular Mashup
LOS ANGELES, Sept. 05, 2023 (GLOBE NEWSWIRE) — Fazoli’s, America’s favorite fast and fresh Italian chain, today announces the return of the beloved Pizza Baked Pasta to its menu for a limited time. Beginning Sept. 5, the classic dish will be available to order in three irresistible variations: Pizza Baked Pasta, Meaty Pizza Baked Pasta and Supreme Pizza Baked Pasta. Also included in the limited-time offering is Pumpkin Cheesecake made by The Cheesecake Factory Bakery®, a welcome addition to the dessert menu just in time for fall.
The classic Pizza Baked Pasta is back better than before, this time featuring a penne pasta smothered in the chain’s signature zesty Pizza Bake Sauce, loaded with mozzarella and pepperoni, and then baked to sizzling perfection. Guests can elevate the dish by opting for the Meaty Pizza Baked Pasta, which includes the classic ingredients plus Italian sausage and bacon, or the brand-new Supreme Pizza Baked Pasta, made with the classic ingredients, Italian sausage, bacon, red and green peppers, onions, and mushrooms. All three renditions of the dish are available through the end of the year – giving customers plenty of time to try all three at restaurants systemwide!
“At Fazoli’s, we’re dedicated to crafting innovative Italian dishes,” said Tisha Bartlett, Vice President of Marketing at Fazoli’s. “The return of our Pizza Baked Pastas is a celebration of that commitment, and we’re eager for our devoted fans to once again enjoy a quintessential Fazoli’s classic.”
As part of the limited-time menu, guests will also get a taste of fall with Pumpkin Cheesecake made by The Cheesecake Factory Bakery® available through Oct. 30. Made with a secret blend of spices, garnished with a rosette of whipped cream, and drizzled with Ghirardelli Salted Caramel Sauce, The Cheesecake Factory’s legendary Pumpkin Cheesecake is a delightful sweet and spiced treat that will have each forkful tasting like sweater weather.
Founded in 1988, Fazoli’s prides itself in serving quality Italian pastas, sub sandwiches, salads, pizza, and dessert. For more information on Fazoli’s, visit Fazolis.com.
About FAT (Fresh. Authentic. Tasty.) Brands FAT Brands (NASDAQ: FAT) is a leading global franchising company that strategically acquires, markets, and develops fast casual, quick-service, casual dining, and polished casual dining concepts around the world. The Company currently owns 17 restaurant brands: Round Table Pizza, Fatburger, Marble Slab Creamery, Johnny Rockets, Fazoli’s, Twin Peaks, Great American Cookies, Hot Dog on a Stick, Buffalo’s Cafe & Express, Hurricane Grill & Wings, Pretzelmaker, Elevation Burger, Native Grill & Wings, Yalla Mediterranean and Ponderosa and Bonanza Steakhouses, and franchises and owns over 2,300 units worldwide. For more information on FAT Brands, please visit www.fatbrands.com.
About Fazoli’s: Fast. Fresh. Italian. Founded in 1988 in Lexington, Ky., Fazoli’s owns and operates nearly 220 restaurants in 27 states, making it the largest QSR Italian chain in America. Fazoli’s prides itself on serving quality Italian food, fast, fresh and friendly. Menu offerings include freshly prepared pasta entrees, Submarinos® sandwiches, salads, pizza and desserts – along with its unlimited signature breadsticks. Fazoli’s is a winner of FastCasual and Steritech’s 2020 Excellence in Food Safety Award and ranked number seven on FastCasual’s “Top 100 Movers and Shakers” list in 2022. Additionally, it was named to Technomic’s “Top 500 Chain Restaurant Report” in 2022, selected as one of the “Top 50 Global Fast Casual Innovators in 2021” by Foodable, a “Top 200 Franchises in 2021” by Franchise Business Review, and an Entrepreneur 2018 “Franchise 500.” Fazoli’s was a recipient of the 2021 American Business Awards Gold Stevie Awards in Food & Beverage for Company of the Year.
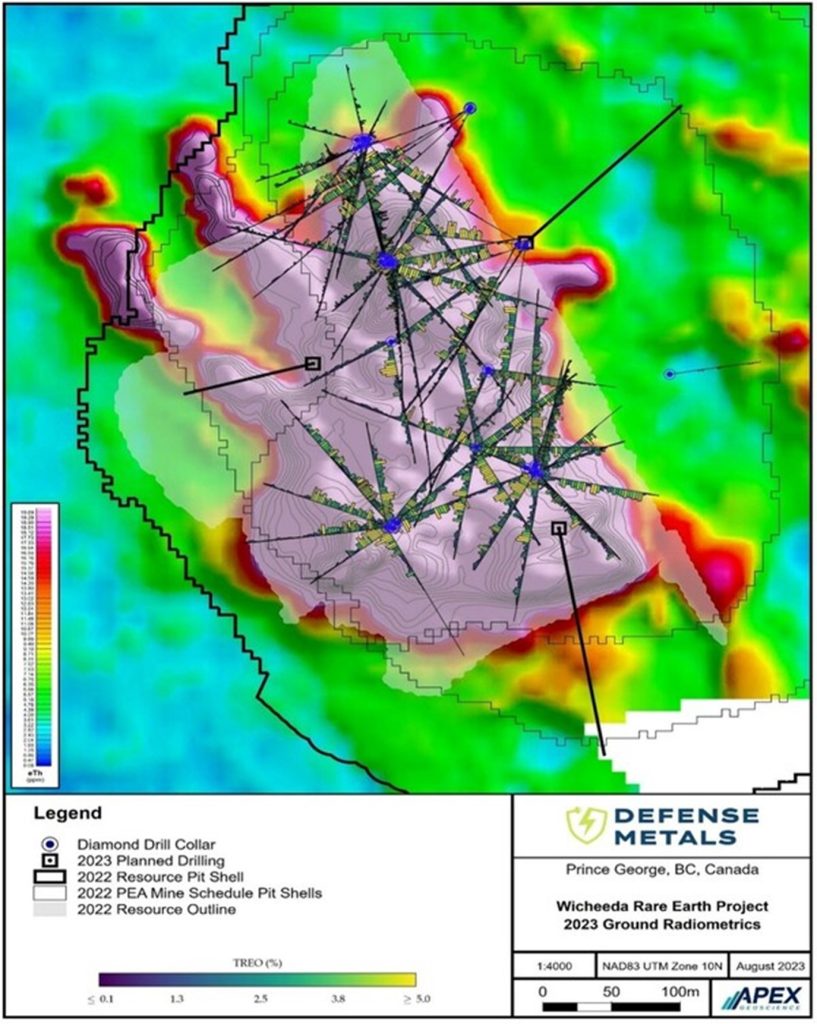
VANCOUVER, BC, Sept. 5, 2023 /CNW/ – Defense Metals Corp. (“Defense Metals” or the “Company“) (TSXV: DEFN) (OTCQB: DFMTF) (FSE:35D) is pleased to announce that a recently completed ground radiometric geophysical survey over the Wicheeda Rare Earth Element (REE) deposit, located near Prince George, Canada, has identified new anomalies that may represent previously unknown REE mineralized carbonatite located largely within the current mineral resource pit shells, as set forth in the 2021 preliminary economic assessment (PEA1).
Highlights:
Based on extensive core drilling and surface geologic mapping completed to advance Defense Metals’ ongoing preliminary feasibility study (PFS), the survey results closely map and further define the surface extent of outcropping REE mineralization.
Two previously unknown linear radiometric anomalies were identified, each approximately 40 metres in width and extending approximately 250 metres northwest from the main body of the Wicheeda REE deposit (Figure 1).
Ground truthing showed that the anomalies are overlain entirely by surficial cover which occurs at lower elevations, along the western portion of the Wicheeda deposit.
Kristopher Raffle, P.Geo., Director of Defense Metals and a Qualified Person stated:
“We’re excited to have identified two new exploration targets so close to the Wicheeda deposit. The radiometric surveys were initially designed to assist our geologic mapping teams and it came as a surprise when we identified new anomalies under cover having a similar geophysical expression to known drilled and outcropping rare earth mineralization. After reviewing the geophysical data in the context of our updated Wicheeda 3D geological model we recognized the potential for undiscovered near-surface, east-dipping carbonatite bodies. We look forward to drill testing these anomalies.”
Several resource definition drill holes undercut the southern half of the eastern anomaly at >150 metre vertical depth below surface and preclude a subvertical or steeply east dipping source. Drill hole WI21-39 intersected relatively higher-grade carbonatite at depth returning 2.91% total rare earth oxide (TREO) over 45 metres from a depth of 69 metres2 downhole that is believed to represent the downdip projection of the eastern radiometric anomaly.
The majority of the eastern and the entirety of the western radiometric anomaly remain untested by core drilling. Defense Metals plans to test the western geophysical anomaly during fall 2023 as part of an expanded program of pit geotechnical drilling comprising a planned 915 metres in 4 holes (see Figure 1), with additional drilling subject to initial results.
____________________________
1 Independent Preliminary Economic Assessment for the Wicheeda Rare Earth Element Project, British Columbia, Canada, dated January 6, 2022, with an effective date of November 7, 2021, and prepared by SRK Consulting (Canada) Inc. is filed under Defense Metals Corp.’s Issuer Profile on SEDAR+ (www.sedarplus.ca).
____________________________
2 See Defense Metals News Release dated March 8, 2022
Details of the Radiometric Surveys
The recently completed Wicheeda ground radiometric survey comprised a total of 20 line-km along 50 metre spaced, and locally 25 metre infill, east-west oriented survey lines completed over an area of approximately 800 x 900 metres. A NUVIA Dynamics PGIS-2 Gamma-ray spectrometer, equipped with a 0.347 Litre NaI detector and 512-channel resolution ADC was used and data was automatically synchronized with GPS, ensuring both time and location accuracy. The spectrometer’s self-stabilizing capabilities on natural radioactive elements such as K, U, and Th eliminated the need for frequent recalibration, assuring reliable and accurate gamma-ray measurements. Given that gamma rays are highly attenuated by overburden (approximately 90% attenuation at 20-30cm overburden depth) ground radiometric surveys are only likely to detect outcropping or very near surface sources.
Qualified Person
The scientific and technical information contained in this news release as it relates to the Wicheeda REE Project has been reviewed and approved by Kristopher J. Raffle, P.Geo. (B.C.), Principal and Consultant of APEX Geoscience Ltd. of Edmonton, Alberta, who is a director of Defense Metals and a “Qualified Person” as defined in NI 43-101.
About the Wicheeda REE Property
Defense Metals 100% owned, 6,759-hectare (~16,702-acre) Wicheeda Project is located approximately 80 km northeast of the city of Prince George, British Columbia; population 77,000. The Wicheeda REE Project is readily accessible by all-weather gravel roads and is near infrastructure, including hydropower transmission lines and gas pipelines. The nearby Canadian National Railway and major highways allow easy access to the deep-water port facilities at Prince Rupert, the closest major North American port to Asia.
The 2021 Wicheeda REE Project Preliminary Economic Assessment technical report outlined an after-tax net present value (NPV@8%) of $517 million and an 18% IRR3. This PEA contemplated an open pit mining operation with a 1.75:1 (waste: mill feed) strip ratio providing a 1.8 Mtpa (“million tonnes per year”) mill throughput producing an average of 25,423 tonnes REO annually over a 16-year mine life. A Phase 1 initial pit strip ratio of 0.63:1 (waste: mill feed) would yield rapid access to higher grade surface mineralization in year 1 and payback of $440 million initial capital within 5 years.
____________________________
3 Independent Preliminary Economic Assessment for the Wicheeda Rare Earth Element Project, British Columbia, Canada, dated January 6, 2022, with an effective date of November 7, 2021, and prepared by SRK Consulting (Canada) Inc. is filed under Defense Metals Corp.’s Issuer Profile on SEDAR+ (www.sedarplus.ca).
About Defense Metals Corp.
Defense Metals Corp. is a mineral exploration and development company focused on the development of its 100% owned Wicheeda Rare Earth Element Deposit located near Prince George, British Columbia, Canada. Defense Metals Corp. trades on the TSX Venture Exchange under the symbol “DEFN”, in the United States, trading symbol “DFMTF” on the OTCQB and in Germany on the Frankfurt Exchange under “35D”.
Defense Metals is a proud member of Discovery Group. For more information please visit: http://www.discoverygroup.ca/
Neither the TSX Venture Exchange nor its Regulation Services Provider (as that term is defined in the policies of the TSX Venture Exchange) accepts responsibility for the adequacy or accuracy of this news release.
Cautionary Statement Regarding “Forward-Looking” Information
This news release contains “forward‐looking information or statements” within the meaning of applicable securities laws, which may include, without limitation, statements relating to advancing the Wicheeda REE Project, completion of additional geotechnical work including pit geotechnical core holes and the expected timelines, the potential of the anomalies to represent previously unknown bodies of REE mineralized carbonatite, the expected completion of the PFS, the technical, financial and business prospects of the Company, its project and other matters. All statements in this news release, other than statements of historical facts, that address events or developments that the Company expects to occur, are forward-looking statements. Although the Company believes the expectations expressed in such forward-looking statements are based on reasonable assumptions, such statements are not guarantees of future performance and actual results may differ materially from those in the forward-looking statements. Such statements and information are based on numerous assumptions regarding present and future business strategies and the environment in which the Company will operate in the future, including the price of rare earth elements, the anticipated costs and expenditures, accuracy of assay results, performance of available laboratory and other related services, future operating costs, interpretation of geological, engineering and metallurgical data, the ability to achieve its goals, that general business and economic conditions will not change in a material adverse manner, that financing will be available if and when needed and on reasonable terms. Such forward-looking information reflects the Company’s views with respect to future events and is subject to risks, uncertainties and assumptions, including the risks and uncertainties relating to the interpretation of exploration, engineering and metallurgical results, risks related to the inherent uncertainty of exploration, metallurgy and development and cost estimates, the potential for unexpected costs and expenses and those other risks filed under the Company’s profile on SEDAR+ at www.sedarplus.ca. While such estimates and assumptions are considered reasonable by the management of the Company, they are inherently subject to significant business, economic, competitive and regulatory uncertainties and risks. Factors that could cause actual results to differ materially from those in forward looking statements include, but are not limited to, continued availability of capital and financing and general economic, market or business conditions, adverse weather and climate conditions, failure to maintain or obtain all necessary government permits, approvals and authorizations, failure to maintain community acceptance (including First Nations), risks relating to unanticipated operational difficulties (including failure of equipment or processes to operate in accordance with specifications or expectations, cost escalation, unavailability of personnel, materials and equipment, government action or delays in the receipt of government approvals, industrial disturbances or other job action, and unanticipated events related to health, safety and environmental matters), risks relating to inaccurate geological, metallurgical and engineering assumptions, decrease in the price of rare earth elements, the impact of Covid-19 or other viruses and diseases on the Company’s ability to operate, an inability to predict and counteract the effects of COVID-19 and other viruses and diseases on the business of the Company, the price of commodities, capital market conditions, restriction on labour and international travel and supply chains, loss of key employees, consultants, or directors, increase in costs, delayed results, litigation, and failure of counterparties to perform their contractual obligations. The Company does not undertake to update forward‐looking statements or forward‐looking information, except as required by law.
BOTHELL, Wash., Sept. 05, 2023 (GLOBE NEWSWIRE) — Cocrystal Pharma, Inc. (Nasdaq: COCP) (“Cocrystal” or the “Company”), a clinical-stage biopharmaceutical company dedicated to developing novel small molecule antiviral therapeutics, announces that management will participate in the H.C. Wainwright 25th Annual Global Investment Conference being held September 11-13, 2023. A webcast of the Cocrystal presentation will be available on the IR Calendar section of the Company’s website beginning Monday, September 11 at 7:00 a.m. Eastern time.
Management is available throughout the conference for in-person and virtual one-on-one meetings. Institutional investors and industry professionals can register to attend the conference virtually or in-person at the Lotte New York Palace Hotel.
About Cocrystal Pharma, Inc.
Cocrystal Pharma, Inc. is a clinical-stage biotechnology company discovering and developing novel antiviral therapeutics that target the replication process of influenza viruses, coronaviruses (including SARS-CoV-2 and noroviruses) and hepatitis C viruses. Cocrystal employs unique structure-based technologies and Nobel Prize-winning expertise to create first- and best-in-class antiviral drugs. For further information about Cocrystal, please visit www.cocrystalpharma.com.
TNX-102 SL showed a robust effect size of 0.5 in improving fatigue and showed consistent activity across secondary measures of sleep quality, cognitive function, disability and Patient Global Impression of Change, but did not meet the primary endpoint of multi-site pain reduction at week 14
Findings fulfill the objectives of this proof-of-concept study, supporting the decision to advance the program based on a proposed primary endpoint using the PROMIS Fatigue scale
Tonix plans to meet with FDA to discuss a path to registration; fatigue is the signature symptom of Long COVID and the principal symptom overlapping with CFS/ME and fibromyalgia syndromes
CHATHAM, N.J., Sept. 05, 2023 (GLOBE NEWSWIRE) — Tonix Pharmaceuticals Holding Corp. (Nasdaq: TNXP) (Tonix or the Company), a biopharmaceutical company with marketed products and a pipeline of development candidates, today announced topline results from the Phase 2 proof-of-concept PREVAIL study of TNX-102 SL 5.6 mg for the management of fibromyalgia-type Long COVID. TNX-102 SL treatment showed a robust effect size (ES) in improving fatigue and showed consistent activity trending to improvements across the secondary endpoints of sleep quality, cognitive function, disability and patient global impression of change (PGIC). TNX-102 SL trended towards improvement but did not achieve the pre-specified primary endpoint of improving Long COVID pain intensity scores at Week 14. The proposed mechanism of TNX-102 SL is improving sleep quality, which NIH recently announced is a target of future RECOVER clinical trials in Long COVID, a National Institute of Health (NIH) research program designed to understand, treat, and prevent long COVID.1,2 There is currently no approved drug for the treatment of Long COVID.
PREVAIL was a randomized, double-blind, placebo-controlled, multi-site proof-of-concept study of 63 patients with laboratory-documented COVID-19 illness preceding Long COVID. PREVAIL was designed and conducted to guide the design of registrational studies of TNX-102 SL in fibromyalgia-type Long COVID. TNX-102 SL was generally well tolerated with an adverse event (AE) profile comparable to prior studies with TNX-102 SL. AE-related discontinuations were similar in drug and placebo arms. No new safety signals were observed.
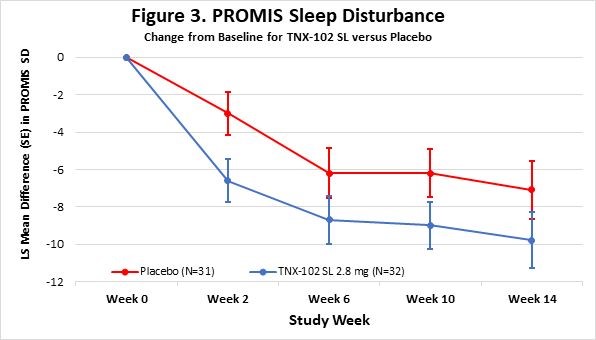
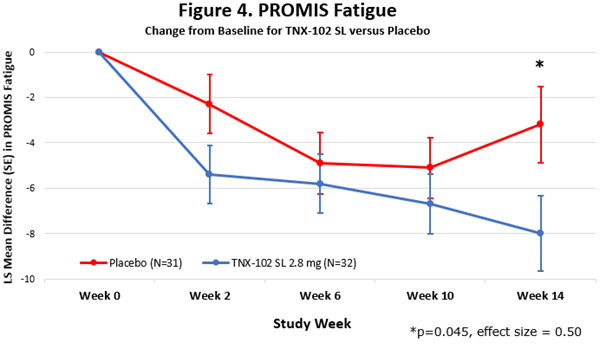
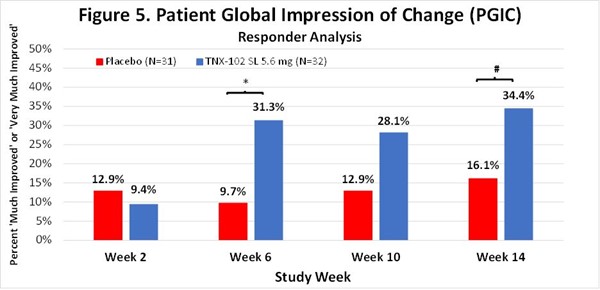
“The robust activity of TNX-102 SL on the PROMIS Fatigue scale3-5 (ES=0.5, Figure 4) is important because patients and experts view fatigue as the signature symptom of Long COVID and it has been identified as the dominant symptom contributing to disability,”6 said Dr. Seth Lederman, President and CEO of Tonix Pharmaceuticals. “In addition, TNX-102 SL showed consistent trends toward improvement in sleep quality, cognitive function, disability and the PGIC responder rate for TNX-102 SL compared to placebo (Figure 5) at week 14 (34.4% vs. 16.1%, difference=18.2%). Together, these findings fulfill the objectives of this proof-of-concept study in supporting the decision to advance the program based on a proposed primary endpoint using the PROMIS Fatigue scale.”
The Company intends to request an End-of-Phase 2 meeting with the U.S. Food and Drug Administration (FDA) to discuss a potential Phase 3 program based on a proposed primary outcome measure using the PROMIS Fatigue scale. The meeting is expected to take place in the first quarter of 2024. Fatigue is the symptom of Long COVID that principally overlaps with chronic fatigue syndrome/myalgic encephalomyelitis (CFS/ME) and fibromyalgia. In the NIH funded RECOVER study analysis, fatigue was the top featured symptom and is common in each of the four clusters.7
“The data from PREVAIL reinforce our belief in TNX-102 SL as a potential bedtime medicine for the management of fibromyalgia-type Long COVID,” said Gregory Sullivan, M.D., Chief Medical Officer of Tonix Pharmaceuticals. “We believe the PREVAIL trial results will help guide the next phase of development for TNX-102 SL, supporting the design of a potential registrational trial for fibromyalgia-type Long COVID based on PROMIS fatigue as a primary endpoint, pending review and feedback from the FDA. In both of our prior Phase 3 studies of TNX-102 SL 5.6 mg in fibromyalgia, we observed numerical improvement in the PROMIS fatigue score (in RELIEF p=0.007 MMRM8 and in RALLY p=0.007 MMRM9).”
Dr. Sullivan continued, “Although the validity of PROMIS Fatigue is not yet established in Long COVID, we believe the results of PREVAIL, together with extensive data from studies in other chronic conditions3-5 – including Tonix’s studies in fibromyalgia – make PROMIS Fatigue a solid candidate for the primary endpoint of future Long COVID registrational studies. We look forward to an anticipated End-of-Phase 2 meeting with the FDA to discuss these data and expect to present full data from PREVAIL in a peer-reviewed format and at upcoming medical conferences. Together, we believe these findings support the recognition of fibromyalgia-type Long COVID as a clinically meaningful subgroup of Long COVID patients and underscore the potential of TNX-102 SL as a once daily, oral therapy for this debilitating condition. We are grateful to the patients and their families and supporters, who participated in this study.”
Key Phase 2 PREVAIL Study Results
In the study, 63 subjects were enrolled and randomized 1:1 across approximately 30 U.S. sites to receive either TNX-102 SL or placebo daily at bedtime for 14 weeks. Subjects started with TNX-102 SL 2.8 mg tablet or one placebo tablet for the first 2 weeks and then increased to TNX-102 SL 5.6 mg (2 x 2.8 mg tablets) or two placebo tablets for the remaining 12 weeks of the treatment period. The percentage of subjects completing the study was 81.3% in the TNX-102 SL group and 80.6% in the placebo group. Demographics and baseline characteristics are shown in Table 1.
Table 1: Demographics and Baseline Characteristics
Variable
Placebo
TNX-102 SL
Total
N=31
N=32
N=63
Age, mean years (SD)
51.4 (10.01)
48.6 (8.80)
50.0 (9.45)
Female, number (%)
25 (80.6%)
21 (65.6%)
46 (73.0%)
Male, number (%)
6 (19.4%)
11 (34.4%)
17 (27.0%)
Ethnicity
Hispanic or Latino
3 (9.7%)
2 (6.3%)
5 (7.9%)
Not Hispanic or Latino
28 (80.6%)
30 (93.8%)
58 (92.1%)
Race
American Indian or AN, number (%)
1 (3.2%)
0 (0.0%)
1 (1.6%)
Asian, number (%)
0 (0.0%)
1 (3.1%)
1 (1.6%)
Black or African American, number (%)
5 (16.1%)
7 (21.9%)
12 (19.0%)
Native Hawaiian or PI, number (%)
0 (0.0%)
0 (0.0%)
0 (0.0%)
White or Caucasian, number (%)
24 (77.4%)
21 (65.6%)
45 (71.4%)
Multiple Races, number (%)
1 (3.2%)
3 (9.4%)
4 (6.3%)
BMI, mean kg/m2 (SD)
29.5 (4.44)
29.8 (4.07)
29.6 (4.22)
Employed, number (%)
26 (83.9%)
25 (78.1%)
51 (81.0%)
Abbreviations: AN, Alaskan Native; BMI, body mass index; PI, Pacific Islander; SD, standard deviation
Primary endpoint
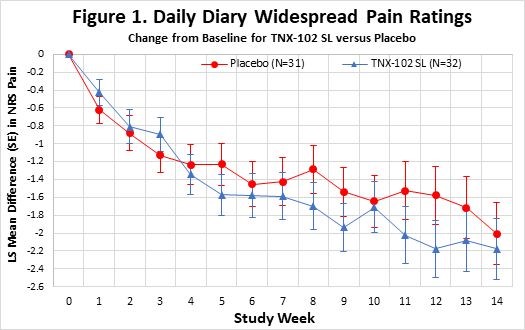
Given the lack of Long COVID treatments and the size of the current proof-of-concept study, an ES ≥ 0.2 was the pre-specified threshold for declaring the primary endpoint positive. The study trended towards a benefit but did not achieve statistical significance on the primary efficacy endpoint of change from baseline in the diary numerical rating scale (NRS) weekly average of daily self-reported worst Long COVID pain intensity scores for TNX-102 SL at the Week 14 endpoint versus placebo (effect size (ES) = 0.08, Figure 1.)
Secondary endpoints
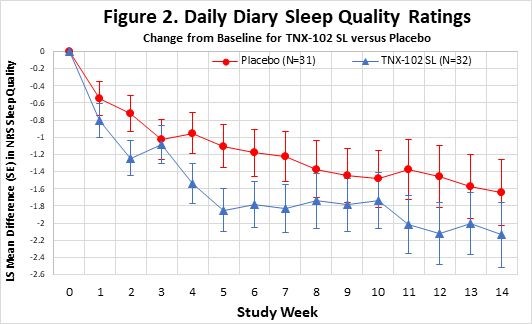
The change from baseline to the Week 14 endpoint for the daily sleep quality diary, PROMIS Sleep Disturbance, PROMIS Fatigue, PROMIS Cognitive function, the Insomnia Severity Index (ISI) and Sheehan Disability Scale showed numerical improvements (MMRM, ES ≥ 0.2): sleep diary (MMRM, ES =0.23, Figure 2.), PROMIS sleep Disturbance (MMRM, ES=0.32, Figure 3.), PROMIS fatigue (MMRM, ES=0.50, Figure 4.), PROMIS Cognitive Function – Abilities, (MMRM, ES=0.21), the ISI (ANCOVA, ES=0.24) and the Sheehan Disability Scale (ANCOVA, ES=0.26). Moreover, robust activity was observed in the PGIC responder (very much improved or much improved) rate for TNX-102 SL compared to placebo (Figure 5): week 6 (31.3% vs. 9.7%, difference=21.6%), week 10 (28.1% vs. 12.9%, difference=15.2%), week 14 (34.4% vs. 16.1%, difference=18.2%).
Safety profile
TNX-102 SL demonstrated a favorable safety and tolerability profile over 14 weeks of treatment with no new safety signals. The most common adverse events are shown in Table 2. Participants with at least one treatment-emergent adverse event (TEAE) were at a rate of 56.3% on TNX-102 SL and 38.7% on placebo. In the TNX-102 SL group, 6.3% discontinued due to TEAE compared to 9.7% on placebo. Only one TEAE in the study was rated as severe, gastritis in a participant in the TNX-102 SL group. There were no serious adverse events (SAEs) in the study.
Table 2: Adverse Events Occurring in ≥ 2 Participants in Either Treatment Group
Placebo
TNX-102 SL
Total
N=31
N=32
N=63
Administration Site Reactions
Hypoaesthesia oral
0
6
6
Product taste abnormal
0
3
3
Glossodynia
0
2
2
Oral pain
0
2
2
Paraesthesia oral
0
2
2
Systemic Adverse Events
Influenza like illness
2
0
2
Abbreviations: LS, least squares; SE, standard error
Abbreviations: LS, least squares; SE, standard error
Abbreviations: LS, least squares; SE, standard error; SD, sleep disturbance
Abbreviations: LS, least squares; SE, standard error
*p=0.034, #p=0.096
About the Phase 2 PREVAIL Study The Phase 2 PREVAIL proof-of-concept study was a 14-week double-blind, randomized, multicenter, placebo-controlled study to evaluate the efficacy and safety of TNX-102 SL taken daily at bedtime in patients with multi-site pain associated with laboratory-documented post-acute sequelae of SARS-CoV-2 infection (PASC). The trial was conducted at approximately 30 sites in the U.S. The primary efficacy endpoint is the change from baseline in the weekly average of daily self-reported worst pain intensity scores at the Week 14 endpoint. Key secondary efficacy endpoints include change from baseline in self-reported scores for sleep disturbance, fatigue, and cognitive function.
For more information, see ClinicalTrials.gov Identifier: NCT05472090.
About Long COVID or Post-Acute Sequelae of COVID-19 (PASC)
Post-acute sequelae of COVID-19, or PASC is the formal name for a condition now widely known as Long COVID. The U.S. Department of Health and Human Services (HHS) recently estimated that 7.7 million to 23 million Americans have developed Long COVID and announced the formation of the “Office of Long COVID Research and Practice” to lead the Long COVID response and coordinate efforts across the federal government. 10 Although most people recover from COVID-19 within weeks of the acute illness, a substantial portion develops a chronic syndrome called Long COVID.11 These individuals experience a constellation of disabling symptoms long past the time of recovery from acute COVID-19. Most Long COVID patients who have been studied appear to have cleared the SARS-CoV-2 infection from their systems. The symptoms of Long COVID can include fatigue, sleep disorders, multi-site pain, fevers, shortness of breath, cognitive impairment described as “brain fog” or memory disturbance, gastrointestinal symptoms, anxiety, and depression. According to the Centers for Disease Control and Prevention (CDC), 1 in 13 adults in the U.S. (7.5%) have Long COVID symptoms.11 Long COVID is typically associated with moderate or severe COVID-19 but can occur after mild COVID-19 or even after asymptomatic SARS-CoV-2 infection. More than 40% of adults in the United States reported having COVID-19 in the past, and nearly one in five of those (19%) are currently still having symptoms of Long COVID.11 Long COVID is a chronic disabling condition that is expected to result in a significant global health and economic burden.12-15 In response to the urgent need for therapies that address Long COVID, Congress awarded $1.15 billion to the National Institutes of Health to study Long COVID in December 2020.16 The U.S. Department of Health and Human Services National Research Action Plan on Long COVID17, released in August 2022, addresses the overlap of Long COVID with CFS/ME, which, like fibromyalgia, is one of the overlapping chronic pain syndromes with central and peripheral sensitization.18 A published survey19 found comparable pain, fatigue, and functional impairment between Long COVID, fibromyalgia, and CFS/ME. This symptom overlap between these conditions has suggested that altered neurologic function is one of the leading hypotheses to explain them.20 While the vaccines available in the U.S., through either FDA approval or under Emergency Use Authorization, have been shown to prevent acute COVID, their ability to prevent Long COVID is unknown. There is currently no approved drug for the treatment of Long COVID.
About Fibromyalgia-Type Long COVID
Common symptoms of Long COVID, including multi-site pain, fatigue, unrefreshing sleep, and cognitive dysfunction, or ‘brain fog,’ are hallmarks of conditions like fibromyalgia and CFS/ME. Defining subgroups of Long COVID patients that overlap with fibromyalgia and CFS/ME is expected to facilitate the development of new treatments.20 We are studying TNX-102 SL in the subgroup of Long COVID patients whose symptoms overlap with fibromyalgia, which we have termed ‘Fibromyalgia-type Long COVID.’ TNX-102 SL is in phase 3 development for the management of fibromyalgia.8,21 Fibromyalgia has been recognized by the U.S. Food and Drug Administration (FDA) with three approved medicines. The recent identification of Long COVID subgroups in the National Institutes of Allergy and Infectious Diseases (NIAID)-sponsored RECOVER study7 was an important step. In their recent publication7 cluster analysis of the symptom frequencies in the RECOVER study (Researching COVID to Enhance Recovery (RECOVER) research program) identified four subgroups of Long COVID patients. Cluster #4 represented approximately one quarter of the population (28%) and reported the highest frequencies of pain (back pain (58%), joint pain (64%) or muscle pain (60%)), high frequencies of fatigue (94%) and ’Brain Fog,’ (94%) and a high level of impairment of Quality of Life. We believe Cluster #4 is a subgroup of Long COVID that overlaps with fibromyalgia. We also believe that Cluster #3, representing another approximately 29% of the RECOVER cohort, includes many patients with Fibromyalgia-type Long COVID because 100% of that group suffer from ‘Brain Fog’, 94% experience fatigue and approximately one third experience pain (back pain (32%), joint pain (36%) or muscle pain (34%)). Fibromyalgia can result from a variety of different stressors, in addition to infectious illnesses, including hormonal, metabolic, and psychological stressors.23,24 It can be challenging to distinguish fibromyalgia and CFS/ME clinically, given the high level of symptom overlap between them. Each of these conditions is defined by a constellation of symptoms, and there is no widely recognized diagnostic laboratory test that distinguishes them. We presented an analysis of a Fibromyalgia-type Long COVID subgroup from the TriNetX claims database at the BIO-sponsored Long COVID meeting in February 2023.21 That study provided real-world evidence that the majority of Long COVID patients present with a constellation of symptoms that overlap with fibromyalgia and CFS/ME. These symptoms include fatigue, cognitive symptoms, and multi-site pain. Fibromyalgia-type Long COVID, like fibromyalgia and CFS/ME, appears to be both a subgroup of Long COVID and one of several chronic overlapping pain conditions that have in common the neurological process called central and peripheral sensitization, which is increasingly known by the term nociplastic pain.
About TNX-102 SL
TNX-102 SL is a patented sublingual tablet formulation of cyclobenzaprine hydrochloride which provides rapid transmucosal absorption and reduced production of a long half-life active metabolite, norcyclobenzaprine, due to bypass of first-pass hepatic metabolism. As a multifunctional agent with potent binding and antagonist activities at the 5-HT2A-serotonergic, α1-adrenergic, H1-histaminergic, and M1-muscarinic receptors, TNX-102 SL is in development as a daily bedtime treatment for fibromyalgia, Long COVID (formally known as post-acute sequelae of COVID-19 [PASC]), alcohol use disorder and agitation in Alzheimer’s disease. The United States Patent and Trademark Office (USPTO) issued United States Patent No. 9636408 in May 2017, Patent No. 9956188 in May 2018, Patent No. 10117936 in November 2018, Patent No. 10,357,465 in July 2019, and Patent No. 10736859 in August 2020. The Protectic™ protective eutectic and Angstro-Technology™ formulation claimed in the patent are important elements of Tonix’s proprietary TNX-102 SL composition. These patents are expected to provide TNX-102 SL, upon NDA approval, with U.S. market exclusivity until 2034/2035.
*TNX-102 SL is an investigational new drug and is not approved for any indication
Briggs, A, and Vassall, A. Nature. 2021. 593(7860): 502-505
Nittas V, et al. Public Health Rev. 2022. 43:1604501
Davis, HE., et al. EClinicalMedicine. 2021. 38:101019
Martin C, et al. PLoS One. 2021. 16(12):e0260843
The NIH provision of Title III Health and Human Services, Division M–Coronavirus Response and Relief Supplemental Appropriations Act, 2021, of H.R. 133, The Consolidated Appropriations Act of 2021. The bill was enacted into law on 27 December 2020, becoming Public Law 116-260.
Moldofsky H, et al. J Rheumatol. 2011. 38(12):2653-63
Clauw DJ, and Calabrese L. Ann Rheum Dis. 2023
Clauw DJ, et al. Pain. 2020. 161(8):1694-1697
Tonix Pharmaceuticals Holding Corp.*
Tonix is a biopharmaceutical company focused on commercializing, developing, discovering and licensing therapeutics to treat and prevent human disease and alleviate suffering. Tonix Medicines, our commercial subsidiary, markets Zembrace® SymTouch® (sumatriptan injection) 3 mg and Tosymra® (sumatriptan nasal spray) 10 mg under a transition services agreement with Upsher-Smith Laboratories, LLC from whom the products were acquired on June 30, 2023. Zembrace SymTouch and Tosymra are each indicated for the treatment of acute migraine with or without aura in adults. Tonix’s development portfolio is composed of central nervous system (CNS), rare disease, immunology and infectious disease product candidates. Tonix’s CNS development portfolio includes both small molecules and biologics to treat pain, neurologic, psychiatric and addiction conditions. Tonix’s lead development CNS candidate, TNX-102 SL (cyclobenzaprine HCl sublingual tablet), is in mid-Phase 3 development for the management of fibromyalgia, having completed enrollment of a potentially confirmatory Phase 3 study in the third quarter of 2023, with topline data expected in the fourth quarter of 2023. TNX-102 SL is also being developed to treat fibromyalgia-type Long COVID, a chronic post-acute COVID-19 condition. Topline results from a proof-of-concept Phase 2 study were reported in the third quarter of 2023. TNX-601 ER (tianeptine hemioxalate extended-release tablets) is a once-daily oral formulation being developed as a treatment for major depressive disorder (MDD), that completed enrollment in a Phase 2 proof-of-concept study in the third quarter of 2023, with topline results expected in the fourth quarter of 2023. TNX-4300 (estianeptine) is a single isomer version of TNX-601, small molecule oral therapeutic in preclinical development to treat MDD, Alzheimer’s disease and Parkinson’s disease. Relative to tianeptine, estianeptine lacks activity on the µ-opioid receptor while maintaining activity in the rat Novel Object Recognition test in vivo and the ability to activate PPAR-β/δ and neuroplasticity in tissue culture. TNX-1900 (intranasal potentiated oxytocin), is in development for preventing headaches in chronic migraine, and has completed enrollment in a Phase 2 proof-of-concept study with topline data expected in the fourth quarter of 2023. TNX-1900 is also being studied in binge eating disorder, pediatric obesity and social anxiety disorder by academic collaborators under investigator-initiated INDs. TNX-1300 (cocaine esterase) is a biologic designed to treat cocaine intoxication and has been granted Breakthrough Therapy designation by the FDA. A Phase 2 study of TNX-1300 is expected to be initiated in the third quarter of 2023. Tonix’s rare disease development portfolio includes TNX-2900 (intranasal potentiated oxytocin) for the treatment of Prader-Willi syndrome. TNX-2900 has been granted Orphan Drug designation by the FDA. Tonix’s immunology development portfolio includes biologics to address organ transplant rejection, autoimmunity and cancer, including TNX-1500, which is a humanized monoclonal antibody targeting CD40-ligand (CD40L or CD154) being developed for the prevention of allograft rejection and for the treatment of autoimmune diseases. A Phase 1 study of TNX-1500 was initiated in the third quarter of 2023. Tonix’s infectious disease pipeline includes TNX-801, a vaccine in development to prevent smallpox and mpox. TNX-801 also serves as the live virus vaccine platform or recombinant pox vaccine platform for other infectious diseases. The infectious disease development portfolio also includes TNX-3900 and TNX-4000, which are classes of broad-spectrum small molecule oral antivirals.
*Tonix’s product development candidates are investigational new drugs or biologics and have not been approved for any indication.
Zembrace SymTouch and Tosymra are registered trademarks of Tonix Medicines. Intravail is a registered trademark of Aegis Therapeutics, LLC, a wholly owned subsidiary of Neurelis, Inc. All other marks are property of their respective owners.
This press release and further information about Tonix can be found at www.tonixpharma.com.
Forward Looking Statements
Certain statements in this press release are forward-looking within the meaning of the Private Securities Litigation Reform Act of 1995. These statements may be identified by the use of forward-looking words such as “anticipate,” “believe,” “forecast,” “estimate,” “expect,” and “intend,” among others. These forward-looking statements are based on Tonix’s current expectations and actual results could differ materially. There are a number of factors that could cause actual events to differ materially from those indicated by such forward-looking statements. These factors include, but are not limited to, risks related to the failure to obtain FDA clearances or approvals and noncompliance with FDA regulations; risks related to the failure to successfully market any of our products; risks related to the timing and progress of clinical development of our product candidates; our need for additional financing; uncertainties of patent protection and litigation; uncertainties of government or third party payor reimbursement; limited research and development efforts and dependence upon third parties; and substantial competition. As with any pharmaceutical under development, there are significant risks in the development, regulatory approval and commercialization of new products. Tonix does not undertake an obligation to update or revise any forward-looking statement. Investors should read the risk factors set forth in the Annual Report on Form 10-K for the year ended December 31, 2022, as filed with the Securities and Exchange Commission (the “SEC”) on March 13, 2023, and periodic reports filed with the SEC on or after the date thereof. All of Tonix’s forward-looking statements are expressly qualified by all such risk factors and other cautionary statements. The information set forth herein speaks only as of the date thereof.
The following companies are confirmed for NobleCon19. Check back often, as new companies are added every week. Interested in presenting? Submit a request at the link above.
SANTA MONICA, Calif.–(BUSINESS WIRE)– Entravision (NYSE: EVC), a leading global advertising solutions, media and technology company, announced today that its African based digital business unit has become the exclusive sales partner in Africa of Match Media Group, the group that powers advertising for brands including Tinder, OkCupid and Match.
(Graphic: Business Wire)
Match Group is on a mission to spark meaningful connections for every single person in the world. Founded 25 years ago, Match pioneered the concept of online dating and continues to foster innovation in the online dating industry. With more than 20 offices around the world, the company operates several iconic brands under its portfolio including Match, OkCupid, Tinder, and The League. Today, hundreds of millions of singles have found a meaningful connection using Match Group services.
“This partnership with Match Media Group reinforces our commitment to advertisers to connect brands to consumers through local strategic support, creative expertise and a suite of innovative advertising opportunities on the platform,” said Julian Jordaan, President of Entravision Africa. “Globally, we’re seeing a dating renaissance, with online dating now being the most common way that singles are making new connections. We’re thrilled to be partnered with Match Media Group in Africa to connect consumers to brands in an authentic and relevant way.”
As the exclusive sales partner to Match Media Group across the African continent, Entravision has created a dedicated local team of experts based in South Africa to provide businesses with the tools crucial to sales growth, while also assisting customers in deploying their advertising investments more efficiently across their digital technologies.
About Entravision
Entravision (NYSE: EVC) is a global advertising solutions, media and technology company. Over the past three decades, we have strategically evolved into a digital powerhouse, expertly connecting brands to consumers in the U.S., Latin America, Europe, Asia and Africa. Our digital segment, the company’s largest by revenue, offers a full suite of end-to-end advertising services in 40 countries. We have commercial partnerships with Meta, X Corp. (formerly known as Twitter), TikTok, and Spotify, and marketers can use our Smadex and other platforms to deliver targeted advertising to audiences around the globe. In the U.S., we maintain a diversified portfolio of television and radio stations that target Hispanic audiences and complement our global digital services. Entravision remains the largest affiliate group of the Univision and UniMás television networks. Shares of Entravision Class A Common Stock trade on the NYSE under ticker: EVC. Learn more about our offerings at entravision.com or connect with us on LinkedIn and Facebook.
About Match Group
Match Group (NASDAQ: MTCH), through its portfolio companies, is a leading provider of digital technologies designed to help people make meaningful connections. Our global portfolio of brands includes Tinder®, Hinge®, Match®, Meetic®, OkCupid®, Pairs™, PlentyOfFish®, Azar®, Hakuna™, and more, each built to increase our users’ likelihood of connecting with others. Through our trusted brands, we provide tailored services to meet the varying preferences of our users. Our services are available in over 40 languages to our users all over the world.
Forward-Looking Statements
This press release contains certain forward-looking statements. These forward-looking statements, which are included in accordance with the safe harbor provisions of the Private Securities Litigation Reform Act of 1995, may involve known and unknown risks, uncertainties and other factors that may cause the Company’s actual results and performance in future periods to be materially different from any future results or performance suggested by the forward-looking statements in this press release. Although the Company believes the expectations reflected in such forward-looking statements are based upon reasonable assumptions, it can give no assurance that actual results will not differ materially from these expectations, and the Company disclaims any duty to update any forward-looking statements made by the Company. From time to time, these risks, uncertainties and other factors are discussed in the Company’s filings with the Securities and Exchange Commission.
SASKATOON, Saskatchewan, Canada, September 1, 2023 – MustGrow Biologics Corp. (TSXV: MGRO) (OTC: MGROF) (FRA: 0C0) (the “Company” or “MustGrow”), today announced that the board of directors of the Company authorized and approved the grant of a total of 612,757 deferred share units (“DSUs”) and 177,035 restricted share units (“RSUs”) to certain directors, officers, and consultants of the Company, effective August 31, 2023. This grant of DSUs and RSUs is made pursuant to the Company’s Omnibus Equity Incentive Plan (the “Plan”).
The RSUs will vest on March 28, 2024. Once vested, each RSU will entitle the recipient to receive one common share in the capital of the Company or a cash payment equivalent thereof at the discretion of the Company. The DSUs will vest in accordance with the terms of the Plan immediately upon grant. Settlement of the DSUs will occur when a holder ceases to be a director, officer or employee of the Company or any of its affiliates, as applicable. On settlement, each DSU will entitle the recipient to receive one common share in the capital of the Company or a cash payment equivalent thereof at the discretion of the Company.
———
About MustGrow
MustGrow is an agriculture biotech company developing organic biocontrol, soil amendment and biofertility products by harnessing the natural defense mechanism and organic materials of the mustard plant to sustainably protect the global food supply and help farmers feed the world. MustGrow and its leading global partners — Janssen PMP (pharmaceutical division of Johnson & Johnson), Bayer, Sumitomo Corporation, and Univar Solutions’ NexusBioAg — are developing mustard-based organic solutions to potentially replace harmful synthetic chemicals. Concurrently, with new formulations derived from food-grade mustard, the Company is pursuing the adoption and use of its technology in the soil amendment and biofertily markets. Over 150 independent tests have been completed, validating MustGrow’s safe and effective approach to crop and food protection and yield enhancements. Pending regulatory approval, MustGrow’s patented liquid products could be applied through injection, standard drip or spray equipment, improving functionality and performance features. Now a platform technology, MustGrow and its global partners are pursuing applications in several different industries from preplant soil treatment and weed control, to postharvest disease control and food preservation, to soil amendment and biofertility. MustGrow has approximately 50.1 million basic common shares issued and outstanding and 56.3 million shares fully diluted. For further details, please visit www.mustgrow.ca.
This release does not constitute an offer for sale of, nor a solicitation for offers to buy, any securities in the United States.
Neither the TSXV, nor their Regulation Services Provider (as that term is defined in the policies of the TSXV), nor the OTC Markets has approved the contents of this release or accepts responsibility for the adequacy or accuracy of this release.