R.Greenleaf Paves Way for Direct Commerce Relationship with Customers, Provides Seamless, Time-Saving Shopping Experience
DENVER, March 13, 2023 /PRNewswire/ – Schwazze, (NEO: SHWZ) (OTCQX: SHWZ) (“Schwazze” or the “Company”), announces the launch of a new ecommerce shop site for R.Greenleaf, its New-Mexico based retail banner with 17 locations throughout the state. This new shopping experience, available at http://rgreenleaf.com, allows customers to ‘skip the line and order online’ by ordering ahead to reserve product and picking up in store. Customers can create an account on the new shop site to access prior orders and receive special offers while also enrolling in R.Greenleaf’s customer loyalty program, Gratify.
“We are excited to bring the convenience of ecommerce shopping to all of our R.Greenleaf locations. Our enhanced online shopping experience allows us to deliver our brands, product assortment and dedicated service to customers in all of our neighborhoods as we continue to expand throughout the state,” said Ken Diehl, Division President – New Mexico.
R.Greenleaf, offering a wide variety of quality products serviced by top-notch, knowledgeable staff, has grown from 10 locations to now 17 since Schwazze’s acquisition nearly one year ago. All locations serve the needs of medical patients as well as recreational consumers.
Since April 2020, Schwazze has acquired, announced the planned acquisition of, or opened 44 cannabis dispensaries as well as seven cultivation facilities and two manufacturing assets in Colorado and New Mexico. In May 2021, Schwazze announced its BioSciences division and in August 2021 it commenced home delivery services in Colorado.
About Schwazze
Schwazze (NEO: SHWZ) (OTCQX: SHWZ) is building a premier vertically integrated regional cannabis company with assets in Colorado and New Mexico and will continue to take its operating system to other states where it can develop a differentiated regional leadership position. Schwazze is the parent company of a portfolio of leading cannabis businesses and brands spanning seed to sale. The Company is committed to unlocking the full potential of the cannabis plant to improve the human condition. Schwazze is anchored by a high-performance culture that combines customer-centric thinking and data science to test, measure, and drive decisions and outcomes. The Company’s leadership team has deep expertise in retailing, wholesaling, and building consumer brands at Fortune 500 companies as well as in the cannabis sector. Schwazze is passionate about making a difference in our communities, promoting diversity and inclusion, and doing our part to incorporate climate-conscious best practices.
Medicine Man Technologies, Inc. was Schwazze’s former operating trade name. The corporate entity continues to be named Medicine Man Technologies, Inc. Schwazze derives its name from the pruning technique of a cannabis plant to enhance plant structure and promote healthy growth.
Forward-Looking Statements
This press release contains “forward-looking statements.” Such statements may be preceded by the words “plan,” “will,” “may,” “continue,” “predicts,” or similar words. Forward-looking statements are not guarantees of future events or performance, are based on certain assumptions, and are subject to various known and unknown risks and uncertainties, many of which are beyond the Company’s control and cannot be predicted or quantified. Consequently, actual events and results may differ materially from those expressed or implied by such forward-looking statements. Such risks and uncertainties include, without limitation, risks and uncertainties associated with (i) our inability to manufacture our products and product candidates on a commercial scale on our own or in collaboration with third parties; (ii) difficulties in obtaining financing on commercially reasonable terms; (iii) changes in the size and nature of our competition; (iv) loss of one or more key executives or scientists; (v) difficulties in securing regulatory approval to market our products and product candidates; (vi) our ability to successfully execute our growth strategy in Colorado and outside the state, (vii) our ability to consummate the acquisition described in this press release or to identify and consummate future acquisitions that meet our criteria, (viii) our ability to successfully integrate acquired businesses, including the acquisition described in this press release, and realize synergies therefrom, (ix) the ongoing COVID-19 pandemic, * the timing and extent of governmental stimulus programs, and (xi) the uncertainty in the application of federal, state and local laws to our business, and any changes in such laws. More detailed information about the Company and the risk factors that may affect the realization of forward-looking statements is set forth in the Company’s filings with the Securities and Exchange Commission (SEC), including the Company’s Annual Report on Form 10-K and its Quarterly Reports on Form 10-Q. Investors and security holders are urged to read these documents free of charge on the SEC’s website at http://www.sec.gov. The Company assumes no obligation to publicly update or revise its forward-looking statements as a result of new information, future events or otherwise except as required by law.
TORONTO, ON / ACCESSWIRE / March 13, 2023 / Eskay Mining Corp. (“Eskay” or the “Company”) (TSX-V:ESK)(OTCQX: ESKYF)(Frankfurt:KN7)(WKN:A0YDPM) is pleased to announce the addition of Mr. Riaz Mirza, M.Sc., as Geophysical Advisor to its exploration team. Mr. Mirza brings a wealth of experience in the application of geophysics for precious- and base-metal exploration in the Golden Triangle where he has been actively engaged in numerous projects over the past decade. Eskay Mining welcomes Mr. Mirza as the newest member of its world-class team of explorers in search of “Eskay Creek V2.0.”
Riaz Mirza, founder of Simcoe Geoscience Limited, a global geophysical service provider, has significant experience exploring a variety of deposit types including volcanogenic massive sulfide (“VMS”) deposits across the Golden Triangle, British Columbia. This experience, as well as Simcoe’s reliance on “next-generation” geophysical data collection and processing, provides Eskay Mining with an entirely new set of tools with which to define new exploration targets for future drill testing.
Mac Balkam, CEO of Eskay Mining, commented: “Riaz and his team have been reviewing our geophysical data from our 100% controlled 602.55 sq km Consolidated Eskay project area with the goal of drawing direct comparisons to that from the original Eskay Creek precious metal-rich VMS deposit. Because VMS deposits typically occur in clusters, drawing direct comparisons of our data to that of our neighbor provides a huge step forward in our quest for discovering ‘Eskay Creek V2.0.’”
John DeDecker, VP of Exploration for Eskay Mining, commented: “Using our large geophysical database, Riaz and his team immediately identified some compelling similarities between the amplitude, texture, distribution and depth of magnetic anomalies associated with the Eskay Creek deposit and multiple areas displaying such patterns across our Consolidated Eskay project. This very distinct magnetic signature associated with the ore bodies at Eskay Creek gives us a powerful tool with which to identify new VMS targets. Combined with our BLEG, rock chip, and soil geochemical data, we now have the ability to undertake much more tightly focused exploration work in 2023.”
Riaz Mirza, Geophysical Advisor to Eskay Mining, noted: “We here at Simcoe Geoscience have already been able to use Eskay Mining’s existing data to illuminate further potential VMS targets. Key magnetic signatures observed at the Eskay Creek deposit are visible in multiple locations across the Consolidated Eskay project telling us we have excellent discovery potential. With this work, Eskay will be able to better use its 2023 exploration budget by targeting its drilling more effectively. We here at Simcoe look forward to teaming up with Eskay’s technical team to strategize our next approaches to exploration including focused mapping, sampling, drilling and perhaps other approaches across Eskay’s large land holdings. We thank Eskay Mining’s for the opportunity to work with their strong technical team as we pursue discovery of ‘Eskay Creek V2.0.’”
Data, Methodology and Interpretation by Simcoe Geoscience
A Leapfrog model of mineralization at Eskay Creek was made utilizing publicly available data from the following sources:
Drill core assay results for Eskay Creek were obtained from Assessment Report number 18958, as well as news releases available on Skeena Resources Limited’s website.
Rock chip assays for Eskay Creek were obtained from Assessment Report number 11160.
Drill collar locations reported in Skeena Resources news releases were transformed from mine grid to UTM Zone 9 NAD83.
Drill hole assay results in Au equivalent are graphically represented in the image in Figure 1.
Airborne SkyTEM and magnetic data gathered in 2021 covering the Consolidated Eskay project and peripheral areas.
New analysis of these data show that there is a distinct magnetic signature associated with the Eskay Creek deposit that is clearly evident when a tilt derivative is applied to the magnetic data. This process re-scales the data range allowing for low amplitude magnetic features to be resolved graphically. Mineralized bodies appear sharply resolved as magnetic highs surrounded by distinct magnetic lows giving a bullseye-like appearance to the deposit (Figure 1). Eskay’s geologic team interprets this distinct signature to result from deformation and metamorphism of hydrothermally altered rocks during post-mineralization tectonic events. A three-dimensional model of magnetic susceptibility shows a strong correlation between domains of high magnetic susceptibility with VMS mineralization situated along a surface defined by a magnetic susceptibility of 0.001 SI. Weaker magnetic susceptibility anomalies are associated with the 21A Zone and the 22 Zone.
Comparable magnetic anomalies are observed in several areas across Eskay Mining’s Consolidated Eskay property (Figures 2-4, and 6-9). A strong correlation is clearly evident between these anomalies and areas of known VMS mineralization (TV, Jeff, Scarlet-Tarn, Sib-Lulu, C10, and Virginia Lakes) as well as in areas where Au- and Ag-bearing sulfide rock chip samples have been collected along the Harrymel Valley, Eskay Anticline and the Scarlet-Tarn trends. In every case, VMS mineralization encountered by drilling occurs along the margins of the modeled 3D magnetic susceptibility volume as described above at Eskay Creek.
Based on observations from magnetic data, a new target named Maroon Cliffs has been identified in the far northeast part of the property (Figures 2-4). Legacy soil sampling on the west side of this anomaly shows strongly elevated Ag and Hg values (Assessment Report number 24155). Data from BLEG surveys conducted in 2020 and 2022 further support the prospectivity of Maroon Cliffs (Figure 5), with two Au BLEG anomalies immediately downstream from this newly identified magnetic anomaly. The presence of the VMS system, CBS Zone, occurring on Tudor Gold’s property to the east along strike from Maroon Cliffs adds further support for the potential of this area. This new target will be a key focus of exploration in 2023.
Although the target between Hexagon-Mercury and Jeff North has recently been identified through geologic mapping, and data from Eskay’s 2021 SkyTEM survey, its magnetic signature proves compelling (Figure 6). In addition to a bullseye-like magnetic anomaly visible when the tilt derivative is applied, this target is also associated with several shallow protrusions evident in the 3D magnetic susceptibility model. Such protrusions are distinct at Eskay Creek where they are associated with mineralization. Helipads were constructed in this area in September 2022 to allow access to this rugged area in 2023.
The TV-Jeff trend is associated with Eskay Creek-like magnetic anomalies (Figure 7), with the most prominent protrusions in the magnetic susceptibility model corresponding with areas of most intense Au and Ag mineralization. Notably, small protrusions in the magnetic susceptibility model between TV and Jeff correspond with anomalous Au and Ag values from sulfide rock chip samples and widely scattered drill holes. Eskay Mining’s technical team suspects the intensity of magnetic susceptibility anomalies may correlate with the intensity of VMS mineralization. This appears to be the case at TV which is associated with the most pronounced magnetic anomaly in the area (Figure 8). Importantly, this magnetic anomaly continues into un-drill tested areas to the south and west of TV suggesting that VMS mineralization likely extends to these regions. This TV extension will be explored in 2023.
The recently identified Scarlet-Tarn trend also appears to be associated with Eskay Creek-like magnetic anomalies (Figure 9). Extensive work in this area in 2021 and 2022 concluded that the Tarn Lake-Scarlet Knob area is underlain by the same rock units hosting the Eskay Creek deposit (e.g., the Eskay Rhyolite). High-grade Au and Ag anomalies associated with intense localized hydrothermal alteration were discovered through rock chip sampling and drilling. It was also determined that stratigraphic up is to the west meaning that the highly prospective Contact Mudstone horizon, host to the Eskay Creek deposit, is likely situated to the west of Tarn Lake. The observed trend of magnetic susceptibility anomalies extending to the west of Tarn Lake indicates this area could indeed host high-grade VMS mineralization similar to that at the Eskay Creek deposit. This area will be a primary focus of Eskay Mining’s 2023 exploration program.
Dr. Quinton Hennigh, P. Geo., a Director of the Company and its technical adviser, a qualified person as defined by National Instrument 43-101, has reviewed and approved the technical contents of this news release.
About Eskay Mining Corp:
Eskay Mining Corp (TSX-V:ESK) is a TSX Venture Exchange listed company, headquartered in Toronto, Ontario. Eskay is an exploration company focused on the exploration and development of precious and base metals along the Eskay rift in a highly prolific region of northwest British Columbia known as the “Golden Triangle,” 70km northwest of Stewart, BC. The Company currently holds mineral tenures in this area comprised of 210 claims (60255 hectares).
Neither the TSX Venture Exchange nor its Regulation Services Provider (as that term is defined in the policies of the TSX Venture Exchange) accepts responsibility for the adequacy or accuracy of this release.
Forward-Looking Statements: This Press Release contains forward-looking statements that involve risks and uncertainties, which may cause actual results to differ materially from the statements made. When used in this document, the words “may”, “would”, “could”, “will”, “intend”, “plan”, “anticipate”, “believe”, “estimate”, “expect” and similar expressions are intended to identify forward-looking statements. Such statements reflect our current views with respect to future events and are subject to risks and uncertainties. Many factors could cause our actual results to differ materially from the statements made, including those factors discussed in filings made by us with the Canadian securities regulatory authorities. Should one or more of these risks and uncertainties, such as actual results of current exploration programs, the general risks associated with the mining industry, the price of gold and other metals, currency and interest rate fluctuations, increased competition and general economic and market factors, occur or should assumptions underlying the forward looking statements prove incorrect, actual results may vary materially from those described herein as intended, planned, anticipated, or expected. We do not intend and do not assume any obligation to update these forward-looking statements, except as required by law. Shareholders are cautioned not to put undue reliance on such forward-looking statements.
MELVILLE, N.Y. – March 13, 2023–Comtech (NASDAQ: CMTL) recently secured multiple multi-million-dollar contracts for its ELEVATE platform to provide commercial and government customers with satellite cellular backhaul as well as telemetry data and video services over Low Earth Orbit and Geostationary Orbit constellations.
Under the contracts, Comtech will deliver up to 1,000 ELEVATE terminals this year to customers in six countries. Comtech ELEVATE is a platform designed to support multi-orbit constellations as well as the convergence of communications infrastructures.
“Comtech ELEVATE is one of the unique end-to-end technologies and services we are delivering to customers that will usher in a new era of democratized access to global connectivity,” said Ken Peterman, President and CEO, Comtech. “These contracts demonstrate the strong and growing demand for secure, adaptable, and scalable solutions that will be needed to close the digital divide and empower people across the globe with access to new technologies.”
Comtech ELEVATE provides connectivity over satellite as well as access over high capacity wireless networks. ELEVATE’s versatility can support emerging use cases that will enable the convergence of space-based applications in the United States as well as international markets.
About Comtech
Comtech Telecommunications Corp. is a leading global technology company providing terrestrial and wireless network solutions, next-generation 9-1-1 emergency services, satellite and space communications technologies, and cloud native capabilities to commercial and government customers around the world. Our unique culture of innovation and employee empowerment unleashes a relentless passion for customer success. With multiple facilities located in technology corridors throughout the United States and around the world, Comtech leverages our global presence, technology leadership, and decades of experience to create the world’s most innovative communications solutions.For more information, please visit www.comtech.com.
Forward-Looking Statements
Certain information in this press release contains statements that are forward-looking in nature and involve certain significant risks and uncertainties. Actual results and performance could differ materially from such forward-looking information. The Company’s Securities and Exchange Commission filings identify many such risks and uncertainties. Any forward-looking information in this press release is qualified in its entirety by the risks and uncertainties described in such Securities and Exchange Commission filings.
Interim Analysis of Registration-Enabling Phase 3 Fibromyalgia Trial of TNX-102 SL Expected Second Quarter 2023; Topline Data Expected Fourth Quarter 2023
Potentially Pivotal Phase 2 Trials of TNX-1900 in Chronic Migraine and TNX-601 ER in Depression Scheduled for Interim Analyses in Fourth Quarter 2023
Potentially Pivotal Phase 2 Fibromyalgia-Type Long COVID Study Enrolling
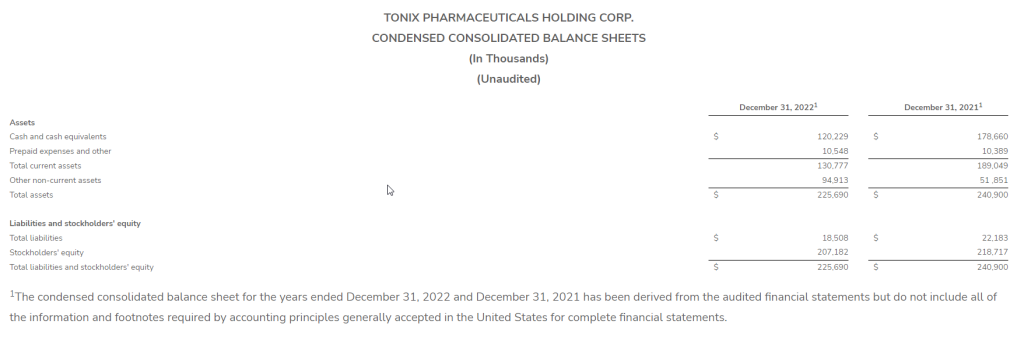
Cash and Cash Equivalents Totaled Approximately $120.2 Million at December 31, 2022
CHATHAM, N.J., March 13, 2023 (GLOBE NEWSWIRE) — Tonix Pharmaceuticals Holding Corp. (Nasdaq: TNXP) (Tonix or the Company), a clinical-stage biopharmaceutical company, today announced financial results for the fourth quarter and full year ended December 31, 2022, and provided an overview of recent operational highlights.
“Our clinical activity is at a high point in the Company’s history, and we believe it is setting the stage for a year of significant accomplishments across an expanded portfolio of novel pharmaceutical candidates designed to serve major unmet medical needs,” said Seth Lederman, M.D., Chief Executive Officer of Tonix.
“We are pleased with the progress of our current Phase 3 program in fibromyalgia, and we are looking forward to the results of a planned interim analysis due next quarter, followed by topline results in the fourth quarter of this year. If successful, we believe it will be the second and final adequate and well-controlled efficacy trial required for filing a New Drug Application (NDA) for approval by the U.S. Food and Drug Administration (FDA)”, he added. “Moreover, we believe we have satisfied all the other clinical and non-clinical requirements for an NDA.”
Dr. Lederman added, “Patients and caregivers alike report widespread dissatisfaction with the three currently approved drugs for fibromyalgia – Lyrica®, Cymbalta®, and Savella®, and generic pregabalin and duloxetine – switching back and forth between them, and too often taking off-label products, including addictive opiates. Fibromyalgia affects between six and 12 million adults in the U.S. according to the American Pain Association, and there hasn’t been a new FDA drug approval in the category in more than a dozen years.”
Dr Lederman continued, “Our recently expanded late-stage clinical programs include four potentially pivotal Phase 2 trials. Two are currently enrolling, one in Long COVID and the other in chronic migraine. The two others – one in depression and the other in cocaine intoxication – are due to start enrolling. We expect to initiate enrollment in the depression study by the end of March, followed by the cocaine intoxication study in the second quarter of this year.”
“In summary”, he concluded, “these programs, together with several others in earlier development, represent a diverse portfolio of programs with multiple opportunities for value creation in 2023 and beyond.”
Recent Highlights—Key Product Candidates*
Central Nervous System (CNS) Pipeline
TNX-102 SL (cyclobenzaprine HCl sublingual tablet): small molecule for the management of fibromyalgia (FM)
The first 50% of participants were randomized on December 19, 2022, in the RESILIENT study, a double-blind, randomized, placebo-controlled, potentially pivotal confirmatory Phase 3 study of TNX-102 SL for the management of fibromyalgia. Results from a planned interim analysis are expected in the second quarter of 2023, with topline results expected in the fourth quarter of 2023. A positive topline outcome, together with results from the previous positive Phase 3 RELIEF study, would support submission of an NDA.
TNX-102 SL for the treatment of Fibromyalgia-Type Long COVID, also known as Post-Acute Sequelae of COVID-19 (PASC)
Enrollment continues in the PREVAIL study, a potentially pivotal Phase 2 study of TNX-102 SL for fibromyalgia-type Long COVID.
During a February 2023 virtual event co-hosted by BIO and Solve M.E. titled, “Long COVID: What Will it Take to Accelerate Therapeutic Progress?”, the Company presented its analysis that the majority of Long COVID patients present with a constellation of symptoms called nociplastic pain that overlap with fibromyalgia, and Chronic Fatigue Syndrome/Myalgic Encephalomyelitis (CFS/ME) and that fibromyalgia-type Long COVID appears to be one of several chronic overlapping pain conditions (COPCs) that are related by sharing the neurological process called central sensitization.
TNX-1900 (intranasal potentiated oxytocin): small peptide for migraine, craniofacial pain, insulin resistance and related disorders, and obesity-associated binge eating disorder
In February 2023, Tonix announced that enrollment began in the potentially pivotal Phase 2 PREVENTION study of TNX-1900 for the prevention of migraine headache in chronic migraineurs. The double-blind, placebo-controlled study has a target enrollment of 300 participants at approximately 25 sites across the U.S. Results from a planned interim analysis after the first 50% of enrolled patients have completed the study are expected in the fourth quarter of 2023.
In January 2023, data from clinical and nonclinical studies were presented at the 16th Annual Headache Cooperative of the Pacific (HCOP) Winter Conference by collaborator Professor David Yeomans. The oral presentation titled, “Primary vs Secondary Sex Hormones and Migraine,” includes research sponsored by and licensed by Tonix. Preliminary results from a positron emission tomography (PET) study in humans showed that intranasal application of a radioisotope of magnesium-potentiated oxytocin is delivered to the trigeminal ganglia which have known roles in migraine headaches. In addition, preliminary results of data collected from isolated human trigeminal ganglia neurons in vitro show co-expression of oxytocin receptors and calcitonin gene-related peptide (CGRP), which are believed to represent the first observation of oxytocin receptors in human trigeminal ganglia. Furthermore, the presentation highlights data which suggest a sex difference in oxytocin potency.
Tonix announced data from an in vitro study describing the impact of oxytocin on isolated human sensory neurons, presented by collaborator Professor David Yeomans at Neuroscience 2022, the annual meeting of the Society for Neuroscience. The poster, titled “In Vitro Impact of Oxytocin on Human Sensory Neurons,” is the first to show that oxytocin receptors are present on human sensory neurons and that inflammation drives expression of oxytocin receptors on these neurons. The results of this study are consistent with data from animal models and provide support for the use of oxytocin for the treatment of pain.
An investigator-initiated Phase 2 study of TNX-1900 in obesity-associated binge eating disorder is expected to start enrolling in the second quarter of 2023 directed by principal investigator Professor Elizabeth Lawson at the Massachusetts General Hospital, a teaching hospital of Harvard Medical School.
TNX-601 ER (tianeptine hemioxalate extended-release tablets): a once-daily orally-administered small molecule for the treatment of major depressive disorder (MDD), Posttraumatic Stress Disorder (PTSD), and neurocognitive dysfunction associated with corticosteroid use.
Enrollment is expected to initiate in the first quarter of 2023 in the potentially pivotal Phase 2 ‘UPLIFT’ Study for the treatment of MDD. Results from planned interim analysis after the first 50% of enrolled patients have completed the study are expected fourth quarter 2023.
TNX-601 ER represents a novel approach to treating depression in the U.S., since the active ingredient tianeptine induces a neuroprotective and resilient phenotype in both neurons and microglia under conditions of stress. In contrast, antidepressants that are marketed in the U.S. act by modulating neurotransmitter levels or receptor binding in the synapse. The Phase 2 UPLIFT study is a double-blind, randomized, multicenter, placebo-controlled study to evaluate the efficacy and safety of TNX-601 ER taken orally once-daily for 6 weeks to treat MDD. It is a parallel design study with two arms, a TNX-601 ER 39.4 mg arm and a placebo arm. A total of 300 participants will be randomized in a 1:1 ratio into the two arms across approximately 30 U.S. sites, enrolling adult patients 18-65 years old with a DSM-5 diagnosis of depression and a duration for the current major depressive episode (MDE) of at least 12 weeks. The primary efficacy endpoint is mean change from baseline in the Montgomery-Åsberg Depression Rating Scale (MADRS) total score at Week 6. Key secondary efficacy endpoints include the Clinical Global Impression of Severity Scale (CGI-S) and the Sheehan Disability Scale (SDS).
Tonix expects to initiate a new, potentially pivotal, Phase 2 clinical study of TNX-1300 for the treatment of cocaine intoxication in the second quarter of 2023, pending agreement with the FDA on trial design.
As previously mentioned, in 2022, Tonix received a Cooperative Agreement grant from the National Institute on Drug Abuse (NIDA), part of the National Institutes of Health (NIH), to support development of TNX-1300.
TNX-1300 has been granted Breakthrough Therapy designation by the FDA.
Rare Disease Pipeline
TNX-2900 (intranasal potentiated oxytocin): small peptide for the treatment of Prader-Willi syndrome (PWS)
TNX-2900 has been granted Orphan Drug designation from the FDA for the treatment of PWS.
As previously mentioned, in 2022, Tonix delivered a presentation titled, “TNX-2900 (Intranasal Oxytocin + Magnesium) in Development for the Treatment of Hyperphagia in Adolescents and Young Adults with Prader-Willi Syndrome” at the World Orphan Drug Congress USA.
Immunology Pipeline
TNX-1500 (anti-CD40L monoclonal antibody): third generation anti-CD40L monoclonal antibody for prophylaxis of organ transplant rejection and treatment of autoimmune disorders.
A First-in-Human Phase 1 study is expected to start in the second quarter of 2023 of TNX-1500 for prophylaxis of organ rejection in adult patients receiving a kidney transplant.
In February 2023, Tonix announced a research agreement with the University of Maryland, Baltimore, to study and assess the role of TNX-1500 in the prevention of heart xenograft rejection. The genetically engineered pig donors will be provided by the Revivicor Division of United Therapeutics Corporation. Preclinical xenotransplantation studies are expected to support an IND application.
Tonix announced a research agreement with Boston Children’s Hospital to study TNX-1500 for the prevention of graft-versus-host diseases (GvHD) after hematopoietic stem cell transplantation (HCT) in animals. HCT from unrelated donors is a component of the treatment protocol for several hematologic malignancies, but GvHD complicates treatment and limits the success of engraftment after HCT.
Infectious Disease Pipeline
TNX-801 (live horsepox virus vaccine for percutaneous administration): vaccine to protect against smallpox and mpox designed as a single-administration vaccine to elicit T cell immunity
A Phase 1 study in is expected to start in the second half of 2023.
Tonix presented a development update from the Company’s TNX-801 vaccine program in an oral presentation at the World Vaccine and Immunotherapy Congress on December 1, 2022. The oral presentation titled, “Live Virus Smallpox and Monkeypox Vaccine,” describes the history of live virus vaccines and rationale for the development of the Company’s Recombinant Pox Virus (RPV) platform, including TNX-801 to protect against mpox and smallpox. Non-human primates vaccinated with TNX-801 were fully protected with sterilizing immunity from a lethal challenge with intra-tracheal monkeypox.
A publication describing the activity of TNX-801 to protect non-human primates against a lethal challenge with intra-tracheal monkeypox was published in the peer-reviewed journal, Viruses (Noyce RS, et al. “Single Dose of Recombinant Chimeric Horsepox Virus (TNX-801) Vaccination Protects Macaques from Lethal Monkeypox Challenge.” Viruses. 2023 Jan 26;15(2):356. doi: 10.3390/v15020356. PMID: 36851570; PMCID: PMC9965234.)
*All of Tonix’s product candidates are investigational new drugs or biologics and none have been approved for any indication.
Recent Highlights—Corporate and Other
In February 2023, Tonix announced the appointment of R. Newcomb Stillwell to its Board of Directors, effective March 15, 2023. Mr. Stillwell is a retired partner at Ropes & Gray LLP, an international law firm, where he devoted approximately 38 years.
In February 2023, Tonix announced that it has exercised an option to obtain an exclusive license from Columbia University for the development of a portfolio of fully human (TNX-3600) and murine (TNX-4100) monoclonal antibodies for the treatment or prophylaxis of SARS-CoV-2 infection. The licensed monoclonal antibodies were developed as part of a research collaboration and option agreement between Tonix and Columbia University, originally announced in 2020.
In February 2023, Tonix announced the acquisition of a preclinical portfolio of next-generation antiviral technology assets from Healion Bio, Inc. (Healion). Healion’s drug portfolio includes a class of broad-spectrum small molecule oral antiviral drug candidates including TNX-3900, formerly known as HB-121, which are cathepsin protease inhibitors, some of which have activity in vitro against SARS-CoV-2.
On January 26, 2023, data from Tonix’s research collaboration with The University of Alberta were presented by Tom Hobman, Ph.D., Professor of Cell Biology, University of Alberta, during a presentation at the 2nd Wnt/β-catenin Targeted Drug Development Conference. The oral presentation titled, “Targeting the Wnt/β-catenin pathway as a broad-spectrum antiviral strategy,” includes research sponsored by Tonix Pharmaceuticals focused on the development and testing of Wnt/β-catenin signaling pathway inhibitors as broad-spectrum antivirals against SARS-CoV-2 and other emerging viruses.
In January 2023, Tonix announced the publication of a paper entitled, “Development of a rapid image-based high-content imaging screening assay to evaluate therapeutic antibodies against the monkeypox virus,” in the journal Antiviral Research. The publication describes the development and optimization of two high-content image-based assays that were employed to screen for potential therapeutic antibodies against the monkeypox virus using surrogate poxviruses such as vaccinia virus. The article highlights Tonix’s TNX-3400 platform, which includes antibodies to potentially prevent or treat mpox and smallpox. These data represent the first wave of research and development conducted at the Company’s Infectious Disease R&D Center (RDC) in Frederick, Md. (Kota KP, et al., “Development of a rapid image-based high-content imaging screening assay to evaluate therapeutic antibodies against the monkeypox virus.” Antiviral Res. 2023 Feb;210:105513. doi: 10.1016/j.antiviral.2022.105513. Epub 2022 Dec 30. PMID: 36592670; PMCID: PMC9803393.)
In January 2023, Tonix announced the appointment of Zeil Rosenberg, M.D., M.P.H. as its new Executive Vice President, Medical.
Tonix announced data from its fully human anti-SARS-CoV-2 monoclonal antibody platform in an oral presentation at the World Antiviral Congress 2022. The presentation titled, “Platform for Generating Fully Human anti-SARS-CoV-2 Spike Therapeutic Monoclonal Antibodies” highlights the need for a broad array of monoclonal antibodies which can be scaled up quickly and potentially combined with other monoclonal antibodies to treat or prevent COVID-19. The platform is part of a broader research collaboration and option agreement with scientists at Columbia University designed to fill in important gaps in understanding the detailed immune responses to COVID-19, and to provide a foundation upon which to target vaccines and therapeutics to appropriate individuals by precision medicine.
In December 2022, Tonix announced that it has obtained an exclusive license from Curia Global, Inc., a leading contract research, development and manufacturing organization, for the development of three humanized murine monoclonal antibodies for the treatment or prophylaxis of SARS-CoV-2 infection, the cause of COVID-19. Immunocompromised individuals, including organ transplant recipients, are at increased risk of severe COVID-19 and poor clinical outcomes. SARS-CoV-2 has mutated to evade the existing FDA Emergency Use Authorization (EUA)-approved therapeutic monoclonal antibodies.
Recent Highlights—Financial
As of December 31, 2022, Tonix had $120.2 million of cash and cash equivalents, compared to $178.7 million as of December 31, 2021. Net proceeds from financing activities were approximately $87.8 million for full year 2022, compared to $212.5 million for the full year 2021.
Since January 1, 2023, the Company repurchased 15,700,269 shares of common stock under a $12.5 million share purchase program at prices ranging from $0.44 to $1.38 for a gross aggregate cost of approximately $12.5 million.
In January 2023, the Board of Directors approved a new $12.5 million share repurchase program. Since January 1, 2023, the Company repurchased 1,000,000 shares of common stock under this share repurchase program at $1.14 for a gross aggregate cost of $1.1 million.
Cash used in operations was approximately $98.1 million for the full year 2022, compared to $75.6 million for the full year 2021. The increase in cash outlays was primarily due to an increase in research and development (R&D) and general and administrative (G&A) activities, described below.
Cash used by investing activities for the years ended December 31, 2022, and 2021 was approximately $48.1 million and $35.3 million, respectively, related to the purchase of property and equipment.
Fourth Quarter 2022 Financial Results
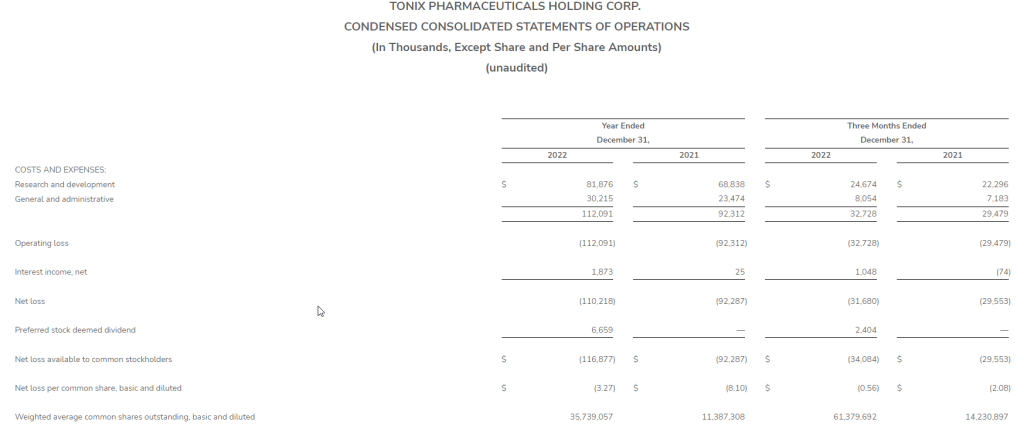
R&D expenses for the fourth quarter 2022 were $24.7 million, compared to $22.3 million for the same period in 2021. The increase is predominately due to increased employee-related, facility and laboratory expenses. We expect R&D expenses to increase during 2023 as we move our clinical development programs forward and invests in our development pipeline.
G&A expenses for the fourth quarter 2022 were $8.1 million, compared to $7.3 million for the same period in 2021. The increase is primarily due to increased employee-related and financial reporting expenses.
Net loss available to common stockholders was $34.1 million, or $0.56 per share, basic and diluted, for the fourth quarter 2022, compared to net loss of $29.6 million, or $2.08 per share, basic and diluted, for the same period in 2021. The basic and diluted weighted average common shares outstanding for the fourth quarter 2022 was 61,379,692 compared to 14,230,897 shares for the same period in 2021.
Full Year 2022 Financial Results
R&D expenses for the full year 2022 were $81.9 million, compared to $68.8 million for the same period in 2021. The increase is predominately due to increased employee-related, facility and laboratory expenses. We expect R&D expenses to increase during 2023 as we move our clinical development programs forward and invest in our development pipeline.
G&A expenses for the full year 2022 were $30.2 million, compared to $23.5 million for the same period in 2021. The increase is primarily due to increased employee-related and financial reporting expenses.
Net loss available to common stockholders was $116.9 million, or $3.27 per share, basic and diluted, for the full year 2022, compared to net loss of $92.3 million, or $8.10 per share, basic and diluted, for the same period in 2021. The basic and diluted weighted average common shares outstanding for full year 2022 was 35,739,057 compared to 11,387,308 shares for the same period in 2021.
Tonix Pharmaceuticals Holding Corp.*
Tonix is a clinical-stage biopharmaceutical company focused on discovering, licensing, acquiring and developing therapeutics to treat and prevent human disease and alleviate suffering. Tonix’s portfolio is composed of central nervous system (CNS), rare disease, immunology and infectious disease product candidates. Tonix’s CNS portfolio includes both small molecules and biologics to treat pain, neurologic, psychiatric and addiction conditions. Tonix’s lead CNS candidate, TNX-102 SL (cyclobenzaprine HCl sublingual tablet), is in mid-Phase 3 development for the management of fibromyalgia with a new Phase 3 study launched in the second quarter of 2022 and interim data expected in the second quarter of 2023. TNX-102 SL is also being developed to treat fibromyalgia-type Long COVID, a chronic post-acute COVID-19 condition. Tonix initiated a Phase 2 study in Long COVID in the third quarter of 2022. TNX-1900 (intranasal potentiated oxytocin), a small molecule in development for chronic migraine, is being studied in a potential pivotal Phase 2 study that initiated enrollment in the first quarter of 2023 and for which interim data is expected in the fourth quarter of 2023. TNX-601 ER (tianeptine hemioxalate extended-release tablets) is a once-daily formulation of tianeptine being developed as a potential treatment for major depressive disorder (MDD) with a Phase 2 study expected to be initiated in the first quarter of 2023. TNX-1300 (cocaine esterase) is a biologic designed to treat cocaine intoxication and has been granted Breakthrough Therapy designation by the FDA. A Phase 2 study of TNX-1300 is expected to be initiated in the second quarter of 2023. Tonix’s rare disease portfolio includes TNX-2900 (intranasal potentiated oxytocin) for the treatment of Prader-Willi syndrome. TNX-2900 has been granted Orphan Drug designation by the FDA. Tonix’s immunology portfolio includes biologics to address organ transplant rejection, autoimmunity and cancer, including TNX-1500, which is a humanized monoclonal antibody targeting CD40-ligand (CD40L or CD154) being developed for the prevention of allograft and xenograft rejection and for the treatment of autoimmune diseases. A Phase 1 study of TNX-1500 is expected to be initiated in the second quarter of 2023. Tonix’s infectious disease pipeline includes a vaccine in development to prevent smallpox and mpox, TNX-801; a next-generation vaccine to prevent COVID-19, TNX-1850; a platform to make fully human and murine monoclonal antibodies to treat COVID-19, TNX-3600 and TNX-4100, respectively; and humanized anti-SARS-CoV-2 monoclonal antibodies, TNX-3800; and a class of broad-spectrum small molecule oral antivirals, TNX-3900. TNX-801, Tonix’s vaccine in development to prevent smallpox and mpox, also serves as the live virus vaccine platform or recombinant pox vaccine (RPV) platform for other infectious diseases. A Phase 1 study of TNX-801 is expected to be initiated in the second half of 2023.
*All of Tonix’s product candidates are investigational new drugs or biologics and have not been approved for any indication.
This press release and further information about Tonix can be found at www.tonixpharma.com.
Forward Looking Statements
Certain statements in this press release are forward-looking within the meaning of the Private Securities Litigation Reform Act of 1995. These statements may be identified by the use of forward-looking words such as “anticipate,” “believe,” “forecast,” “estimate,” “expect,” and “intend,” among others. These forward-looking statements are based on Tonix’s current expectations and actual results could differ materially. There are a number of factors that could cause actual events to differ materially from those indicated by such forward-looking statements. These factors include, but are not limited to, risks related to the failure to obtain FDA clearances or approvals and noncompliance with FDA regulations; delays and uncertainties caused by the global COVID-19 pandemic and social and economic unrest; risks related to the timing and progress of clinical development of our product candidates; our need for additional financing; uncertainties of patent protection and litigation; uncertainties of government or third party payor reimbursement; limited research and development efforts and dependence upon third parties; and substantial competition. As with any pharmaceutical under development, there are significant risks in the development, regulatory approval and commercialization of new products. Tonix does not undertake an obligation to update or revise any forward-looking statement. Investors should read the risk factors set forth in the Annual Report as filed with the Securities and Exchange Commission (the “SEC”) and periodic reports filed with the SEC on or after the date thereof. All of Tonix’s forward-looking statements are expressly qualified by all such risk factors and other cautionary statements. The information set forth herein speaks only as of the date thereof.
Company to Host Investor Conference Call for 2022 Q4 and Full-Year Financial Results on March 29, 2023
TORONTO–(BUSINESS WIRE)– Sierra Metals Inc. (TSX: SMT) (“Sierra Metals” or the “Company”) announced today that the Company, Banco de Credito del Peru and Banco Santander S.A. (together, the “Lenders”) are engaged in advanced discussions on terms to refinance $18,750,000 of the $25,000,000 principal debt repayment obligations that are due in 2023 under the Company’s senior secured credit facility. All figures in this news release are stated in U.S. dollars.
The parties intend to formalize the refinancing contract prior to the due date of the second quarterly principal installment on June 8, 2023, subject to, among other things, the completion of due diligence.
The Lenders have agreed to provide a bridge loan of $6,250,000 to refinance the first quarter 2023 amortization payment, due on March 8, 2023, while the refinancing contract for the balance of the 2023 payments is being finalized.
2022 Financial Results
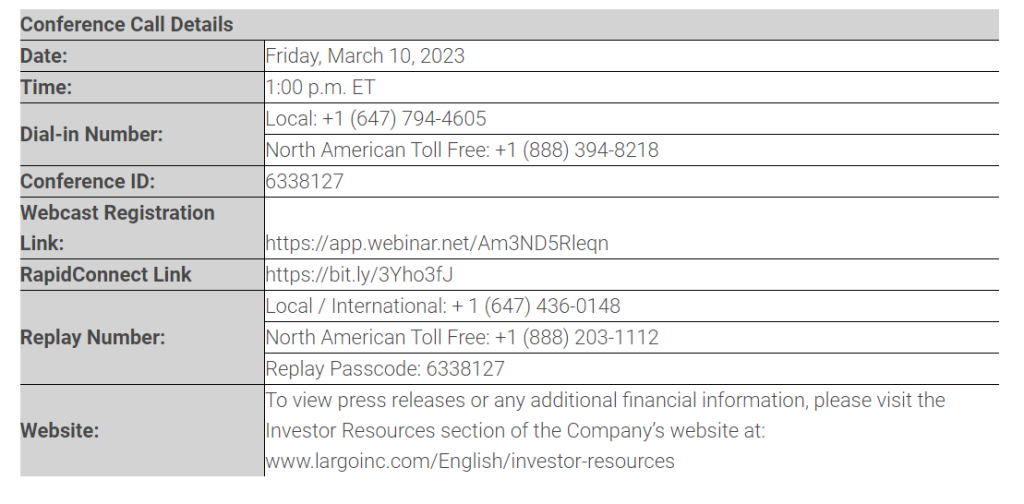
Sierra Metals also announced a revised date of March 28, 2023 for the expected filing of its financial and operating results for the year ended December 31, 2022. The Company’s senior management team will host a conference call on Wednesday, March 29, 2023, at 11:00 AM EDT to discuss the results. The call may be accessed as follows.
The webcast, along with presentation slides, will be archived for 180 days on www.sierrametals.com.
Via phone:
For those who prefer to listen by phone, dial-in instructions are below. To ensure your participation, please call approximately five minutes prior to the scheduled start time of the call.
Canada dial-in number (Toll Free): 1 833 950 0062 Canada dial-in number (Local): 1 226 828 7575 US dial-in number (Toll Free): 1 844 200 6205 US dial-in number (Local): 1 646 904 5544 All other locations: +1 929 526 1599
Access code: 077974
Press *1 to ask a question, *2 to withdraw your question, or *0 for operator assistance.
About Sierra Metals
Sierra Metals is a diversified Canadian mining company with Green Metal exposure including copper production and base metal production with precious metals byproduct credits, focused on the production and development of its Yauricocha Mine in Peru, and Bolivar and Cusi Mines in Mexico. The Company is focused on increasing production volume and growing mineral resources. The Company also has large land packages at all three mines with several prospective regional targets providing longer-term exploration upside and mineral resource growth potential. For further information regarding Sierra Metals, please visit www.sierrametals.com.
This press release contains forward-looking information within the meaning of Canadian and United States securities legislation. Forward-looking information relates to future events or the anticipated performance of Sierra and reflect management’s expectations or beliefs regarding such future events and anticipated performance based on an assumed set of economic conditions and courses of action. In certain cases, statements that contain forward-looking information can be identified by the use of words such as “plans”, “expects”, “is expected”, “budget”, “scheduled”, “estimates”, “forecasts”, “intends”, “anticipates”, “believes” or variations of such words and phrases or statements that certain actions, events or results “may”, “could”, “would”, “might”, or “will be taken”, “occur” or “be achieved” or the negative of these words or comparable terminology. Forward-looking statements include those relating to formalizing the refinancing contract and the timeline related thereto and the timing of senior management’s conference call to discuss the Company’s financial and operating results for the year ended December 31, 2022. By its very nature forward-looking information involves known and unknown risks, uncertainties and other factors that may cause actual performance of Sierra to be materially different from any anticipated performance expressed or implied by such forward-looking information.
Forward-looking information is subject to a variety of risks and uncertainties, which could cause actual events or results to differ from those reflected in the forward-looking information, including, without limitation, the risks described under the heading “Risk Factors” in the Company’s annual information form dated March 16, 2022 for its fiscal year ended December 31, 2021 and other risks identified in the Company’s filings with Canadian securities regulators and the SEC, which filings are available at www.sedar.com and www.sec.gov, respectively.
The risk factors referred to above are not an exhaustive list of the factors that may affect any of the Company’s forward-looking information. Forward-looking information includes statements about the future and is inherently uncertain, and the Company’s actual achievements or other future events or conditions may differ materially from those reflected in the forward-looking information due to a variety of risks, uncertainties and other factors. The Company’s statements containing forward-looking information are based on the beliefs, expectations, and opinions of management on the date the statements are made, and the Company does not assume any obligation to update such forward-looking information if circumstances or management’s beliefs, expectations or opinions should change, other than as required by applicable law. For the reasons set forth above, one should not place undue reliance on forward-looking information.
Investor Relations Sierra Metals Inc. Tel: +1 (416) 366-7777 Email: info@sierrametals.com
SVB Invested in the Entire Bubble of Everything Says, Renowned Economist
“SVB invested in the entire bubble of everything,” writes Daniel Lacalle, PhD, economist, fund manager,and once ranked as one of the top twenty most influential economists in the world (2016 and 2017). He explains in his article below the pathway the Silicon Valley bank took and “bets,” which it lost, that led to the bank’s quick demise. “Aaaaand it’s gone,” Lacalle says, borrowing a line from a South Park episode that originally aired in March 2009. – Paul Hoffman, Managing Editor, Channelchek
The second-largest collapse of a bank in recent history after Lehman Brothers could have been prevented. Now the impact is too large, and the contagion risk is difficult to measure.
The demise of the Silicon Valley Bank (SVB) is a classic bank run driven by a liquidity event, but the important lesson for everyone is that the enormity of the unrealized losses and the financial hole in the bank’s accounts would not have existed if not for ultra-loose monetary policy. Let me explain why.
As of December 31, 2022, Silicon Valley Bank had approximately $209.0 billion in total assets and about $175.4 billion in total deposits, according to their public accounts. Their top shareholders are Vanguard Group (11.3 percent), BlackRock (8.1 percent), State Street (5.2 percent) and the Swedish pension fund Alecta (4.5 percent).
The incredible growth and success of SVB could not have happened without negative rates, ultra-loose monetary policy, and the tech bubble that burst in 2022. Furthermore, the bank’s liquidity event could not have happened without the regulatory and monetary policy incentives to accumulate sovereign debt and mortgage-backed securities (MBS).
SVB’s asset base read like the clearest example of the old mantra “Don’t fight the Fed.” SVB made one big mistake: follow exactly the incentives created by loose monetary policy and regulation.
What happened in 2021? Massive success that, unfortunately, was also the first step to demise. The bank’s deposits nearly doubled with the tech boom. Everyone wanted a piece of the unstoppable new tech paradigm. SVB’s assets also rose and almost doubled.
The bank’s assets rose in value. More than 40 percent were long-dated Treasurys and MBS. The rest were seemingly world-conquering new tech and venture capital investments.
Most of those “low risk” bonds and securities were held to maturity. SVB was following the mainstream rulebook: low-risk assets to balance the risk in venture capital investments. When the Federal Reserve raised interest rates, SVB must have been shocked.
Its entire asset base was a single bet: low rates and quantitative easing for longer. Tech valuations soared in the period of loose monetary policy, and the best way to “hedge” that risk was with Treasurys and MBS. Why bet on anything else? This is what the Fed was buying in billions every month. These were the lowest-risk assets according to all regulations, and, according to the Fed and all mainstream economists, inflation was purely “transitory,” a base-effect anecdote. What could go wrong?
Inflation was not transitory, and easy money was not endless.
Rate hikes happened. And they caught the bank suffering massive losses everywhere. Goodbye, bonds and MBS prices. Goodbye, “new paradigm” tech valuations. And hello, panic. A good old bank run, despite the strong recovery of SVB shares in January. Mark-to-market unrealized losses of $15 billion were almost 100 percent of the bank’s market capitalization. Wipeout.
As the bank manager said in the famous South Park episode: “Aaaaand it’s gone.” SVB showed how quickly the capital of a bank can dissolve in front of our eyes.
The Federal Deposit Insurance Corporation (FDIC) will step in, but that is not enough because only 3 percent of SVB deposits were under $250,000. According to Time magazine, more than 85 percent of Silicon Valley Bank’s deposits were not insured.
It gets worse. One-third of US deposits are in small banks, and around half are uninsured, according to Bloomberg. Depositors at SVB will likely lose most of their money, and this will also create significant uncertainty in other entities.
SVB was the poster boy of banking management by the book. They followed a conservative policy of acquiring the safest assets—long-dated Treasury bills—as deposits soared.
SVB did exactly what those that blamed the 2008 crisis on “deregulation” recommended. SVB was a boring, conservative bank that invested its rising deposits in sovereign bonds and mortgage-backed securities, believing that inflation was transitory, as everyone except us, the crazy minority, repeated.
SVB did nothing but follow regulation, monetary policy incentives, and Keynesian economists’ recommendations point by point. SVB was the epitome of mainstream economic thinking. And mainstream killed the tech star.
Many will now blame greed, capitalism, and lack of regulation, but guess what? More regulation would have done nothing because regulation and policy incentivize buying these “low risk” assets. Furthermore, regulation and monetary policy are directly responsible for the tech bubble. The increasingly elevated valuations of unprofitable tech and the allegedly unstoppable flow of capital to fund innovation and green investments would never have happened without negative real rates and massive liquidity injections. In the case of SVB, its phenomenal growth in 2021 was a direct consequence of the insane monetary policy implemented in 2020, when the major central banks increased their balance sheet to $20 trillion as if nothing would happen.
SVB is a casualty of the narrative that money printing does not cause inflation and can continue forever. They embraced it wholeheartedly, and now they are gone.
SVB invested in the entire bubble of everything: Sovereign bonds, MBS, and tech. Did they do it because they were stupid or reckless? No. They did it because they perceived that there was very little to no risk in those assets. No bank accumulates risk in an asset it believes is high risk. The only way in which banks accumulate risk is if they perceive that there is none. Why do they perceive no risk? Because the government, regulators, central banks, and the experts tell them there is none. Who will be next?
Many will blame everything except the perverse incentives and bubbles created by monetary policy and regulation, and they will demand rate cuts and quantitative easing to solve the problem. It will only worsen. You do not solve the consequences of a bubble with more bubbles.
The demise of Silicon Valley Bank highlights the enormity of the problem of risk accumulation by political design. SVB did not collapse due to reckless management, but because they did exactly what Keynesians and monetary interventionists wanted them to do. Congratulations.
Lacalle was ranked as one of the top twenty most influential economists in the world in 2016 and 2017 by Richtopia. He holds the CIIA financial analyst title, with a postgraduate degree in higher business studies and a master’s degree in economic investigation.
The Power of Small Companies Highlighted in Today’s Biopharma Announcements
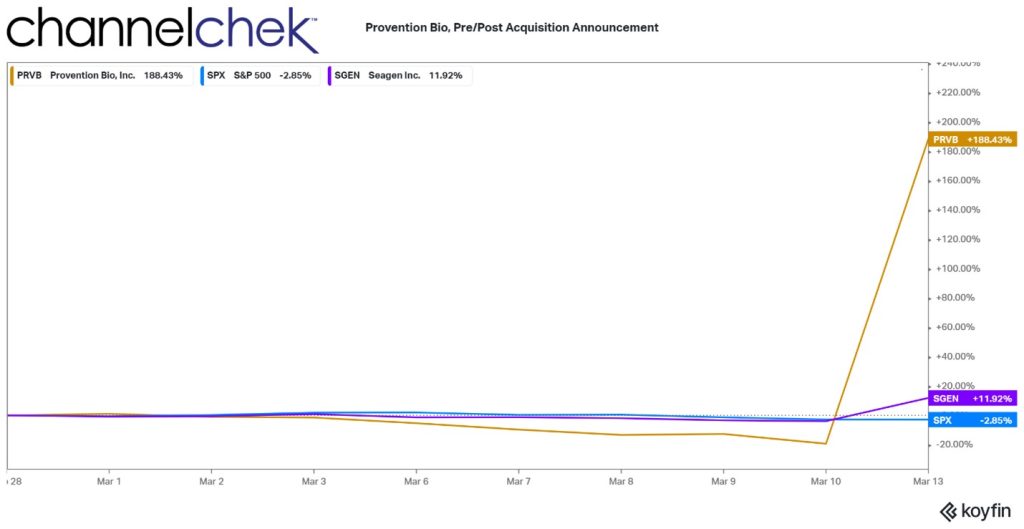
Business headlines surrounding Silicon Valley Bank and its customers may take some time to fade from the front page. In the meantime, looking past them, there are some positive news and developments. Two news items involve announcements by biotech/pharmaceutical companies this week. One is a deal you don’t have to dig too deep to find, Pfizer (PFE), the pharmaceutical behemoth, is looking to acquire Seagen (SGEN) for $43 billion. The second is a smaller deal and has been crowded off many newsfeeds. Provention Bio (PRVB) is expected to be purchased by Sanofi (SNY) a large French-based pharmaceutical company.
Seagen shares increased 17% in the first hour of trading after the Pfizer announcement, shares of Provention were up 258% the same morning after the Sanofi announcement. Below is a chart of the month-to-date performance of the two that are to be acquired.
Seagen is a borderline household name and has been a known acquisition target for some time. Just last July, Merck offered 40 billion for the company, this known interest in the company has kept the price elevated. Shifting the focus on the power of smaller, less talked about companies, they often have more potential for larger gains because they are less known. And while the numbers ($43 billion vs $2.9 billion) don’t make for compelling headlines, the numbers in the graph above demonstrate the impact can be far more compelling to investors.
The Provention Bio Deal
Sanofi and Provention Bio, a U.S.-based, publicly traded biopharmaceutical company focused on preventing autoimmune diseases, including type 1 diabetes (T1D), entered into an agreement for Sanofi to acquire Provention Bio, Inc., for $25.00 per share in cash.
Under the terms of the agreement, Sanofi will begin a cash tender offer to acquire all outstanding shares of Provention Bio.
The actual completion of the tender is subject to standard conditions, including the tendering of a number of shares of Provention Bio, Inc. common stock that, together with shares already owned by Sanofi or its affiliates, represents at least a majority of the outstanding shares of Provention Bio, Inc. common stock.
If the tender offer is successfully completed, then a wholly owned subsidiary of Sanofi will merge with and into Provention Bio, Inc., and all of the outstanding Provention shares that are not tendered in the offer will be converted into the right to receive the same $25.00 per share in cash offered to Provention Bio, Inc. shareholders as part of the offer. Sanofi plans to fund the transaction with available cash. Subject to the satisfaction or waiver of customary closing conditions, Sanofi expects to complete the acquisition in the second quarter of 2023.
Worth Noting
The largest pharmaceutical companies developed huge cash “war chests” during the pandemic era. While they are prudent and tactical when deciding to grow through acquisition, the earnings on much of their cash stockpiles relative to inflation may be erosive to the pool’s purchasing power. Additionally, many small pharmaceutical and biotech companies that are developing tomorrow’s next wonder drugs are short the cash they need to drive their R&D to the finish line, and then to market. It’s presumed these companies are quietly being reviewed for a possible fit by big pharma. Big pharma’s current patents are also being eroded by time as each day they approach patent expiration. This is added incentive for these large companies to be actively looking for future merger and acquisition targets.
Smaller companies, for their part want their progress and potential more known. It is only through being known, and the more broadly the better, that investors of all types understand the work they do and the potential along with the risk they hold. These companies often hire the service of impartial, highly credible equity analysts to provide details of the pipeline and the successes and challenges of the company. This company-sponsored research provides investors with a third-party window into the company. The window is, at times, as basic as the idea that investors need to know enough about the existence of a small company to want to own shares. Greater investor interest typically increases liquidity which could help the company continue moving forward and developing its products.
Joe Gomes, Managing Director – Generalist Analyst, Noble Capital Markets, Inc.
Joshua Zoepfel, Research Associate, Noble Capital Markets, Inc.
Refer to the full report for the price target, fundamental analysis, and rating.
New Awards. On Friday, Orion announced multiple contract awards since the beginning of 2023. Totaling $134 million across both businesses, the majority of the work is expected to be completed in 2023. Since the beginning of the year, the Concrete segment has been awarded $100 million across several contracts including $25 million for a 22-story high-rise building in Houston, $12 million for a Dallas hospital, and $10 million for a Dallas packaging center. The Marine segment was awarded the Company’s largest diving services contract of $20 million by a private client. The project is in support of the US Army Corps of Engineers’ ongoing deepening and widening of Gulf Coast shipping channels. The contract award is the largest diving contract in Orion’s history and will be completed by the end of 2023.
Executive Chairman Transition. Former CEO Austin J. Shanfelter transitioned from Executive Chairman to Chairman of the Board of Directors, effective March 2, 2023. Recall, from April to September 2022, Mr. Shanfelter assumed the roles of Interim Chief Executive Officer and Interim Chief Financial Officer until Travis Boone, Chief Executive Officer, and Scott Thanisch, Chief Financial Officer, were appointed in September 2022.
Equity Research is available at no cost to Registered users of Channelchek. Not a Member? Click ‘Join’ to join the Channelchek Community. There is no cost to register, and we never collect credit card information.
This Company Sponsored Research is provided by Noble Capital Markets, Inc., a FINRA and S.E.C. registered broker-dealer (B/D).
*Analyst certification and important disclosures included in the full report. NOTE: investment decisions should not be based upon the content of this research summary. Proper due diligence is required before making any investment decision.
ISG (Information Services Group) (Nasdaq: III) is a leading global technology research and advisory firm. A trusted business partner to more than 700 clients, including more than 75 of the world’s top 100 enterprises, ISG is committed to helping corporations, public sector organizations, and service and technology providers achieve operational excellence and faster growth. The firm specializes in digital transformation services, including automation, cloud and data analytics; sourcing advisory; managed governance and risk services; network carrier services; strategy and operations design; change management; market intelligence and technology research and analysis. Founded in 2006, and based in Stamford, Conn., ISG employs more than 1,300 digital-ready professionals operating in more than 20 countries—a global team known for its innovative thinking, market influence, deep industry and technology expertise, and world-class research and analytical capabilities based on the industry’s most comprehensive marketplace data. For additional information, visit www.ISG-One.com
Joe Gomes, Managing Director – Generalist Analyst, Noble Capital Markets, Inc.
Joshua Zoepfel, Research Associate, Noble Capital Markets, Inc.
Refer to the full report for the price target, fundamental analysis, and rating.
Continuing the Trend. Like the previous quarter, the momentum for ISG has been positive in terms of demand for the Company’s digital services along with cost optimization services as companies are continuing to navigate a volatile economic environment. In addition, the Company had $108 million in recurring revenue for the year, exceeding the Company’s goal of $100 million, which brings along higher margins.
4Q Results. ISG reported revenues for the fourth quarter were a record $74.2 million, up 7% from $69.6 million in the prior year, and up 11% in constant currency. We estimated revenue at $71.0 million. Net income was a record $4.3 million, or diluted EPS of $0.09, compared to $3.6 million, or $0.07 per fully diluted share, in the prior year. Adjusted EBITDA was at a record $11.1 million, up 9% from the prior-year fourth quarter.
Equity Research is available at no cost to Registered users of Channelchek. Not a Member? Click ‘Join’ to join the Channelchek Community. There is no cost to register, and we never collect credit card information.
This Company Sponsored Research is provided by Noble Capital Markets, Inc., a FINRA and S.E.C. registered broker-dealer (B/D).
*Analyst certification and important disclosures included in the full report. NOTE: investment decisions should not be based upon the content of this research summary. Proper due diligence is required before making any investment decision.
Comtech Telecommunications Corp. engages in the design, development, production, and marketing of products, systems, and services for advanced communications solutions in the United States and internationally. It operates in three segments: Telecommunications Transmission, Mobile Data Communications, and RF Microwave Amplifiers. The Telecommunications Transmission segment provides satellite earth station equipment and systems, over-the-horizon microwave systems, and forward error correction technology, which are used in various commercial and government applications, including backhaul of wireless and cellular traffic, broadcasting (including HDTV), IP-based communications traffic, long distance telephony, and secure defense applications. The Mobile Data Communications segment provides mobile satellite transceivers, and computers and satellite earth station network gateways and associated installation, training, and maintenance services; supplies and operates satellite packet data networks, including arranging and providing satellite capacity; and offers microsatellites and related components. The RF Microwave Amplifiers segment designs, develops, manufactures, and markets satellite earth station traveling wave tube amplifiers (TWTA) and broadband amplifiers. Its amplifiers are used in broadcast and broadband satellite communication; defense applications, such as telecommunications systems and electronic warfare systems; and commercial applications comprising oncology treatment systems, as well as to amplify signals carrying voice, video, or data for air-to-satellite-to-ground communications. The company serves satellite systems integrators, wireless and other communication service providers, broadcasters, defense contractors, military, governments, and oil companies. Comtech markets its products through independent representatives and value-added resellers. The company was founded in 1967 and is headquartered in Melville, New York.
Joe Gomes, Managing Director – Generalist Analyst, Noble Capital Markets, Inc.
Joshua Zoepfel, Research Associate, Noble Capital Markets, Inc.
Refer to the full report for the price target, fundamental analysis, and rating.
2Q23 Results. Revenue of $133.7 million was up 2.0% sequentially, within guidance, and is the fifth consecutive quarter of growth. Y-o-Y revenue was up 11.1%. We were at $133.5 million. Adjusted EBITDA totaled $11.3 million, versus $9.8 million in 2Q22. We were at $11 million. Comtech reported a net loss of $6.5 million, or a loss of $0.23 per share, compared to a net loss of $23.5 million, or $0.89 per share last year. Adjusted EPS was $0.09 versus $0.18. We had forecast a net loss of $3.2 million, or a loss of $0.12 per share and adjusted EPS of $0.15.
Strong Bookings. Bookings remained strong in the fiscal second quarter at $167.5 million, up from $102.9 million in the year ago period. Quarter-end backlog was $702 million, up from $668.2 million at the end of the first quarter, and a level last seen in July 2019.
Equity Research is available at no cost to Registered users of Channelchek. Not a Member? Click ‘Join’ to join the Channelchek Community. There is no cost to register, and we never collect credit card information.
This Company Sponsored Research is provided by Noble Capital Markets, Inc., a FINRA and S.E.C. registered broker-dealer (B/D).
*Analyst certification and important disclosures included in the full report. NOTE: investment decisions should not be based upon the content of this research summary. Proper due diligence is required before making any investment decision.
The FDIC, no doubt, was working overtime this weekend trying to find a suitor for Silicon Valley Bank. The bank’s demise makes it the second-largest bank in US history to have not managed its risks well enough to survive. Investors, depositors, and other interested parties have been awakened and are now checking their own likelihood of overexposure to banks. Some of this exposure could be through investments in companies that had uninsured deposits at SVB.
One risk that may be impacting investors’ psyche now is recollections of 2008 and viewing last Friday’s bank closure as the canary (or Lehman Bros.) in the coal mine. Whether this is a singular incident or just the beginning of escalating problems remains to be seen. But investors tend to always look back on the most recent similar event then think “here we go again.” Important economic numbers aside, such as CPI on Tuesday, or Residential Construction on Thursday, the loudest news will be centered on SVB and whether the Fed will now pivot.
The Fed and regional Presidents have been in a blackout period since Saturday; this is normal leading up to an FOMC meeting (March 21-22). However, this blackout period has been partially breached with a joint statement between Fed Chair Powell and Treasury Secretary Yellen, who incidentally was his predecessor. Keep an eye on Channelchek news postings for more information on this statement.
Monday 3/13
No Economic numbers are to be released
Tuesday 3/14
6:00 AM ET, The Small Business Optimism index has been below the historical average of 98 for 13 months in a row. The small business optimism index comes a monthly survey that is by the National Federation of Independent Business (NFIB). The index is a composite of 10 seasonally adjusted components based on the following questions: plans to increase employment, plans to make capital outlays, plans to increase inventories, expect the economy to improve, expect real sales higher, current inventory, current job openings, expected credit conditions, now a good time to expand, and earnings trend.
8:30 AM ET, Consumer Price Index (CPI), investors now lay awake waiting for inflation reports. For February, core prices are expected to hold steady at an elevated 0.4 percent monthly gain, with overall prices also expected to rise 0.4 percent after January’s 0.5 percent rise. Annual rates, which in January were 6.4 percent overall and 5.6 percent for the core, are expected at 6.0 and 5.5 percent.
Wednesday 3/15
8:30 AM ET, Producer Price Index (PPI), this measure of wholesale inflation ought to be the second most market-impacting number of the week. After rising a sharper-than-expected 0.7 percent in January, producer prices in February are expected to slow to a monthly 0.3 percent. The annual rate in February is seen at 5.4 percent versus January’s 6.0 percent. February’s ex-food ex-energy rate is seen at 0.4 percent on the month and 5.2 percent on the year versus January’s 0.5 and 5.4 percent, both of which were also sharper than expected.
10:00 AM ET, The Housing Market Index jumped 4 points in January and another 7 points in February but further improvement, given a sharp rise in mortgage rates, is not expected for March where the consensus is a 1 point decline to 41.
10:00 AM ET, Business Inventories in January are expected to remain unchanged following 0.3 percent builds in both December and November. Rising inventories can be an indication of business optimism that sales will be growing in the coming months. By looking at the ratio of inventories to sales, investors can see whether production demands will expand or contract in the near future. On the other hand, if unintended inventory accumulation occurs then production will probably need to slow while current inventories are worked down. This is why business inventory data is a forward indicator.
10:00 AM ET, Atlanta Fed Business Inflation Expectations is was previously 2.9%. The percentage provides a monthly measure of year-ahead inflation expectations and inflation uncertainty from the perspective of firms. John Williams the President of the New York Fed will be speaking.
Thursday 3/16
8:30 AM ET, Housing Starts in February is expected to come in flat at 1.315 million. Permits that were 1.339 million in January, are also seen flat at 1.340 million.
8:30 AM ET, Jobless Claims for the March 11 week are expected to come in at 205,000 versus 211,000 in the prior week.
Friday 3/17
10:00 AM ET, Consumer Sentiment is expected to repeat at a depressed 67.0.
10:00 AM ET, the Index Leading Economic Indicators is expected to fall a further 0.2 percent in February. This index has been in severe decline though contraction did slow in January to minus 0.3 percent. It seldom moves markets as most of the components that make it up are already known.
What Else
The clock change ought to cause some traders to be more tired than normal. However, all will be looking to see the FDIC’s plans for SVB.
The markets have been a stock pickers market since January 2022. The consensus is that the stock indices will be weak after a strong January and bonds, according to the Fed itself, face strong monetary policy headwinds. Yet, inflation is high and therefore so are the detrimental erosive effects of price increases. So remaining in cash is like accepting a buying power loss.
For institutional or individual investors in New York or South Florida, there may be the opportunity to listen to the management of some interesting companies (no cost). The company that Michael Burry recently owned, GEO Group ($GEO) will be holding a luncheon roadshow in NYC on March 14. This is an interesting company with political policy headwinds and extreme historical positives. Get more information here on attending. Another interesting opportunity for investors to meet and question management of a company that doesn’t necessarily wilt with economic weakness is the breakfast (Boca Raton, FL) or lunch (Miami, FL) meetings with 1(800) FLOWERS ($FLWS). Register to see if there are still open seats here.
FDIC, Federal Reserve, and Treasury Issue Joint Statements on Silicon Valley Bank
In a joint statement released by Secretary of the Treasury Janet L. Yellen, Federal Reserve Board Chair Jerome H. Powell, and FDIC Chairman Martin J. Gruenberg, they announced actions they are now committed to taking to “protect the U.S. economy by strengthening public confidence in the banking system.” The actions are being taken to ensure that “the U.S. banking system continues to perform its vital roles of protecting deposits and providing access to credit to households and businesses in a manner that promotes strong and sustainable economic growth.”
Specifically, the actions directly impact two banks, Silicon Valley Bank in California and Signature Bank in New York, but it was made clear that it could be extended to other institutions. The joint news release reads, “After receiving a recommendation from the boards of the FDIC and the Federal Reserve and consulting with the President, Secretary Yellen approved actions enabling the FDIC to complete its resolution of Silicon Valley Bank, Santa Clara, California, in a manner that fully protects all depositors. Depositors will have access to all of their money starting Monday, March 13. No losses associated with the resolution of Silicon Valley Bank will be borne by the taxpayer.
In a second release by the three agencies, details were uncovered as to how this was designed to not impact depositors, with losses being borne by stockholders and debtholders. The release reads as follows:
“The additional funding will be made available through the creation of a new Bank Term Funding Program (BTFP), offering loans of up to one year in length to banks, savings associations, credit unions, and other eligible depository institutions pledging U.S. Treasuries, agency debt and mortgage-backed securities, and other qualifying assets as collateral. These assets will be valued at par. The BTFP will be an additional source of liquidity against high-quality securities, eliminating an institution’s need to quickly sell those securities in times of stress.
With approval of the Treasury Secretary, the Department of the Treasury will make available up to $25 billion from the Exchange Stabilization Fund as a backstop for the BTFP. The Federal Reserve does not anticipate that it will be necessary to draw on these backstop funds.
After receiving a recommendation from the boards of the Federal Deposit Insurance Corporation (FDIC) and the Federal Reserve, Treasury Secretary Yellen, after consultation with the President, approved actions to enable the FDIC to complete its resolutions of Silicon Valley Bank and Signature Bank in a manner that fully protects all depositors, both insured and uninsured. These actions will reduce stress across the financial system, support financial stability and minimize any impact on businesses, households, taxpayers, and the broader economy.
The Board is carefully monitoring developments in financial markets. The capital and liquidity positions of the U.S. banking system are strong and the U.S. financial system is resilient.”
Take Away
Confidence by depositors, investors, and all economic participants is important for those entrusted to keep the U.S. economy steady. The measures appear to strive for the markets to open on Monday with more calm than might otherwise have occurred.
While the sense of resolve of the steps explained in the two statements, both released at 6:15 ET Sunday evening is reminiscent of 2008, there is still no expectation that the problem is wider than a few institutions.
All dollar amounts expressed are in thousands of U.S. dollars unless otherwise indicated.
Q4 & Full Year 2022 Highlights
Revenues of $47.5 million in Q4 2022, 6% below Q4 2021; Revenues per pound sold1 of $7.77 in Q4 2022, largely in line with $7.88 recognized in Q4 2021
Operating costs of $44.5 million in Q4 2022 vs. $37.7 million in Q4 2021, and cash operating costs excluding royalties per pound1 of V2O5 equivalent sold of $5.15 in Q4 2022 vs. $3.68 in Q4 2021
Net loss of $15.6 million in Q4 2022 vs. net income of $1.0 million in Q4 2021; Basic loss per share of $0.24 in Q4 2022 vs. basic earnings per share of $0.01 in Q4 2021
In Q4 2022, the Company’s net loss included approximately $6.3 million of non-recurring expenditures
Revenues of $229.3 million in 2022, a 16% increase over 2021; Revenues per pound sold1 of $9.38 in 2022, a 19% increase over 2021
Operating costs of $169.7 million in 2022 vs. $133.0 million in 2021, and cash operating costs excluding royalties per pound1 of V2O5 equivalent sold of $4.57 in 2022 vs. $3.37 in 2021; 2% above upper range of revised 2022 guidance for cash operating costs excluding royalties per pound1
Net loss of $2.2 million in 2022 vs. net income of $22.6 million in 2021; Basic loss per share of $0.03 in 2022 vs. basic earnings per share of $0.35 in 2021
In 2022, the Company’s net loss included approximately $15.0 million of non-recurring expenditures
V2O5 production of 2,004 tonnes in Q4 2022 vs. 2,003 tonnes in Q4 2021; Annual V2O5 production of 10,436 tonnes in 2022 vs. 10,319 tonnes in 2021 and 6% below lower range of revised production guidance
Quarterly sales of 2,772 tonnes of V2O5 equivalent (inclusive of 118 tonnes of purchased material) in Q4 2022 vs. 2,899 tonnes in Q4 2021; Annual V2O5 equivalent sales of 11,091 (inclusive of 1,057 tonnes of purchased material) tonnes in 2022 vs. 11,393 tonnes in 2021 and within revised sales guidance of 11,000 – 12,000 tonnes
Vanadium Price Update2
The average benchmark price per pound of V2O5 in Europe was $8.25 in Q4 2022, being largely in line with the average of $8.23 seen in Q3 2022 and $8.30 in Q4 2021; The average benchmark price as of March 3, 2023 was $10.78, a 44% increase from the lows of 2022
The average benchmark price per kg of ferrovanadium (“FeV”) in Europe was $33.35 in Q4 2022, a 3% decrease from the average of $32.29 seen in Q4 2021; The average FeV benchmark price as of March 3, 2023 was $40.88, a 30% increase from the lows of 2022
TORONTO–(BUSINESS WIRE)– Largo Inc. (“Largo” or the “Company“) (TSX: LGO) (NASDAQ: LGO) today released financial and operating results for the three and twelve months ended December 31, 2022. The Company reported annual vanadium pentoxide (“V2O5”) equivalent sales of 11,091 tonnes at a cash operating cost excluding royalties per pound1 sold of $4.58. Revenues in 2022 increased 16% over 2021 to $229.3 million mainly due to a strengthening of vanadium prices in the year.
Daniel Tellechea, Interim CEO and Director of Largo, stated: “For Largo, 2022 was a challenging year, which led to an underperformance on both production and cost metrics, particularly in Q4 2023 with the mining disruption caused by record rainfall at our mine, cost inflation of key raw materials and sizeable non-recurring expenditures. Although we continue to navigate an inflationary environment, we anticipate delivering and capitalizing on a 10% increase in production for 2023 over 2022, particularly with the recent strengthening of vanadium prices.” He continued: “This recent increase is due in part to increased demand from the energy storage sector, especially in China, where new vanadium redox flow battery (“VRFB”) deployments totaling around 2 GWh or approximately 10% of global vanadium output are planned for the next 12-24 months.Importantly, the VRFB sector accounted for the second largest source of vanadium demand outside of the steel sector in Q3 2022, according to Vanitec, a global vanadium organization. Other key markets including steel, aerospace, and chemical have also shown considerable demand growth in recent months.”
He continued: “As for growth plans this year, Largo’s ilmenite project remains on track and is expected to generate a new source of revenue for the Company. We anticipate providing guidance on ilmenite production for 2023 once commissioning of the plant has been completed. We continue to make progress on the installation of our first VRFB in Spain and our negotiations toward the formation of a joint venture with Ansaldo Green Tech (“Ansaldo”) for the deployment of VRFBs in the Europe, Middle East and Africa power generation markets. Lastly, safety and sustainability remain key priorities for Largo and we are pleased to be recently ranked in the top quartile of our peer group as measured by certain ESG rating agencies for 2022.”
Q4 & Full Year 2022 Financial Results Overview
During 2022, the Company recognized revenues of $229.3 million from sales of 11,091 tonnes of V2O5 equivalent (2021 – 11,393 tonnes). This represents a 16% increase in revenues over 2021 ($198.3 million) mainly due to higher vanadium prices in the year, particularly with revenues recognized in Q2 2022. During Q4 2022, the Company recognized revenues of $47.5 million (Q4 2021 – $50.3 million) from sales of 2,772 tonnes of V2O5 equivalent (Q4 2021 – 2,899 tonnes).
Operating costs of $169.7 million in 2022 (2021 – $133.0 million) include direct mine and production costs of $94.5 million (2021 – $75.1 million), conversion costs of $8.1 million (2021 – $9.3 million), product acquisition costs of $24.4 million (2021 –$9.7 million), royalties of $10.4 million (2021 – $8.9 million), distribution costs of $9.2 million (2021 – $5.3 million), inventory write-down of $2.3 million (2021 – $3.2 million), depreciation and amortization of $20.9 million (2021 – $21.5 million) and iron ore costs of $1.0 million (2021 – $0.05 million), partially offset by insurance proceeds of $1.0 million (2021 – $nil).
Operating costs of $44.5 million in Q4 2022 (Q4 2021 – $37.7) include direct mine and production costs of $28.4 million (Q4 2021 – $21.4 million), conversion costs of $2.2 million (Q4 2021 – $2.6 million), product acquisition costs of $3.8 million (Q4 2021 – $1.0 million), royalties of $2.1 million (Q4 2021 – $2.3 million), distribution costs of $2.3 million (Q4 2021 – $1.5 million), inventory write-down of $0.4 million (Q4 2021 – $3.2 million), depreciation and amortization of $6.0 million (Q4 2021 – $5.8 million) and iron ore costs of $0.02 million (Q4 2021 – $nil), partially offset by insurance proceeds of $1.0 million (Q4 2021 – $nil).
The increases in direct mine and production costs are attributable to a decrease in the global recovery5, cost increases in critical consumables, including heavy fuel oil (“HFO”) and ammonium sulfate, as well as increased consumption of these critical consumables and sodium carbonate. Costs were further impacted by the Company’s mining contractor transition in Q3 2022 and corrective maintenance in the plant throughout the year. Higher costs of production in the current and previous periods in the year related to shutdowns caused by abnormally high rainfall during Q4 2022, while corrective maintenance continued to impact operating costs as a result of the time between production and sales.
Cash operating costs excluding royalties per pound1 of V2O5 equivalent soldwere $4.57 in 2022, compared with $3.37 in 2021. Cash operating costs excluding royalties per pound1 sold were $5.15 in Q4 2022, compared with $3.68 in Q4 2021. The increase seen in Q4 2022 and 2022 compared with Q4 2021 and 2021 is largely due to the impacts noted previously, in addition to produced V2O5 equivalent sold having decreased in 2022 as compared with 2021, with 10,034 tonnes sold versus 10,864 tonnes.
Professional, consulting and management fees were $25.3 million in 2022, compared with $17.9 million in 2021. Professional, consulting and management fees were $5.7 million in Q4 2022, compared with $5.6 million in Q4 2021. For 2022, the increase is primarily attributable to costs incurred earlier in the year in connection with LCE, which was not fully operational earlier in 2021 and transaction and listing related costs incurred by Largo Physical Vanadium Corp. (“LPV”) in connection with the completion of its qualifying transaction.
Other general and administrative expenses were $14.3 million in 2022, compared with $6.4 million in 2021. Other general and administrative expenses were $3.5 million in Q4 2022, compared with $2.3 million in Q4 2021. For 2022, the increase is primarily due to an increase in provisions as well as costs incurred in Q4 2022 in connection with LPV, and in Largo Clean Energy Corp. (“LCE”) which has scaled up activities throughout 2022. The increase in provisions relates to a supply agreement for the Maracás Menchen Mine which was filed with Brazilian courts in October 2014. The ruling requires the Company to pay amounts due, plus interest and legal fees.
Technology start-up costs were $12.7 million in 2022 (2021 – $3.8 million) and $8.2 million in Q4 2022 (Q4 2021 – 3.1 million). This includes a full write-down of battery components inventory at LCE of $6.4 million (Q4 2022 and 2022) (Q4 2021 and 2021 – $nil) to their expected net realizable value. Technology start-up costs relate to LCE’s activities related to ramping up its operations for the deployment of the VCHARGE VRFB system and the titanium project in Brazil.
Finance costs in Q4 2022 increased from Q4 2021 by 118% (or $0.4 million), which is attributable to increased debt, as well as the initial financing fees on the Company’s new debt facilities.
For 2022, cash provided by financing activities increased from cash used in financing activities in 2021 by $33.3 million. The movement is primarily attributable to the receipt of debt of $55.0 million and cash received from the sale of non-controlling interest of $7.3 million (2021 – $nil), partially offset by the repayment of debt of $30.0 million (2021 – $24.8 million) and share repurchases of $6.0 million. Cash provided by financing activities in Q4 2022 increased from cash used in financing activities in Q4 2021 by $24.1 million. This movement was primarily due to the receipt of new debt of $40.0 million, partially offset by a repayment of debt of $15.0 million.
Cash used in investing activities in Q4 2022 of $26.8 million is an increase of $19.8 million from the $7.0 million seen in Q4 2021. This movement was primarily driven by the purchase of vanadium assets and continued work on the ilmenite project. For 2022, the increase from 2021 was $32.7 million. Expenditures in 2022 primarily relate to the ilmenite project, mining equipment, costs relating to a software implementation and cash outflows for purchased product vanadium assets.
Additional Company Updates
Q4 and Full Year 2022 Operational Results: Production of 2,004 tonnes of V2O5 in Q4 2022 was in line with the 2,003 tonnes of V2O5 produced in Q4 2021, primarily due to reduced massive ore inventory arising from the transition in mining contractors in Q3 2022 and due to unusually heavy rainfall in December 2022. In Q4 2022, the Company produced 839 V2O5 equivalent tonnes of high purity products, including 650 tonnes of high purity V2O5 and 189 tonnes of high purity vanadium trioxide (“V2O3”). This represented 42% of the total quarterly production. In 2022, the Company produced 1,801 V2O5 equivalent tonnes of high purity products, including 1,368 tonnes of high purity V2O5 and 433 tonnes of high purity V2O3. In Q4 2022, 326,552 tonnes of ore were mined with an effective grade4 of 0.96% of V2O5. The ore mined in Q4 2022 was 18% higher than in Q4 2021. The Company produced 90,797 tonnes of concentrate with an effective grade4 of 2.94%. The global recovery5 achieved in Q4 2022 was 74.7%, a decrease of 1.7% from the 76.0% achieved in Q4 2021 and 7.4% lower than the 80.7% achieved in Q3 2022. The global recovery5 in October 2022 was 75.0%, with 67.8% achieved in November 2022 and 80.8% achieved in December 2022.
Continued Focus on ESG in 2022: The Company continued to improve its overall Environmental, Social and Governance (“ESG”) performance and public disclosures in 2022. This is reflected in additional improved ratings and scores, most notably its S&P Global Corporate Sustainability Assessment (“CSA”) rating having improved approximately 38%, placing the Company in the top quartile of its mining peer group for 2022. This improvement was largely driven by updates to Largo’s governance of ESG, including new policies, ESG oversight at the Board level and climate-related disclosures, as well as improved responses related to the Company’s on-going environmental compliance in Brazil. The Company expects to issue its 2022 sustainability report in late Q2 2023.
Largo Clean Energy Recent Developments: During Q4 2022, LCE continued to make significant progress on the delivery of the Enel Green Power España (“EGPE”) contract, which remains a priority focus. Substantially all the hardware is either in transit to or is in Spain awaiting installation. The Company shipped the remaining six of 12 electrolyte storage containers in early 2023 and the Field Service team has been on site in Q1 2023 and work is ongoing to install and interconnect the AC and DC power systems. Provisional acceptance, which requires the completion of as-build drawings, manuals, final punch-list items, and operational testing by EGPE, is expected to be completed by the end of May 2023. Additionally, LCE and Ansaldo continue to focus on the formation of a joint venture for the manufacturing and commercial deployment of VRFBs in the European, African and Middle East power generation markets. The Company’s previously announced memorandum of understanding (“MOU”) has been extended to March 31, 2023, to allow for the negotiation and entering into a joint venture and other ancillary agreements. Ansaldo and LCE continue to develop a business path for the joint venture to service the European markets with Long Duration Energy Storage (“LDES”).
Ilmenite Concentration Plant Progress: The Company progressed with the construction of its ilmenite concentration plant at its Maracás Menchen Mine in Q4 2022. The Company received all required flotation structures and is finalizing the building of its desliming, flotation, filtration, warehouse and pipe rack structures ands expects commissioning of the plant to be completed in Q2 2023.
January and February 2023 Production and Sales: Subsequent to Q4 2022, the Company produced 354 tonnes of V2O5 in January and 843 tonnes in February. The Company also sold 1,080 tonnes of V2O5 equivalent (including 68 tonnes of purchased material) in January 2023 and 750 tonnes (including 11 tonnes of purchased material) in February. Production in January and February was largely impacted by low ore availability in due to the heavy rains at the mine site and planned maintenance of the kiln for its refractory refurbishment, with sales in February being impacted by a delay in sales recognition. The Company expects to remain within its quarterly production and sales guidance for Q1 2023.
Largo Physical Vanadium Update: LPV’s net assets are now over 90% held in physical vanadium products and near-term delivery commitments (approximately 2.9 million lbs of V2O5 equivalent). The launch of LPV in September 2022 coincided with lower vanadium prices, which allowed LPV to purchase vanadium units at favorable market prices. LPV’s net asset value (“NAV”) is now C$2.56 per share or 28% above the closing share price of C$2.00 per share on March 8, 2023. LPV believes its NAV to share price discount offers current and new LPV investors an attractive investment case and closing this disconnect is now LPV’s key focus. LPV management are working on a broad marketing and communication campaign to raise awareness of its investment proposal.
Director Resignation: Following the Company’s previously announced leadership change on February 16, 2023, Mr. Paulo Misk has resigned from his position as a Director of the Company effective March 7, 2023.
Annual 2022 Webcast and Conference Call Information
The Company will host a webcast and conference call on Friday, March 10, 2023, at 1:00 p.m. ET, to discuss its fourth quarter and annual 2022 results and progress.
Details of the webcast and conference call are listed below:
To join the conference call without operator assistance, you may register and enter your phone number at https://bit.ly/3Yho3fJ to receive an instant automated call back.
You can also dial direct to be entered to the call by an Operator via dial-in details below.
A playback recording will be available on the Company’s website for a period of 60-days following the conference call.
The information provided within this release should be read in conjunction with Largo’s annual consolidated financial statements for the years ended December 31, 2022 and 2021 and its management’s discussion and analysis for the year ended December 31, 2022 which are available on our website at www.largoinc.com or on the Company’s respective profiles at www.sedar.com and www.sec.gov.
About Largo
Largo has a long and successful history as one of the world’s preferred vanadium companies through the supply of its VPURETM and VPURE+TM products, which are sourced from one of the world’s highest-grade vanadium deposits at the Company’s Maracás Menchen Mine in Brazil. Aiming to enhance value creation at Largo, the Company will be implementing a titanium dioxide pigment plant using feedstock sourced from its existing operations in addition to advancing its U.S.-based clean energy division with its VCHARGE vanadium batteries. Largo’s VCHARGE vanadium batteries contain a variety of innovations, enabling an efficient, safe and ESG-aligned long duration solution that is fully recyclable at the end of its 25+ year lifespan. Producing some of the world’s highest quality vanadium, Largo’s strategic business plan is based on two pillars: 1.) leading vanadium supplier with an outlined growth plan and 2.) U.S.-based energy storage business support a low carbon future.
Largo’s common shares trade on the Nasdaq Stock Market and on the Toronto Stock Exchange under the symbol “LGO”. For more information, please visit www.largoinc.com.
This press release contains “forward-looking information” and “forward-looking statements” within the meaning of applicable Canadian and United States securities legislation. Forward‐looking information in this press release includes, but is not limited to, statements with respect to the timing and amount of estimated future production and sales; the future price of commodities; costs of future activities and operations, including, without limitation, the effect of inflation and exchange rates; the effect of unforeseen equipment maintenance or repairs on production; timing and cost related to the build-out of the ilmenite plant; the ability to produce vanadium trioxide according to customer specifications; the extent of capital and operating expenditures; the impact of global delays and related price increases on the Company’s global supply chain and future sales of vanadium products. Forward‐looking information in this press release also includes, but is not limited to, statements with respect to our ability to build, finance and successfully operate a VRFB business, the projected timing and cost of the completion of the EGPE project; our ability to protect and develop our technology, our ability to maintain our IP, the competitiveness of our product in an evolving market, our ability to market, sell and deliver our VCHARGE batteries on specification and at a competitive price, our ability to successfully deploy our VCHARGE batteries in foreign jurisdictions; our ability to negotiate and enter into a joint venture with Ansaldo Green Tech on terms satisfactory to the Company and the success of such joint venture; the receipt of necessary governmental permits and approvals on a timely basis, our ability to secure the required resources to build and deploy our VCHARGE batteries, and the adoption of VRFB technology generally in the market.
The following are some of the assumptions upon which forward-looking information is based: that general business and economic conditions will not change in a material adverse manner; demand for, and stable or improving price of V2O5 and other vanadium commodities; receipt of regulatory and governmental approvals, permits and renewals in a timely manner; that the Company will not experience any material accident, labour dispute or failure of plant or equipment or other material disruption in the Company’s operations at the Maracás Menchen Mine or relating to Largo Clean Energy, specially in respect of the installation and commissioning of the EGPE project; the availability of financing for operations and development; the ability to mitigate the impact of continuing heavy rainfall; the Company’s ability to procure equipment and operating supplies in sufficient quantities and on a timely basis; that the estimates of the resources and reserves at the Maracás Menchen Mine are within reasonable bounds of accuracy (including with respect to size, grade and recovery and the operational and price assumptions on which such estimates are based); the competitiveness of the Company’s VRFB technology; the ability to obtain funding through government grants and awards for the Green Energy sector, the accuracy of cost estimates and assumptions on future variations of VCHARGE battery system design, that the Company’s current plans for ilmenite and VRFBs can be achieved; the Company’s “two-pillar” business strategy will be successful; the Company’s sales and trading arrangements will not be affected by the evolving sanctions against Russia; and the Company’s ability to attract and retain skilled personnel and directors; the ability of management to execute strategic goals.
Forward-looking statements can be identified by the use of forward-looking terminology such as “plans”, “expects” or “does not expect”, “is expected”, “budget”, “scheduled”, “estimates”, “forecasts”, “intends”, “anticipates” or “does not anticipate”, or “believes”, or variations of such words and phrases or statements that certain actions, events or results “may”, “could”, “would”, “might” or “will be taken”, “occur” or “be achieved”. All information contained in this news release, other than statements of current and historical fact, is forward looking information. Forward-looking statements are subject to known and unknown risks, uncertainties and other factors that may cause the actual results, level of activity, performance or achievements of Largo or Largo Clean Energy to be materially different from those expressed or implied by such forward-looking statements, including but not limited to those risks described in the annual information form of Largo and in its public documents filed on www.sedar.com and available on www.sec.gov from time to time. Forward-looking statements are based on the opinions and estimates of management as of the date such statements are made. Although management of Largo has attempted to identify important factors that could cause actual results to differ materially from those contained in forward-looking statements, there may be other factors that cause results not to be as anticipated, estimated or intended. There can be no assurance that such statements will prove to be accurate, as actual results and future events could differ materially from those anticipated in such statements. Accordingly, readers should not place undue reliance on forward-looking statements. Largo does not undertake to update any forward-looking statements, except in accordance with applicable securities laws. Readers should also review the risks and uncertainties sections of Largo’s annual and interim MD&As which also apply.
Trademarks are owned by Largo Inc.
Non-GAAP Measures
The financial statements and related notes of Largo have been prepared in accordance with International Financial Reporting Standards (“IFRS”) as issued by the International Accounting Standards Board. This press release contains non-GAAP financial measures and non-GAAP ratios, which are not standardized financial measures under IFRS, and might not be comparable to similar financial measures disclosed by other issuers. These measures are intended to provide additional information and should not be considered in isolation or as a substitute for measures of performance prepared in accordance with IFRS.
Revenues Per Pound
The Company’s press release refers to revenues per pound sold, V2 O5 revenues per pound of V2 O5 sold, V2 O3 revenues per pound of V2 O3 sold and FeV revenues per kg of FeV sold, which are non-GAAP financial measures that are used to provide investors with information about a key measure used by management to monitor performance of the Company.
These measures, along with cash operating costs, are considered to be key indicators of the Company’s ability to generate operating earnings and cash flow from its Maracás Menchen Mine and sales activities. These measures differ from measures determined in accordance with IFRS, and are not necessarily indicative of net earnings or cash flow from operating activities as determined under IFRS.
The following table provides a reconciliation of revenues per pound sold, V2 O5 revenues per pound of V2 O5 sold, V2 O3 revenues per pound of V2 O3 sold and FeV revenues per kg of FeV sold to revenues and the revenue information presented in note 18 as per the 2022 annual consolidated financial statements.
Cash Operating Costs and Cash Operating Costs Excluding Royalties
The Company’s press release refers to cash operating costs per pound and cash operating costs excluding royalties per pound, which are non-GAAP ratios based on cash operating costs and cash operating costs excluding royalties, which are non-GAAP financial measures, in order to provide investors with information about a key measure used by management to monitor performance. This information is used to assess how well the Maracás Menchen Mine is performing compared to plan and prior periods, and also to assess its overall effectiveness and efficiency.
Cash operating costs includes mine site operating costs such as mining costs, plant and maintenance costs, sustainability costs, mine and plant administration costs, royalties and sales, general and administrative costs (all for the Mine properties segment), but excludes depreciation and amortization, share-based payments, foreign exchange gains or losses, commissions, reclamation, capital expenditures and exploration and evaluation costs. Operating costs not attributable to the Mine properties segment are also excluded, including conversion costs, product acquisition costs, distribution costs and inventory write-downs.
Cash operating costs excluding royalties is calculated as cash operating costs less royalties.
Cash operating costs per pound and cash operating costs excluding royalties per pound are obtained by dividing cash operating costs and cash operating costs excluding royalties, respectively, by the pounds of vanadium equivalent sold that were produced by the Maracás Menchen Mine.
Cash operating costs, cash operating costs excluding royalties, cash operating costs per pound and cash operating costs excluding royalties per pound, along with revenues, are considered to be key indicators of the Company’s ability to generate operating earnings and cash flow from its Maracás Menchen Mine. These measures differ from measures determined in accordance with IFRS, and are not necessarily indicative of net earnings or cash flow from operating activities as determined under IFRS.
The following table provides a reconciliation of cash operating costs and cash operating costs excluding royalties, cash operating costs per pound and cash operating costs excluding royalties per pound for the Maracás Menchen Mine to operating costs as per the 2022 annual consolidated financial statements.
Investor Relations Alex Guthrie Senior Manager, External Relations +1.416.861.9778 aguthrie@largoinc.com