Arguments Can be Made for Rates Being Too Low and for Rates Being Too High
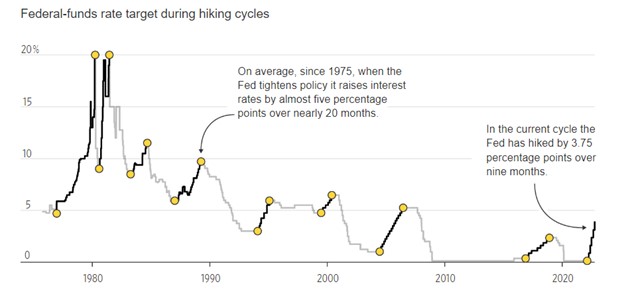
The Federal Reserve has raised the Fed Funds rate from an average of 0.08% in January 2022 to its current 4.05%, and a likely adjustment to 4.25% to 4.50% tomorrow. Inflation, as measured by CPI and even the Fed’s favorite, the PCE deflator, has been showing a decreasing rise in prices. So investors within all affected markets are asking, how much more will the Fed raise rates? Ignoring any suggestion that “this time it’s different,” I looked at US interest rates and inflation going back to 1962 and may have found enough consistency and historical norms to help determine what to expect now and why.
Are Increases Nearing an End?
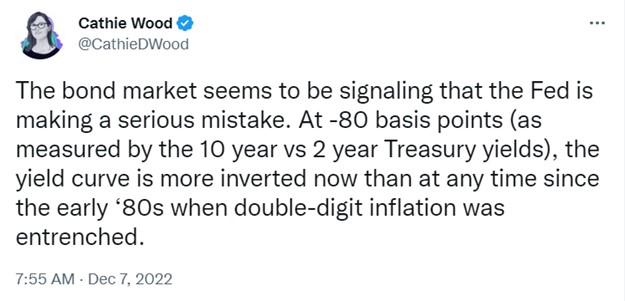
I’ll start with the conclusion. The data suggests that the movement of market rates depends on whether higher current inflation is being caused by temporary or long-lived factors. The 10-year Treasury Note market believes current inflation is mostly temporary. This is shown by its yield, having touched 4.25% in late October, and then falling. The ten-year is now near 3.50%, despite the 0.75% increase in overnight rates implemented on November 2. If the combined wisdom of the Treasury market is reliable, this suggests FOMC rate increases are nearing an end. Perhaps one more smaller hike and then a wait-and-see period. The Fed would then monitor prices while past increases work their way through the economy.
Powell’s Concerns
At his last address on November 30th, Fed Chair Jay Powell indicated he’d rather go too far (with tightening) and then reignite the economy rather than err on the side of not doing enough and having a bigger problem. The markets and the media largely ignored this, but it’s important to know what the Fed Chair believes is prescient and is sharing publicly. Powell also said, “Given our progress in tightening policy, the timing of that moderation is far less significant than the questions of how much further we will need to raise rates to control inflation, and the length of time it will be necessary to hold policy at a restrictive level.” And then he said something very telling, Powell added, “It is likely that restoring price stability will require holding policy at a restrictive level for some time. History cautions strongly against prematurely loosening policy. We will stay the course until the job is done.”
Market Thinks Inflation is Temporary
But, the markets are overjoyed by the last two months of inflation data. Despite what the nations top central banker is saying. Markets may be right, but if they are wrong (bond and stock markets) spotting it early can help stave off losses. If inflation, which is lower than it had been, but not historically low, proves more permanent, for example, if employers continue to have to bid up the price of workers, and demand for goods causes commodity prices to rise, then the Fed will have paused too early. This will lead to a more difficult challenge for the Fed as compared to tightening too much. The data used in this article are from the Federal Reserve Economic Data (FRED) maintained by the Federal Reserve Bank of St. Louis.
Actual and Expected Inflation
The St. Louis Federal Reserve publishes a market estimate of expected average inflation over the next ten years. It is derived from the 10-year Treasury constant maturity bond and 10-year Treasury inflation-indexed constant maturity bond. It was first published in 2003. Over 2003-2021, 10-year inflation expectation averaged 2.0%, the same as GDP deflator inflation. During the second quarter of 2022, the expected 10-year inflation was 2.7%, or less than 1.0 percentage point above its 2003-2021 average. In contrast, GDP deflator inflation was 7.6%. A significant wedge exists between current and expected inflation.
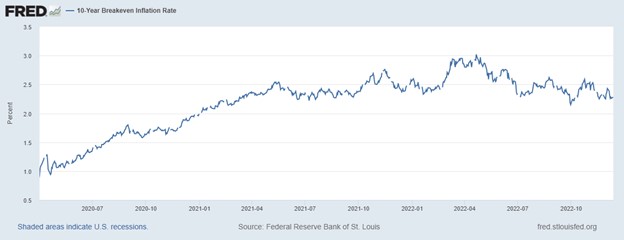
The breakeven inflation rate represents a measure of expected inflation derived from 10-Year Treasury Constant Maturity Securities (BC_10YEAR) and 10-Year Treasury Inflation-Indexed Constant Maturity Securities (TC_10YEAR). The latest value implies what market participants expect inflation to be in the next 10 years, on average.
Beginning with the end of the last recession on April 1, 2020, the Treasury bond data used in calculating interest rate spreads is obtained directly from the U.S. Treasury Department.
Take Away
The Market’s expectation of 10-year average inflation is dramatically different from current inflation, even at inflation’s new lower pace. This implies the market believes it to be temporary.
If the market’s expectation of inflation is accurate, there is an average difference between Fed Funds and the PCE deflator of 1.6% (since 1962). The last read on PCE was October 2022 at 6%. Reducing this by 1.6 would provide a Fed Funds level of 4.4%. This level is in line with historic averages and likely where we will be after the FOMC meeting wraps up on December 14. This comparatively high rate relative to where we began the year may be considered neutral.
Will the Fed stop at neutral? Are the markets right? Powell said he’d rather err on the side of going beyond what is needed, which suggests the Fed will continue some. As for the markets, being on the side of the markets is how you make money, but getting out before trouble arises is how you keep the money. Markets are not always accurate forecasters and since economic behavior and debt levels tend to adjust slowly, prudent portfolio management suggests it is wise to keep an eye out for today’s interest rates still being too low.
Paul Hoffman
Managing Editor, Channelchek
Source
https://www.federalreserve.gov/newsevents/speech/powell20221130a.htm