Could There be an Impact on Robinhood Shareholders with the SBF Share Seizure
Creditors and customers of FTX may be able to reclaim some assets that were wiped out as the feds have been seizing the 7.50% stake in Robinhood (HOOD) stock held by Sam Bankman-Fried (SBF). SBF faces charges of fraud and a myriad of financial crimes after the collapse of FTX in November. The impact of the collapse is having an effect on other areas of finance, including assets that had been controlled by SBF. The Robinhood shares are valued near $450 million, and while this may bring some hope or relief to those that will receive a distribution, there is a risk to HOOD investors.
Background
The FTX bankruptcy has left a line of claimants to recapture what they can from the cryptocurrency giant. Bankruptcies are seldom easy; those that could involve layers of fraud become tied up in even larger disputes and legal battles. For example, the large Robinhood holding is tied up in a dispute between FTX and bankrupt crypto lender BlockFi. The company alleges that SBF put up the shares as collateral for a loan to Alameda Research, a company he also owned.
The HOOD stake was purchased in 2022 through a holding company SBF controlled, Robinhood of course is the innovative broker specializing in self-directed individual investors. Through the DOJ, authorities are going after the shares of HOOD and accounts that are held at the bank Silvergate Capital (SI) which is a banker for the crypto industry.
Separately, court filings on January 4th brought awareness to a NY federal judge ordered last month requiring the seizure of some $93 million that an FTX arm held in accounts at Silvergate. As it relates to this seizure. The Justice Department says it believes the assets seized are not the property of the bankruptcy estate, while a lawyer for FTX maintains that the seizures were from accounts not directly controlled by the company. They were ordered in connection with the criminal case involving SBF.
FTX investors’ asset claims in the exchange, which was once valued at $32 billion, come after creditors and other rightful claimants.
How This Could Impact Robinhood Shareholders
Asset seizures and later distribution to those hurt by fraud involve liquidation of the assets seized. In the case of stocks, they will be sold and turned into cash. Imagine a sudden effort to sell 7.50% of any company. That is a large percentage to move. The stake, worth between $400 and $500 million, may serve as a dark cloud depressing share prices and slowing any planned growth of the company. It may eventually culminate in liquidation at a pace not conducive to retaining a level stock price.
One Should Never feel Forced to Trade or Get Involved Because They are Bored
Most start off a New Year with great intentions. These often include saving money, starting a family, or finding a better job. A co-worker of mine is intent on skydiving before year-end – whatever. To each their own. For many involved in the markets, 2023 has become the year they want to further improve their trading. This usually begins with stepping back, reminding themselves of trading basics, then not falling into old habits weeks later. Another step is developing new understanding and new companies. It also includes not trading with the need to make back last year’s losses in a hurry.
There is one trading basic that is often ignored because it feels like it conflicts with other goals. But it doesn’t. It is knowing when being uninvolved is the best decision. Doing nothing without feeling you may be missing something takes practice for most. It may take more practice for those that have experienced the thrill of a mostly green trading account.
Trade No Stock Before its Time
Over the holidays, family members would ask, “should I buy Tesla?” or “should I be buying Apple down here?” My mom would instead ask, something that in my mind is a similar question. She’d ask, “when are you going to get married?” These are all similar because Tesla and Apple, when considering the whole universe of stocks, are probably not the best fit for the accounts of these people. Similarly, in the absence of finding a good personal fit, unless someone is holding a gun to one’s head, I believe in waiting for circumstances with a high probability of a positive outcome. Don’t get involved because you’re bored, or because you think you have to is the message.
If your win rate is over 50%, you’re doing better than average, this is as true in trading as it is in relationships. If you force either, your success rate goes down, and you’ve wasted time, money, and invited frustration. Yet so many investor/traders willy-nilly jump into something because they are bored, feel they are missing out, or are told it is what they are supposed to be doing.
Forcing trades, no matter how tempting it may be, how bored you are, or how much FOMO you’re experiencing, has a lower chance of being successful than if you wait for your perfect setup. Sitting on your hands so you can’t press the “Buy” button is preferable to being in the situation of trying to unwind a trade you spent too little time waiting to come to you. Good opportunity doesn’t always arrive on schedule, but if you have capital tied up in a mistake, you may not be able to jump at a real match for your portfolio later on.
Trading is Not Glamorous
The definition of booyah is “expressing triumphant exuberance.” If you yearn to say “booyah” or do any other kind of touchdown dance, you may find you will pull the sell trigger too early. A main key to trading is knowing what you want, then patience. Patience is one of the most important skills you can have as a trader. You need to have the control and the discipline to wait for a quality setup according to your individual strategy. It may take a while, but confidence the trades will come helps. Develop a trading strategy so you know the guidelines you will adhere to; abandoning that strategy just to be involved, over time, will cause you to be worse off.
Consistently successful traders will tell you that one of the most important things to remember with trading is that you should never let your emotions control your actions. If you can’t think rationally if you aren’t planning your trade and trading your plan, sit on your hands until you can. Really, defund your account, find another way to get your thrills. Because if you force a trade and it works out anyway, you have reinforced a bad habit. Many trading accounts of good people got fried in 2022 because they did the wrong thing in 2021, but in 2021 they were bailed out by the markets. Doing the wrong thing and succeeding is costly because you tend to repeat it.
A hail Mary pass sometimes meets the desired goal in a football game, swinging for a home run in baseball and connecting certainly can lead to exuberance and even a winning game. But most often, these are low-probability irrational plays if you actually want to win. Increase your time on base, work on your short plays, study your opponent, or whatever other kind of reference helps convey this thinking. Because saying “I do” to a stock without successful due diligence is like asking to eventually lose. If you just want excitement, then maybe you could consider skydiving.
Final Thoughts
We’re all always learning. Channelchek is a good way to discover less explored companies and to either learn or be reminded of things that may enhance your positive outcomes. Sign up now, there’s no paywall, just good info not found on more mainstream investment sites. Go here.
New Year, Same Old Fed – A Synopsis of the Last FOMC Meeting
Interest rate moves orchestrated by the Federal Reserve or, more specifically, monetary policy as formed at each Federal Open Market Committee (FOMC) meeting have recently taken a front seat in driving markets. This includes the stock market, real estate prices, and more directly, bond values. In what direction is the FOMC likely to push rates in 2023, and at what pace? Some hints have been uncovered in the just-released December meeting minutes. The minutes describe the views expressed by policymakers and explain the reasons for the Committee’s decisions. While voting member thinking can change from one meeting to the next, it is seldom dramatic. This new set of minutes offered only subtle clues as to whether change is in store.
Fed Minutes Present a Case for Continued Rate Hikes
The minutes from the December 2022 Federal Open Market Committee (FOMC) meeting showed that the Fed remains committed to bringing inflation back to its defined 2% target. But the pace of rate hikes should taper in 2023. There was no discussion at all as to whether rates may be cut during 2023.
On the progression of the economy, the Committee members noted that GDP was increasing at a modest pace in the fourth quarter after expanding strongly in the third quarter. Labor markets had eased but remained tight enough to be trouble from an inflation point of view. Both Consumer Price Inflation (CPI) and Personal Consumption Expenditures (PCE) readings moved lower, but continued well above the target inflation range.
Jobs increased at a slower pace in October and November. Both the labor force participation rate and the employment-to-population ratio declined a little over the period of time between meetings. The private-sector job openings rate, as measured by the Job Openings and Labor Turnover Survey, moved back down in October but remained higher than would seem consistent with dramatically lower inflation.
Wage growth continued higher than a pace expected to be consistent with the the two percent monetary policy target. Average hourly earnings rose 5.1% over the 12 months ending in November. Compensation per hour (CPH) in the business sector rose 4.0 percent over the four quarters ending in the third quarter, but the reported increase likely understated the true pace of increase in CPH, as the lower second-quarter employment data from the Quarterly Census of Employment and Wages had not yet been incorporated in the CPH measure.
Foreign economic activity grew in the third quarter, but some recent data point to weakening growth, weighed down by the economic fallout of Russia’s war with Ukraine and a COVID-19-related slowdown in China. High inflation continued to contribute to a decline in real disposable incomes, which, together with disruptions to energy supplies, depressed economic activity, especially overseas. In China, authorities began to ease social restrictions even as COVID cases surged, raising the prospect of significant disruptions to economic activity in the near term but also a faster reopening. Weaker global demand and high interest rates also weighed on activity in emerging market economies. Despite tentative signs of easing in foreign headline inflation, core inflationary pressures remained elevated in many countries. In response to high inflation, many central banks further tightened monetary policy.
Implications
The December 2022 minutes confirmed that reining in inflation remains the principal concern of the Fed. No members spoke of a scenario where they may lower rates this year, there is concern that the cost of money is getting easier despite the Fed’s tightening efforts. The expected path of the federal funds rate implied by financial market quotes ended, showing the market anticipates lower rates. This is likely reflective of the larger-than-expected moderation in inflation. Medium-to-longer-term nominal Treasury yields declined substantially over the intermeeting period. This was driven primarily by lower-than-expected inflation data releases, which appeared to prompt a substantial reduction in investors’ concerns about the possibility that inflation would remain high for a long period.
What Do the Minutes Say About Stocks?
Broad stock price indexes increased. This likely reflected reduced concerns about the inflation outlook and the associated implications for the future path of policy. On balance, the one-month option-implied volatility on the S&P 500 (VIX) decreased and was around the middle of its range since mid-2020. This makes sense because of reduced investor concerns about the inflation outlook, spreads of interest rates on corporate debt, mortgage-backed securities, and municipal bonds to comparable-duration Treasury yields, which all narrowed since the last meeting.
Inflation Worries Deflated
With inflation still well above the Committee’s longer-run goal of two percent, participants agreed that inflation was unacceptably high. Participants agreed that the inflation data received for October and November showed welcome reductions in the monthly pace of price increases, but they stressed that it would take substantially more evidence of progress to be confident that inflation was on a sustained downward path.
Participants noted that core goods prices declined in the October and November CPI data, consistent with easing supply bottlenecks. Some participants also noted that, by some measures, firms’ markups were still elevated and that a continued subdued expansion in aggregate demand would likely be needed to reduce the remaining upward pressure on inflation. Regarding housing services inflation, many participants observed that measures of rent based on new leases indicated a deceleration, which would be reflected in the measures of shelter inflation with some lag. Participants noted that, in the latest inflation data, the pace of increase for prices of core services excluding shelter—which represents the largest component of core PCE price inflation—was high. They also remarked that this component of inflation has tended to be closely linked to nominal wage growth and, therefore would likely remain persistently elevated if the labor market remained very tight. Consequently, while there were few signs of adverse wage-price dynamics at present, they assessed that bringing down this component of inflation to mandate-consistent levels would require some softening in the growth of labor demand to bring the labor market back into better balance.
Rates Moving Forward
In discussing the policy outlook, participants continued to anticipate that ongoing increases in the target range for the federal funds rate is appropriate to achieve the Committee’s objectives. In determining the pace of future increases in the target range, participants judged that it would be appropriate to take into account the cumulative tightening of monetary policy, the lags with which monetary policy affects economic activity and inflation, and economic and financial developments.
With inflation staying above the Committee’s two percent goal and the labor market remaining very tight, all participants had raised their assessment of the appropriate path of the federal funds rate relative to their assessment at the time of the September meeting. No participants anticipated that it would be appropriate to begin reducing the federal funds rate target in 2023. Participants generally observed that a restrictive policy stance would need to be maintained until the incoming data provided confidence that inflation was on a sustained downward path to two percent. Which would likely take some time.
In view of the persistent and unacceptably high level of inflation, several participants commented that historical experience cautioned against prematurely loosening monetary policy.
In light of the heightened uncertainty regarding the outlooks for both inflation and real economic activity, most participants emphasized the need to retain flexibility and optionality when moving policy to a more restrictive stance. Participants generally noted that the Committee’s future decisions regarding policy would continue to be informed by the incoming data and their implications for the outlook for economic activity and inflation and that the Committee would continue to make decisions meeting by meeting.
Take Away
It’s a new year, it’s the same Fed, inflation is still quite elevated, policymakers are surprised at how quickly some inflation measures did drop, but the drop wasn’t enough for them to reverse course.
The FOMC reserves the right to be data-dependent and change its pace or direction when the data changes. Until then, they still have more rate hikes they expect to unleash early this year.
Scheduled FOMC Meetings in 2023
January/February 31-1
March 21-22
May 2-3
June 13-14
July 25-26
September 19-20
October/November 31-1
December 12-13
The Policy announcements have been at PM on the second meeting date after they have adjourned.
Image: Michael Burry on the Set of “The Big Short” (Twitter, @michaeljburry)
Washington’s Economic Playbook According to Michael Burry
One benefit to Elon Musk purchasing Twitter and ridding the platform of many of the auto posts on well-followed accounts is that the well-followed Michael Burry is no longer deleting his tweets the same day as posted. Burry, who began the new year tweeting with a very clear economic roadmap, said less than a month ago that he trusts Elon. As far as the hedge fund manager’s 2023 economic roadmap, his expectations show that he is critical of all those in Washington that have a hand on the economic steering wheel and continue to resist oversteering.
Source: Twitter (@michaeljburry)
While it can be frustrating for someone like Burry or any investor to forecast missteps by those that most impact the economy, especially if the official entities continue to repeat their behaviors, there is some consolation in the idea that patient investors can use these repeated actions to enhance their account’s performance.
Burry’s New Year’s Message
In 50 words, Dr. Burry, the investor made famous by Christian Bale’s portrayal of him in the 2015 movie The Big Short, said that he expects that inflation for this part of the interest rate, or market cycle, has already passed its high. In fact, he expects that it will be unmistakable, as the year progresses, that the US has fallen into a recession. A recession that can’t be denied or redefined because it will be that deep.
With this economic weakness, the hedge fund manager expects that we will not only see lower CPI readings but by the second half of this year, inflation may even turn negative – deflationary readings.
Burry then goes on to say that this will cause stimulus from both the fed and fiscal policy. This stimulus will be overdone if keeping inflation at bay is the goal. He expects we will have an inflationary period that may outdo the one we are coming off., Burry tweeted. “Fed will cut and government will stimulate. And we will have another inflation spike.”
Source: Twitter (@michaeljburry)
Take Away
If you ask ten experts what will happen over the next 12 months, you will get ten or more conflicting projections. The Scion Asset Management CIO is often correct on what will eventually occur but just as often as he is right, he is far off on the timing. The scenarios that seem obvious to him have in the past played out a lot slower in the economy and marketplace.
His first tweet in 2023 said that he expects more of the same from the folks in Washington, including the Federal Reserve and the US Treasury. The fed is now pushing hard on the economic brake pedal, which will could cause activity to reach recessionary levels. He expects that this will be followed by a panic move to the gas pedal that will create shortages, increased demand, and consumer price increases.
If he is correct, this means different things to investors with different time horizons. But it appears that Burry expects the tightening cycle to end soon.
Bitcoin’s Largest Corporate Owner Sold But Remains a net Buyer
“Bitcoin is the exit strategy,” says Michael Saylor, the Executive Chairman overseeing Microstrategy (MSTR), a company he founded. The comment was to a question in a Twitter Space interview with Eric Weiss of Bitcoin Roundtable. During this insightful interview, it becomes clear that the enterprise analytics company stands behind its commitment to the cryptocurrency and is investing in the ecosystem in other ways. Saylor also addressed his recent sale of 704 bitcoin, explaining it created tax benefits that serve stockholders.
The Company is a Bitcoin Maximalist
Bitcoin owners are “Either traders, technocrats, or maximalists.” Explained Saylor in the podcast-style interview.
Accordingly, Saylor says, traders don’t have any opinion on it long-term other than it’s an asset that moves enough to trade. Holding times may be minutes or months.
Technocrats view bitcoin as a digital monetary network like Google or Facebook. It’s a big tech network to them, so if they are bullish on big tech, they will hold bitcoin. And they may try to time their investments based on economic trends.
Maximalists view bitcoin as an instrument of economic empowerment that is just good for the human race. If you’re a maximalist, you don’t try to time it, and you have a much longer time horizon. While the technocrats are looking out 3-5 years, and they think that’s long, maximalists are looking out 10-100 years. Part of that is believing this is good for the human race.
“We’re maximalists, we think bitcoin is more than a digital monetary network; we think it is the digital monetary network. It’s good for the human race, and anything we can do in order to encourage adoption of bitcoin, and help with the adoption, is going to be good for the world.” Saylor while discussing Microstrategy.
Saylor’s company is the largest owner of bitcoin, costing Microstrategy a little more than $4 billion, the crypto assets are now valued just above $2 billion. Saylor says how we acquire bitcoin is less market-driven, as this is permanent capital that flows into the bitcoin ecosystem. Permanent capital that becomes part of the Microstrategy enterprise. Capital that is ongoing and may be held as a base forever.
In Response to December Selling
Michael Saylor recently took some criticism for selling 704 bitcoin after previously repeating he won’t sell bitcoin. He put the confusion to rest by explaining the benefit to stockholders of tax loss harvesting. With crypto the selling is treated as property so you can take the capital loss, “so we have some capital gains we pay taxes on, and then we have some capital, losses in bitcoin, so by selling the bitcoin, and taking the capital loss, we’re able to use that to offset some capital gains.” He added, it’s very tax efficient for the corporation.” Which is good for shareholders.
Lightning Network
Lightning allows “lightning-fast” blockchain payments without worrying about block confirmation times. Payment speed measured in milliseconds to seconds.Security is enforced by blockchain smart-contracts without creating an on-blockchain transaction for individual payments.
Microstrategy has said they will be offering bitcoin Lightning solutions in the first quarter of 2023. This tech investment in the growth of Microstrategy is another way Saylor and company support the bitcoin ecosystem.“If bitcoin is the underlying base layer, I think that Lightning is money over IP.” He said it’s an open permissionless protocol to let eight million people move money and monetary assets at the speed of light.
“We want to make it possible for any enterprise to spin up Lighting infrastructure in an afternoon” and onboard thousands of employees or customers, Saylor explained. “We want to plug it into enterprise technology and make it a marketing strategy for any forward-thinking CMO.”
Areas that MicroStrategy is exploring for Lightning services include online content monetization, enterprise marketing, web paywalls, and internal corporate controls. Every chief marketing officer should be able give away satoshis –– Bitcoin’s smaller denomination unit –– as incentive for customers
Take Away
Bitcoin still has its perma-bulls. Michael Saylor of Microstrategy is solidly in that category. He is not necessarily bullish on other crypto or digital currencies, bitcoin is the digital currency in his mind, and he intends for the ongoing holding of bitcoin and growth of the company in other ways that support its adoption.
Offsetting portfolio capital gains by taking losses is permitted by the IRS. Within the tax guidelines, this generally occurs during the last month of the year as individuals and financial advisors strive to minimize money owed to the IRS. The stocks sold, naturally, are underperformers. This activity has a tendency to set the stage for a late December rally or a January rebound. This is especially true of the sectors or asset classes that were most sold. This is because portfolio managers often wish to keep a similar allocation, which translates to them then waiting 30 days or more before buying something that may be viewed as substantially similar.
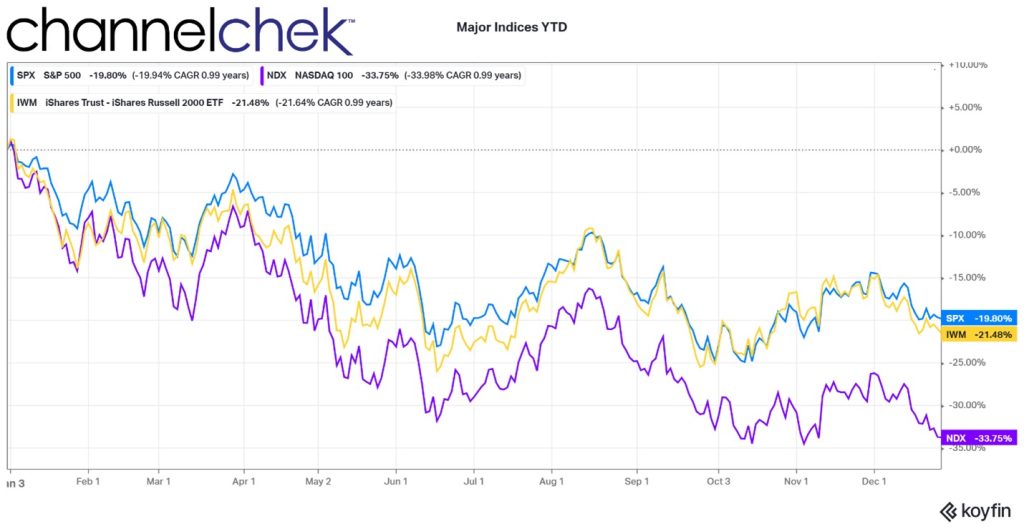
With the major indexes like the S&P 500, Nasdaq 100, and Small Cap S&P 600 all down double digits this year, there are stocks that are doing far worse than index averages – just as there are stocks doing far better. Of course, if you own an ETF, you have to treat it like it is one stock and cannot offset a good underlying individual company sold with an underperforming company. In this way, holders of individual company shares can benefit more because they will have more options. And may even find it easier to qualify for the additional $3,000 tax benefit the IRS allows.
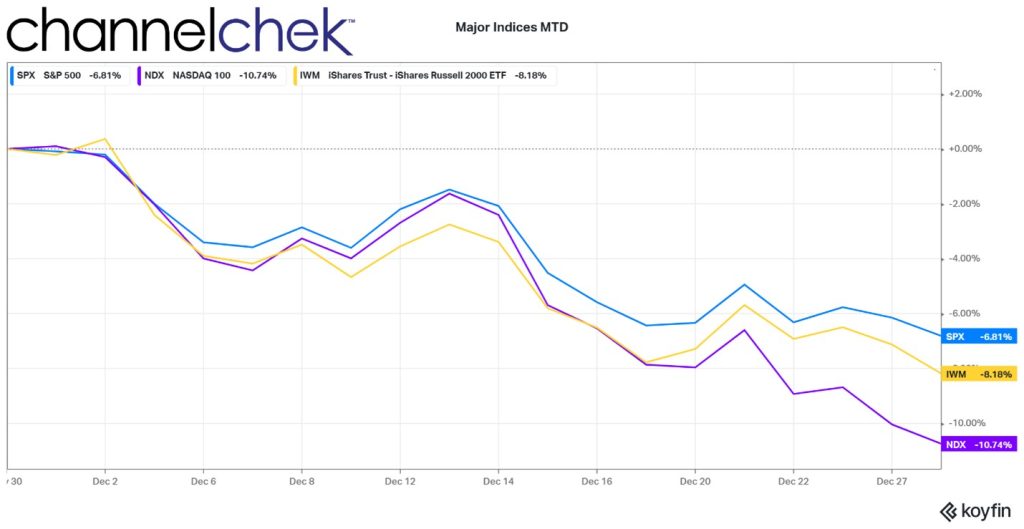
What happens after the 30-day period? Some investors try to get in, or back in, early with the notion that the most beaten-down stocks from 30 days earlier, could quickly bounce back hard for a time. This would all begin to occur following what could be perceived as the tax loss selling dip, (aged 30 days). The so-called Santa Rally is somewhat attributed to this, but that rally has not occurred during December 2022. The chart above shows a very weak December. So the buying may be postponed until early next year.
Without substantial buying this December, the first month or two of 2023 may bring buying as investors replace holdings for allocation purposes, plus any additional purchases used to bring the beaten-down sectors’ portfolio weightings up to whatever fits the investors’ strategy.
DoubleLine founder Jeffrey Gundlach told CNBC on Wednesday that risk assets will likely rally in January once retail investors finish tax-loss selling. Strategists at Evercore wrote on Nov. 30 that they were “buyers of stocks whose 2022 tax loss selling pressure will soon abate.”
Take Away
The main drivers of market moves next year are likely economic concerns such as inflation, recession, and monetary policy. But the potential for the most beaten down sectors this year, those that underperformed in December, may represent opportunity. The opportunity may not be long-lived, but for those involved in the markets, it is worth understanding why it may be occurring.
As the Bear Market Melts Down, Where Will the Grass Be Greenest?
Bear Markets and snowmen have one thing in common; they don’t last forever.
The entry point into an investment can have a huge impact on performance. Exits tend to be more critical when the stock has shown that it is not performing as planned. While this kind of exit may result in a loss, it allows the investor to preserve capital, liquid assets they can deploy if another good entry presents itself. The major stock market indices for 2022 are down 20% and more. Has this sell-off provided for performance-producing entry points in some stocks? Let’s look where we are as the countdown to 2023 has already begun.
About this Bear Market
Bear markets end – they always have. Pinpointing an exact bottom is not possible, so trying to be the first in for that great entry point may include a few false starts and some unhoped-for exits. The current slide in the stock market started around January 1, 2022. This was because some doubted whether inflation was transient at the time; by March, most understood the Fed was concerned that price increases were pervasive.
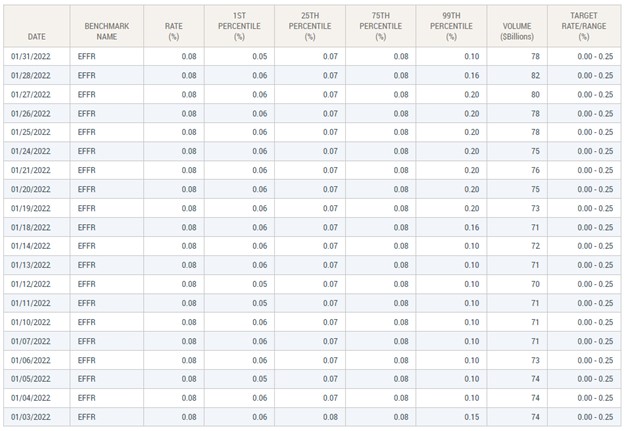
Fed Chair Powell, along with many Fed Presidents, began speaking hawkishly to not unduly surprise and unsettle markets as the central bank unwound the liquidity used in response to the novel coronavirus. What followed was unprecedented. Overnight lending rates went from an effective 0.08% to an effective 4.33% during the course of the year. This is more than 52 times the base lending rate at the start of the year. With these increases, no wonder the bear market continued.
Where Are We Now?
Expectations of overnight rate hikes in 2023 are for another 0.50%-0.75% increase leaving the target at, or just north of, 5%. This increase in the cost of money is small (.17 times) compared to the massive (52 times) rocking the markets in 2022.
So rate hikes are expected to be much lower as a percentage of current rates next year. And after the last FOMC meeting, markets have seemingly repriced lower with this expectation. If all goes as it is thought it will, the market is already priced for the worst. This is a bullish sign.
Put another way; most believe that with Fed funds beginning 2022 around zero, we’re likely much closer to the end of the Fed Funds tightening than to the beginning.
Inflation (CPI) for December won’t be reported until January 12, 2023. The latest CPI numbers show YoY up 7.1% in November, a slowing from 7.7% in October, which tapered from 8.2% the month before. The November reading of 7.1% taken by itself is a long way away from the Fed’s 2% target. But the trend in the CPI and PCE deflator also suggest the Fed is likely to monitor previous hikes to see if they will have the desired impact.
The Fed Has Been Transparent
The Fed lowered rates in line with what they promised during the pandemic. Then after some transient talk, they raised rates as they expressed they would in 2022. Following the December FOMC meeting, they suggested they were not at the end, but the voting members’ expectations for where they will settle is an average of 5.40%. The forward-looking stock market, if they believe the Fed will again do as promised, should recognize this is a much lower increase. It is perhaps near the time to begin to build on positions. This could be the entry point many investors have been waiting for.
Small Cap Phenomenon
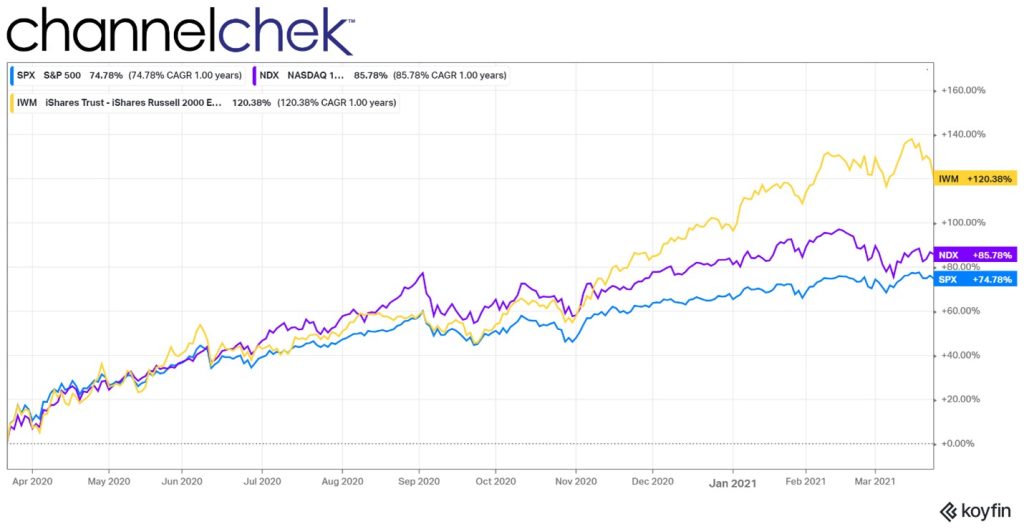
The chart below shows how much small cap stocks outperformed during the 12- months following the pandemic plunge. While small cap outperformance has been experienced during the past century of stocks’ post-sell-off periods, one only has to look back to the pandemic plunge to remember that it was small-caps (depicted below as IWM) that had been beaten down the most and by far outran the other major indices for the next year from the low of 2021.
Could this small cap phenomenon occur again after markets reach the bottom? Data demonstrates that small cap stocks tend to lead following a period of economic dislocation. One reason is US small caps have more of their business within the states and as a bonus, do well with a rising dollar. Current conditions suggest exploring smaller stocks. They have outperformed large caps following nearly every bear market of the last century. And today, the dollar has risen above its six-month high and is trending higher. While past movement comparisons don’t always include all the crosscurrents of the future, a strong argument could be made that a turnaround is near and small caps may again be the leaders by a wide margin.
Some Disclosure
Channelchek, the investment information platform you’re now reding has small cap stocks as its primary focus. The deep platform provides data on over 6000 stocks, with quality research updated regularly on many of them. Channelchek also provides videos and articles that may inspire informed stock selection. Stock selection, rather than just plowing investment dollars into an indexed ETF, may be preferable as indexed ETFs include sectors and stocks that may not be worthy of your portfolio.
Diversification across asset classes, sectors, and market capitalizations is considered prudent for long-term portfolios; individual allocations can be built on depending on where we are in the business and interest rate cycle. This includes an allocation to small cap equities, which perhaps should be expanded if the Fed is near the end of its tightening cycle. It could always be reduced later if the economy is deep into a growth cycle.
Take Away
Although we do not have a crystal ball to know exactly when the best entry point in any company stock is, if a century’s worth of data is any guide, the period following the end of a market downturn has been a good time to increase exposure to the small cap sector.
Register here for daily emails of research and ideas from Channelchek.
Investors Watching for a “Santa Rally” the Last Trading Week of 2022
Stocks in the US closed higher Friday after consumer inflation continued to ease modestly, and consumer expectations are for the trend to continue. This could set the stage for the week ahead as some expect the probability of a “Santa rally” as investors may begin using their dry powder to wave in some stocks that have gone down with the crowd but are historically cheap and showing value.
Stock markets in London, Toronto, Sydney, Hong Kong, and Johannesburg are closed. on Tuesday, December 27, since Boxing Day was already a holiday since Christmas fell on a Sunday.
The four-day trading week ahead includes the latest data on home prices with the S&P CoreLogic Case-Shiller National Home Price Index and Freddie Mac’s House Price Index (October). On Wednesday, the National Association of Realtors (NAR) will issue pending home sales figures (November). The strength of the manufacturing sector on Friday, with the Chicago Purchasing Managers’ Index (PMI) for December, has market-moving potential on the last trading day of the year.
Monday 12/26
Markets and Government Offices closed.
Tuesday 12/27
Stock markets in London, Toronto, Sydney, Hong Kong, and Johannesburg are closed.
8:30 AM ET, The US Goods Deficit (Census basis) is expected to narrow to $97.0 billion in November after deepening by more than $6 billion in October to $98.8 billion.
8:30 AM ET, Wholesale Inventories, where buildups have been lessening, are expected to rise 0.4 percent in the advance report for November.
9:00 AM ET, Case-Shiller Home Price Index, forecasters see the adjusted 20-city monthly rate falling 1.2 percent again in October after a decline of 1.2 percent in September for an unadjusted annual rate of 8.1 percent versus September’s 10.4 percent.
Wednesday 12/28
10:AM ET, Richmond Fed Manufacturing Index, the manufacturing composite is expected at minus 6, in December vs. minus 9 in November and minus 10 in October.
Thursday 12/29
8:30 AM ET, Jobless Claims for the December 29 week are expected to come in at 222,000 versus 216,000 in the prior week.
Friday 12/30
• 9:45 AM ET, The Chicago PMI is expected to bounce back in December to 41.0 versus November’s much weaker-than-expected 37.2.
The Bond markets are scheduled to close at 2 PM. Stocks have the benefit of a full trading day to close out 2022.
What Else
Replays of the Noble Capital Markets analysts’ discussions of companies they cover on Wall Street Wish List, are now available on Channelchek to help you create your own wish list for 2023. Find them here in Channelchek’s Video Content Library. And if you haven’t signed up for regular emails from Channelchek now is a good time to sign-up and see how helpful they are
Happy New Year from the entire content team at Channelchek!
The Difficult Reality of Rising Core and Super-Core Inflation
While many market participants are concerned about rate increases, they appear to be ignoring the largest risk: the potential for a massive liquidity drain in 2023.
Even though December is here, central banks’ balance sheets have hardly, if at all, decreased. Rather than real sales, a weaker currency and the price of the accumulated bonds account for the majority of the fall in the balance sheets of the major central banks.
In the context of governments deficits that are hardly declining and, in some cases, increasing, investors must take into account the danger of a significant reduction in the balance sheets of central banks. Both the quantitative tightening of central banks and the refinancing of government deficits, albeit at higher costs, will drain liquidity from the markets. This inevitably causes the global liquidity spectrum to contract far more than the headline amount.
Liquidity drains have a dividing effect in the same way that liquidity injections have an obvious multiplier effect in the transmission mechanism of monetary policy. A central bank’s balance sheet increased by one unit of currency in assets multiplies at least five times in the transmission mechanism. Do the calculations now on the way out, but keep in mind that government expenditure will be financed.
Our tendency is to take liquidity for granted. Due to the FOMO (fear of missing out) mentality, investors have increased their risk and added illiquid assets over the years of monetary expansion. In periods of monetary excess, multiple expansion and rising valuations are the norm.
Since we could always count on rising liquidity, when asset prices corrected over the past two decades, the best course of action was to “buy the dip” and double down. This was because central banks would keep growing their balance sheets and adding liquidity, saving us from almost any bad investment decision, and inflation would stay low.
Twenty years of a dangerous bet: monetary expansion without inflation. How do we handle a situation where central banks must cut at least $5 trillion off their balance sheets? Do not believe I am exaggerating; the $20 trillion bubble generated since 2008 cannot be solved with $5 trillion. A tightening of $5 trillion in US dollars is mild, even dovish. To return to pre-2020 levels, the Fed would need to decrease its balance sheet by that much on its own.
Keep in mind that the central banks of developed economies need to tighten monetary policy by $5 trillion, which is added to over $2.50 trillion in public deficit financing in the same countries.
The effects of contraction are difficult to forecast because traders for at least two generations have only experienced expansionary policies, but they are undoubtedly unpleasant. Liquidity is already dwindling in the riskiest sectors of the economy, from high yield to crypto assets. By 2023, when the tightening truly begins, it will probably have reached the supposedly safer assets.
In a recent interview, Bundesbank President Joachim Nagel said that the ECB will begin to reduce its balance sheet in 2023 and added that “a recession may be insufficient to get inflation back on target.” This suggests that the “anti-fragmentation tool” currently in use to mask risk in periphery bonds may begin to lose its placebo impact on sovereign assets. Additionally, the cost of equity and weighted average cost of capital increases as soon as sovereign bond spreads begin to rise.
Capital can only be made or destroyed; it never remains constant. And if central banks are to effectively fight inflation, capital destruction is unavoidable.
The prevalent bullish claim is that because central banks have learned from 2008, they will not dare to allow the market to crash. Although a correct analysis, it is not enough to justify market multiples. The fact that governments continue to finance themselves, which they will, is ultimately what counts to central banks. The crowding out effect of government spending over private sector credit access has never been a major concern for a central bank. Keep in mind that I am only estimating a $5 trillion unwind, which is quite generous given the excess produced between 2008 and 2021 and the magnitude of the balance sheet increase in 2020–21.
Central banks are also aware of the worst-case scenario, which is elevated inflation and a recession that could have a prolonged impact on citizens, with rising discontent and generalized impoverishment. They know they cannot keep inflation high just to satisfy market expectations of rising valuations. The same central banks that assert that the wealth effect multiplies positively are aware of the disastrous consequences of ignoring inflation. Back to the 1970s.
The “energy excuse” in inflation estimates will likely evaporate, and that will be the key test for central banks. The “supply chain excuse” has disappeared, the “temporary excuse” has gotten stale, and the “energy excuse” has lost some of its credibility since June. The unattractive reality of rising core and super-core inflation has been exposed by the recent commodity slump.
Central banks cannot accept sustained inflation because it means they would have failed in their mandate. Few can accurately foresee how quantitative tightening will affect asset prices and credit availability, even though it is necessary. What we know is that quantitative tightening, with a minimal decrease in central bank balance sheets, is expected to compress multiples and valuations of risky assets more than it has thus far. Given that capital destruction appears to be only getting started, the dividing effect is probably more than anticipated. And the real economy is always impacted by capital destruction
The Holiday Weeks Ahead are Likely to Include Lighter Trading Volumes
End-of-year window dressing occurs when mutual funds and other managed money sell their losing stocks before December 31 to avoid sitting in front of trustees early in the new year and having these stocks still listed as holdings. This often has the effect of concentrating end-of-year selling in stocks that are already the worst performers over the ending year. These same stocks are then favored early in the new year. Keep in mind some of this money may temporarily move to the fixed-income markets. Volume for the next two holiday weeks is typically lighter than usual.
Speaking of bad-performing stocks, FedEx reports earnings on Tuesday, December 20 (4:30). If you recall, they last reported on September 15 and missed expected earnings. That earnings call caused the stock to move from $204 to $161 during the following trading session. FedEx earnings will be of particular interest for this reason and because it’s an early indicator of this holiday shopping season.
It’s a light week for economic numbers; those that have the strongest possibility of moving markets occur on Wednesday’s Consumer Confidence and Friday’s Durable Goods data. Friday is a regular trading day for the stock exchanges, the bond markets enjoy an early 2 PM close.
Monday 12/19
• 10:00 AM ET, the Housing Market Index is expected to show a 34, according to Econoday’s consensus numbers. This would halt the downward spiral of this measure. Last month the reading was 33.
Tuesday 12/20
• 8:30 AM ET, Housing Starts and Permits are expected to be 1.4 million from the previous 1.425 million. Residential construction has been slowing and slowing significantly.
Wednesday 12/21
• 8:30 AM ET, The third-quarter current account deficit is expected to narrow to $225.0 versus the $251.1 billion reported in the second quarter. The current account is a quarterly measure of the U.S. international balance in goods and services trade as well as unilateral transfers.
• 10:00 AM ET, Consumer Confidence is expected to edge higher to a marginally less depressed 101.0 versus November’s 100.2. Trends in consumer attitudes and spending can be one of the most impactful influences on the stock market. This is because strong economic growth translates to healthy corporate profits and higher stock prices.
Thursday 12/22
• 8:30 AM ET, Gross Domestic Product (GDP) third estimate for the third quarter is not expected to change at all from the previous estimate of 2.9%. This is the final read from the third quarter, it indicates we were not in a recession and instead had better growth than the first two quarters.
Friday 12/23
• 8:30 AM ET, Forecasters expect Durable Goods Orders to fall 0.7 percent in November following a 1.1 percent rise in October. This is a true leading indicator as orders for durable goods show how active factories will be in the months to come as manufacturers fill those orders. The data not only provide insight to demand items such as refrigerators and cars but also business investments such as industrial machinery, electrical machinery, and computers. So it may also indicate how confident the industry is for a period into the future.
What Else
Were you able to watch the equity analysts from Noble Capital Markets discuss stocks within their areas of expertise on Wall Street Wish List aired last Thursday through Channelchek? A replay may become available this week for those that wish to rewatch or those that prefer to digest all the information in smaller bites. Those signed up for emails from Channelchek will be given a heads-up when this replay happens.
Happy Hanukkah, Merry Christmas, and peace to all from the entire content team at Channelchek!
Fed Chairman Powell is Being Ignored by the Markets – What Next?
Is Fed Chairman Powell getting the George Costanza treatment from the bond market? I asked myself this as I listened to the Chair double down on his hawkishness yesterday while at the same time watching the bond market yawn. Rates were effectively unchanged out in the periods. It reminded me of the Seinfeld episode where George tells his girlfriend, point blank, I’m breaking up with you.” She simply replies, “No.” Similar to George, Powell’s wishes are not being recognized by the market which would be hurt by them. Today mortgage rates dropped along with treasury yields, this all makes Powell’s job tricky.
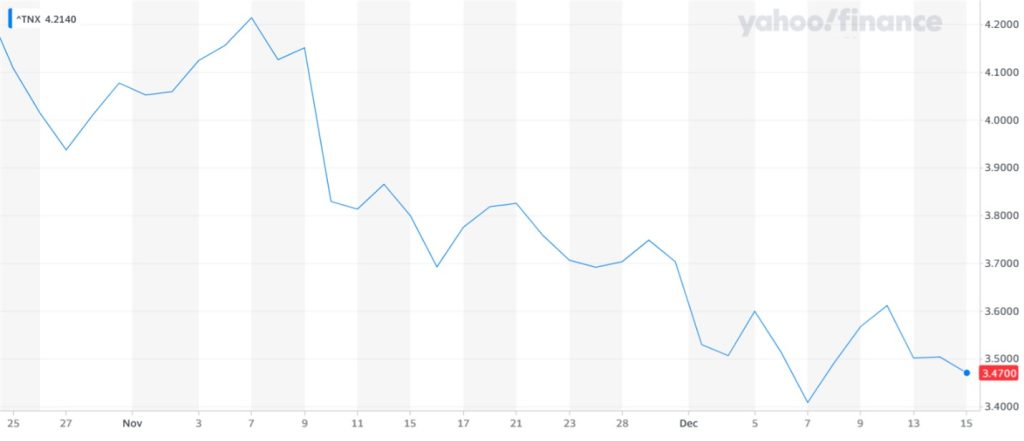
The FOMCs final episode of the 2022 season ended as expected with a 50 bp increase, and the Fed Chairman addressing reporters and trying to be taken seriously by the markets. Afterall, he can say he’s raising rates all he wants to slow growth, if lending rates don’t rise, the Fed doesn’t achieve its goal. Since October 24, the Fed has raised overnight rates 1.25%. As seen below in the chart, despite the increase from a 3% target to a 4.25% target (which is a 42% increase in bank lending rates), the ten year which is a benchmark for consumer lending rates, declined by 0.75% (which is an 18% decline).
Markets are forward looking. Currently they seem to be, more farsighted than usual. As Chairman Powell repeats after each increase that officials anticipate that “ongoing increases” in the Fed Funds rate will be “appropriate,” this would be expected by someone of Powell’s experience to cause the market to look toward rate increases and shift the yield curve higher. The Fed has done more than this. The official one-year-out Fed forecast is for the Fed funds rate to end 2023 at 5.1% and 4.1% for 2024. These were 4.6% and 3.9% previously. Mortgage rates today hit recent lows.
Meanwhile overnight interest rates this year have increased by 50 times from where they started (.08% to 4.00%). By comparison the benchmark Treasury was trading at 1.73% at the start of the year, so its level has gone up by two times.
But the current market has been so forward-looking in 2022, that each time the Fed puts on its hawkish face, the bond markets take it as more assurance that the U.S. will fall into a recession. They trade on the reassurance that the Fed will need to ease, and it effectively eases borrowing rates as benchmark yields decline. The bond and even stock markets expect the tightening to be transitory. They also only half listen to the Fed Chair because they know how wrong he was when he suggested inflation was transitory just one year ago.
CPI is also causing markets to be optimistic. Two consecutive consensus misses of inflation have led the participants to believe we are getting very close to the peak for interest rates, and rate cuts will soon be on the agenda. The Fed has been doing everything it can to change people’s minds.
The Fed’s View
While the market may be saying “no” and not allowing Powell to impose higher rates along the curve, the Fed certainly is going to keep trying. A 2% inflation target with inflation running approximately three times this won’t allow for an easing of policy. Even if overnight Fed Funds are so high that they are near historical norms.
For the Fed to accept what the market is pricing for, it will want to see substantial evidence that inflation is slowing. This will take more than just one or two months, where core inflation has come in less than the market was expecting. It isn’t an exact science to bring down inflation, but mathematically to get inflation to 2% YoY, over time, we need to see month-on-month readings averaging 0.17% MoM. We are not close, considering it is the core PCE deflator that the Fed pays the most attention to. In fact, the Fed just revised its inflation forecast upward because the core PCE deflator is likely to be stickier than core CPI. The revision has its core PCE estimate at 3.5% for the end of 2023 versus 3.1% previously, with 2024 revised up to 2.5% from 2.3%.
Take Away
What happens when monetary policy throws us huge increases in Fed Funds in seven out of its eight meetings, and late in the year, the interest rate markets decides, “No?”
It seems the Fed is working on its ability to jawbone rates higher. We saw this after the FOMC meeting with Powell doubling down on his rhetoric. We can expect more Fed addresses trying to move rates in a way that direct action concerning overnights has failed to accomplish. In the end, it’s the markets that set levels; if the bond market and stock market participants keep taking this hawkish language as recessionary, the hawkish stance could continue to backfire on the Fed.
Comments from Fed Chair Powell emphasized that the FOMC wants financial conditions to “reflect the policy restraint that we’re putting in place”. After all, inflation is indeed still running well above target, the jobs market and wage pressure remain hot, and activity data is pointing to a decent fourth-quarter GDP report after a healthy 2.9% growth rate in the third quarter. Will he succeed? If my memory serves me correctly, in the Seinfeld episode George wound up engaged to the woman he was breaking up with.
Everything You Always Wanted to Know About Equity Analysts* (*But Were Afraid to Ask)
Determining the potential of a company stock involves more time and perhaps more understanding than the average self-directed investor can provide. Fortunately, there are investment analysts that specialize in equities and spend their days staying current on the industry, individual companies, and the risks associated with the overall market. The investment world is becoming more transparent as the work of these well-educated professionals has become more accessible to DIY investors.
Just what is it that equity analysts do, and how do individual and professional investors benefit from their work?
The Value of Equity Analysts
Equity analysts have a deep understanding of company financials. This begins with formal education, as most true analysts have an accounting background that may include an MBA and, in many cases, the highly esteemed Chartered Financial Analyst (CFA) designation.
In addition to being able to read and pull data for analysis from financials, they understand the industries they cover. This is important because external trends up or down in input prices or competition will impact the whole sector, including the companies they cover. A macro view of what is impacting the industry is foundational to understanding a company within the industry.
For individual investment opportunities, the analysts’ focus is on the equity portion of the capital structure, but understanding debt levels and factors that could impact debt financing is critical to building an overall financial picture. Comparing the financial structure to company goals and initiatives provides information on how realistic they may or may not be based on internal factors.
Using data from the past and present, an analyst will build a model tailored to the specific company. These models are usually detailed spreadsheets with many interconnections between the various categories. The models generally include industry growth trends, the company’s own numbers (past, current, and projected scenarios), and then what-if scenarios. Financial models are a tool used to estimate the valuation of the company, how it changes under various scenarios, and then compare the business to its peers.
Shocking a forecast for different risks is important to assess the overall risk to the forecast.
The main risks impact different industries differently. For example, a healthcare company may be more or less immune to inflation, a mining operation could benefit from it, and a hospitality-based business could be hurt by it. Analysts assess the potential impacts of known risks and weigh them into their evaluation.
Primary Risks
The primary risks impacting any industry could be thought of as Business Risks, the challenges of a particular company’s circumstances. This could include the ability to hire talent, legal changes that could be impactful, natural resource availability, etc.
Market Risk or systemic risk is the idea that a sinking stock market will weigh on all stocks. While an analyst may choose top performers if the price target assigned was from an evaluation under average market growth of X%, an actual experience of negative Y% is a risk to the forecast.
Sovereign Risk has become a much bigger concern as trading partners like Russia, and China has shown us that politics and business policies can greatly impact U.S. trading partners. This risk tends to be greater among large international companies.
Foreign Exchange Risk. An analyst will review the impact of conversion back to the native currency and profit impacts. They may even project whether customers could be lost if the U.S. dollar becomes too costly.
Inflation Risk, what might the impact be on the company under various possible scenarios? A company with a large inventory may actually go through a beneficial period while prices are rising.
Interest Rate Risk is the real threat of inflation because it typically raises the cost of money. If the company is a large borrower and will be rolling maturing debt at new interest rate levels, the analyst will determine how this impacts operating costs and profit going forward.
Liquidity Risk. If a company’s stock is not well followed and trades sporadically, selling shares to raise capital may be severely hindered and, therefore, negatively impact the company’s ability to finance its business plan. What is interesting to note here is that analyst coverage of a company by itself has been shown to improve a stock’s liquidity. This is because more information about companies, even if not positive, helps investors understand the company, its risks, and its value.
Equity analysts benefit investors (retail and institutional) that are looking for information and an evaluation from a professional to weigh against their own evaluation. But they also benefit issuers as their stock may get less attention if there is minimal quality information available.
Direct Access to Management
Analysts essentially have a hotline to the covered company’s CEO and CFO to ask questions and get details of any change within the company or outside change that may impact results. Most investors don’t have this, so relying on analysts takes on even more importance.
Nuances Known to Analysts
The best reason to check the thoughts and forecasts of a seasoned analyst as part of your own due diligence is that every company has so many moving parts. A good analyst will be aware of what a DIY investor won’t know about the company. For example, the veteran analysts that provide research to Channelchek. On an ongoing basis, they have their finger on the pulse of the companies they cover.
There’s an opportunity you will want to take advantage of on Wednesday, December 15. You will meet online the Wall Street Analysts who are behind the research published on Channelchek. During this no-cost meeting, the veteran analysts have been asked to uncover what they are looking at, especially as it relates to companies they are bullish on.
This could be a great kickoff to organizing your portfolio for 2023 as these analysts cover the less talked about and perhaps the most overlooked stocks – stocks with great potential and “nuance” that you may have missed.
“Investors should not care whether the Fed pivots or not if they analyze investment opportunities based on fundamentals and not on monetary laughing gas,” writes economist Daniel Lacalle, PhD. In his latest article, published below. LaCalle takes on the journalists and economists that see market risk differently than himself. This is a thought-provoking read for anyone who has been living on a diet of mostly CNBC, and Yahoo Finance, as exposure to diverse market viewpoints is considered healthy. – Paul Hoffman, Channelchek
Obsessed Investors
In a recent Bloomberg article, a group of economists voiced their fears that the Federal Reserve’s inflation fight may create an unnecessarily deep downturn. However, the Federal Reserve does not create a downturn due to rate hikes; it creates the foundations of a crisis by unnecessarily lowering rates to negative territory and aggressively increasing its balance sheet. It is the malinvestment and excessive risk-taking fuelled by cheap money that lead to a recession.
Those same economists probably saw no risk in negative rates and massive money printing. It is profoundly concerning to see that experts who remained quiet as the world accumulated $17 trillion in negative yielding bonds and central banks’ balance sheets soared to more than $20 trillion now complain that rate hikes may create a debt crisis. The debt crisis, like all market imbalances, was created when central banks led investors to believe that a negative yielding bond was a worthwhile investment because the price would rise and compensate for the loss of yield. A good old bubble.
Multiple expansion has been an easy investment thesis. Earnings downgrades? No problem. Macro weakness? Who cares. Valuations soared simply because the quantity of money was rising faster than nominal GDP (gross domestic product). Printing money made investing in the most aggressive stocks and the riskiest bonds the most lucrative alternative. And that, my friends, is massive asset inflation. The Keynesian crowd repeated that this time would be different and consistently larger quantitative easing programs would not create inflation because it did not happen in the past. And it happened.
Inflation was already evident in assets all over the investment spectrum, but no one seemed to care. It was also evident in non-replicable goods and services. The FAO food price index already reached all-time highs in 2019 without any “supply chain disruption” excuse or blaming it on the Ukraine war. House prices, insurance, healthcare, education… The bubble of cheap money was clear everywhere.
Now many market participants want the Fed to pivot and stop hiking rates. Why? Because many want the easy multiple expansion carry trade back. The fact that investors see a Fed pivot as the main reason to buy tells you what an immensely perverse incentive monetary policy is and how poor the macro and earnings’ outlook are.
Earnings estimates have been falling for 2022 and 2023 all year. The latest S&P 500 earnings’ growth estimates published by Morgan Stanley show a modest 8 and 7 percent rise for this and next year respectively. Not bad? The pace of downgrades has not stopped, and the market is not even adjusting earnings to the downgrade in macroeconomic estimates. When I look at the details of these expectations, I am amazed to see widespread margin growth in 2023 and a backdrop of rising sales and low inflation. Excessively optimistic? I think so.
Few of us seem to realize a Fed pivot is a bad idea, and, in any case, it will not be enough to drive markets to a bull run again because inflationary pressures are stickier than what consensus would want. I find it an exercise in wishful thinking to read so many predictions of a rapid return to 2% inflation, even less, when history shows that once inflation rises above 5% in developed economies, it takes at least a decade to bring it down to 2%, according to Deutsche Bank. Even the OECD expects persistent inflation in 2023 against a backdrop of weakening growth.
Stagflation. That is the risk ahead, and a Fed pivot would do nothing to bring markets higher in that scenario. Stagflation periods have proven to be extremely poor for stocks and bonds, even worse when governments are unwilling to cut deficit spending, because the crowding out of the private sector works against a rapid recovery.
Current inflation expectations suggest the Fed will pivot in the first quarter of 2023. That is an awfully long time in the investment world if you want to bet on a V-shaped market recovery. Even worse, that pivot expectation is based on a surprisingly accelerated reduction in inflation. How can it happen when central banks’ balance sheets have barely moved in local currency, reverse repo liquidity injections reach trillion-dollar levels every month and money supply has barely corrected from the all-time highs of 2022? Many are betting on statistical bodies tweaking the calculation of CPI (consumer price index), and believe me, it will happen, but it will not disguise earnings and margin erosion.
To cut inflation drastically three things need to happen, and only one is not enough. 1) Hike rates. 2) Reduce the balance sheet of central banks meaningfully. 3) Stop deficit spending. This is unlikely to happen anytime soon.
Investors that see the Fed as too hawkish look at money supply growth and how it is falling, but they do not look at broad money accumulation and the insanity of the size of central banks’ balance sheets that have barely moved in local currency. By looking at money supply growth as a variable of tightness in monetary policy they may make the mistake of believing that the tightening cycle is over too soon.
Investors should not care whether the Fed pivots or not if they analyze investment opportunities based on fundamentals and not on monetary laughing gas. Betting on a Fed pivot by adding risk to cyclical and extremely risky assets may be an extremely dangerous position even if the Fed does revert its pace, because it would be ignoring the economic cycle and the earnings reality.
Central banks do not print growth. Governments do not boost productivity. However, both perpetuate inflation and have an incentive to increase debt. Adding these facts to our investment analysis may not guarantee high returns, but it will prevent enormous losses.