The Lithium Dip May Be Worth Exploring
Lithium (Li) was once synonymous with treating depression. Today the mineral is more often discussed as part of the subject of sustainable energy storage, specifically batteries. So it’s ironic that the recent stock price movement of a number of companies tied to lithium may have depressed some investors, as February has seen a sudden depression in values. The primary reason for the decline in lithium stocks may actually be a net plus for miners and others tied to production. This thinking is outlined below.
Many companies involved in Li exploration and/or production were up on the year along with the overall market. Late last week and carrying over to today, many of these stocks have fallen dramatically. The reason for the sudden decline coincided with the largest EV battery manufacturer, Contemporary Amperex Technology’s (CATL) announcement that it will cut the price it charges for Li-ion batteries.
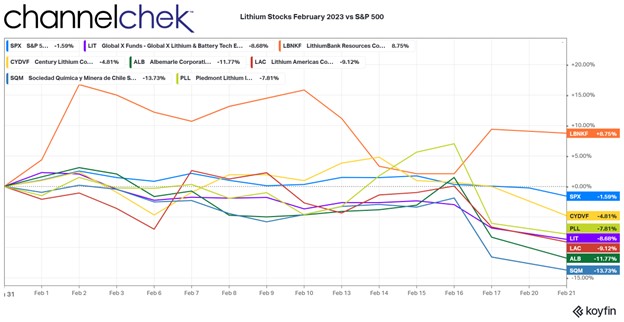
As seen in the chart below, Shares of the larger lithium miners Albemarle ALB (ALB), SQM (SQM), Livent (LTHM), Piedmont Lithium (PLL), and Lithium Americas (LAC) are down between 7% and 14% with much of that drop coming in the past few trading days. Smaller lithium mining operations like LithiumBank Resources Corp. (LBNKF), and Century Lithium Corp. (CYDVF) fared much better, outperforming the more established larger companies.
Did Traders Get this Wrong?
CATL seems to have aimed to maintain or grow its market share as a battery manufacturer. Any price war they may have started is likely to have a direct impact on competitors. Even car manufacturers that are involved in battery sales may shed some profitability, but is it necessarily a negative for companies involved in mining or refining?
CATL plans on pricing its batteries on a lithium-price-linked calculation. With this, 50% of each battery will benchmark to lithium carbonate, which would largely embed the price of lithium in its Li-ion product. The rest of the batteries will key off of the spot market for lithium carbonate.
Spot prices for lithium carbonate are up about ninefold over the past few years as the growth in EV demand and other battery-operated products has stressed the global lithium supply chain. So while CATL has decided to discount batteries, the production costs are unlikely to fall. The move may instead place greater demand on lithium carbonate. If production doesn’t keep up with, what should spark greater demand for Li-ion batteries, miners may benefit. If correct, this could suggest the declines in mining stock prices related to CATL’s new pricing policy, may be considered as an entry point for investors that had been looking for a price dip.
As for battery makers, this may have more permanently drained value. CATL is about 68% of the mainland Chinese EV battery manufacturing industry. Other battery producers may have to similarly adjust their pricing models to compete. This group includes Panasonic, LG Energy, Samsung, and SK Innovations that also tumbled this month.
Take Away
Mining analysts discuss supply and demand, or deficit and surplus, when adjusting forecasts. If demand grows as a result of the large battery manufacturer CATL discounting prices, and this discounting causes others to follow, the result could be a larger lithium deficit that could raise the price of the mineral per USD/metric-ton. Time will tell.
Managing Editor, Channelchek
Sources
https://www.barrons.com/articles/lithium-stocks-tesla-ev-battery-shares-40aa53d0?mod=hp_columnists
https://www.barrons.com/articles/tesla-stock-price-graphite-battery-magnis-bc0dad59?mod=hp_LATEST