Reasons Investors Should Beware the Ides of March
The FDIC, no doubt, was working overtime this weekend trying to find a suitor for Silicon Valley Bank. The bank’s demise makes it the second-largest bank in US history to have not managed its risks well enough to survive. Investors, depositors, and other interested parties have been awakened and are now checking their own likelihood of overexposure to banks. Some of this exposure could be through investments in companies that had uninsured deposits at SVB.
One risk that may be impacting investors’ psyche now is recollections of 2008 and viewing last Friday’s bank closure as the canary (or Lehman Bros.) in the coal mine. Whether this is a singular incident or just the beginning of escalating problems remains to be seen. But investors tend to always look back on the most recent similar event then think “here we go again.” Important economic numbers aside, such as CPI on Tuesday, or Residential Construction on Thursday, the loudest news will be centered on SVB and whether the Fed will now pivot.
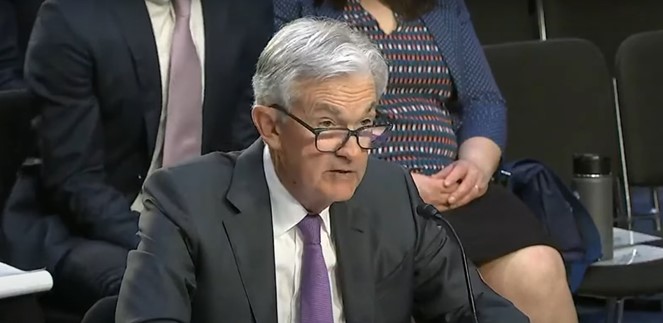
The Fed and regional Presidents have been in a blackout period since Saturday; this is normal leading up to an FOMC meeting (March 21-22). However, this blackout period has been partially breached with a joint statement between Fed Chair Powell and Treasury Secretary Yellen, who incidentally was his predecessor. Keep an eye on Channelchek news postings for more information on this statement.
Monday 3/13
- No Economic numbers are to be released
Tuesday 3/14
- 6:00 AM ET, The Small Business Optimism index has been below the historical average of 98 for 13 months in a row. The small business optimism index comes a monthly survey that is by the National Federation of Independent Business (NFIB). The index is a composite of 10 seasonally adjusted components based on the following questions: plans to increase employment, plans to make capital outlays, plans to increase inventories, expect the economy to improve, expect real sales higher, current inventory, current job openings, expected credit conditions, now a good time to expand, and earnings trend.
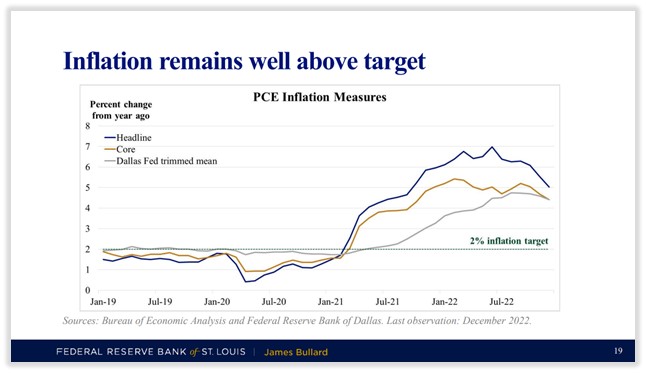
- 8:30 AM ET, Consumer Price Index (CPI), investors now lay awake waiting for inflation reports. For February, core prices are expected to hold steady at an elevated 0.4 percent monthly gain, with overall prices also expected to rise 0.4 percent after January’s 0.5 percent rise. Annual rates, which in January were 6.4 percent overall and 5.6 percent for the core, are expected at 6.0 and 5.5 percent.
Wednesday 3/15
- 8:30 AM ET, Producer Price Index (PPI), this measure of wholesale inflation ought to be the second most market-impacting number of the week. After rising a sharper-than-expected 0.7 percent in January, producer prices in February are expected to slow to a monthly 0.3 percent. The annual rate in February is seen at 5.4 percent versus January’s 6.0 percent. February’s ex-food ex-energy rate is seen at 0.4 percent on the month and 5.2 percent on the year versus January’s 0.5 and 5.4 percent, both of which were also sharper than expected.
- 10:00 AM ET, The Housing Market Index jumped 4 points in January and another 7 points in February but further improvement, given a sharp rise in mortgage rates, is not expected for March where the consensus is a 1 point decline to 41.
- 10:00 AM ET, Business Inventories in January are expected to remain unchanged following 0.3 percent builds in both December and November. Rising inventories can be an indication of business optimism that sales will be growing in the coming months. By looking at the ratio of inventories to sales, investors can see whether production demands will expand or contract in the near future. On the other hand, if unintended inventory accumulation occurs then production will probably need to slow while current inventories are worked down. This is why business inventory data is a forward indicator.
- 10:00 AM ET, Atlanta Fed Business Inflation Expectations is was previously 2.9%. The percentage provides a monthly measure of year-ahead inflation expectations and inflation uncertainty from the perspective of firms. John Williams the President of the New York Fed will be speaking.
Thursday 3/16
- 8:30 AM ET, Housing Starts in February is expected to come in flat at 1.315 million. Permits that were 1.339 million in January, are also seen flat at 1.340 million.
- 8:30 AM ET, Jobless Claims for the March 11 week are expected to come in at 205,000 versus 211,000 in the prior week.
Friday 3/17
- 10:00 AM ET, Consumer Sentiment is expected to repeat at a depressed 67.0.
- 10:00 AM ET, the Index Leading Economic Indicators is expected to fall a further 0.2 percent in February. This index has been in severe decline though contraction did slow in January to minus 0.3 percent. It seldom moves markets as most of the components that make it up are already known.
What Else
The clock change ought to cause some traders to be more tired than normal. However, all will be looking to see the FDIC’s plans for SVB.
The markets have been a stock pickers market since January 2022. The consensus is that the stock indices will be weak after a strong January and bonds, according to the Fed itself, face strong monetary policy headwinds. Yet, inflation is high and therefore so are the detrimental erosive effects of price increases. So remaining in cash is like accepting a buying power loss.
For institutional or individual investors in New York or South Florida, there may be the opportunity to listen to the management of some interesting companies (no cost). The company that Michael Burry recently owned, GEO Group ($GEO) will be holding a luncheon roadshow in NYC on March 14. This is an interesting company with political policy headwinds and extreme historical positives. Get more information here on attending. Another interesting opportunity for investors to meet and question management of a company that doesn’t necessarily wilt with economic weakness is the breakfast (Boca Raton, FL) or lunch (Miami, FL) meetings with 1(800) FLOWERS ($FLWS). Register to see if there are still open seats here.
Managing Editor, Channelchek