What Happens if the US Hits the Debt Ceiling?
The US debt limit is the total amount of money the United States government is authorized to borrow to meet its existing obligations. These include interest on debt, Social Security, military costs, government payroll, utilities, tax refunds, and all costs associated with running the country.
The debt limit is not designed to authorize new spending commitments. Its purpose is to provide adequate financing for existing obligations that Congress, through the years, has approved. While taxes provide revenue to the US Treasury Department, taxation has not been adequate since the mid-1990s to satisfy US spending. This borrowing cap, the so-called debt ceiling, is the maximum congressional representatives have deemed prudent each year, and has always been raised to avert lost faith in the US and its currency.
Failing to increase the debt limit would have catastrophic economic consequences. It would cause the government to default on its legal obligations – which has never happened before. Default would bring about another financial crisis and threaten the financial well-being of American citizens. Since a default would be much more costly than Congress meeting to approve a bump up in the borrowing limit, which the President could then sign, it is likely that any stand-offf will be resolved on time.
Congress has always acted when called upon to raise the debt limit. Since 1960, Congress has acted 78 separate times to permanently raise, temporarily extend, or revise the definition of the debt.
How Does this Apply Today?
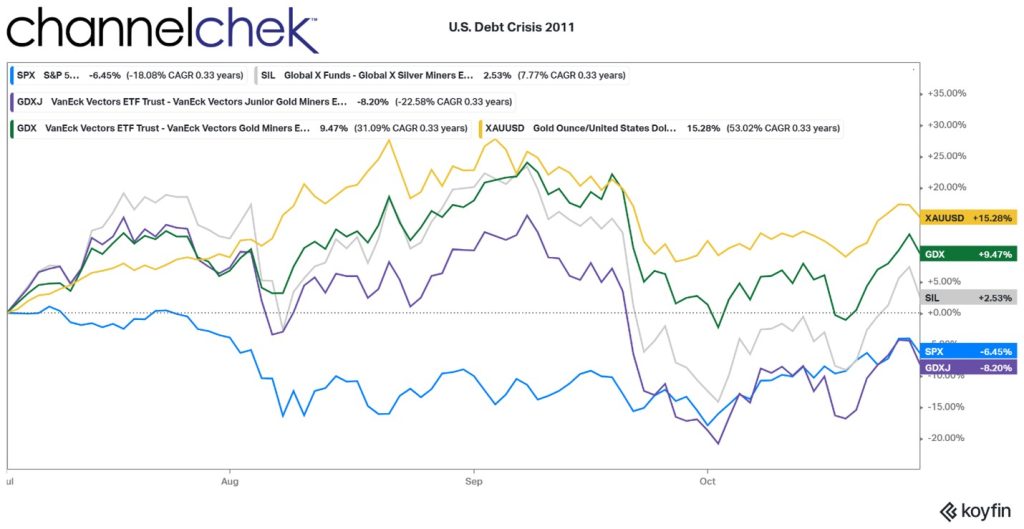
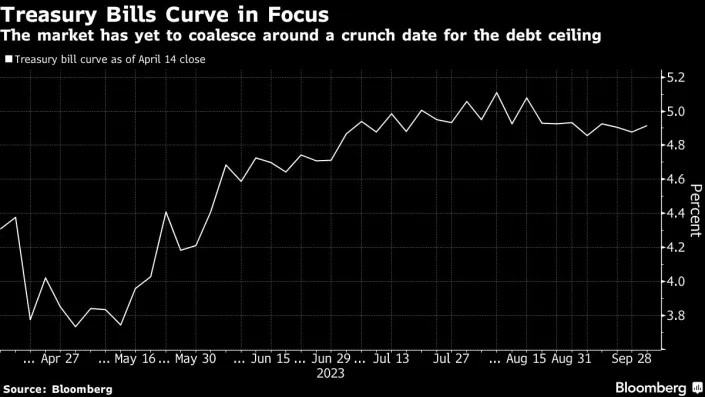
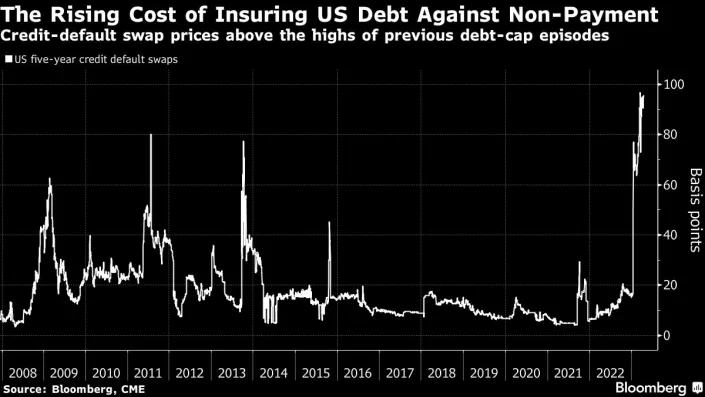
According to the Congressional Budget Office, tax receipts through April have been less than the CBO anticipated in February. The Budget Office now estimates that there is a significantly elevated risk that the US Treasury will run out of funds in early June 2023. The US Treasury Secretary has even warned that after June 1, the US will have trouble meeting its obligations. The implications could include a credit rating downgrade in US debt which could translate to higher interest rates. If US Treasury obligations, the so-called “risk free” investments, does not pay bondholders on time (interest), then the entire underpinning of an economy that relies on the faith in its economic system, could quickly unravel.
What Took Us Here?
On January 19, 2023, the statutory limit on the amount of debt that the Department of the Treasury could issue was reached. At that time, the Treasury announced a “debt issuance suspension period” during which, under the law, can take “extraordinary measures” to borrow additional funds without breaching the debt ceiling.
The Treasury Dept. and the CBO projected that the measures would likely be exhausted between July and September 2023. They warned that the projections were uncertain, especially since tax receipts in April were a wildcard.
It’s now known that receipts from income tax payments processed in April were less than anticipated. Making matters more difficult, the Internal Revenue Service (IRS) is quickly processing tax return payments.
If the debt limit is not raised or suspended before the extraordinary measures are exhausted, the government will ultimately be unable to pay its obligations fully. As a result, the government will have to delay making payments for some activities, default on its debt obligations, or both.
What Now?
The House of Representatives passed a package to raise the debt ceiling by $1.5 trillion in late April. The bill, includes spending cuts, additional work requirements in safety net programs, and other measures that are unpopular with Democrats. To pass, the Senate, which has a Democratic majority, would have to pass it. Democratic Senator Chuck Schumer described the chances as “dead on arrival.”
House Speaker McCarthy has accepted an invitation from President Biden to meet on May 9 to discuss debt ceiling limits. The position the White House is maintaining is that it will not negotiate over the debt ceiling. The President’s party is looking for a much higher debt ceiling that allows for greater borrowing powers.
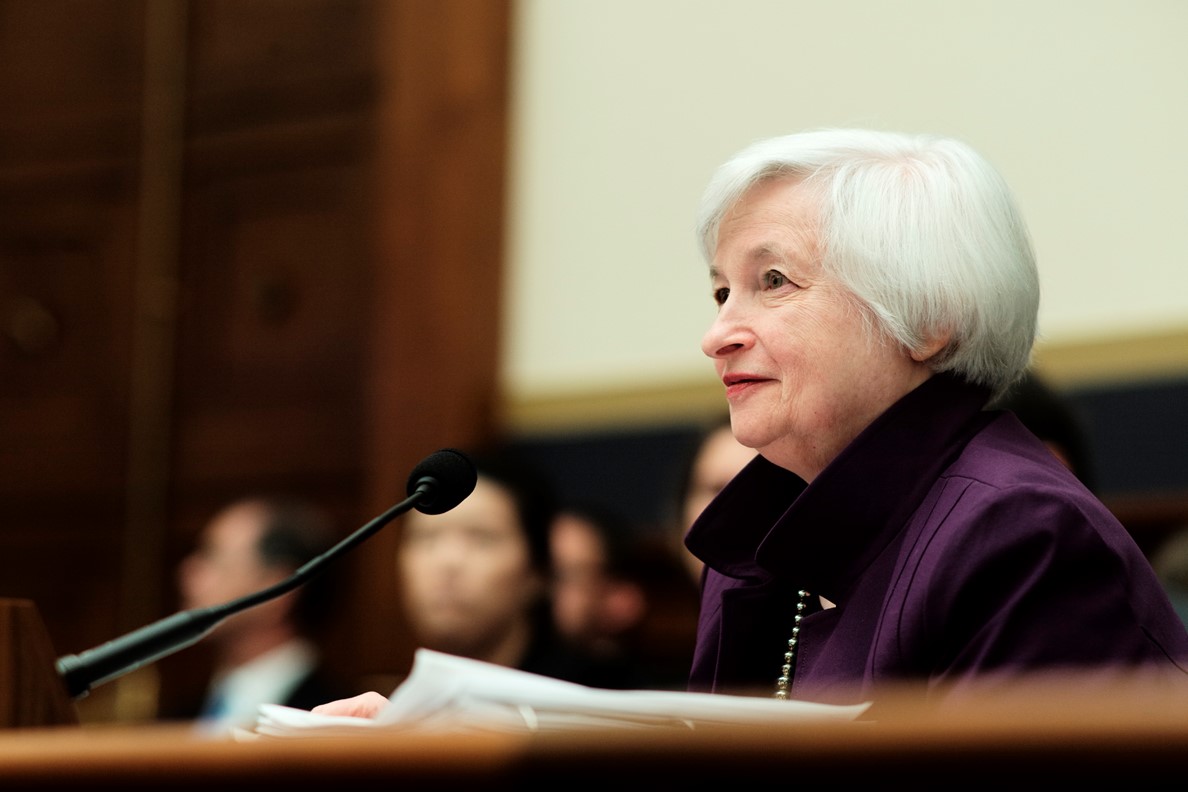
In the past, debt ceiling negotiations have often gone into the night on the last day and have suddenly been resolved in the nick of time. Treasury Secretary Yellen made mention of this and warned that past debt limit impasses have shown that waiting until the last minute can cause serious harm, including damage to business and consumer confidence as well as increased short-term borrowing costs for taxpayers. She added that it also makes the US vulnerable in terms of national security.
Expect volatility in all markets as open discussions and likely disappointments will heat up beginning at the May 9th meeting between McCarthy and Biden.
Managing Editor, Channelchek
Sources
https://fiscaldata.treasury.gov/americas-finance-guide/