The Acceleration of Biotech Acquisitions, Why it Should Continue
The pace of mergers and acquisitions (M&A) in the biotech sector has accelerated in 2023 compared to 2022 and 2021. The factors driving this increase are numerous, and there is increasing urgency on both sides, the acquirers and acquirees to find a fit. This is playing out with deal value up significantly in 2023, with noticeable acceleration as the year has progressed. During the first quarter, investors in at least eight biotech companies found themselves in enviable positions. Below is a recap of what has already happened and the perceived trend. If it continues, it could lead to 2023 seeing far more biotech deals than the previous two.
According to data from William Blair’s quarterly biopharma review, the total deal volume in the sector was elevated, although far below record highs. Total M&A value for the first quarter was $52 billion versus $88 billion for all of 2022, and $77 billion in 2021. The report shows the average deal was $630 million (versus $367 million in 2022). The upfront cash and equity has doubled from the prior year at $508 million (versus $249 million in 2022).
Later stage companies seem to be what pharmaceutical firms have the most appetite for. The phase of development of the companies most sought was Phase II or later with 100% or all of the public acquisitions in this stage. Five of the eight were in the commercial stage.
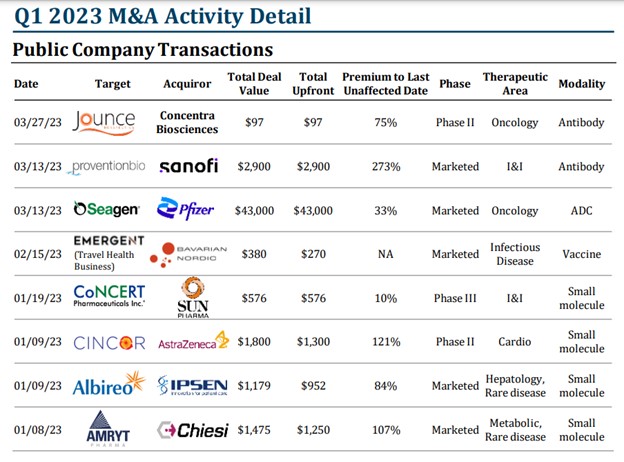
The details above are of the eight public companies that merged or were acquired during the first quarter. However, just this week alone, there have been three more biotech acquisitions announced:
- On May 16, 2023, Merck & Co. announced that it would acquire Acceleron Pharma for $11.5 billion. Acceleron is a clinical-stage biopharmaceutical company, the acquisition will give Merck access to Acceleron’s lead drug candidate, luspatercept, which is currently in Phase 3 clinical trials for the treatment of anemia associated with chronic kidney disease.
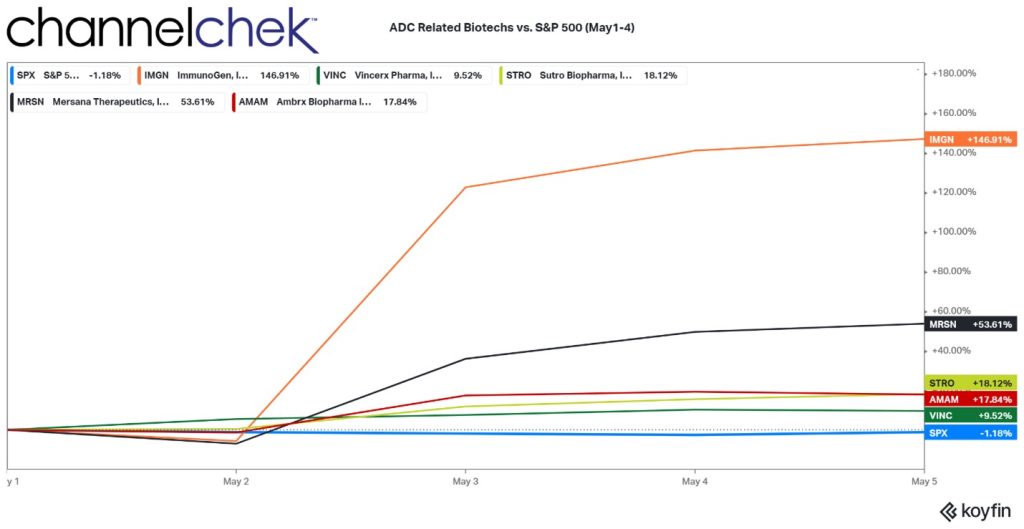
- On May 17, 2023, Gilead Sciences announced that it would acquire Immunomedics for $21 billion. Immunomedics is a clinical-stage biopharmaceutical company the acquisition will give Gilead access to Immunomedics’ lead drug candidate, Trodelvy, which is currently in Phase 3 clinical trials for the treatment of triple-negative breast cancer.
- On May 18, 2023, AstraZeneca announced that it would acquire Daiichi Sankyo’s oncology business for $6.9 billion. Daiichi Sankyo’s oncology business includes a portfolio of marketed and late-stage cancer drugs. The acquisition will give AstraZeneca a broader portfolio of cancer drugs and will help the company to expand its presence in the oncology market.
What is Driving the Acceleration?
There are a number of “not-so-secret” factors that are helping the acceleration of M&A activity in the biotech sector. One factor is the increasing cost of product development. The average cost of developing a new drug has increased from $1 billion to $2.6 billion in the past decade. This has made it increasingly difficult for small and mid-sized biotech companies to develop viable candidates independent of big-pharma’s help. As a result, small companies are increasingly looking to merge, partner or be acquired by larger companies with deeper pockets.
Another factor driving the acceleration of M&A activity in the biotech sector is the increasing focus on innovation. Large pharmaceutical companies don’t have the talent that exists in the universe of small biotech companies. So they are increasingly looking to acquire companies with innovative technologies. These innovations can help them provide new drugs that can compete with the blockbuster drugs coming off patent in the next few years.
Finally, the acceleration of M&A activity in the biotech sector is also being driven by the increasing consolidation of the industry. In recent years, a number of large pharmaceutical companies have merged with or acquired each other. This has led to a smaller number of bigger companies that are now dominant in the industry. These companies are increasingly looking to acquire smaller companies in order to expand their product portfolios and overall reach.
Take Away
While deals in many industries, both public and private, have decelerated to a crawl, the cash-rich pharmaceutical industry giants are tactically looking to build their portfolios of next-generation treatments. And many biotech companies are in need of a lifeline to get their pipeline products the research dollars they deserve. This dynamic has accelerated public and private deals in the industry in 2023.
The acceleration of M&A activity in the biotech sector is a trend that is not expected to end soon. This is because the factors that are driving deals are likely to remain in place. Investors looking to explore smaller biotech companies may want to keep in mind the nuances of the average company attributes that found deals in the first quarter. Top-tier research on a number of smaller companies, provided by the sectors equity analysts at Noble Capital Markets can be found here. Company information and data on many other biotech and life sciences companies can be discovered by going to this link.
Managing Editor, Channelchek
Sources
file:///C:/Users/prese/Downloads/WilliamBlair-Biopharma-Quarterly-Review-Q1-2023.pdf
https://community.ionanalytics.com/ma-highlights-1q23?account_created=1
https://dkf1ato8y5dsg.cloudfront.net/uploads/79/598/mahighlights1q23-final.pdf