Small Cap Companies Making June 2023 a Whole New Race
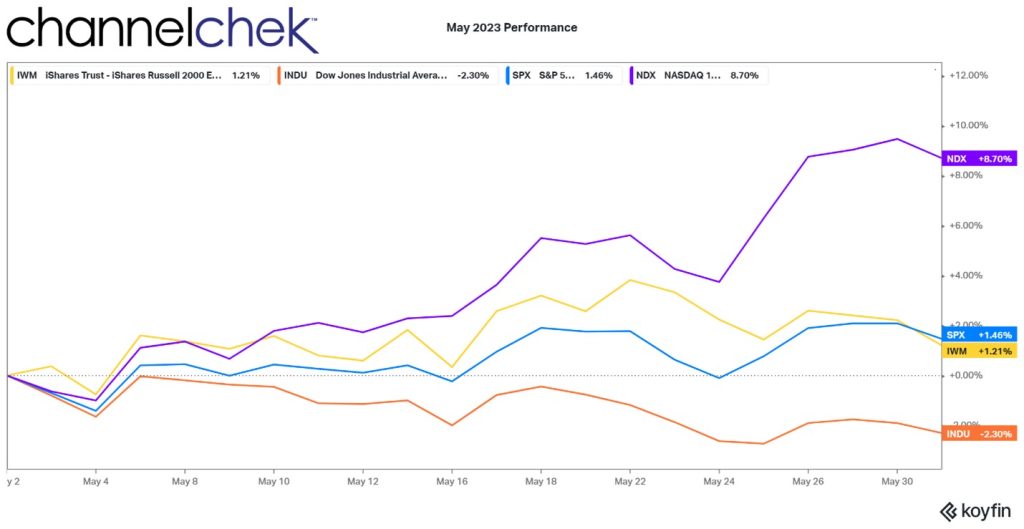
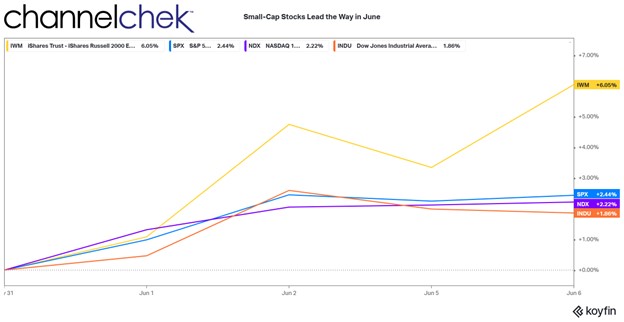
June is shaping up to be the month when small-cap stocks are the stocks to watch. This investment news is based on the huge lead they have taken since the opening bell on Friday June 2nd. The Russell 2000 index tracks U.S. small-cap stocks. While the index is up less than 3% in 2023, and the S&P 500 is up nearly 12%, and Nasdaq is up almost 27%, historically, the average return over time is expected to be greater for small-caps. In order for the averages to come back in line with historical norms, the large-cap stocks either have to begin trending down, the small-caps upward, or maybe a little of both. There is new reason to believe that now is the time that small-caps are finally getting back into the race.
The Russell Small-Cap Index, which is made up of the lowest 2,000 companies in terms of market cap of the broader Russell 3000, was up 3.6% on Friday, June 2nd; it gave up 1.1% on the following Monday, then rallied on Tuesday, June 6th by 2.8%. Meanwhile, the other indexes stalled. Friday’s gains were its largest one-day increase in six months, and Tuesday represents its biggest gain since early March.
Both large-cap indexes attribute their gains to the high-flying mega-cap tech stocks. Much of the non-tech portions of these indexes are not contributing to the year’s great performance. Some analysts are beginning to express concern that Nasdaq valuations are stretched. In contrast, price/earnings ratios on many small-cap stocks are below historical norms.
What’s more, is the earnings per share (EPS) is beginning to be revised upward, “small caps are finally starting to participate in the EPS revisions recovery,” said Lori Calvasina, head of U.S. equity strategy at RBC Capital Markets, in a research note Monday. “The rate of upward EPS estimate revisions has moved up to 50% for the Russell 2000,” she said, adding that more than half the sectors in the index are “now in positive revisions territory for both EPS and revenues.”
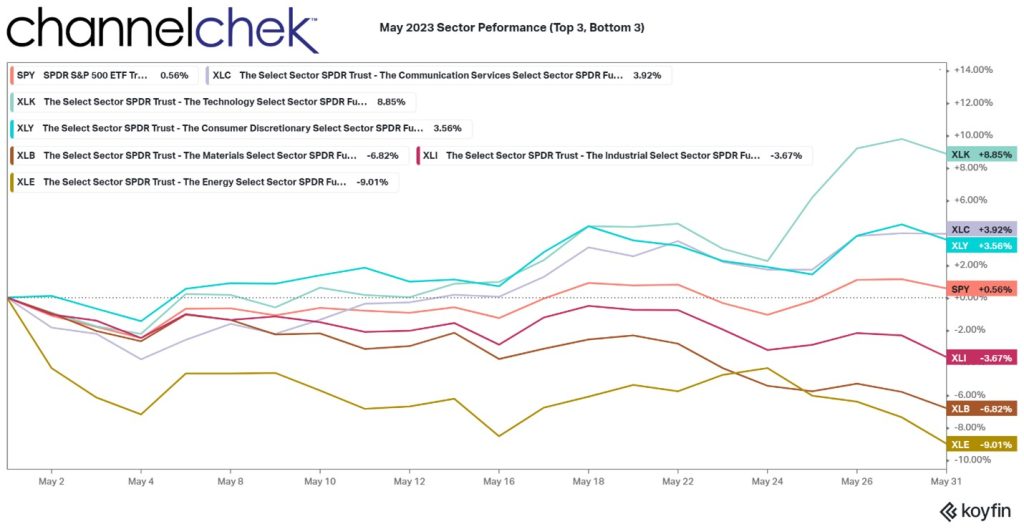
Calvarisa highlighted these sectors: utilities, consumer staples, healthcare, industrials, communications services, information technology, and TIMT (technology, internet, media and telecommunications), saying they have both positive EPS and revenue revisions among the small-caps.
Another interesting reason for the promise of small-caps stealing the show in June, according to the RBC research, small-cap stocks usually bottom three to six months before EPS forecasts start rising again.
The introduction of artificial intelligence (AI), from primarily small market cap companies and how the new technology can help with online research and creative inspiration, has placed investors in megacap stocks like Google and Microsoft on notice. They now know that a younger superior technology may disrupt a large part of these tech giants’ business. Not dissimilar to what they had done as small companies a few decades earlier.
Take Away
June is always an exciting month for companies with small market cap as the Russell 3000 index reconstitution also reshapes the small-cap Russell 2000 during June. Many self-directed investors try to front-run the institutions that are required to own or eliminate stocks from their portfolios. Price movements can be large.
The excitement is being compounded by the fear creeping in among large-cap investors, EPS revisions, and of course the reversion to mean average performance of large-cap stocks, to small-caps.
Managing Editor, Channelchek
Sources