Stocks, Bonds, and Real Estate Markets are All Impacted By U.S. Debt Levels
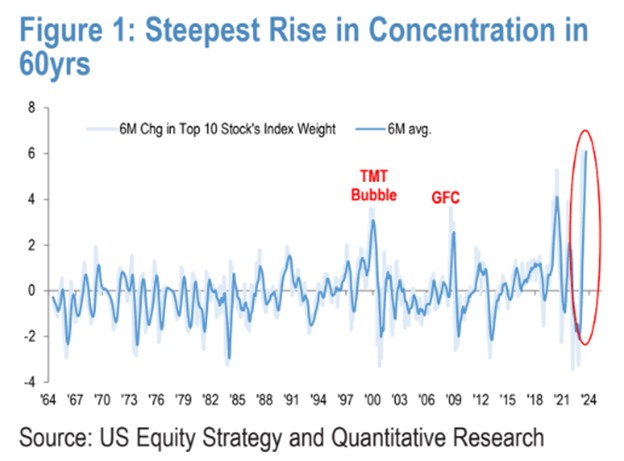
Who will buy all the U.S. Treasury debt issuance? This week the Treasury Department hinted at its borrowing needs estimate for the third quarter. Its estimated need is $1 trillion-plus, the largest third-quarter need ever. At the same time, the Federal Reserve is reducing its holdings of U.S. debt by a cumulative $90 billion each month, and the U.S. dollar is on a weakening trend which reduces demand for dollar-denominated assets. There are now concerns being raised about the extent to which domestic and foreign demand for U.S. debt issuance will be able to grow to match issuance.
More details surrounding the Treasuries financing needs will be released at 8:30 on Wednesday August 2nd. The large estimate already shared in advance, $1.007 trillion, has analysts beginning to conclude that the U.S. could become hampered with a deteriorating fiscal deficit outlook amid continuing pressure to borrow more.
Two months ago, analysts at Fitch Ratings, a bond credit rating company, put the United States on Rating Watch Negative (RWN) citing, among other things, “fiscal and debt trajectories.” The initial ratings watch came at a time when there was uncertainty about whether the U.S. debt ceiling would be raised. It was not only increased, on June 2nd President Biden signed Congresses bill removing any upper limit on debt issuance until January 2025. The increase in debt, reduced number of buyers, lack of fiscal guardrails, and already higher interest rates on rollover debt could have consequences for all markets. Fitch may be prompted to replace the AAA rating on US Treasuries by assigning a lower rating.
At stake for the broader fixed-income market is that most corporate debt issuance is spread to U.S. Treasury rates of similar duration bonds. If large ongoing auctions over the third quarter deplete demand at market levels Treasury yields would have to trade higher, or government debt would face being illiquid or even default.
In the past U.S. Treasury borrowing need has been met by the perceived safety in the country’s ability to prosper and pay its debts, as well as the reliability of the U.S. dollar as a reserve currency. It’s unclear with less stable relations with China (a large holder of U.S. debt) and the BRICS nations plans to create a gold-based fiat currency, if demand will shrink or grow while U.S. debt issuance climbs.
At stake for the broader real estate market, which is heavily leveraged and therefore greatly impacted by interest rate expenses, is for the cost of borrowing to rise should demand for Treasuries not meet new issuance levels. Thirty-year residential loans are spread off ten-year Treasuries. Further increases in mortgage rates would serve to slow down real estate transactions.
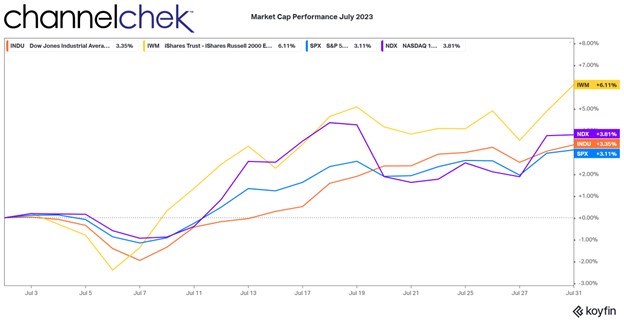
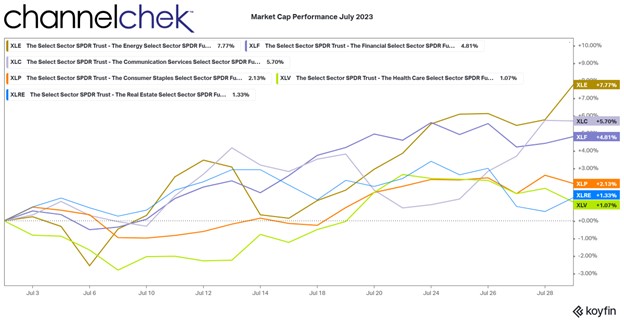
The stock market would likely become bifurcated with stocks tied to big ticket items, typically bought by securing financing, weakening, and stocks that benefit from a strong dollar (higher comparative rates strengthen a native currency) could also do well. These stocks include companies that don’t have a large overseas customer base — if they are net importers, they may benefit even more. Companies that have large borrowing needs, will find their cost of capital has increased as they compete with U.S. Treasury rates. This is why small cap companies, that have very little borrowing needs, tend to perform better than large-cap companies with high debt levels in similar industries.
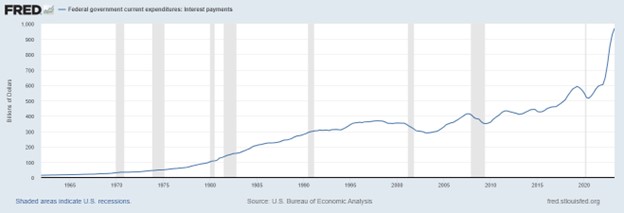
One Federal government expense that it can’t exercise immediate control over is the interest rate expense of its debt. Over $32 trillion in debt, spread out to mature through 30 years, now holds an average rate of near 2.50%. New debt is issued with almost double that interest rate. This is evident in the chart above that shows interest on debt from 2020 until today increased by $400 billion – with no expected change in its growth rate.
In a Tuesday note title “Treasury Tsunami,” rates strategists at Barclays Anshul Pradhan and Andres Mok wrote, the “Treasury’s latest financing estimates point to a worsening fiscal profile” and “the fiscal picture has worsened significantly since last year.” They point to the likelihood of “a sharp increase in the supply of notes and bonds over the coming quarters,” and cautioned investors against expecting “a typical end-of-cycle bond market rally.”
Whether or not the Fed continues to remain hawkish, if this recipe of greater U.S. debt issuance need continues on its trajectory, with fewer buyers, interest rates will rise. For investors with the common 60/40 portfolios, that is to say 40% in bonds, higher rates will mathematically cause prices of their fixed income holdings to decline. They may receive interest payments every six months, but if interest rates keep increasing, what others are willing to pay for that payment stream declines. In this way, bonds and other fixed income is only the place to hide if you want to be certain of declining values of your holdings.
Take Away
The Fed could stop tightening, and still there would be upward pressure on Treasury rates because of increased supply. Interestingly, this would serve to create a normally sloped yield curve (not inverted) which, according to many that were saying this year’s inverted yield curve is an unmistakable sign of impending recession, they would have another chance at being wrong again by saying an upwardly sloping yield curve is signs the market expects robust growth. Taken in the context of all of 2023s market dynamics and manipulations, neither textbook simplification fits.
If the scenario of higher rates out on the curve unfolds, a higher cost of capital will impact some industries more than others, and international companies differently than pure domestic operations. Consider this as you make your own interest rate and economic projections and adjust your holdings accordingly.
Managing Editor, Channelchek
Sources