The Federal Open Market Committee convenes Tuesday and Wednesday for what is shaping up to be one of the most closely watched meetings in recent memory — not because of what the Fed is expected to do, but because of what it is expected to signal. The committee will almost certainly leave the federal funds rate unchanged at its current range of 3.50% to 3.75%, with futures markets pricing in a 99.6% probability of no change. The rate decision is effectively a foregone conclusion. Everything else about this meeting is not.
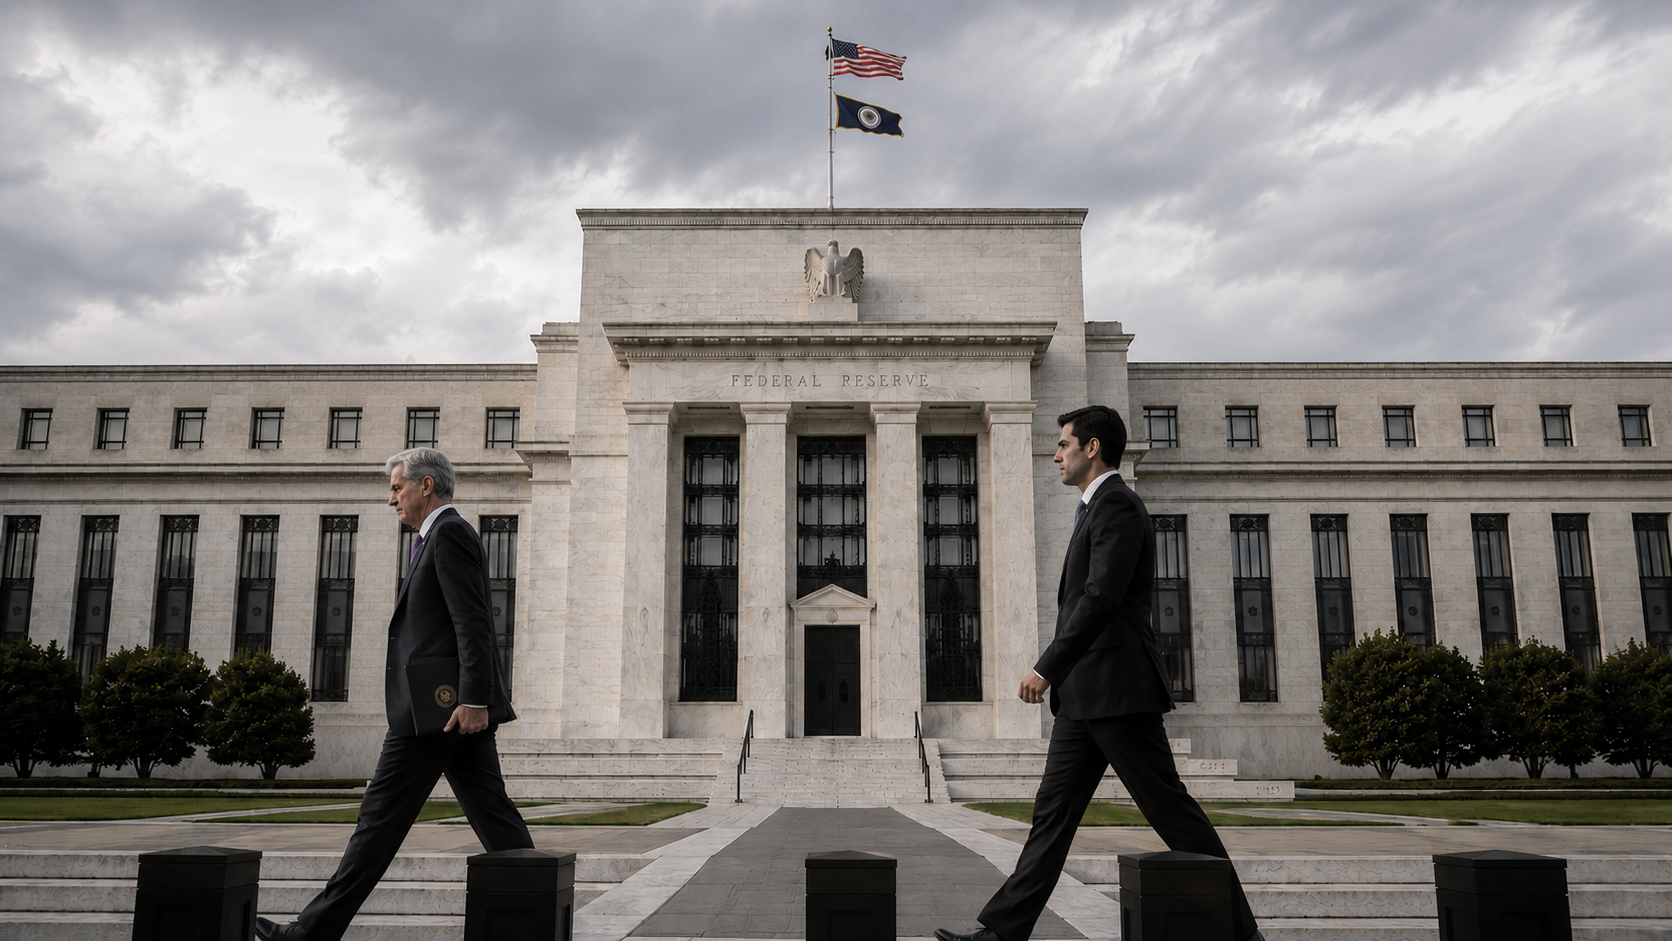
This is Kevin Warsh’s first FOMC meeting as Federal Reserve Chair, following Jerome Powell’s departure in May. It arrives at a moment of genuine tension within the committee and a macroeconomic backdrop that has scrambled the Fed’s traditional playbook. For investors in the small and microcap space, where borrowing costs and rate expectations weigh more heavily than almost any other variable, the signals coming out of Wednesday’s meeting matter enormously.
The Bias Shift to Watch
The single most important element of this meeting is language, not numbers. For the past three consecutive meetings, the FOMC has included an identical sentence in its post-meeting statement reflecting an inclination toward easing rates in the months ahead. The question now is whether the committee removes or revises that language — shifting its bias from easing toward neutral, or potentially even toward tightening.
That shift would be significant. Under the Fed’s traditional framework, rate cuts are appropriate when inflation is tame and the labor market is struggling. The current environment is the inverse: inflation is running at 4.2% year over year, the highest in three years, while the May jobs report showed the economy adding 172,000 positions, nearly double expectations. Under a strict reading of the dual mandate, those conditions argue for tighter policy, not looser. The market is watching to see whether Warsh’s committee acknowledges that reality in its statement language.
A Committee Already Divided
Warsh inherits a committee that is showing unusual signs of internal disagreement. The May meeting produced four dissents — the most since late 1992. One policymaker favored cutting rates outright, while three others objected to the easing bias in the statement, signaling they believed the Fed’s tone was too dovish given the inflation backdrop. That depth of division is rare and it complicates Warsh’s task in his first meeting. Building consensus around a unified message will be one of the early tests of his chairmanship.
Why the Dot Plot Is the Real Event
Alongside the rate decision, the Fed will release its updated Summary of Economic Projections — the so-called dot plot — which maps where each committee member expects rates to head over the coming years. Heading into this meeting, traders see close to a 50% probability of at least one rate hike before year-end, a dramatic reversal from the two cuts that consensus expected as recently as March. If the dot plot reflects a committee leaning toward hikes, Treasury yields will likely move higher and the entire rate-sensitive corner of the market will reprice accordingly.
Warsh’s post-decision press conference is the other key moment. Markets are still calibrating his reputation as a policy hawk, and his tone on the path forward — whether he leaves the door open to hikes or pushes back on that speculation — will set the direction for rate expectations through the summer.
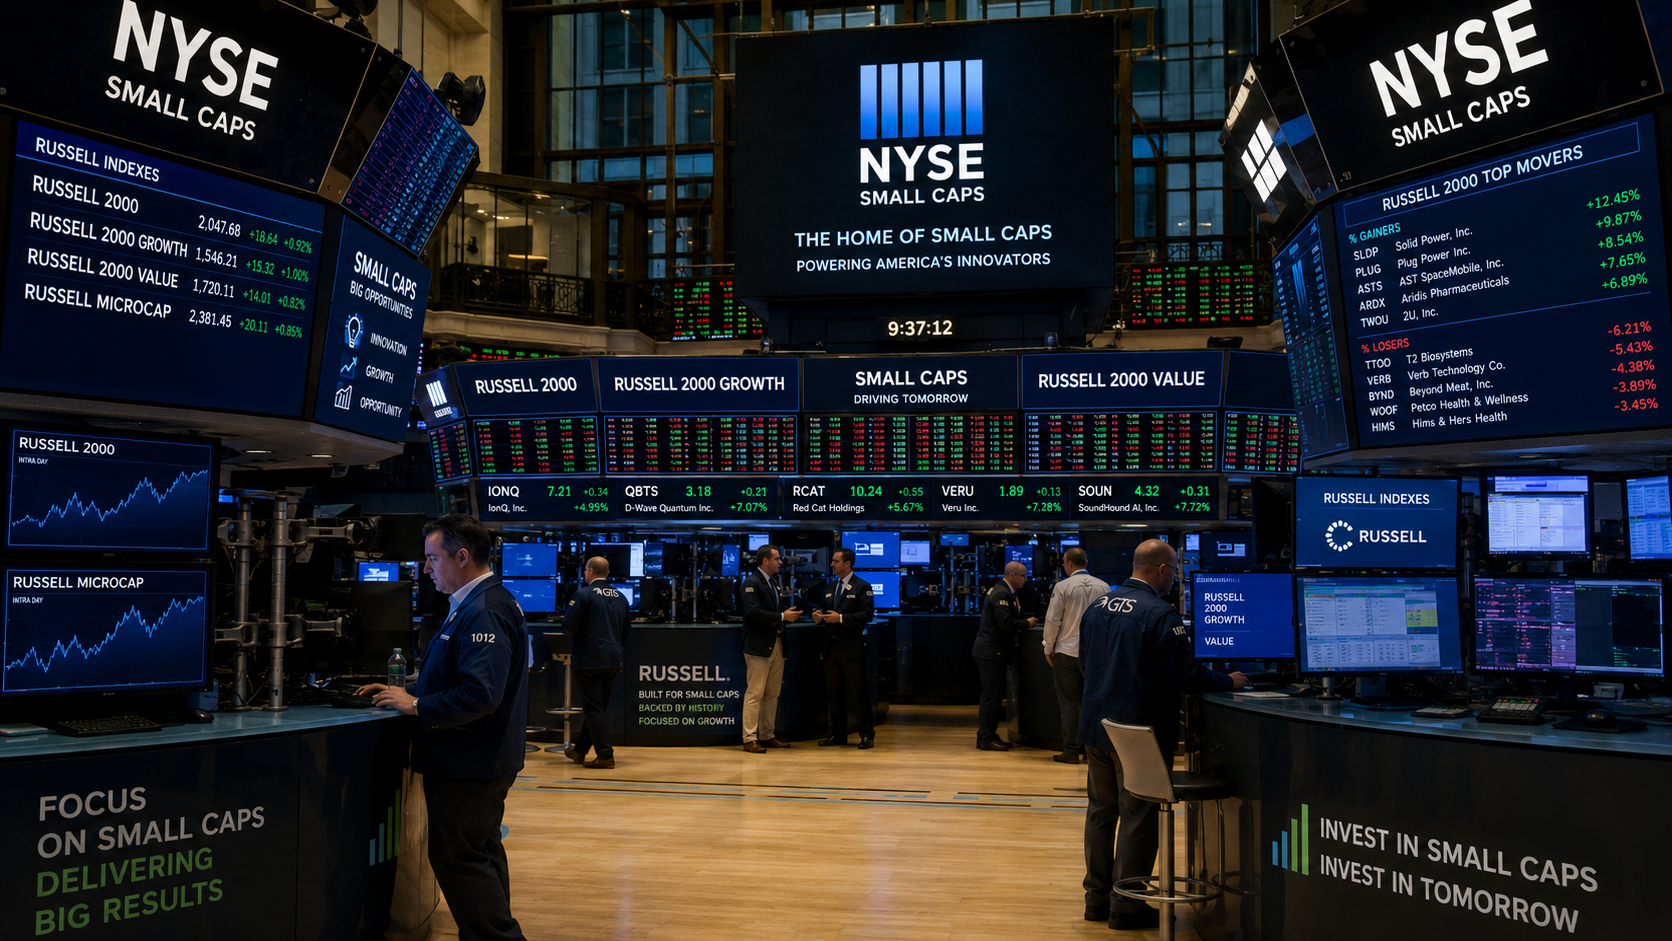
The Small Cap Stakes
For companies in the sub-$2 billion market cap range, this meeting carries direct consequences. Small and microcap companies carry disproportionately more variable-rate debt than their large cap counterparts, which means their interest expense moves in near real time with rate expectations. A committee that signals higher-for-longer, or hints at hikes, extends the timeline for the rate relief that smaller, more leveraged companies have been counting on to refinance debt and expand margins.
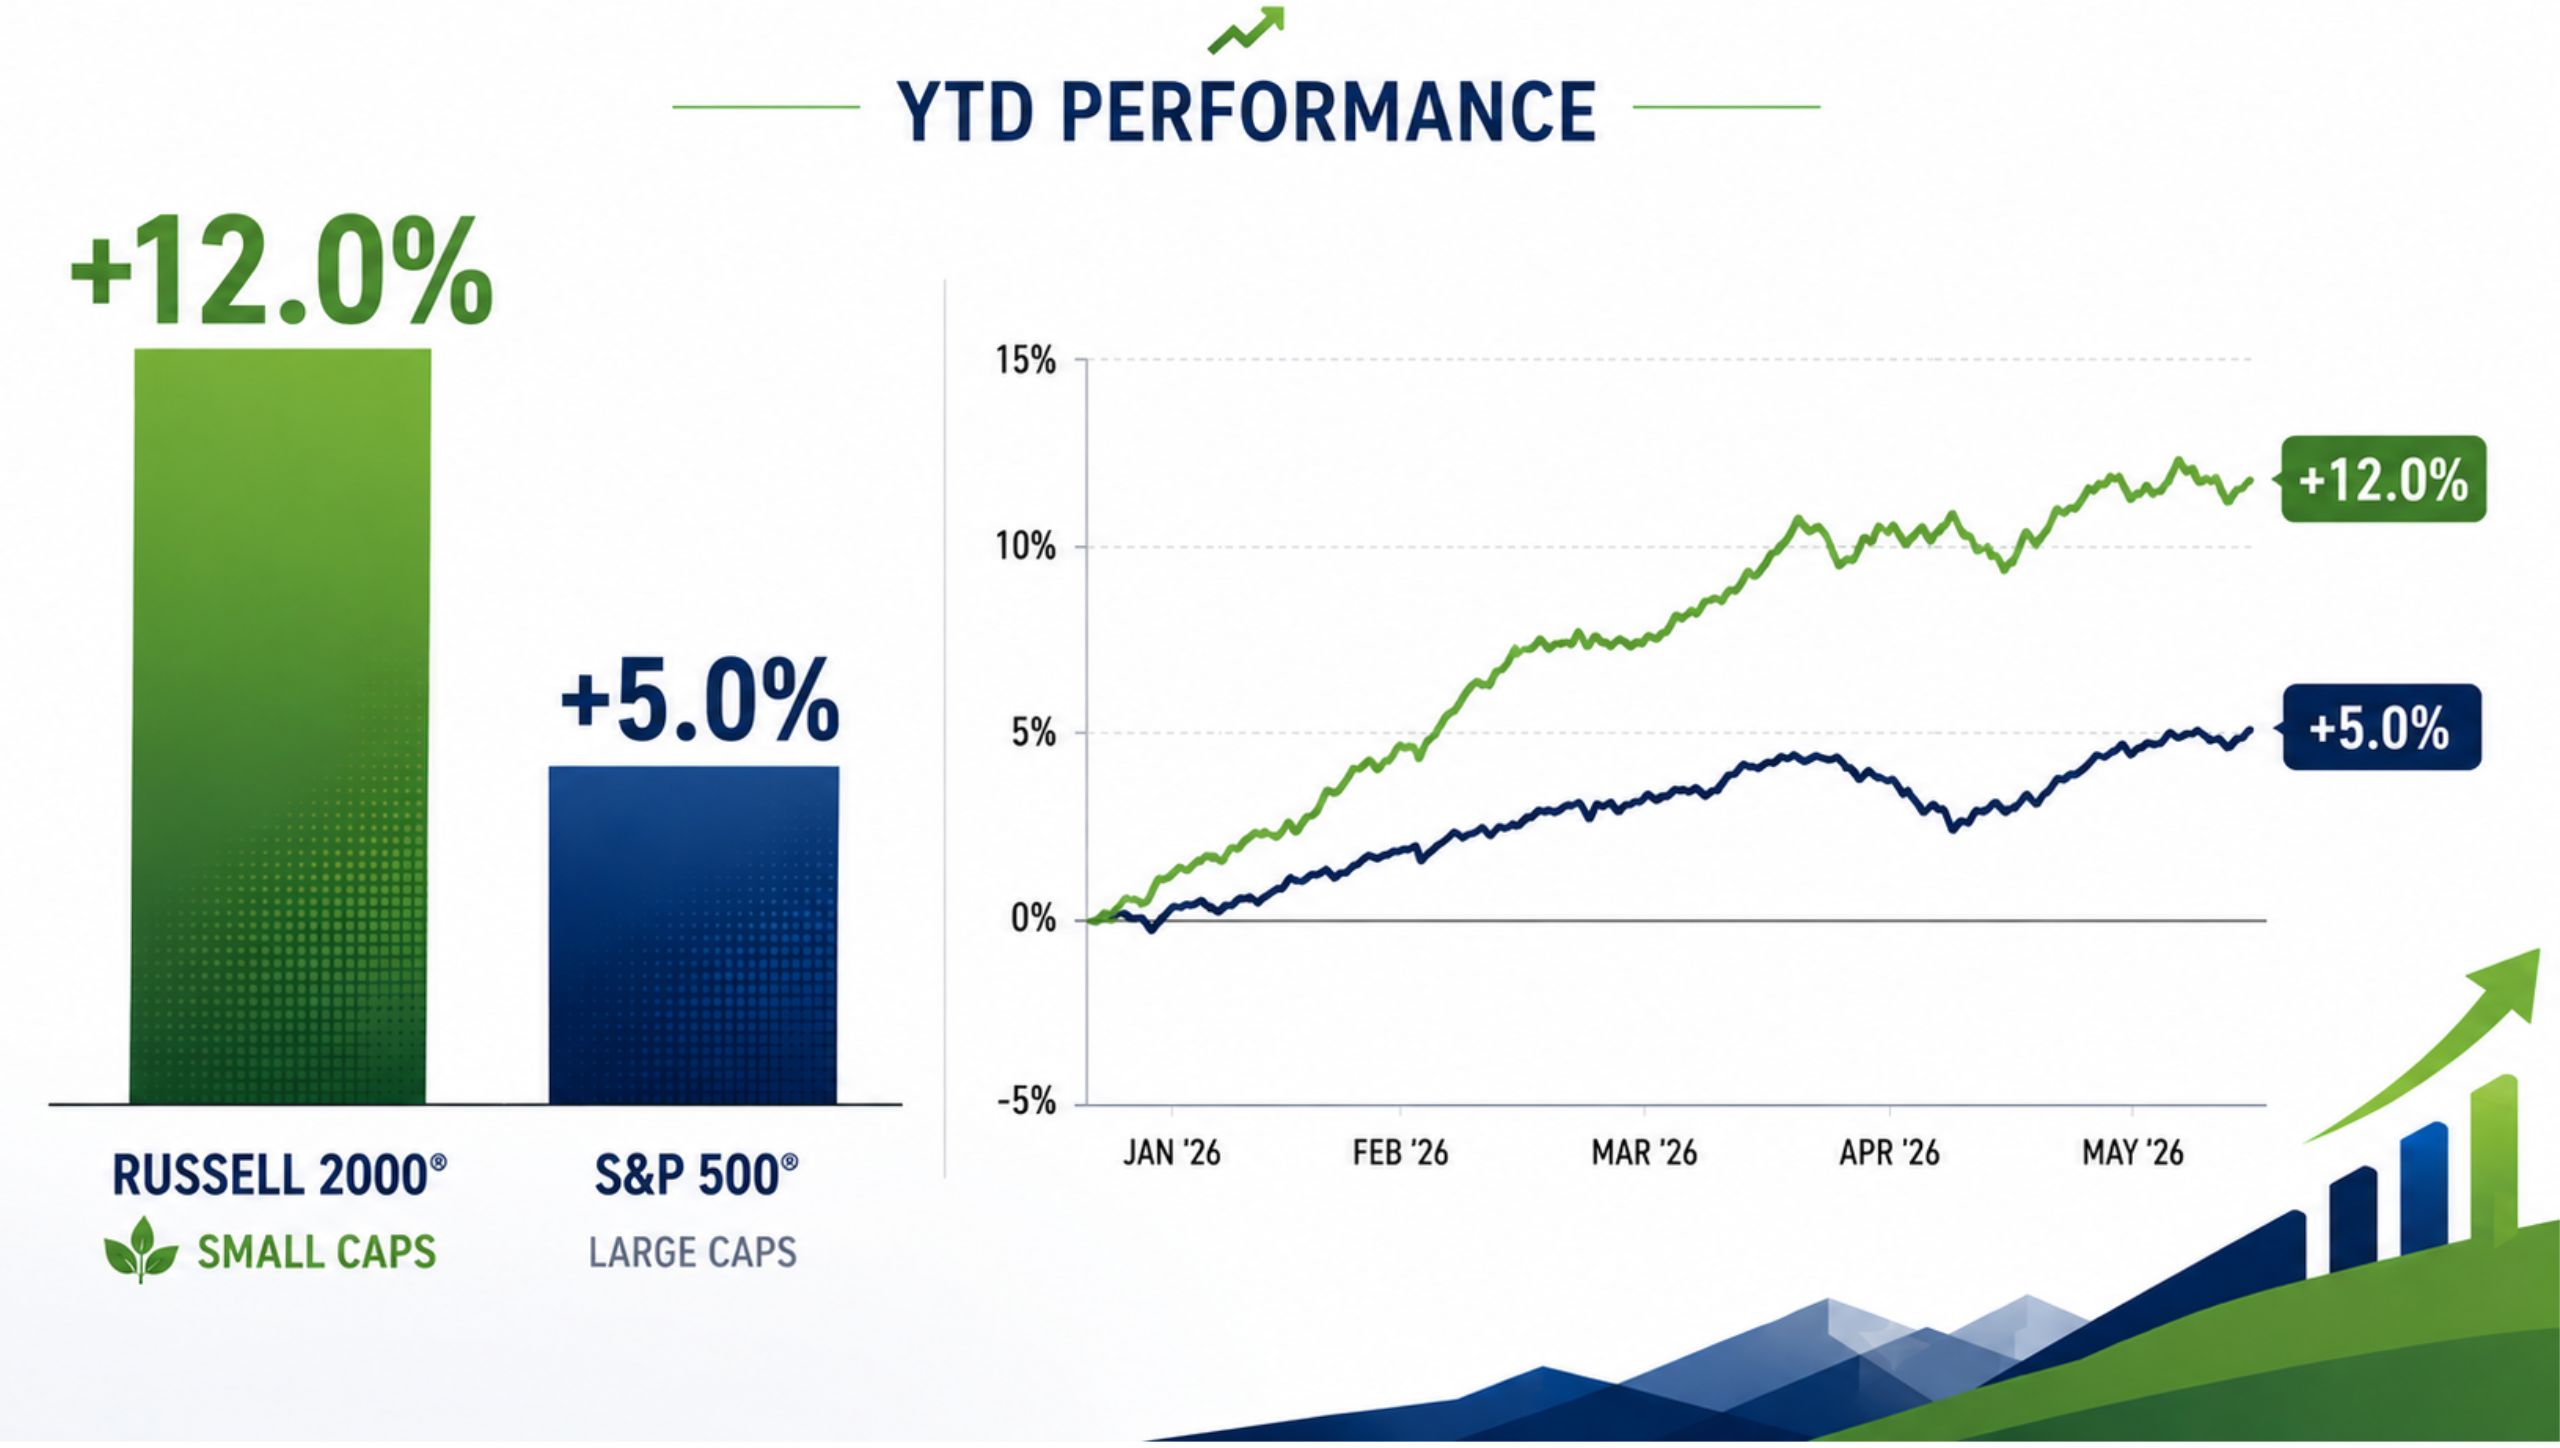
The Russell 2000 has spent much of 2026 caught between strong underlying fundamentals and a punishing rate environment. Wednesday afternoon will go a long way toward determining which of those forces dominates heading into the second half of the year. The Fed may not move a single basis point this week. It can still move the market.