CoreCivic is a diversified, government-solutions company with the scale and experience needed to solve tough government challenges in flexible, cost-effective ways. We provide a broad range of solutions to government partners that serve the public good through high-quality corrections and detention management, a network of residential and non-residential alternatives to incarceration to help address America’s recidivism crisis, and government real estate solutions. We are the nation’s largest owner of partnership correctional, detention and residential reentry facilities, and believe we are the largest private owner of real estate used by government agencies in the United States. We have been a flexible and dependable partner for government for nearly 40 years. Our employees are driven by a deep sense of service, high standards of professionalism and a responsibility to help government better the public good. Learn more at www.corecivic.com.
Joe Gomes, CFA, Managing Director, Equity Research Analyst, Generalist , Noble Capital Markets, Inc.
Joshua Zoepfel, Research Associate, Noble Capital Markets, Inc.
Refer to the full report for the price target, fundamental analysis, and rating.
South Texas to Resume. Yesterday, CoreCivic announced a new intergovernmental agreement to resume operations at the 2,400-bed South Texas Family Residential Center in Dilley, Texas, for ICE. CoreCivic has entered into a new lease agreement with Target Hospitality, the owner of the facility, over period concurrent with the ICE agreement. We view this a further confirmation of the Federal government’s need for additional bed capacity in the drive to deport undocumented migrants.
Details. The amended IGSA expires in March 2030 and may be further extended through bilateral modification. The agreement provides for a fixed monthly payment in accordance with a graduated schedule to correlate with the activation of each neighborhood within the facility. Once fully activated, total annual revenue is expected to be approximately $180 million, including medical services. With the Company having already started pre-activation activities earlier this year, we expect this award to be accretive to earnings beginning in the second quarter of 2025.
Equity Research is available at no cost to Registered users of Channelchek. Not a Member? Click ‘Join’ to join the Channelchek Community. There is no cost to register, and we never collect credit card information.
This Company Sponsored Research is provided by Noble Capital Markets, Inc., a FINRA and S.E.C. registered broker-dealer (B/D).
*Analyst certification and important disclosures included in the full report. NOTE: investment decisions should not be based upon the content of this research summary. Proper due diligence is required before making any investment decision.
Mark Reichman, Managing Director, Equity Research Analyst, Natural Resources, Noble Capital Markets, Inc.
Refer to the full report for the price target, fundamental analysis, and rating.
A market leader with a strong growth profile. AZZ is the leading independent provider of hot dip galvanizing and coil coating solutions to a broad range of end markets. We expect AZZ Precoat Metals’ new manufacturing facility in Washington, Missouri to contribute to top-line growth in fiscal year 2026 while capital expenditures decline. Approximately 75% of the facility’s production is already committed and could generate $50 million to $60 million in revenue on an annualized basis once production is fully ramped.
Fiscal 2026 corporate guidance. In early February, AZZ Inc. released financial guidance for fiscal year 2026 and expects sales in the range of $1.625 billion to $1.725 billion, adjusted EBITDA in the range of $360 million to $400 million, and adjusted diluted EPS of $5.50 to $6.10. Fiscal year 2026 guidance included an increase in the Metal Coatings EBITDA margin expectations to a range of 27% to 32% from 25% to 30%, while Precoat Metals EBITDA margin expectations are unchanged at 17% to 22%.
Equity Research is available at no cost to Registered users of Channelchek. Not a Member? Click ‘Join’ to join the Channelchek Community. There is no cost to register, and we never collect credit card information.
This Company Sponsored Research is provided by Noble Capital Markets, Inc., a FINRA and S.E.C. registered broker-dealer (B/D).
*Analyst certification and important disclosures included in the full report. NOTE: investment decisions should not be based upon the content of this research summary. Proper due diligence is required before making any investment decision.
NN delivers performance as expected in first full year of transformation
NN is accelerating and further refining transformation plans in 2025
CHARLOTTE, N.C., March 05, 2025 (GLOBE NEWSWIRE) — NN, Inc. (NASDAQ: NNBR) (“NN” or the “Company”), a global diversified industrial company that engineers and manufactures high-precision components and assemblies, today reported its financial results for the fourth quarter and full-year ended December 31, 2024. Key results for the quarter and full-year ended 2024 include (compared with the fourth quarter and full-year of 2023):
Net sales of $106.5 million and $464.3 million, decreased by 5.3% and 5.1%, respectively.
Pro forma net sales, adjusted for sale of Lubbock, rationalized business, and other pro forma adjustments, increased by 2.0% and declined by 0.2%, respectively.
GAAP earnings per share of $(0.51) and $(1.11), respectively.
Adjusted earnings per share of $(0.02) and $(0.17), respectively.
Adjusted EBITDA of $12.1 million and $48.3 million, an increase of $2.1 million and $5.2 million, respectively.
NN’s first full year of transformation plan was a success – upgraded its leadership team, rationalized money-losing legacy business, secured new program awards to offset rationalized business and create a path to year-over-year growth, increased gross profit margins, decreased borrowing rates, and decreased leverage.
$73 million of new business wins in 2024, topping the previous record of $63 million in 2023.
NN is tracking on pace with its 5-year sales growth and diversification goals and has delivered a 2-year new business wins total of $136 million. The Company has won $13 million in new wins in 2025 YTD and remains on pace with its business development efforts.
The Company is on pace to achieve its organic growth goal of reaching $600 million in sales.
New wins have begun launching and ramping into the Company’s sales run-rates with over 70 programs scheduled for start-of-production during 2025; approximately $21 million of new business is being launched in Q1 2025 across multiple plants and countries.
NN’s China operations sales growth continues at a measured pace, up by 15.6% and 20.6%, versus the prior year fourth quarter and full-year, respectively. NN’s China operations continue to fund their own growth through local cash flow generation.
NN’s Term Loan refinancing process continues, and the transaction will enable the Company to continue its 5-year transformation plans.
“We are pleased overall with the results of our first full year of our transformation plan, during which we made immediate and significant progress.” said Harold Bevis, President and Chief Executive Officer of NN, Inc. “We also gained the confidence to accelerate our pace. A few highlights are as follows:
Upgraded a significant number of leadership positions, including upgrades across our C-suite, and among our operational leaders, commercial leaders, and finance team. NN is adding to and creating the most competitive engineering and business development team in the history of the Company, adding to our Stamped Products, Electrical, and Medical teams.
In 2025, we are launching the highest number of new products in recent history. By being careful and selective, we have been able to keep our cash capex spending to normal levels by leveraging our $340 million installed base of machinery and equipment and $56 million of land and buildings.
We have significantly improved the underperforming performance at the ‘Group of 7’ plants that had previously generated $112.6 million of net sales and negative $11.5 million of adjusted EBITDA in 2023; we have fixed four plants and we are closing three. In 2025, we expect this same set of plants to generate $5 million of adjusted EBITDA.
Growth of the US electrical grid power business is expected to continue in 2025 as electrical demand increases due to data centers, electric, and hybrid vehicles.”
Mr. Bevis concluded, “Looking ahead to 2025, as we continue along our transformation path, we are focused on creating a refreshed and extended balance sheet, stronger free cash flow, a powerful new business acquisition program, and a further strengthening of our management team. I would like to thank the NN team and our partners who are working together to create sustainable value.”
Fourth Quarter Results
Net sales were $106.5 million, a decrease of 5.3% compared to the fourth quarter of 2023 net sales of $112.5 million, which was primarily due to the sale of our Lubbock operations, lower volumes, and unfavorable foreign exchange effects of $1.6 million. As a result, on a pro forma basis, sales increased 2% over the same period of prior year.
Loss from operations was $16.9 million compared to a loss from operations of $7.9 million in the fourth quarter of 2023. The increased loss from operations was primarily due to lower sales volume.
Income from operations for Power Solutions was $1.3 million compared to income from operations of $2.8 million for the same period in 2023. Loss from operations for Mobile Solutions was $12.9 million compared to loss from operations of $5.7 million for the same period in 2023.
Net loss was $21.0 million compared to net loss of $20.5 million for the same period in 2023.
Full-Year Results
Net sales decreased by $25.0 million, or 5.1%, during the year ended December 31, 2024, compared to the year ended December 31, 2023, primarily due to the sale of our Lubbock operations, customer settlements received in 2023, rationalized volume at plants undergoing turnarounds and unfavorable foreign exchange effects of $3.5 million. These decreases were partially offset by the net impact of contractual pass-through material pricing provisions. As a result, on a pro forma basis, sales decreased 0.2%.
Loss from operations was $27.5 million in the year ended December 31, 2024 compared to a loss from operations of $21.8 million in the year ended December 31, 2023, primarily due to lower revenue, the impairment of machinery and equipment at a plant that will close in 2025, higher travel, stock compensation and severance expense, partially offset by lower salaries due to a reduction in headcount.
Net loss was $38.3 million compared to net loss of $50.2 million for the same period in 2023. The improvement is primarily due to the $7.2 million gain on sale of the Lubbock operations and a decrease in noncash derivative mark-to-market losses, as well as increased share of net income from joint venture.
Fourth Quarter Adjusted Results
Adjusted income from operations for the fourth quarter of 2024 was $2.4 million compared to adjusted loss from operations of $1.4 million for the same period in 2023. Adjusted EBITDA was $12.1 million, or 11.3% of sales, compared to $10.0 million, or 8.9% of sales, for the same period in 2023.
Adjusted net loss was $0.9 million, or $0.02 per diluted share, compared to adjusted net loss of $4.9 million, or $0.10 per diluted share, for the same period in 2023. Free cash flow was a generation of cash of $3.8 million compared to a generation of cash of $1.3 million for the same period in 2023.
Power Solutions Net sales for the fourth quarter of 2024 were $39.2 million compared to $43.3 million in the same period in 2023. The decrease is primarily due to lower volumes, including from the sale of the Lubbock operations, offset partially by pricing.
Net sales decreased by $5.4 million, or 2.9%, during the year ended December 31, 2024, compared to the year ended December 31, 2023, primarily due to the sale of our Lubbock operations, premium pricing received on a certain customer project during the first quarter of 2023, and unfavorable foreign exchange effects of $0.2 million. These decreases were partially offset by higher precious metals pass-through pricing.
Adjusted income from operations was $4.6 million compared to adjusted income from operations of $5.8 million in the fourth quarter of 2023. The decrease in adjusted income from operations was primarily due to the lower revenue, including from the sale of the Lubbock operations, partially offset by cost reduction initiatives.
Income from operations increased by $2.0 million during the year ended December 31, 2024 compared to the same period in the prior year, primarily due to an increase in sublease income earned on closed facilities and lower depreciation and amortization expense due to sold or fully utilized assets.
Mobile Solutions
Net sales for the fourth quarter of 2024 were $67.4 million compared to $69.2 million in the fourth quarter of 2023, a decrease of 2.7%. The decrease in sales was primarily due to rationalized volume at plants undergoing turnarounds, contractual reduction in customer pass-through material pricing, and unfavorable foreign exchange effects of $1.6 million.
Net sales decreased by $19.4 million, or 6.4%, during the year ended December 31, 2024, compared to the year ended December 31, 2023, primarily due rationalized volume at plants undergoing turnarounds, contractual reduction in customer pass-through material pricing, a customer settlement received in 2023 and unfavorable foreign exchange effects of $3.3 million.
Adjusted income from operations was $2.5 million compared to adjusted loss from operations of $2.3 million in the fourth quarter of 2023. The increase in adjustment income from operations was primarily due to the rationalization of underperforming business.
Loss from operations changed unfavorably by $6.3 million during the year ended December 31, 2024, compared to the prior year, primarily due to the impairment of machinery and equipment at a plant that will close in 2025. The change was also impacted by higher depreciation expense and selling, general and administrative costs.
2025 Outlook
Guidance assumes a similar FX, trade policy, and metal industry environment as in 2024.
Revenues should be between $450 to $480 million, depending on FX and tariff impacts
At midpoint, slight growth over 2024 on a proforma basis
Core performance metrics normalized for sale of Lubbock and rationalized business during 2024
Adjusted EBITDA should be between $53 and $63 million, depending on FX and tariff impacts
At midpoint, up ~15% over 2024 on a proforma basis
Core performance metrics normalized for sale of Lubbock and rationalized business during 2024
New business wins between $60 to $70 million
Targeting larger amounts from stamped products, electrical products and medical products
China will fund its own new wins program
Continue to leverage $340 million of machinery and equipment to minimize cash capex spend
Chris Bohnert, Senior Vice President and Chief Financial Officer, commented, “The key end markets NN serves remain solid on balance, subject to potential impacts of foreign exchange rate fluctuations, volume uncertainty and tariff impacts. These uncertainties are initially moving us to the low half of the Revenue and adjusted EBITDA ranges for the full-year. We expect our profitability results to be supported by stronger margins as a result of cost-out actions and operational efficiencies, as well as the launching of new business wins. Our adjusted EBITDA forecast calls for solid year-over-year improvement driven by a combination of a stronger gross margin profile, and the benefit of our consistent actions to improve our fixed and variable cost structure.”
Mr. Bohnert concluded, “The refinancing of our Term Loan is in process and our focus remains on improving our financial flexibility and supporting our profitable growth strategy. While this process is influenced by NN’s positively evolving growth capital and capacity expansion needs, as well as the Company’s changing cost structure, we expect this process to conclude in the first half of the year, which will provide us the runway needed to continue our multi-year transformation.”
Conference Call
NN will discuss its results during its quarterly investor conference call on March 6, 2024, at 9 a.m. ET. The call and supplemental presentation may be accessed via NN’s website, www.nninc.com. The conference call can also be accessed by dialing 1-877-255-4315 or 1-412-317-6579. For those who are unavailable to listen to the live broadcast, a replay will be available shortly after the call until March 6, 2026.
NN discloses in this press release the non-GAAP financial measures of adjusted income (loss) from operations, adjusted EBITDA, adjusted net income (loss), adjusted net income (loss) per diluted common share, and free cash flow. Each of these non-GAAP financial measures provides supplementary information about the impacts of restructuring and integration expense, acquisition and transition expenses, foreign exchange impacts on inter-company loans, amortization of intangibles and deferred financing costs, and other non-operating impacts on our business.
The financial tables found later in this press release include a reconciliation of adjusted income (loss) from operations, adjusted operating margin, adjusted EBITDA, adjusted EBITDA margin, adjusted net income (loss), adjusted net income (loss) per diluted share, free cash flow to the U.S. GAAP financial measures of income (loss) from operations, net income (loss), net income (loss) per diluted common share, and cash provided (used) by operating activities.
About NN, Inc.
NN, Inc., a global diversified industrial company, combines advanced engineering and production capabilities with in-depth materials science expertise to design and manufacture high-precision components and assemblies for a variety of markets on a global basis. Headquartered in Charlotte, North Carolina, NN has facilities in North America, Europe, South America, and Asia. For more information about the company and its products, please visit www.nninc.com.
Except for specific historical information, many of the matters discussed in this press release may express or imply projections of revenues or expenditures, statements of plans and objectives or future operations or statements of future economic performance. These statements may discuss goals, intentions and expectations as to future trends, plans, events, results of operations or financial condition, or state other information relating to NN, Inc. (the “Company”) based on current beliefs of management as well as assumptions made by, and information currently available to, management. Forward-looking statements generally will be accompanied by words such as “anticipate,” “believe,” “could,” “estimate,” “expect,” “forecast,” “guidance,” “intend,” “may,” “possible,” “potential,” “predict,” “project”, “achieve”, “growth”, “enable”, “improve”, or other similar words, phrases or expressions. Forward-looking statements involve a number of risks and uncertainties that are outside of management’s control and that may cause actual results to be materially different from such forward-looking statements. Such factors include, among others, general economic conditions and economic conditions in the industrial sector; the impacts of pandemics, epidemics, disease outbreaks and other public health crises on our financial condition, business operations and liquidity; competitive influences; risks that current customers will commence or increase captive production; risks of capacity underutilization; quality issues; material changes in the costs and availability of raw materials; economic, social, political and geopolitical instability, military conflict, currency fluctuation, and other risks of doing business outside of the United States; inflationary pressures and changes in the cost or availability of materials, supply chain shortages and disruptions, the availability of labor and labor disruptions along the supply chain; our dependence on certain major customers, some of whom are not parties to long-term agreements (and/or are terminable on short notice); the impact of acquisitions and divestitures, as well as expansion of end markets and product offerings; our ability to hire or retain key personnel; the level of our indebtedness; the restrictions contained in our debt agreements; our ability to obtain financing at favorable rates, if at all, and to refinance existing debt as it matures; our ability to secure, maintain or enforce patents or other appropriate protections for our intellectual property; new laws and governmental regulations; the impact of climate change on our operations; uncertainty of government policies and actions after recent U.S. elections in respect to global trade, tariffs and international trade agreements; and cyber liability or potential liability for breaches of our or our service providers’ information technology systems or business operations disruptions. The foregoing factors should not be construed as exhaustive and should be read in conjunction with the sections entitled “Risk Factors” and “Management’s Discussion and Analysis of Financial Condition and Results of Operations” included in the Company’s filings made with the Securities and Exchange Commission. Any forward-looking statement speaks only as of the date of this press release, and the Company undertakes no obligation to publicly update or review any forward-looking statement, whether as a result of new information, future developments or otherwise, except as required by law. New risks and uncertainties may emerge from time to time, and it is not possible for the Company to predict their occurrence or how they will affect the Company. The Company qualifies all forward-looking statements by these cautionary statements.
With respect to any non-GAAP financial measures included in the following document, the accompanying information required by SEC Regulation G can be found in the back of this document or in the “Investors” section of the Company’s web site, www.nninc.com, under the heading “News & Events” and subheading “Presentations.”
Investor & Media Contacts: Joe Caminiti or Stephen Poe NNBR@alpha-ir.com 312-445-2870
BRENTWOOD, Tenn., March 05, 2025 (GLOBE NEWSWIRE) — CoreCivic, Inc. (NYSE: CXW) (“CoreCivic”) announced today that it has agreed under an amended intergovernmental services agreement (IGSA) between the City of Dilley, Texas, and U.S. Immigration and Customs Enforcement (ICE) to resume operations and care for up to 2,400 individuals at the South Texas Family Residential Center in Dilley, Texas (the Dilley Facility). Simultaneously, CoreCivic has entered into a new lease agreement with Target Hospitality Corporation (Target), the owner of the facility, over a period co-terminus with the ICE agreement.
The Dilley Facility was purpose-built for ICE in 2014 to provide an appropriate setting for a family population. CoreCivic managed the Dilley Facility from its construction in 2014 through August 2024, when funding for the contract with ICE was terminated and the facility was idled. CoreCivic will again be responsible for providing residential services in an open and safe environment that offers residents indoor and outdoor recreational activities, life skills, counseling, group interaction, and access to religious and legal services. In addition, CoreCivic will assume the additional responsibility of onsite medical care. Food services will be provided by Target.
The amended IGSA expires in March 2030 and may be further extended through bilateral modification. The agreement provides for a fixed monthly payment in accordance with a graduated schedule to correlate with the activation of each neighborhood within the facility. Total annual revenue once fully activated is expected to be approximately $180 million, inclusive of medical services. We began pre-activation activities earlier this year and expect this award to be accretive to earnings beginning in the second quarter of 2025.
Damon T. Hininger, CoreCivic’s Chief Executive Officer, commented, “With this award and the additional capacity provided to ICE through four contract modifications we announced last week, we are grateful for the trust our government partner has placed in us. We have an extensive supply of available beds, either owned directly or provided by third parties like Target, that provides our government partners the flexibility to satisfy their immediate and long-term needs in a cost-effective manner. We are entering a period when our government partners — particularly our federal government partners — are expected to have increased demand. We anticipate continued robust contracting activity throughout 2025 that will help meet their growing needs.”
Patrick Swindle, CoreCivic’s President and Chief Operating Officer stated, “We are offering our staff the opportunity to transfer to the Dilley Facility and expect many who accept transfer opportunities will be professionals who previously provided services at the facility prior to its closure last year, expediting the activation process. We are also pleased to again work with Target, which has been a fantastic partner since our relationship began in 2014.”
About CoreCivic
CoreCivic is a diversified, government-solutions company with the scale and experience needed to solve tough government challenges in flexible, cost-effective ways. We provide a broad range of solutions to government partners that serve the public good through high-quality corrections and detention management, a network of residential and non-residential alternatives to incarceration to help address America’s recidivism crisis, and government real estate solutions. We are the nation’s largest owner of partnership correctional, detention and residential reentry facilities, and believe we are the largest private owner of real estate used by government agencies in the United States. We have been a flexible and dependable partner for government for more than 40 years. Our employees are driven by a deep sense of service, high standards of professionalism and a responsibility to help government better the public good. Learn more at www.corecivic.com.
This press release includes statements as to our beliefs and expectations of the outcome of future events that are forward-looking statements within the meaning of Section 21E of the Securities Exchange Act of 1934, as amended, and the Private Securities Litigation Reform Act of 1995, as amended. These forward-looking statements may include such words as “anticipate,” “estimate,” “expect,” “project,” “plan,” “intend,” “believe,” “may,” “will,” “should,” “can have,” “likely,” and other words and terms of similar meaning in connection with any discussion of the timing or nature of future operating or financial performance or other events. Such forward-looking statements may be affected by risks and uncertainties in CoreCivic’s business and market conditions. These forward-looking statements are subject to risks and uncertainties that could cause actual results to differ materially from the statements made. Important factors that could cause actual results to differ are described in the filings made from time to time by CoreCivic with the Securities and Exchange Commission (“SEC”) and include the risk factors described in CoreCivic’s Annual Report on Form 10-K for the fiscal year ended December 31, 2024, filed with the SEC on February 21, 2025. Except as required by applicable law, CoreCivic undertakes no obligation to update forward-looking statements made by it to reflect events or circumstances occurring after the date hereof or the occurrence of unanticipated events.
Contact:
Investors: Michael Grant – Managing Director, Investor Relations – (615) 263-6957 Media: Steve Owen – Vice President, Communications – (615) 263-3107
The GEO Group, Inc. (NYSE: GEO) is a leading diversified government service provider, specializing in design, financing, development, and support services for secure facilities, processing centers, and community reentry centers in the United States, Australia, South Africa, and the United Kingdom. GEO’s diversified services include enhanced in-custody rehabilitation and post-release support through the award-winning GEO Continuum of Care®, secure transportation, electronic monitoring, community-based programs, and correctional health and mental health care. GEO’s worldwide operations include the ownership and/or delivery of support services for 103 facilities totaling approximately 83,000 beds, including idle facilities and projects under development, with a workforce of up to approximately 18,000 employees.
Joe Gomes, CFA, Managing Director, Equity Research Analyst, Generalist , Noble Capital Markets, Inc.
Joshua Zoepfel, Research Associate, Noble Capital Markets, Inc.
Refer to the full report for the price target, fundamental analysis, and rating.
Upgrading to Outperform. We are upgrading GEO shares to Outperform with a $32 near-term price target. We believe there is substantial opportunity just in filling existing beds under current contracts, with the opening of currently idle facilities, new facilities, and expansion of the ISAP program providing additional upside.
Opportunity. GEO has an additional 17,000 beds to provide for ICE detention requirements, which would increase GEO’s overall bed capacity for ICE to about 32,000 beds. The incremental 17,000 beds includes approximately 9,400 beds in current idle facilities that will be reconfigured for detention use and approximately 7,700 incremental beds available at existing GEO serviced ICE and U.S. Marshal’s facilities under contract. Management estimates the utilization of these additional 17,000 beds could generate between $500 million and $600 million in incremental annualized revenues, with margins consistent with secure services owned facilities which average 25% to 30%.
Equity Research is available at no cost to Registered users of Channelchek. Not a Member? Click ‘Join’ to join the Channelchek Community. There is no cost to register, and we never collect credit card information.
This Company Sponsored Research is provided by Noble Capital Markets, Inc., a FINRA and S.E.C. registered broker-dealer (B/D).
*Analyst certification and important disclosures included in the full report. NOTE: investment decisions should not be based upon the content of this research summary. Proper due diligence is required before making any investment decision.
FORT WORTH, Texas, March 3, 2025 /PRNewswire/ — AZZ Inc. (NYSE: AZZ), the leading independent provider of hot-dip galvanizing and coil coating solutions in North America, today announced the completion of repricing its $400 million Senior Secured Revolving Line of Credit. The repricing decreased the interest rate margin applicable to the Revolving Credit Loans from margins ranging from 275 basis points to 350 basis points (subject to leverage ratio step-downs) to margins ranging from 175 basis points to 275 basis points (subject to leverage ratio step-downs); (b) reduced the Commitment Fee applicable to the Revolving Credit Loans from fees ranging from 25 basis points to 37.5 basis points (subject to leverage ratio step-downs) to fees ranging from 20 basis points to 30 basis points (subject to leverage ratio step-downs); and (c) reduced the Letter of Credit Fees from 425 basis points to fees ranging from 175 basis points to 275 basis points (subject to leverage ratio step-downs).
Jason Crawford, Chief Financial Officer commented, “We are pleased to announce the successful completion of our revolver repricing. The repricing will result in significantly lower interest costs through the maturity of the facility and demonstrates our ongoing commitment to interest expense reduction.”
About AZZ Inc. AZZ Inc. is the leading independent provider of hot-dip galvanizing and coil coating solutions to a broad range of end-markets. Collectively, our business segments provide sustainable, unmatched metal coating solutions that enhance the longevity and appearance of buildings, products and infrastructure that are essential to everyday life.
Safe Harbor Statement Certain statements herein about our expectations of future events or results constitute forward-looking statements for purposes of the safe harbor provisions of The Private Securities Litigation Reform Act of 1995. You can identify forward-looking statements by terminology such as “may,” “could,” “should,” “expects,” “plans,” “will,” “might,” “would,” “projects,” “currently,” “intends,” “outlook,” “forecasts,” “targets,” “anticipates,” “believes,” “estimates,” “predicts,” “potential,” “continue,” or the negative of these terms or other comparable terminology. Such forward-looking statements are based on currently available competitive, financial, and economic data and management’s views and assumptions regarding future events. Such forward-looking statements are inherently uncertain, and investors must recognize that actual results may differ from those expressed or implied in the forward-looking statements. Forward-looking statements speak only as of the date they are made and are subject to risks that could cause them to differ materially from actual results. Certain factors could affect the outcome of the matters described herein. This press release may contain forward-looking statements that involve risks and uncertainties including, but not limited to, changes in customer demand for our products and solutions, including demand by the construction markets, the industrial markets, and the metal coatings markets. We could also experience additional increases in labor costs, components and raw materials including zinc and natural gas, which are used in our hot-dip galvanizing process; supply-chain vendor delays; customer requested delays of our products or solutions; delays in additional acquisition opportunities; an increase in our debt leverage and/or interest rates on our debt, of which a significant portion is tied to variable interest rates; availability of experienced management and employees to implement AZZ’s growth strategy; a downturn in market conditions in any industry relating to the products we inventory or sell or the solutions that we provide; economic volatility, including a prolonged economic downturn or macroeconomic conditions such as inflation or changes in the political stability in the United States and other foreign markets in which we operate; acts of war or terrorism inside the United States or abroad; and other changes in economic and financial conditions. AZZ has provided additional information regarding risks associated with the business, including in Part I, Item 1A. Risk Factors, in AZZ’s Annual Report on Form 10-K for the fiscal year ended February 29, 2024, and other filings with the SEC, available for viewing on AZZ’s website at www.azz.com and on the SEC’s website at www.sec.gov. You are urged to consider these factors carefully when evaluating the forward-looking statements herein and are cautioned not to place undue reliance on such forward-looking statements, which are qualified in their entirety by this cautionary statement. These statements are based on information as of the date hereof and AZZ assumes no obligation to update any forward-looking statements, whether as a result of new information, future events, or otherwise.
Investor Relations and Company Contact: David Nark, Senior Vice President of Marketing, Communications, and Investor Relations AZZ Inc. (817) 810-0095 www.azz.com
Investor Contact: Sandy Martin / Phillip Kupper Three Part Advisors (214) 616-2207 www.threepa.com
Euroseas Ltd. was formed on May 5, 2005 under the laws of the Republic of the Marshall Islands to consolidate the ship owning interests of the Pittas family of Athens, Greece, which has been in the shipping business over the past 140 years. Euroseas trades on the NASDAQ Capital Market under the ticker ESEA. Euroseas operates in the container shipping market. Euroseas’ operations are managed by Eurobulk Ltd., an ISO 9001:2008 and ISO 14001:2004 certified affiliated ship management company, which is responsible for the day-to-day commercial and technical management and operations of the vessels. Euroseas employs its vessels on spot and period charters and through pool arrangements.
Mark Reichman, Managing Director, Equity Research Analyst, Natural Resources, Noble Capital Markets, Inc.
Hans Baldau, Research Associate, Noble Capital Markets, Inc.
Refer to the full report for the price target, fundamental analysis, and rating.
Fourth quarter results. Euroseas reported fourth quarter 2024 adjusted EBITDA and earnings per share (EPS) of $32.8 million and $3.33, respectively, compared to our estimates of $34.7 million and $3.66. While revenues were generally in line with our estimates, operating expenses were higher than expected. Drydocking expenses were ~$1.7 million above our estimates, while general and administrative expenses were ~$600 thousand above our estimates due to higher share-based compensation.
2025 outlook. Container ship charter rates remained stable in the fourth quarter, with feeder and intermediate segments showing modest gains in early 2025. While ongoing disruptions in the Red Sea continue to support rates, the potential reopening of the Suez Canal could have a negative impact. The global containership orderbook remains high, and vessels have started to come to market. While a large orderbook poses risks, the feeder and intermediate sectors where Euroseas operates face limited new supply and aging fleets.
Equity Research is available at no cost to Registered users of Channelchek. Not a Member? Click ‘Join’ to join the Channelchek Community. There is no cost to register, and we never collect credit card information.
This Research is provided by Noble Capital Markets, Inc., a FINRA and S.E.C. registered broker-dealer (B/D).
*Analyst certification and important disclosures included in the full report. NOTE: investment decisions should not be based upon the content of this research summary. Proper due diligence is required before making any investment decision.
BRENTWOOD, Tenn., Feb. 27, 2025 (GLOBE NEWSWIRE) — CoreCivic, Inc. (NYSE: CXW) (“CoreCivic”) announced today that it has entered into contract modifications to add capacity for up to a total of 784 detainees from U.S. Immigration and Customs Enforcement (“ICE”) at its 2,016-bed Northeast Ohio Correctional Center, its 1072-bed Nevada Southern Detention Center, and its 1,600-bed Cimarron Correctional Facility in Oklahoma. In addition, CoreCivic has obtained a contract modification to specify that ICE may use up to 252 beds at its 2,672-bed Tallahatchie County Correctional Facility in Mississippi.
CoreCivic currently cares for approximately 650 residents under a contract with the U.S. Marshals Service (“USMS”), as well as 925 residents under a contract with the Ohio Department of Rehabilitation and Correction at the Northeast Ohio Correctional Center. CoreCivic currently cares for approximately 800 residents under a contract with the USMS at the Nevada Southern Detention Center, and approximately 1,100 residents under a contract with the USMS at the Cimarron Correctional Facility. CoreCivic currently cares for approximately 1,400 residents at the Tallahatchie County Correctional Facility under contracts with eight different customers.
Damon T. Hininger, CoreCivic’s Chief Executive Officer, commented, “We are pleased to provide U.S. Immigration and Customs Enforcement with this additional capacity. We have an extensive supply of available beds that provides our government partners the flexibility to satisfy their immediate and long-term needs in a cost-effective manner. I am particularly proud of our dedicated team of professionals at each of these three facilities who are capable of managing these diverse customer requirements. We are entering a period where our government partners, particularly our federal government partners, are expected to have increased demand. We anticipate additional contracting activity that will help satisfy their growing needs.”
About CoreCivic
CoreCivic is a diversified, government-solutions company with the scale and experience needed to solve tough government challenges in flexible, cost-effective ways. We provide a broad range of solutions to government partners that serve the public good through high-quality corrections and detention management, a network of residential and non-residential alternatives to incarceration to help address America’s recidivism crisis, and government real estate solutions. We are the nation’s largest owner of partnership correctional, detention and residential reentry facilities, and believe we are the largest private owner of real estate used by government agencies in the United States. We have been a flexible and dependable partner for government for more than 40 years. Our employees are driven by a deep sense of service, high standards of professionalism and a responsibility to help government better the public good. Learn more at www.corecivic.com.
This press release includes forward-looking statements as to our beliefs and expectations of the outcome of future events including increasing demand from our government partners, particularly our federal government partners, and the prospects of growth in CoreCivic’s business. These forward-looking statements may include such words as “anticipate,” “estimate,” “expect,” “project,” “plan,” “intend,” “believe,” “may,” “will,” “should,” “can have,” “likely,” and other words and terms of similar meaning in connection with any discussion of the timing or nature of future operating or financial performance or other events. Such forward-looking statements may be affected by risks and uncertainties in CoreCivic’s business and market conditions. These forward-looking statements are subject to risks and uncertainties that could cause actual results to differ materially from the statements made. Important factors that could cause actual results to differ are described in the filings made from time to time by CoreCivic with the Securities and Exchange Commission (“SEC”) and include the risk factors described in CoreCivic’s Annual Report on Form 10-K for the fiscal year ended December 31, 2024, filed with the SEC on February 21, 2025. Except as required by applicable law, CoreCivic undertakes no obligation to update forward-looking statements made by it to reflect events or circumstances occurring after the date hereof or the occurrence of unanticipated events.
Contact:
Investors: Michael Grant – Managing Director, Investor Relations – (615) 263-6957 Media: Steve Owen – Vice President, Communications – (615) 263-3107
BOCA RATON, Fla.–(BUSINESS WIRE)–Feb. 27, 2025– The GEO Group, Inc. (NYSE: GEO) (“GEO” or the “Company”) announced today that it has been awarded a 15-year, fixed-price contract by U.S. Immigration and Customs Enforcement (“ICE”) to provide support services for the establishment of a federal immigration processing center at the company-owned, 1,000-bed Delaney Hall Facility (the “Facility”) in Newark, New Jersey. GEO’s support services include the exclusive use of the Facility by ICE, along with security, maintenance, and food services, as well as access to recreational amenities, medical care, and legal counsel.
The new support services contract is expected to generate in excess of $60 million in annualized revenues for GEO in the first full year of operations, with margins consistent with GEO’s company-owned Secure Services facilities. GEO estimates the 15-year value of the contract with normal cost of living adjustments to be approximately $1 billion. GEO expects to reactivate the Facility in the second quarter of 2025 with revenues and earnings from the new contract normalizing during the second half of 2025.
George C. Zoley, Executive Chairman of GEO, said, “Our company-owned Delaney Hall Facility will play an important role in providing needed detention bedspace and support services for ICE in the Northeast. We are continuing to prepare for what we believe is an unprecedented opportunity to help the federal government meet its expanded immigration enforcement priorities. We are taking several important steps to meet this opportunity, including making a previously announced $70 million investment in capital expenditures to strengthen our capabilities to deliver expanded detention capacity, secure transportation, and electronic monitoring and related services to ICE and the federal government.”
About The GEO Group The GEO Group, Inc. (NYSE: GEO) is a leading diversified government service provider, specializing in design, financing, development, and support services for secure facilities, processing centers, and community reentry centers in the United States, Australia, South Africa, and the United Kingdom. GEO’s diversified services include enhanced in-custody rehabilitation and post-release support through the award-winning GEO Continuum of Care®, secure transportation, electronic monitoring, community-based programs, and correctional health and mental health care. GEO’s worldwide operations include the ownership and/or delivery of support services for 99 facilities totaling approximately 79,000 beds, including idle facilities and projects under development, with a workforce of up to approximately 18,000 employees.
Use of forward-looking statements This news release may contain “forward-looking statements” within the meaning of Section 21E of the Securities Exchange Act of 1934, as amended, and the U.S. Private Securities Litigation Reform Act of 1995. Readers are cautioned not to place undue reliance on these forward-looking statements and any such forward-looking statements are qualified in their entirety by reference to the cautionary statements and risk factors contained in GEO’s filings with the U.S. Securities and Exchange Commission including its Form 10-K, 10-Q and 8-K reports. All forward-looking statements speak only as of the date of this news release and are based on current expectations and involve a number of assumptions, risks and uncertainties that could cause the actual results to differ materially from such forward-looking statements. Readers are strongly encouraged to read the full cautionary statements and risk factors contained in GEO’s filings with the U.S. Securities and Exchange Commission, including those referenced above. GEO disclaims any obligation to update or revise any forward-looking statements, except as required by law.
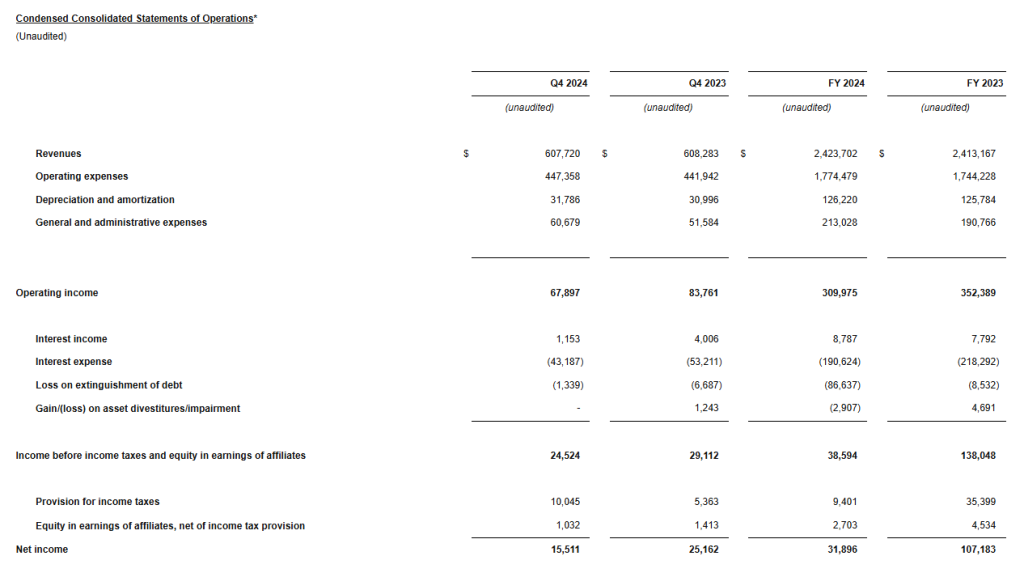
BOCA RATON, Fla.–(BUSINESS WIRE)–Feb. 27, 2025– The GEO Group, Inc. (NYSE: GEO) (“GEO”), a leading provider of contracted support services for secure facilities, processing centers, and reentry centers, as well as enhanced in-custody rehabilitation, post-release support, and electronic monitoring programs, reported today its financial results for the fourth quarter and full year 2024.
Fourth Quarter 2024 Highlights
Total revenues of $607.7 million
Net Income of $15.5 million
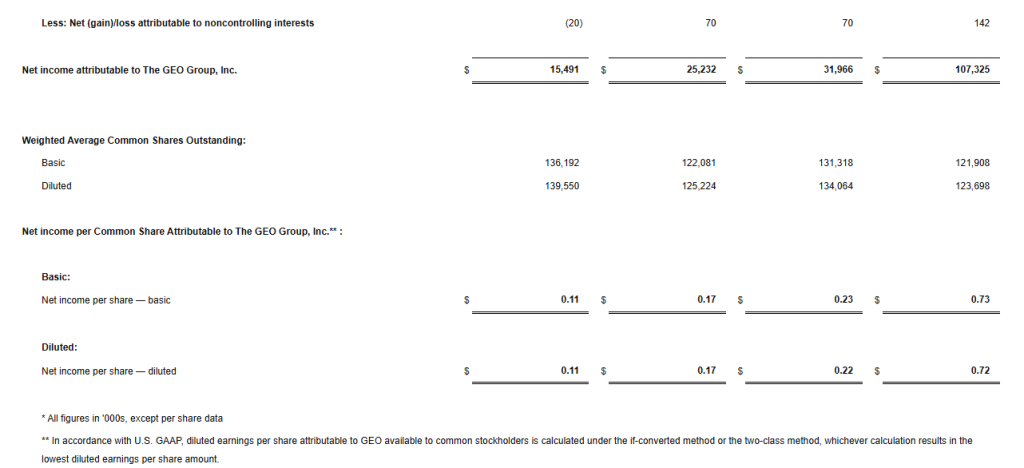
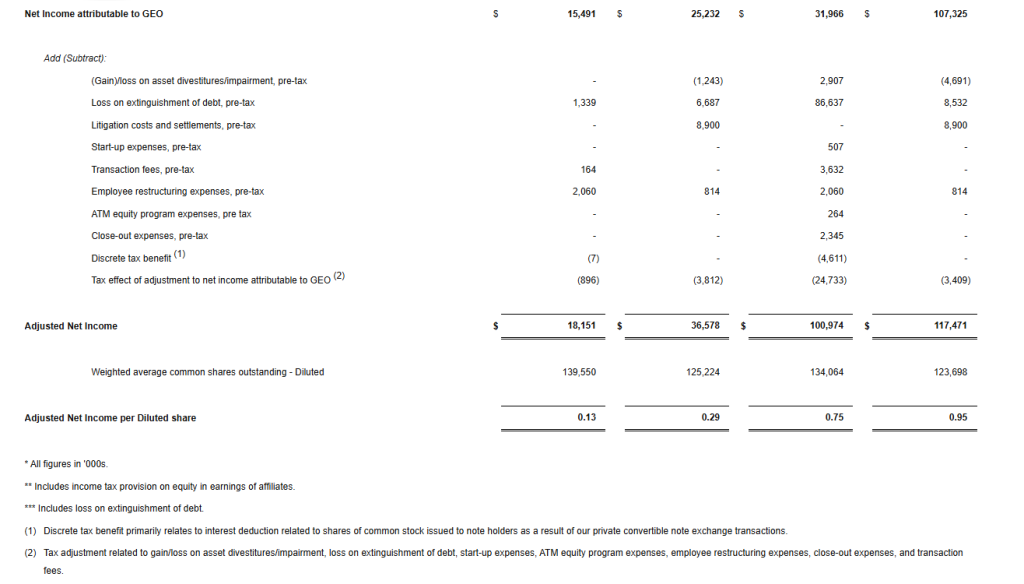
Net Income Attributable to GEO of $0.11 per diluted share
Adjusted Net Income of $0.13 per diluted share
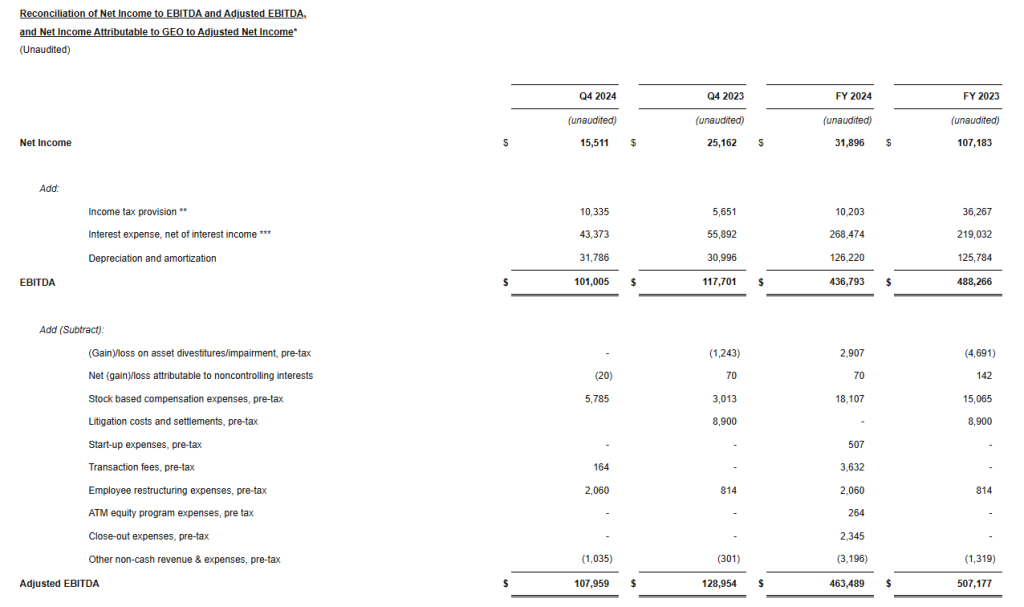
Adjusted EBITDA of $108.0 million
For the fourth quarter 2024, we reported net income attributable to GEO of $15.5 million, or $0.11 per diluted share, compared to net income attributable to GEO of $25.2 million, or $0.17 per diluted share, for the fourth quarter 2023.
Fourth quarter 2024 results reflect costs associated with the extinguishment of debt of $1.3 million, pre-tax, $0.2 million in transaction fees, pre-tax, and $2.1 million in employee restructuring expenses, pre-tax. Excluding these unusual items, we reported adjusted net income for the fourth quarter 2024 of $18.2 million, or $0.13 per diluted share, compared to $36.6 million, or $0.29 per diluted share, for the fourth quarter 2023.
We reported total revenues for the fourth quarter 2024 of $607.7 million compared to $608.3 million for the fourth quarter 2023. We reported fourth quarter 2024 Adjusted EBITDA of $108.0 million, compared to $129.0 million for the fourth quarter 2023.
Our fourth quarter of 2024 results reflect higher general and administrative expenses, which were partly the result of the previously announced reorganization of our management team and additional professional fees we incurred in anticipation of future growth projects and related operational activity during 2025.
Our revenues for the fourth quarter of 2024 increased sequentially from the third quarter of 2024 and were in line with our previous guidance; however, our earnings and Adjusted EBITDA were below our previous expectations, primarily due to the higher general and administrative expenses incurred during the fourth quarter of 2024.
George C. Zoley, Executive Chairman of GEO, said, “During the fourth quarter of 2024, we completed the previously announced reorganization of our senior management team and incurred additional professional fees in anticipation of what we expect to be unprecedented future growth opportunities and significant operational activity during 2025. In 2024, we also incurred $9 million of our previously announced $70 million investment to strengthen our capabilities to deliver expanded detention capacity, secure transportation, and electronic monitoring services to U.S. Immigration and Customs Enforcement (“ICE”) and the federal government.
In addition to taking these important steps, we remain focused on reducing our net debt, deleveraging our balance sheet, and exploring options to return capital to shareholders in the future. In 2025, we expect to further reduce our total net debt by approximately $150 million to $175 million, bringing our total net debt to approximately $1.55 billion.”
Full Year 2024 Highlights
Total revenues of $2.42 billion
Net Income of $31.9 million
Net Income Attributable to GEO of $0.22 per diluted share, reflects costs associated with the extinguishment of debt of $86.6 million, pre-tax
Adjusted Net Income of $0.75 per diluted share
Adjusted EBITDA of $463.5 million
For the full year 2024, we reported net income attributable to GEO of $32.0 million, or $0.22 per diluted share, compared to net income attributable to GEO of $107.3 million, or $0.72 per diluted share, for the full year 2023. Results for the full year 2024 reflect costs associated with the extinguishment of debt of $86.6 million, pre-tax.
Excluding the costs associated with the extinguishment of debt and other unusual items, we reported adjusted net income for the full year 2024 of $101.0 million, or $0.75 per diluted share, compared to $117.5 million, or $0.95 per diluted share, for the full year 2023.
We reported total revenues for the full year 2024 of $2.42 billion compared to $2.41 billion for the full year 2023. We reported Adjusted EBITDA for the full year 2024 of $463.5 million, compared to $507.2 million for the full year 2023.
Financial Guidance
Today, we issued our initial financial guidance for 2025. Consistent with our long-standing practice, our initial guidance does not include the impact of any new contract awards that have not been previously announced.
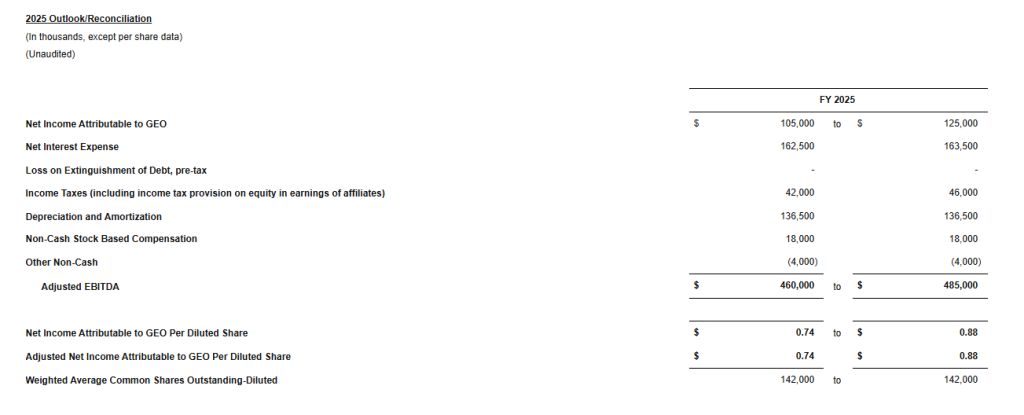
For the full year 2025, we expect Net Income Attributable to GEO to be in a range of 74 cents to 88 cents per diluted share, on revenues of approximately $2.5 billion and based on an effective tax rate of approximately 28 percent, inclusive of known discrete items. We expect our full year 2025 Adjusted EBITDA to be between $460 million and $485 million.
While our initial financial guidance for 2025 does not include an assumption for any new contract awards that have not been previously announced, we anticipate several additional opportunities could materialize during the year, which would provide significant upside to our current forecast. As we progress through the year and the likelihood and timing of these opportunities become clearer, we will adjust our 2025 financial guidance accordingly.
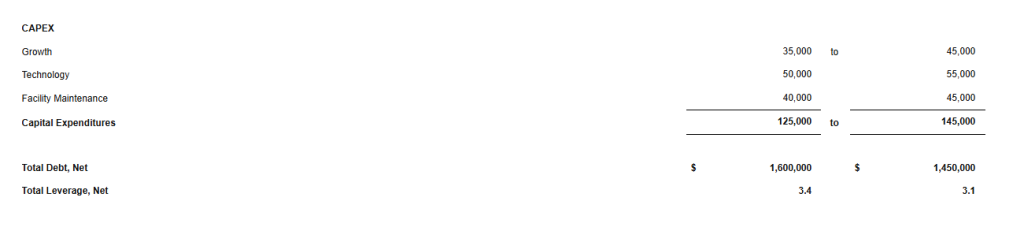
We expect total Capital Expenditures for the full year 2025 to be between $125 million and $145 million, including the impact of the $70 million investment we announced in December of 2024 to strengthen our capabilities to deliver expanded detention capacity, secure transportation, and electronic monitoring services to ICE and the federal government. This incremental $70 million investment is comprised of $47 million to renovate existing Secure Services facilities, $9 million of which was already spent in 2024; $16 million to ramp up the production of additional GPS tracking devices; and $7 million to expand our secure transportation assets.
Recent Developments
We announced today that we have been awarded a 15-year, fixed-price contract by ICE to provide support services for the establishment of a federal immigration processing center at the company-owned, 1,000-bed Delaney Hall Facility (the “Facility”) in Newark, New Jersey. GEO’s support services include the exclusive use of the Facility by ICE, along with security, maintenance, and food services, as well as access to recreational amenities, medical care, and legal counsel.
The new support services contract is expected to generate in excess of $60 million in annualized revenues for GEO in the first full year of operations, with margins consistent with GEO’s company-owned Secure Services facilities. GEO estimates the 15-year value of the contract with normal cost of living adjustments to be approximately $1 billion. GEO expects to reactivate the Facility in the second quarter of 2025 with revenues and earnings from the new contract normalizing during the second half of 2025.
Balance Sheet
At the end of the fourth quarter 2024, our net debt totaled approximately $1.7 billion, and our net leverage was approximately 3.7 times Adjusted EBITDA. We ended the fourth quarter of 2024 with approximately $77 million in cash and cash equivalents and approximately $214 million in total available liquidity.
Conference Call Information
We have scheduled a conference call and webcast for today at 11:00 AM (Eastern Time) to discuss our fourth quarter and full year 2024 financial results as well as our outlook. The call-in number for the U.S. is 1-877-250-1553 and the international call-in number is 1-412-542-4145. In addition, a live audio webcast of the conference call may be accessed on the Webcasts section under the News, Events and Reports tab of GEO’s investor relations webpage at investors.geogroup.com. A replay of the webcast will be available on the website for one year. A telephonic replay of the conference call will be available through March 6, 2025, at 1-877-344-7529 (U.S.) and 1-412-317-0088 (International). The participant passcode for the telephonic replay is 3882673.
About The GEO Group
The GEO Group, Inc. (NYSE: GEO) is a leading diversified government service provider, specializing in design, financing, development, and support services for secure facilities, processing centers, and community reentry centers in the United States, Australia, South Africa, and the United Kingdom. GEO’s diversified services include enhanced in-custody rehabilitation and post-release support through the award-winning GEO Continuum of Care®, secure transportation, electronic monitoring, community-based programs, and correctional health and mental health care. GEO’s worldwide operations include the ownership and/or delivery of support services for 99 facilities totaling approximately 79,000 beds, including idle facilities and projects under development, with a workforce of up to approximately 18,000 employees.
Reconciliation Tables and Supplemental Information
GEO has made available Supplemental Information which contains reconciliation tables of Net Income Attributable to GEO to Adjusted Net Income, and Net Income to EBITDA and Adjusted EBITDA, along with supplemental financial and operational information on GEO’s business and other important operating metrics. The reconciliation tables are also presented herein. Please see the section below titled “Note to Reconciliation Tables and Supplemental Disclosure – Important Information on GEO’s Non-GAAP Financial Measures” for information on how GEO defines these supplemental Non-GAAP financial measures and reconciles them to the most directly comparable GAAP measures. GEO’s Reconciliation Tables can be found herein and in GEO’s Supplemental Information available on GEO’s investor webpage at investors.geogroup.com.
Note to Reconciliation Tables and Supplemental Disclosure – Important Information on GEO’s Non-GAAP Financial Measures
Adjusted Net Income, EBITDA, and Adjusted EBITDA are non-GAAP financial measures that are presented as supplemental disclosures. GEO has presented herein certain forward-looking statements about GEO’s future financial performance that include non-GAAP financial measures, including Net Debt, Net Leverage, and Adjusted EBITDA.
The determination of the amounts that are included or excluded from these non-GAAP financial measures is a matter of management judgment and depends upon, among other factors, the nature of the underlying expense or income amounts recognized in a given period.
While we have provided a high level reconciliation for the guidance ranges for full year 2025, we are unable to present a more detailed quantitative reconciliation of the forward-looking non-GAAP financial measures to their most directly comparable forward-looking GAAP financial measures because management cannot reliably predict all of the necessary components of such GAAP measures.
The quantitative reconciliation of the forward-looking non-GAAP financial measures will be provided for completed annual and quarterly periods, as applicable, calculated in a consistent manner with the quantitative reconciliation of non-GAAP financial measures previously reported for completed annual and quarterly periods.
Net Debt is defined as gross principal debt less cash from restricted subsidiaries. Net Leverage is defined as Net Debt divided by Adjusted EBITDA.
EBITDA is defined as net income adjusted by adding provisions/(benefit) for income tax, interest expense, net of interest income, and depreciation and amortization. Adjusted EBITDA is defined as EBITDA adjusted for (gain)/loss on asset divestitures/impairment, pre-tax, net loss attributable to non-controlling interests, stock-based compensation expenses, pre-tax, litigation costs and settlements, pre-tax, start-up expenses, pre-tax, transaction fees, pre-tax, one-time employee restructuring expenses, pre-tax, ATM equity program expenses, pre-tax, close-out expenses, pre-tax, other non-cash revenue and expenses, pre-tax, and certain other adjustments as defined from time to time.
Given the nature of our business as a real estate owner and operator, we believe that EBITDA and Adjusted EBITDA are helpful to investors as measures of our operational performance because they provide an indication of our ability to incur and service debt, to satisfy general operating expenses, to make capital expenditures, and to fund other cash needs or reinvest cash into our business.
We believe that by removing the impact of our asset base (primarily depreciation and amortization) and excluding certain non-cash charges, amounts spent on interest and taxes, and certain other charges that are highly variable from year to year, EBITDA and Adjusted EBITDA provide our investors with performance measures that reflect the impact to operations from trends in occupancy rates, per diem rates and operating costs, providing a perspective not immediately apparent from net income.
The adjustments we make to derive the non-GAAP measures of EBITDA and Adjusted EBITDA exclude items which may cause short-term fluctuations in income from continuing operations and which we do not consider to be the fundamental attributes or primary drivers of our business plan and they do not affect our overall long-term operating performance.
EBITDA and Adjusted EBITDA provide disclosure on the same basis as that used by our management and provide consistency in our financial reporting, facilitate internal and external comparisons of our historical operating performance and our business units and provide continuity to investors for comparability purposes.
Adjusted Net Income is defined as net income/(loss) attributable to GEO adjusted for certain items which by their nature are not comparable from period to period or that tend to obscure GEO’s actual operating performance, including for the periods presented (gain)/loss on asset divestitures/impairment, pre-tax, loss on the extinguishment of debt, pre-tax, litigation costs and settlements, pre-tax, start-up expenses, pre-tax, transaction fees, pre-tax, one-time employee restructuring expenses, pre-tax, ATM equity program expenses, pre-tax, close-out expenses, pre-tax, discrete tax benefit, and tax effect of adjustments to net income attributable to GEO.
Safe-Harbor Statement
This press release contains forward-looking statements regarding future events and future performance of GEO that involve risks and uncertainties that could materially and adversely affect actual results, including statements regarding GEO’s financial guidance for the full year of 2025, statements regarding GEO’s focus on reducing net debt, deleveraging its balance sheet, positioning itself to explore options to return capital to shareholders in the future, making investments to strengthen GEO’s capabilities and deliver expanded detention capacity, secure transportation, and electronic monitoring services, pursuing unprecedented future growth opportunities and significant operational activity, and the upside this could have on GEO’s future financial results and financial guidance, and GEO’s ability to scale up the delivery of diversified services to support the future needs of its government agency partners. Forward-looking statements generally can be identified by the use of forward-looking terminology such as “may,” “will,” “expect,” “anticipate,” “intend,” “plan,” “believe,” “seek,” “estimate,” or “continue” or the negative of such words and similar expressions. Risks and uncertainties that could cause actual results to vary from current expectations and forward-looking statements contained in this press release include, but are not limited to: (1) GEO’s ability to meet its financial guidance for 2025 given the various risks to which its business is exposed; (2) GEO’s ability to deleverage and repay, refinance or otherwise address its debt maturities in an amount and on terms commercially acceptable to GEO, and on the timeline it expects or at all; (3) GEO’s ability to identify and successfully complete any potential sales of company-owned assets and businesses or potential acquisitions of assets or businesses on commercially advantageous terms on a timely basis, or at all; (4) changes in federal and state government policy, orders, directives, legislation and regulations that affect public-private partnerships with respect to secure, correctional and detention facilities, processing centers and reentry centers; (5) changes in federal immigration policy; (6) public and political opposition to the use of public-private partnerships with respect to secure correctional and detention facilities, processing centers and reentry centers; (7) any continuing impact of the COVID-19 global pandemic on GEO and GEO’s ability to mitigate the risks associated with COVID-19; (8) GEO’s ability to sustain or improve company-wide occupancy rates at its facilities; (9) fluctuations in GEO’s operating results, including as a result of contract terminations, contract renegotiations, changes in occupancy levels and increases in GEO’s operating costs; (10) general economic and market conditions, including changes to governmental budgets and its impact on new contract terms, contract renewals, renegotiations, per diem rates, fixed payment provisions, and occupancy levels; (11) GEO’s ability to address inflationary pressures related to labor related expenses and other operating costs; (12) GEO’s ability to timely open facilities as planned, profitably manage such facilities and successfully integrate such facilities into GEO’s operations without substantial costs; (13) GEO’s ability to win management contracts for which it has submitted proposals and to retain existing management contracts; (14) risks associated with GEO’s ability to control operating costs associated with contract start-ups; (15) GEO’s ability to successfully pursue growth opportunities and continue to create shareholder value; (16) GEO’s ability to obtain financing or access the capital markets in the future on acceptable terms or at all; and (17) other factors contained in GEO’s Securities and Exchange Commission periodic filings, including its Form 10-K, 10-Q and 8-K reports, many of which are difficult to predict and outside of GEO’s control.
Great Lakes Dredge & Dock Corporation is the largest provider of dredging services in the United States. In addition, Great Lakes is fully engaged in expanding its core business into the rapidly developing offshore wind energy industry. The Company has a long history of performing significant international projects. The Company employs experienced civil, ocean and mechanical engineering staff in its estimating, production and project management functions. In its over 131-year history, the Company has never failed to complete a marine project. Great Lakes owns and operates the largest and most diverse fleet in the U.S. dredging industry, comprised of approximately 200 specialized vessels. Great Lakes has a disciplined training program for engineers that ensures experienced-based performance as they advance through Company operations. The Company’s Incident-and Injury-Free® (IIF®) safety management program is integrated into all aspects of the Company’s culture. The Company’s commitment to the IIF® culture promotes a work environment where employee safety is paramount.
Joe Gomes, CFA, Managing Director, Equity Research Analyst, Generalist , Noble Capital Markets, Inc.
Joshua Zoepfel, Research Associate, Noble Capital Markets, Inc.
Refer to the full report for the price target, fundamental analysis, and rating.
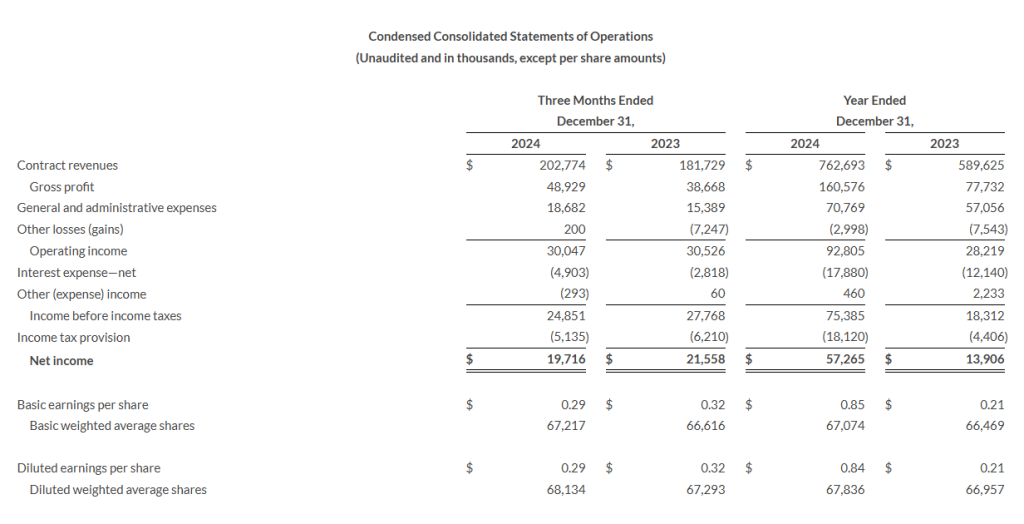
4Q24. Revenue of $202.8 million was up from $181.7 million a year ago but modestly below our $215 million estimate. Gross margin came in at 24.1%, up from 21.3% in 4Q23 and above our 20.9% estimate. Adjusted EBITDA improved to $40.2 million, flat with $40.8 million a year ago. We had forecasted $37 million. Net income was $19.7 million, or $0.29/sh, versus $21.6 million, or $0.32/sh, last year, which benefitted from a one time $7.4 million gain. We were at $15 million and $0.22/sh.
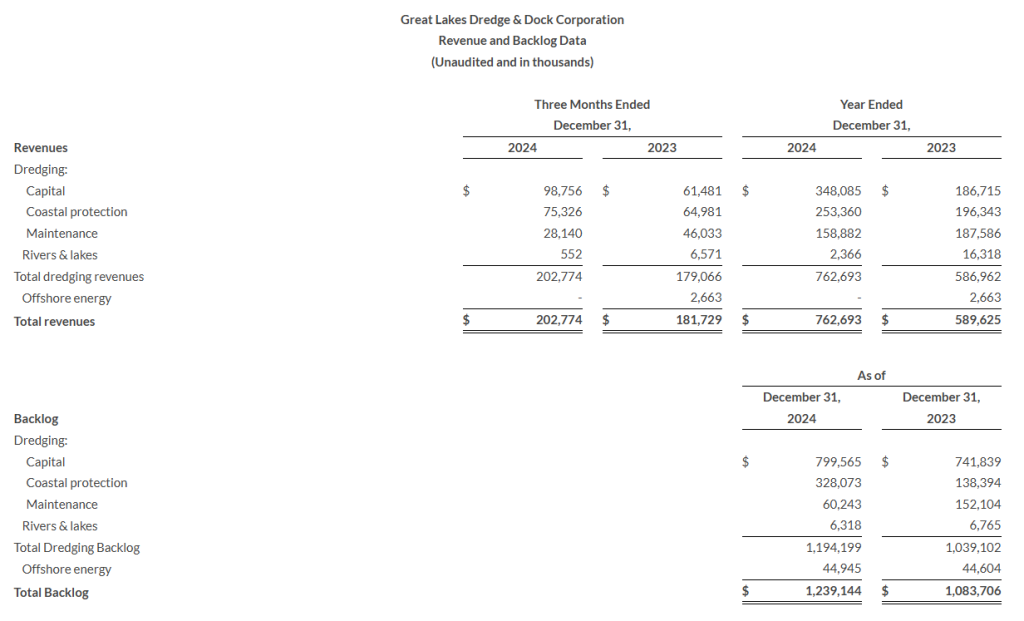
Backlog. Great Lakes ended the year with $1.19 billion of dredging backlog and $1.24 billion of total backlog. The Company had an additional $282.1 million of low bids and options pending award at year’s end. Approximately 94% of the backlog was in higher margin capital and coastal protection work. This provides solid visibility into 2026.
Equity Research is available at no cost to Registered users of Channelchek. Not a Member? Click ‘Join’ to join the Channelchek Community. There is no cost to register, and we never collect credit card information.
This Company Sponsored Research is provided by Noble Capital Markets, Inc., a FINRA and S.E.C. registered broker-dealer (B/D).
*Analyst certification and important disclosures included in the full report. NOTE: investment decisions should not be based upon the content of this research summary. Proper due diligence is required before making any investment decision.
Mark Reichman, Managing Director, Equity Research Analyst, Natural Resources, Noble Capital Markets, Inc.
Refer to the full report for the price target, fundamental analysis, and rating.
New asset-based lending credit facility. FreightCar America executed a new $35 million asset-based lending (ABL) credit agreement with Bank of America consisting of revolving loans and a sub-facility for letters of credit. Compared to the company’s previous ABL credit agreement, the new revolving credit facility offers a lower interest rate that is based on the secured overnight financing rate (SOFR) plus 175 basis points with a term ending on February 12, 2030.
Greater financial flexibility. The new facility is expected to provide the company with greater financial flexibility to support its growth and strategic objectives. Because the borrowing base requirements include eligible parts inventory and railcar inventory, we think the ability to borrow against its inventory could also provide the company with greater flexibility with respect to how it manages its production schedule.
Equity Research is available at no cost to Registered users of Channelchek. Not a Member? Click ‘Join’ to join the Channelchek Community. There is no cost to register, and we never collect credit card information.
This Company Sponsored Research is provided by Noble Capital Markets, Inc., a FINRA and S.E.C. registered broker-dealer (B/D).
*Analyst certification and important disclosures included in the full report. NOTE: investment decisions should not be based upon the content of this research summary. Proper due diligence is required before making any investment decision.
Fourth quarter net income of $19.7 million Fourth quarter Adjusted EBITDA of $40.2 million Full year net income of $57.3 million Full year Adjusted EBITDA of $136.0million Dredging backlog of $1.2 billion at December 31, 2024
HOUSTON, Feb. 18, 2025 (GLOBE NEWSWIRE) — Great Lakes Dredge & Dock Corporation (“Great Lakes” or the “Company”) (Nasdaq: GLDD), the largest provider of dredging services in the United States, today reported financial results for the fourth quarter and year ended December 31, 2024.
Fourth Quarter 2024 Highlights
Revenue was $202.8 million
Total operating income was $30.0 million
Net income was $19.7 million
Adjusted EBITDA was $40.2 million
Full Year 2024 Highlights
Revenue was $762.7 million
Total operating income was $92.8 million
Net income was $57.3 million
Adjusted EBITDA was $136.0 million
Management Commentary
Lasse Petterson, President and Chief Executive Officer, commented, “Great Lakes had an outstanding 2024, with strong project performance and exceptional financial results. We capped off the year with another strong quarter and ended 2024 with revenue of $762.7 million, net income of $57.3 million, and Adjusted EBITDA of $136.0 million, the latter two metrics being the second-highest in Great Lakes’ history. The bid market for 2024 hit a historic level of $2.9 billion of which Great Lakes won 33%. This further added to our substantial dredging backlog which as of the end of 2024 stood at $1.2 billion, with an additional $282.1 million in low bids and options pending award, providing expected revenue visibility well into 2026. At the end of the year, capital and coastal protection projects accounted for 94% of our backlog, which typically yield higher margins. The largest capital project bid in the year was the Sabine-Neches Contract 6 Deepening project, won by Great Lakes, with awarded base and open options totaling $235 million.
Also included in our backlog are two Liquified Natural Gas (“LNG”) projects that were awarded in 2023, the Port Arthur LNG Phase 1 project and the Brownsville Ship Channel project for Next Decade Corporation’s Rio Grande LNG project, which is the largest project undertaken in Great Lakes’ history. Dredging began on both capital projects in the third quarter of 2024. We continue to tender bids on several pending LNG projects in an effort to diversify and expand our client base.
We remain steadfast in our commitment to executing a long-term strategy that maximizes growth opportunities for the Company. The Acadia, the first U.S.-flagged Jones Act compliant subsea rock installation (“SRI”) vessel, is currently under construction and has secured offshore wind rock placement contracts for Equinor’s Empire Wind 1 and Ørsted’s Sunrise Wind projects to protect foundations and cables. In addition, during the fourth quarter, we signed a vessel reservation agreement for the Acadia for another wind project in the United States. All three of these projects are fully permitted and we believe will not be directly impacted by the President’s Executive Order pausing issuance of new offshore wind leases and permits.
The Acadia is also well suited for work outside of U.S. offshore wind and over the past year we have been broadening our target markets for the Acadia to include international offshore wind projects, as well as protecting critical subsea infrastructure such as oil and gas pipelines and telecommunication and power cables. These additional markets pave the way for the rebranding of our offshore wind division to Offshore Energy.
In the second quarter, Great Lakes entered into a $150 million second-lien credit agreement which provides Great Lakes with additional liquidity which we expect will help us complete our new build program. In the third quarter, S&P Global Ratings upgraded Great Lakes’ credit rating to “B-” from “CCC+”, which further demonstrates the improvements we have made this past year to our balance sheet, cash flows and overall performance.
The Company had an exceptional 2024, and with our enhanced fleet, strong project performance, sustainable cost savings initiatives and strategic growth initiatives, we believe we are well prepared for the future.”
Operational Update
Fourth Quarter 2024
Revenue was $202.8 million, an increase of $21.1 million from the fourth quarter of 2023. The higher revenue in the fourth quarter of 2024 was due primarily to higher capital and coastal protection project revenues, offset partially by a decrease in rivers and lakes and maintenance project revenue.
Gross profit was $48.9 million, an improvement of $10.2 million compared to the gross profit from the fourth quarter of 2023. Gross margin percentage increased to 24.1% in the fourth quarter of 2024 from 21.3% in the fourth quarter of 2023 due to improved project performance and higher capital and coastal protection revenue in the current year quarter.
Operating income was $30.0 million, which is slightly down compared to operating income of $30.5 million in the prior year fourth quarter. The year over year decrease is primarily due to a $7.4 million gain from a terminated offshore wind contract in the fourth quarter of 2023 and higher incentive pay in the current year quarter as a result of improved operational performance. These were mostly offset by the $10.2 million improvement in gross profit in the current year quarter.
Net income for the quarter was $19.7 million, which is a $1.9 million decrease compared to net income of $21.6 million in the prior year fourth quarter. The decrease is mostly driven by an increase in net interest expense partially offset by a decrease in income tax provision.
Full Year 2024
Revenue was $762.7 million, an increase of $173.1 million from 2023. The higher revenue in 2024 was due primarily to higher capital and coastal protection project revenues, offset partially by a decrease in rivers and lakes and maintenance project revenue.
Gross profit for the full year 2024 was $160.6 million, an improvement of $82.9 million compared to the prior year’s gross profit. Gross margin percentage increased to 21.1% for the full year 2024 from 13.2% for the full year 2023 partially due to improved project performance and more capital and coastal protection revenue, which typically yield higher margins.
Operating income for the full year 2024 was $92.8 million, which is a $64.6 million improvement from the prior year. The year-over-year increase is primarily a result of the $82.9 million increase in gross profit, which was partially offset by a $7.4 million gain from the terminated offshore wind contract in 2023 and by higher general and administrative expenses in the current year primarily due to higher incentive pay as a result of improved operational performance this year.
Net income for the full year 2024 was $57.3 million, which is a $43.4 million improvement compared to $13.9 million for the full year 2023. This increase is primarily a result of the improved operating income, partially offset by an increase in net interest expense and income tax provision.
Balance Sheet, Dredging Backlog & Capital Expenditures
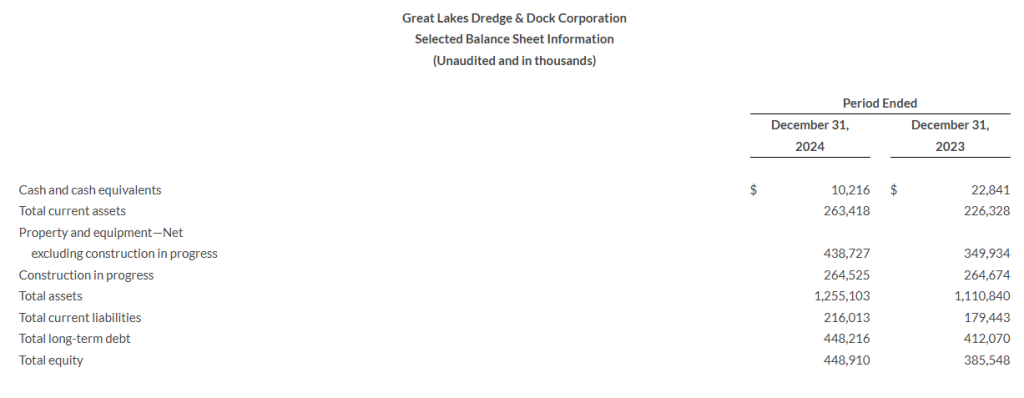
At December 31, 2024, the Company had $10.2 million in cash and cash equivalents and total long-term debt of $448.2 million including $35 million outstanding against our $300 million revolver.
At December 31, 2024, the Company had $1.2 billion in dredging backlog as compared to $1.04 billion at December 31, 2023. Dredging backlog does not include approximately $282.1 million of low bids and options pending award and approximately $44.9 million of performance obligations and $12.7 million in options pending award related to offshore energy.
Total capital expenditures for 2024 were $135.7 million compared to $144.8 million for 2023. The 2024 capital expenditures included $72.7 million for the construction of the subsea rock installation vessel, the Acadia, $41.0 million for the Amelia Island, $5.4 million for the completion of the Galveston Island, and $16.6 million for maintenance and growth.
Market Update
We continue to see strong support from the Administration for the dredging industry. The 2024 Energy and Water Appropriations Bill provided a record $8.7 billion to the U.S. Army Corps of Engineers (the “Corps”). Additionally, the 2023 Disaster Relief Supplemental Appropriations Act allocated $1.5 billion for infrastructure repairs and beach renourishment projects. The year ended with a record bid market of $2.9 billion, which included a robust beach renourishment market and 13 capital projects.
The 2025 Corps’ budget is expected to be another record appropriation. On June 28, 2024, the U.S. House of Representatives Energy and Water Appropriations Subcommittee passed their 2025 Appropriations Bill providing the Corps with a budget of $9.96 billion, which is $2.7 billion above the President’s Budget request. The bill includes $5.7 billion for Operations and Maintenance projects, of which $3.1 billion is from the Harbor Maintenance Trust Fund. On August 1, 2024, the Senate Appropriations Committee approved its draft of the 2025 Energy and Water spending bill which provides $10.3 billion in total funding for the Corps. On December 20, 2024, U.S. Congress approved a continuing resolution through March 14, 2025, for the Corps’ Fiscal 2025 budget.
The Water Resources Development Act (“WRDA”) is renewed every two years and authorizes funding for Corps’ projects related to flood protection, dredging, and ecosystem restoration. WRDA 2022 included funding for deepening New York and New Jersey shipping channels to 55 feet and the Coastal Texas Protection and Restoration Program, which aims to protect the Texas Gulf Coast from hurricanes. On January 4, 2025, President Biden signed WRDA 2024 into law which includes several capital projects and projects designed to enhance flood protection, improve coastal resilience, and support ecosystem restoration.
We continue to be confident about our growth and diversification plans via our subsea rock installation initiative. As stated previously, we are broadening our targeted SRI markets to include oil and gas pipeline and telecommunications cable protection, and international offshore wind.
We continue to pursue SRI vessel projects with work planned for 2026 and beyond. Included in the subsea rock installation opportunities are global offshore wind projects. The latest BloombergNEF offshore wind market outlook shows global offshore wind expected to grow tenfold by 2040 with a forecast exceeding 700GW. In addition, market expectations for telecommunication and oil and gas scour protection projects globally are estimated on average to require approximately 2,000 SRI vessel days annually. We believe there is an undersupply of rock placement vessels and we are pursuing opportunities in all the above mentioned markets which are expected to provide the Acadia with work planned for 2026 and beyond.
Conference Call Information
The Company will conduct a quarterly conference call, which will be held on Tuesday, February 18, 2025, at 9:00 a.m. C.S.T (10:00 a.m. E.S.T.). Investors and analysts are encouraged to pre-register for the conference call by using the link below. Participants who pre-register will be given a unique PIN to gain immediate access to the call. Pre-registration may be completed at any time up to the call start time.
The live call and replay can also be heard at https://edge.media-server.com/mmc/p/oqt4ireo or on the Company’s website, www.gldd.com, under Events on the Investor Relations page. A copy of the press release will be available on the Company’s website.
Use of Non-GAAP measures
Adjusted EBITDA, as provided herein, represents net income from continuing operations, adjusted for net interest expense, income taxes, depreciation and amortization expense, debt extinguishment, accelerated maintenance expense for new international deployments, goodwill or asset impairments and gains on bargain purchase acquisitions. Adjusted EBITDA is not a measure derived in accordance with GAAP. The Company presents Adjusted EBITDA as an additional measure by which to evaluate the Company’s operating trends. The Company believes that Adjusted EBITDA is a measure frequently used to evaluate performance of companies with substantial leverage and that the Company’s primary stakeholders (i.e., its stockholders, bondholders and banks) use Adjusted EBITDA to evaluate the Company’s period to period performance. Additionally, management believes that Adjusted EBITDA provides a transparent measure of the Company’s recurring operating performance and allows management and investors to readily view operating trends, perform analytical comparisons and identify strategies to improve operating performance. For this reason, the Company uses a measure based upon Adjusted EBITDA to assess performance for purposes of determining compensation under the Company’s incentive plan. Adjusted EBITDA should not be considered an alternative to, or more meaningful than, amounts determined in accordance with GAAP including: (a) operating income as an indicator of operating performance or (b) cash flows from operations as a measure of liquidity. As such, the Company’s use of Adjusted EBITDA, instead of a GAAP measure, has limitations as an analytical tool, including the inability to determine profitability or liquidity due to the exclusion of accelerated maintenance expense for new international deployments, goodwill or asset impairments, gains on bargain purchase acquisitions, net interest and income tax expense and the associated significant cash requirements and the exclusion of depreciation and amortization, which represent significant and unavoidable operating costs given the level of indebtedness and capital expenditures needed to maintain the Company’s business. For these reasons, the Company uses operating income to measure the Company’s operating performance and uses Adjusted EBITDA only as a supplement. Adjusted EBITDA is reconciled to net income in the table of financial results. For further explanation, please refer to the Company’s SEC filings.
The Company
Great Lakes Dredge & Dock Corporation is the largest provider of dredging services in the United States, which is complemented with a long history of performing significant international projects. In addition, Great Lakes is fully engaged in expanding its core business into the offshore energy industry. The Company employs experienced civil, ocean and mechanical engineering staff in its estimating, production and project management functions. In its over 135-year history, the Company has never failed to complete a marine project. Great Lakes owns and operates the largest and most diverse fleet in the U.S. dredging industry, comprised of approximately 200 specialized vessels. Great Lakes has a disciplined training program for engineers that ensures experienced-based performance as they advance through Company operations. The Company’s Incident-and Injury-Free® (IIF®) safety management program is integrated into all aspects of the Company’s culture. The Company’s commitment to the IIF® culture promotes a work environment where employee safety is paramount.
Certain statements in this press release may constitute “forward-looking” statements, as defined in Section 21E of the Securities Exchange Act of 1934 (the “Exchange Act”), the Private Securities Litigation Reform Act of 1995 (the “PSLRA”) or in releases made by the Securities and Exchange Commission (the “SEC”), all as may be amended from time to time. Such forward-looking statements involve known and unknown risks, uncertainties and other important factors that could cause the actual results, performance or achievements of Great Lakes and its subsidiaries, or industry results, to differ materially from any future results, performance or achievements expressed or implied by such forward-looking statements. Statements that are not historical fact are forward-looking statements. Forward-looking statements can be identified by, among other things, the use of forward-looking language, such as the words “plan,” “believe,” “expect,” “anticipate,” “intend,” “estimate,” “project,” “may,” “would,” “could,” “should,” “seeks,” “are optimistic,” “commitment to” or “scheduled to,” or other similar words, or the negative of these terms or other variations are being made pursuant to the Exchange Act and the PSLRA with the intention of obtaining of these terms or comparable language, or by discussion of strategy or intentions. These cautionary statements have the benefit of the “safe harbor” provisions of such laws. Great Lakes cautions investors that any forward-looking statements made by Great Lakes are not guarantees or indicative of future performance. Important assumptions and other important factors that could cause actual results to differ materially from those forward-looking statements with respect to Great Lakes include, but are not limited to: a reduction in government funding for dredging and other contracts, or government cancellation of such contracts, or the inability of the Corps to let bids to market; our ability to qualify as an eligible bidder under government contract criteria and to compete successfully against other qualified bidders in order to obtain government dredging and other contracts; our business and operating results could be adversely affected by the political environment and governmental fiscal and monetary policies; cost over-runs, operating cost inflation and potential claims for liquidated damages, particularly with respect to our fixed cost contracts; the timing of our performance on contracts and new contracts being awarded to us; significant liabilities that could be imposed were we to fail to comply with government contracting regulations; project delays related to the increasingly negative impacts of climate change or other unusual, non-historical weather patterns; costs necessary to operate and maintain our existing vessels and the construction of new vessels; equipment or mechanical failures; pandemic, epidemic or outbreak of an infectious disease; disruptions to our supply chain for procurement of new vessel build materials or maintenance on our existing vessels; capital and operational costs due to environmental regulations; market and regulatory responses to climate change, including proposed regulations concerning emissions reporting and future emissions reduction goals; contract penalties for any projects that are completed late; force majeure events, including natural disasters, war and terrorists’ actions; changes in the amount of our estimated backlog; significant negative changes attributable to large, single customer contracts; our ability to obtain financing for the construction of new vessels, including our new offshore energy vessel; our ability to secure contracts to utilize our new offshore energy vessel; unforeseen delays and cost overruns related to the construction of our new vessels; any failure to comply with the Jones Act provisions on coastwise trade, or if those provisions were modified or repealed; our ability to comply with anti-discrimination laws, including those pertaining to diversity, equity and inclusion programs; fluctuations in fuel prices, particularly given our dependence on petroleum-based products; impacts of nationwide inflation on procurement of new build and vessel maintenance materials; our ability to obtain bonding or letters of credit and risks associated with draws by the surety on outstanding bonds or calls by the beneficiary on outstanding letters of credit; acquisition integration and consolidation, including transaction expenses, unexpected liabilities and operational challenges and risks; divestitures and discontinued operations, including retained liabilities from businesses that we sell or discontinue; potential penalties and reputational damage as a result of legal and regulatory proceedings; any liabilities imposed on us for the obligations of joint ventures, partners and subcontractors; increased costs of certain material used in our operations due to newly imposed tariffs; unionized labor force work stoppages; any liabilities for job-related claims under federal law, which does not provide for the liability limitations typically present under state law; operational hazards, including any liabilities or losses relating to personal or property damage resulting from our operations; our substantial amount of indebtedness, which makes us more vulnerable to adverse economic and competitive conditions; restrictions on the operation of our business imposed by financing terms and covenants; impacts of adverse capital and credit market conditions on our ability to meet liquidity needs and access capital; limitations on our hedging strategy imposed by statutory and regulatory requirements for derivative transactions; foreign exchange risks, in particular, as it relates to the new offshore energy vessel build; losses attributable to our investments in privately financed projects; restrictions on foreign ownership of our common stock; restrictions imposed by Delaware law and our charter on takeover transactions that stockholders may consider to be favorable; restrictions on our ability to declare dividends imposed by our financing agreements or Delaware law; significant fluctuations in the market price of our common stock, which may make it difficult for holders to resell our common stock when they want or at prices that they find attractive; changes in previously recorded net revenue and profit as a result of the significant estimates made in connection with our methods of accounting for recognized revenue; maintaining an adequate level of insurance coverage; our ability to find, attract and retain key personnel and skilled labor; disruptions, failures, data corruptions, cyber-based attacks or security breaches of the information technology systems on which we rely to conduct our business; and impairments of our goodwill or other intangible assets. For additional information on these and other risks and uncertainties, please see Item 1A. “Risk Factors” of Great Lakes’ Annual Report on our most recent Form 10-K, Item 1A. “Risk Factors” of Great Lakes’ Quarterly Report on Form 10-Q, and in other securities filings by Great Lakes with the SEC.
Although Great Lakes believes that its plans, intentions and expectations reflected in or suggested by such forward looking statements are reasonable, actual results could differ materially from a projection or assumption in any forward-looking statements. Great Lakes’ future financial condition and results of operations, as well as any forward-looking statements, are subject to change and inherent risks and uncertainties. The forward-looking statements contained in this press release are made only as of the date hereof and Great Lakes does not have or undertake any obligation to update or revise any forward-looking statements whether as a result of new information, subsequent events or otherwise, unless otherwise required by law.
For further information contact: Tina Baginskis Director, Investor Relations 630-574-3024