Insurance brokerage and consulting powerhouse Aon (AON) unveiled a definitive agreement on December 20th to acquire middle-market peer NFP in an all-cash $13.4 billion deal. NFP focuses on property and casualty brokerage, benefits consulting, wealth management and retirement plan advisory specifically for mid-sized clients.
The landmark transaction allows Aon to aggressively expand into the lucrative mid-corporation segment amid an economic landscape stoking demand for recession-resistant insurance policies. With NFP expecting 2022 revenues nearing $2.2 billion and a roster of over 7,700 client organizations, the bolt-on acquisition provides Aon a launching pad towards deepening its presence among growth-oriented middle-market enterprises.
Tap Exploding Market for Mid-Sized Firms
Several tailwinds have powered extraordinary growth within insurance brokerages catering to mid-cap corporations. As middle-market companies strive for enhanced risk management oversight amid volatile conditions, they increasingly seek broker partners delivering customized guidance on property/casualty and employee benefits policies.
NFP’s singular mid-market focus perfectly aligns with this surging addressable market. The brokerage brings specialized consulting capabilities around financial, health, and retirement offerings that resonate powerfully among mid-sized organizations. After closing in mid-2024, NFP’s offerings significantly broaden and diversify Aon’s middle-market resources.
The opportunistic move also builds on Aon’s existing relationship with mid-market insurance access point Businessolver. By consolidating NSM Insurance and now NFP, Aon assembles an unrivaled mid-corporation product portfolio spanning risk management, human resources, payroll, and compliance functionality.
Betting on Consistent Insurance Demand
Aon’s bold acquisition reflects confidence that commercial insurance spending will continue rising despite recessionary warnings. Employer-sponsored health plans, property policies, casualty coverage, and other risk transfer solutions retain fundamental necessity for corporations of all sizes. With mid-sized companies facing substantial human capital and operational exposures, brokerages like NFP and Aon constitute trusted partners for navigating complex risk landscapes.
The sector’s recession resilience and anti-cyclical behaviors produce reliable revenues amid broader economic uncertainty. Aon has witnessed only one year of revenue declines over the past decade. The industry giant averaged yearly sales growth of 8.4% since 2013.
Strategic Growth Play
From a financial perspective, NFP dramatically strengthens Aon’s growth trajectory. Adding the brokerage’s high-single-digit annual revenue gains provides immediate scale. In an investor presentation, management projected total company sales expansion of 8% in 2024 and 14% in 2025 post-acquisition. Significant cross-selling opportunities and global expansion of NFP’s capabilities should spur ongoing upside.
Aon expects to realize $150 million in cost synergies by 2025. The combination presents chances to eliminate redundant corporate structures and leverage joint capabilities in technology, data analytics and digitization to drive efficiency gains. Ensuing margin expansion would magnify bottom-line profit growth produced by the increased revenues.
Although the transaction costs require $7 billion in new debt, NFP is projected to start contributing towards deleveraging by 2025. While 2024 margins may compress initially, management reinforced commitment towards long-term margin expansion. From 2013-2021, Aon’s margins grew from 16.4% to record 35.7% levels.
Risks and Costs
Despite projected profitability gains, Aon’s stock dropped nearly 8% on the announcement as shareholders weigh risks around significant integration costs and execution challenges. Management forecasts $400 million in one-time transaction and integration expenses associated with consolidating the sizable acquisitions.
There are additionally risks tied to client retention. As occurred with some Willis Towers Watson customers after Aon’s failed merger attempt in 2021, certain NFP accounts may reevaluate relationships depending on changes in account management or service model adjustments.
Overall, however, investor reception remains positive. The deal continues an active era defined by transformative combinations as large brokers fight for differentiation. Aon has now spent nearly $30 billion on M&A to distinguish its portfolio. Adding NFP crucially now arms the brokerage giant to increasingly capitalize on lucrative mid-market tailwinds in coming years.
Joe Gomes, Managing Director, Equity Research Analyst, Generalist , Noble Capital Markets, Inc.
Joshua Zoepfel, Research Associate, Noble Capital Markets, Inc.
Refer to the full report for the price target, fundamental analysis, and rating.
Increasing Production. During November, Bit Digital produced 142.7 BTC, a 24% increase from 111.6 BTC last month. The increase was primarily driven by the increase in the Company’s active hash rate, which was at 2.25 EH/s as of November 30, 2023 compared to 2.0 EH/s last month, and Bit Digital did not experience any maintenance outages.
Staking. Over on the staking side, Bit Digital had approximately 12,784 ETH actively staked in native and liquid staking protocols as of November 30, 2023. Approximately 12,384 ETH were natively staked and 400 ETH were deployed in liquid staking protocols as of that date. The Company earned a blended APY of approximately 4.35% on its staked ETH position for the month, and earned aggregate staking rewards of approximately 44.93 ETH.
Equity Research is available at no cost to Registered users of Channelchek. Not a Member? Click ‘Join’ to join the Channelchek Community. There is no cost to register, and we never collect credit card information.
This Company Sponsored Research is provided by Noble Capital Markets, Inc., a FINRA and S.E.C. registered broker-dealer (B/D).
*Analyst certification and important disclosures included in the full report. NOTE: investment decisions should not be based upon the content of this research summary. Proper due diligence is required before making any investment decision.
Joe Gomes, Managing Director, Equity Research Analyst, Generalist , Noble Capital Markets, Inc.
Joshua Zoepfel, Research Associate, Noble Capital Markets, Inc.
Refer to the full report for the price target, fundamental analysis, and rating.
Contract. Last week, Bit Digital announced details regarding its first Bit Digital AI contract. Under the terms of the agreement, Bit Digital will supply the customer with computational power from 1,504 GPUs for a period of three years. The contract will commence January 2024 and represents more than $35 million of annualized revenue to Bit Digital.
Platform. To fulfill the contract, the Company placed a purchase order for servers manufactured by Super Micro Computer, Inc., an authorized Nvidia OEM, that are equipped with 1,504 Nvidia HGX H100 GPUs along with related equipment, which are expected to be delivered to the Company by January 2024.
Equity Research is available at no cost to Registered users of Channelchek. Not a Member? Click ‘Join’ to join the Channelchek Community. There is no cost to register, and we never collect credit card information.
This Company Sponsored Research is provided by Noble Capital Markets, Inc., a FINRA and S.E.C. registered broker-dealer (B/D).
*Analyst certification and important disclosures included in the full report. NOTE: investment decisions should not be based upon the content of this research summary. Proper due diligence is required before making any investment decision.
Joe Gomes, Managing Director, Equity Research Analyst, Generalist , Noble Capital Markets, Inc.
Joshua Zoepfel, Research Associate, Noble Capital Markets, Inc.
Refer to the full report for the price target, fundamental analysis, and rating.
Results. Bit Digital reported third quarter revenue of $11.6 million, up from $9.1 million last year and in-line with our estimate of $12 million. The Company recognized $11.3 million from bitcoin mining services and $244,780 in ETH staking services. Net loss for the quarter was $7.2 million, or a loss of $0.08 per share, versus the prior year’s net loss of $14.5 million, or $0.27. Adjusted EBITDA for the quarter was a negative $3.0 million versus a negative $4.6 million last year.
More Agreements. The Company finalized two new agreements with Soluna Computing and Dory Creek during the quarter, bringing 4.4 and 17.5 megawatts of hosting capacity, respectively. The agreements bring two new states to Bit Digital’s geographic portfolio in Kentucky and Texas, and offers the Company an increased geographic diversification. We expect more announcements to follow, with the Company having active discussions with other potential hosts.
Equity Research is available at no cost to Registered users of Channelchek. Not a Member? Click ‘Join’ to join the Channelchek Community. There is no cost to register, and we never collect credit card information.
This Company Sponsored Research is provided by Noble Capital Markets, Inc., a FINRA and S.E.C. registered broker-dealer (B/D).
*Analyst certification and important disclosures included in the full report. NOTE: investment decisions should not be based upon the content of this research summary. Proper due diligence is required before making any investment decision.
QuoteMedia is a leading software developer and cloud-based syndicator of financial market information and streaming financial data solutions to media, corporations, online brokerages, and financial services companies. The Company licenses interactive stock research tools such as streaming real-time quotes, market research, news, charting, option chains, filings, corporate financials, insider reports, market indices, portfolio management systems, and data feeds. QuoteMedia provides industry leading market data solutions and financial services for companies such as the Nasdaq Stock Exchange, TMX Group (TSX Stock Exchange), Canadian Securities Exchange (CSE), London Stock Exchange Group, FIS, U.S. Bank, Broadridge Financial Systems, JPMorgan Chase, CI Financial, Canaccord Genuity Corp., Hilltop Securities, HD Vest, Stockhouse, Zacks Investment Research, General Electric, Boeing, Bombardier, Telus International, Business Wire, PR Newswire, FolioFN, Regal Securities, ChoiceTrade, Cetera Financial Group, Dynamic Trend, Inc., Qtrade Financial, CNW Group, IA Private Wealth, Ally Invest, Inc., Suncor, Virtual Brokers, Leede Jones Gable, Firstrade Securities, Charles Schwab, First Financial, Cirano, Equisolve, Stock-Trak, Mergent, Cision, Day Trade Dash and others. Quotestream®, QModTM and Quotestream ConnectTM are trademarks of QuoteMedia. For more information, please visit www.quotemedia.com.
Michael Kupinski, Director of Research, Equity Research Analyst, Digital, Media & Technology , Noble Capital Markets, Inc.
Jacob Mutchler, Research Associate, Noble Capital Markets, Inc.
Refer to the full report for the price target, fundamental analysis, and rating.
Solid Q3 results. The company reported Q3 revenue of $4.7 million, which was in-line with our estimate of $4.8 million and adj. EBITDA of $719,547, which was modestly below our estimate of $849,000, illustrated in Figure #1 Q3 Results. The slight adj. EBITDA miss was attributed to revenue mix and slightly higher than expected operating expenses. Notably, revenue and adj. EBITDA increased by 8.5% and 7.3%, respectively, from the prior year period.
Interactive Growth. The company’s interactive business had a strong quarter as revenue increased 16% from the prior year period, and does not include deferred revenue which increased 76% over the same period. Management attributed the favorable increase in revenue to large contracts that were recently signed. The company remains focused on signing larger clients, and has increased its headcount in its sales and marketing departments to support that goal.
Equity Research is available at no cost to Registered users of Channelchek. Not a Member? Click ‘Join’ to join the Channelchek Community. There is no cost to register, and we never collect credit card information.
This Company Sponsored Research is provided by Noble Capital Markets, Inc., a FINRA and S.E.C. registered broker-dealer (B/D).
*Analyst certification and important disclosures included in the full report. NOTE: investment decisions should not be based upon the content of this research summary. Proper due diligence is required before making any investment decision.
Company Secures Preferred Vendor Status for Bitcoin ATM Services to AATAC’s 50,000 Members
ATLANTA, Nov. 14, 2023 (GLOBE NEWSWIRE) — Bitcoin Depot Inc. (“Bitcoin Depot” or the “Company”) (NASDAQ: BTM), a U.S.-based Bitcoin ATM operator and leading fintech company, today announced it has been named a preferred vendor with the AATAC, a national trade association of retailers, distributors, vendor suppliers and partners for the convenience store and retail industries. Bitcoin Depot is the first BTM company to have gained recognition as a preferred vendor for AATAC, strengthening Bitcoin Depot’s value proposition.
“Bitcoin Depot is proud to work with the AATAC as the association’s preferred BTM vendor, which introduces our company to AATAC’s 50,000 associated retailers nationwide,” said Bitcoin Depot CEO Brandon Mintz. “This is another milestone in our mission to bring Bitcoin to the masses.”
Bitcoin Depot is listed as a preferred ATM & Credit vendor on the AATAC website. The Company attended an AATAC trade show this year to meet with AATAC customers and members.
“We are thrilled to offer Bitcoin Depot’s services for our members,” said Ivy LaBrie, Operations Director at AATAC. “Our network of retailers represents an incomparable buying power, and we’re proud to connect them with quality, trusted companies such as Bitcoin Depot that will expand their service offerings.”
AATAC is a national association comprised of smaller buying groups, regional sub-chapters, independents, and other trade organizations under one blanket that consist of over 50,000 operators controlling over 80,000 locations across the U.S. and Puerto Rico. Currently, there are approximately 150,000 AATAC-associated C-stores in the country.
About Bitcoin Depot Bitcoin Depot Inc. (Nasdaq: BTM) was founded in 2016 with the mission to connect those who prefer to use cash to the broader, digital financial system. Bitcoin Depot provides its users with simple, efficient and intuitive means of converting cash into Bitcoin, which users can deploy in the payments, spending and investing space. Users can convert cash to Bitcoin at Bitcoin Depot’s kiosks and at thousands of name-brand retail locations through its BDCheckout product. The Company has the largest market share in North America with approximately 6,400 kiosk locations as of September 30, 2023. Learn more at www.bitcoindepot.com
About AATAC AATAC is a national association comprised of smaller buying groups, regional sub-chapters, independents, and other trade organizations under one blanket that consist of over 50,000 operators controlling over 80,000 locations across the U.S. and Puerto Rico.
Contacts:
Investors Cody Slach, Alex Kovtun Gateway Group, Inc. 949-574-3860 BTM@gateway-grp.com
Media Zach Kadletz, Brenlyn Motlagh, Ryan Deloney Gateway Group, Inc. 949-574-3860 BTM@gateway-grp.com
Michael Kupinski, Director of Research, Equity Research Analyst, Digital, Media & Technology , Noble Capital Markets, Inc.
Jacob Mutchler, Research Associate, Noble Capital Markets, Inc.
Refer to the full report for the price target, fundamental analysis, and rating.
Solid Q3 Results. The company reported Q3 revenue of $179.5 million, up 2.7% from the prior year period, and adj. EBITDA of $13.9 million, up an impressive 21.1% year-over-year. While Q3 revenue was 5.7% below our estimate of $190.3 million and Adj. EBITDA was 4.9% lower than our estimate of $14.7 million, we view the results and company outlook favorably.
2024 Outlook. The company is focused on striking additional partnerships to deploy its approximately 1000 kiosks that are currently warehoused. We anticipate the number of kiosks will gradually increase over Q4 and 2024, a development we believe will have a favorable impact on operating results.
Equity Research is available at no cost to Registered users of Channelchek. Not a Member? Click ‘Join’ to join the Channelchek Community. There is no cost to register, and we never collect credit card information.
This Company Sponsored Research is provided by Noble Capital Markets, Inc., a FINRA and S.E.C. registered broker-dealer (B/D).
*Analyst certification and important disclosures included in the full report. NOTE: investment decisions should not be based upon the content of this research summary. Proper due diligence is required before making any investment decision.
Net Income of $1.1 Million, Down 68% Year-over-Year
Adjusted EBITDA (non-GAAP) of $13.9 Million, Up 21% Year-over-Year
Reiterates Full Year 2023 Guidance for Revenue and Adjusted EBITDA
ATLANTA, Nov. 13, 2023 (GLOBE NEWSWIRE) — Bitcoin Depot Inc. (“Bitcoin Depot” or the “Company”), a U.S.-based Bitcoin ATM operator and leading fintech company, today reported financial results for the third quarter ended September 30, 2023. Bitcoin Depot will host a conference call and webcast at 11:00 a.m. ET today. An earnings presentation and link to the webcast will be made available at ir.bitcoindepot.com.
“Our results this quarter continue to demonstrate the strength of our business model and how we’re able to deliver strong results irrespective of the market environment or price of Bitcoin,” said Brandon Mintz, CEO and Founder of Bitcoin Depot. “We’ve made significant progress in advancing our growth strategy and this quarter we continued to fortify our industry-leading position with sustained strength in customer traffic and transaction volume. We remain well-positioned to capitalize on potential expansion opportunities to become the most trusted, quickest and most efficient way to purchase Bitcoin with cash across the largest network of retail locations possible.”
Third Quarter 2023 Financial Results
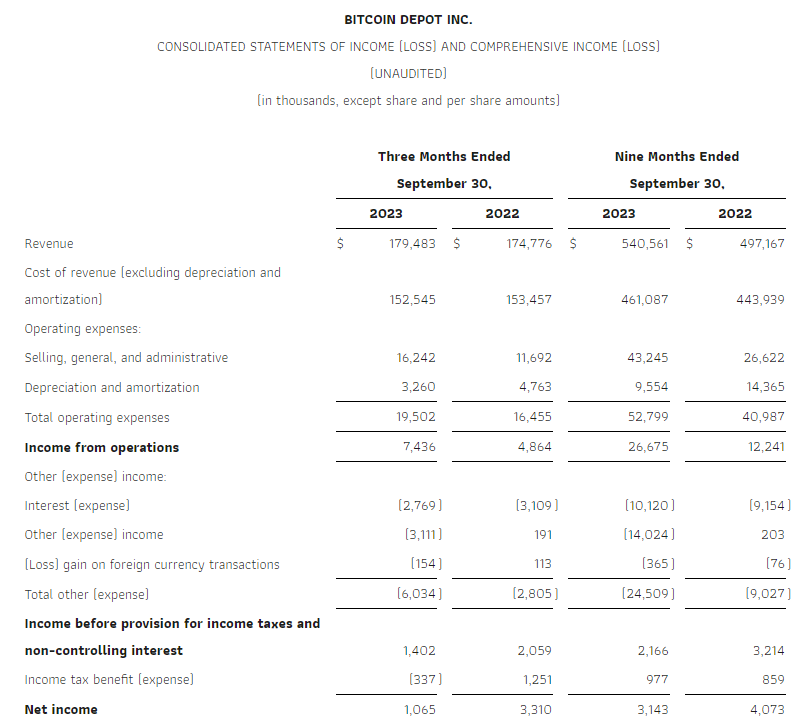
Revenue in the third quarter of 2023 was $179.5 million, up 3% from $174.8 million for the third quarter of 2022.
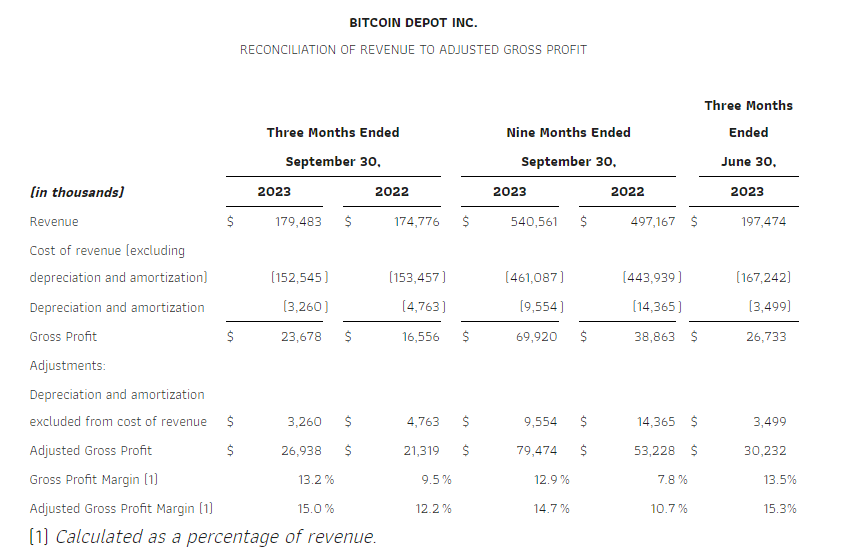
Adjusted Gross Profit, a non-GAAP measure, in the third quarter of 2023 was $26.9 million, up 26% from $21.3 million for the third quarter of 2022. Adjusted Gross Profit margin (non-GAAP) in the third quarter of 2023 was 15.0% compared to 12.2% in the third quarter of 2022.
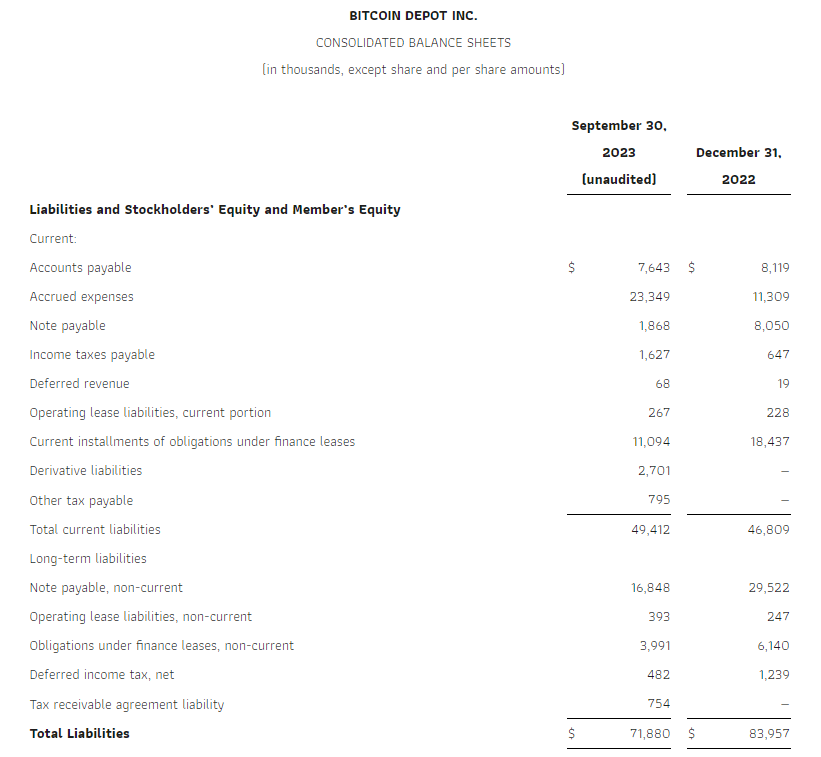
Total operating expenses were $19.5 million for the third quarter of 2023, compared to $16.5 million for the third quarter of 2022.
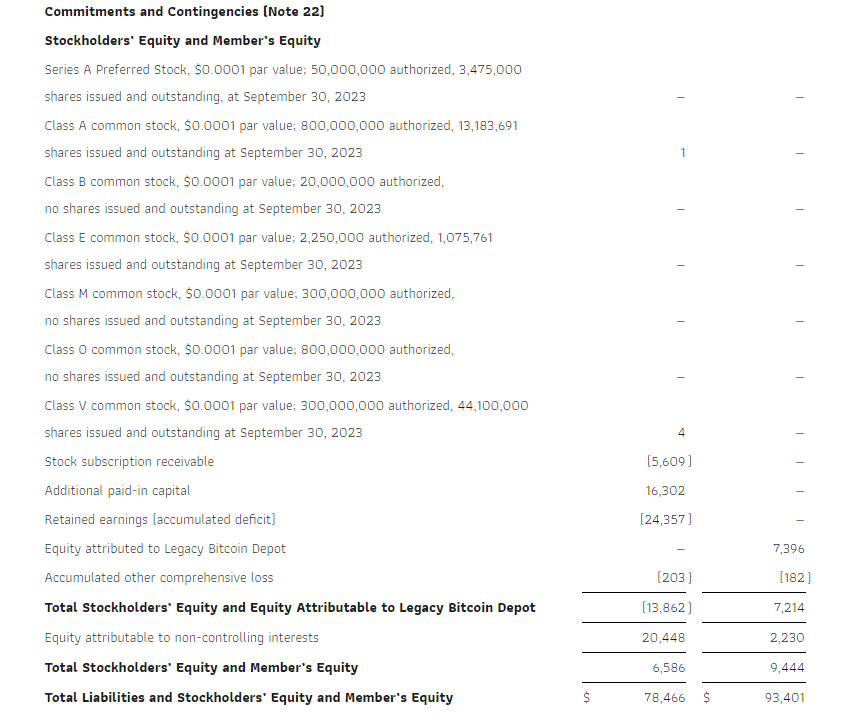
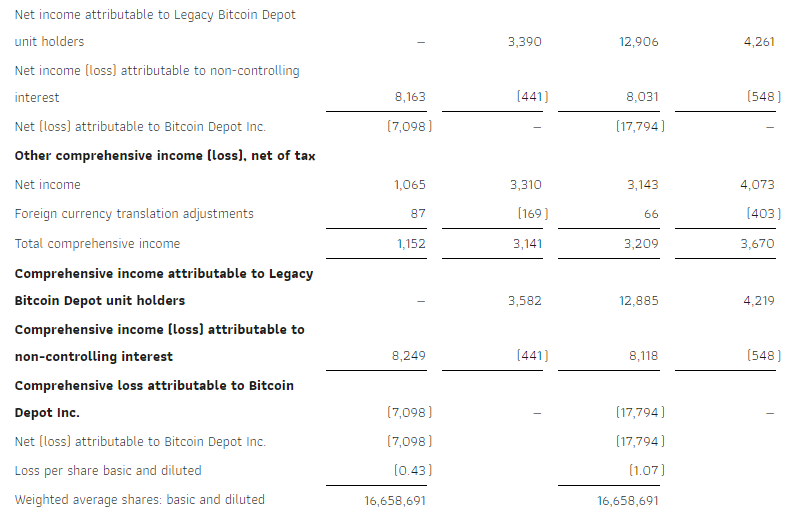
Net income for the third quarter of 2023 was $1.1 million, compared to a net income of $3.3 million for the third quarter of 2022 and a net loss of $4.0 million for the second quarter of 2023.
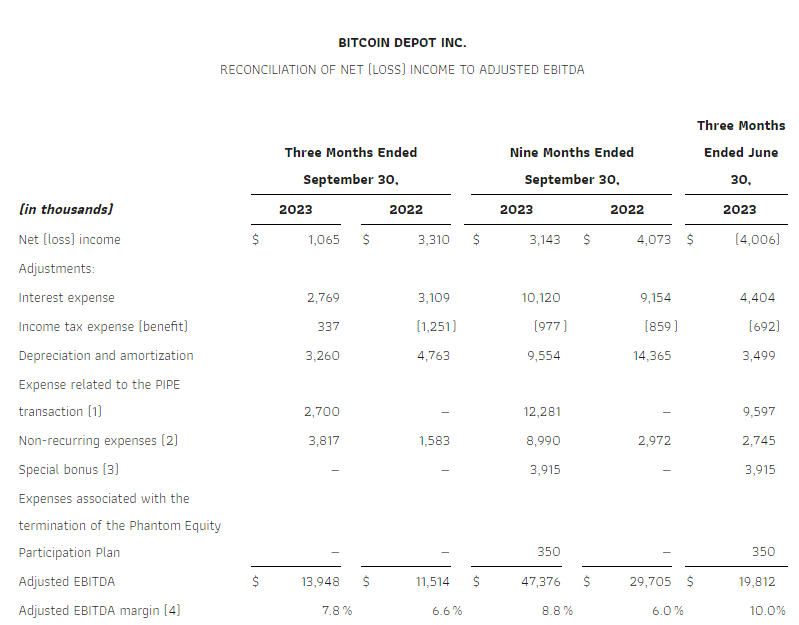
Adjusted EBITDA, a non-GAAP measure, in the third quarter of 2023 was $13.9 million, up 21% from the third quarter of 2022. Please see “Explanation and Reconciliation of Non-GAAP Financial Measures” below.
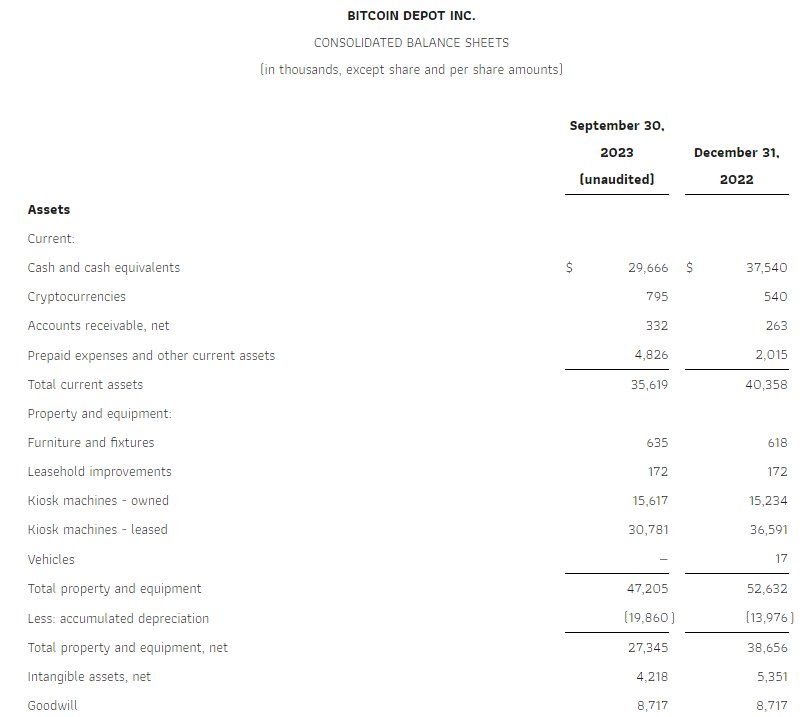
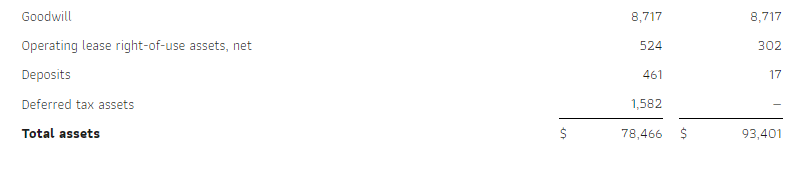
Cash and cash equivalents were $29.7 million as of the end of the third quarter of 2023.
Recent Business Highlights
Amended existing PIPE Agreement dated June 23, 2023 (the “PIPE Agreement”) to accelerate the five remaining Reference Periods (as defined in the PIPE Agreement) and set the Settlement Price (as defined in the PIPE Agreement) in connection with the consummation of the proposed private sale by the Subscribers of 3,475,000 shares of Series A Convertible Preferred Stock of the Company to certain third parties.
Announced a share repurchase program pursuant to which Bitcoin Depot is authorized to repurchase up to $10 million of its outstanding Class A common stock through June 30, 2024.
Expanded BDCheckout program into 400 new locations across Iowa and Louisiana through an ongoing partnership with a leading global payments technology company with a nationwide retail network. BDCheckout is now available at 246 total locations in Iowa across a variety of convenience store partners such as Kum & Go, Kwik Trip and Pilot Travel Centers. BDCheckout is also expanding into 166 locations in Louisiana.
Signed an exclusive retail partnership with Jacksons Food Stores, a nationally recognized chain of more than 300 convenience stores.
Hired a new Chief Technology Officer to lead software development efforts.
Guidance
Based on current market conditions, Bitcoin Depot expects consolidated revenue in 2023 to range between $700 million and $730 million, an 8% to 13% improvement compared to $647 million in 2022. Bitcoin Depot expects Adjusted EBITDA (non-GAAP) in 2023 to range between $56 million and $59 million compared to 2022 when Bitcoin Depot generated net income of $3.5 million and Adjusted EBITDA of $41 million, representing a 37% to 44% year-over-year increase in Adjusted EBITDA. For important disclosures about Adjusted EBITDA, see “Explanation and Reconciliation of Non-GAAP Financial Measures” below.
Conference Call
Bitcoin Depot will hold a conference call at 11:00 a.m., Eastern time (8:00 a.m. Pacific time), today to discuss its financial results for the third quarter ended September 30, 2023.
Call Date: Monday, November 13, 2023 Time: 11:00 a.m. Eastern time (8:00 a.m. Pacific time) U.S. dial-in: 646-307-1963 International dial-in: 800-715-9871 Conference ID: 8247570
The conference call will broadcast live and be available for replay here following the call.
Please call the conference telephone number approximately 10 minutes before the start time. An operator will register your name and organization. If you have any difficulty connecting with the conference call, please contact Bitcoin Depot’s investor relations team at 1-949-574-3860.
A replay of the call will be available beginning after 3:00 p.m. Eastern time on November 13, 2023 through November 20, 2023.
U.S. replay number: 609-800-9909 International replay number: 800-770-2030 Conference ID: 8247570
About Bitcoin Depot
Bitcoin Depot Inc. (Nasdaq: BTM) was founded in 2016 with the mission to connect those who prefer to use cash to the broader, digital financial system. Bitcoin Depot provides its users with simple, efficient and intuitive means of converting cash into Bitcoin, which users can deploy in the payments, spending and investing space. Users can convert cash to Bitcoin at Bitcoin Depot’s kiosks and at thousands of name-brand retail locations through its BDCheckout product. The Company has the largest market share in North America with approximately 6,400 kiosk locations as of September 30, 2023. Learn more at www.bitcoindepot.com.
This press release and any oral statements made in connection herewith include “forward-looking statements” within the meaning of Section 27A of the Securities Act of 1933, as amended, and Section 21E of the Exchange Act of 1934, as amended. Forward-looking statements are any statements other than statements of historical fact, and include, but are not limited to, statements regarding the expectations of plans, business strategies, objectives and growth and anticipated financial and operational performance, including our growth strategy and ability to increase deployment of our products and services, our ability to strengthen our financial profile, worldwide growth in the adoption and use of cryptocurrencies, and our guidance regarding our generation of revenue and Adjusted EBITDA for 2023. These forward-looking statements are based on management’s current beliefs, based on currently available information, as to the outcome and timing of future events. Forward-looking statements are often identified by words such as “anticipate,” “appears,” “approximately,” “believe,” “continue,” “could,” “designed,” “effect,” “estimate,” “evaluate,” “expect,” “forecast,” “goal,” “initiative,” “intend,” “may,” “objective,” “outlook,” “plan,” “potential,” “priorities,” “project,” “pursue,” “seek,” “should,” “target,” “when,” “will,” “would,” or the negative of any of those words or similar expressions that predict or indicate future events or trends or that are not statements of historical matters, although not all forward-looking statements contain such identifying words. In making these statements, we rely upon assumptions and analysis based on our experience and perception of historical trends, current conditions, and expected future developments, as well as other factors we consider appropriate under the circumstances. We believe these judgments are reasonable, but these statements are not guarantees of any future events or financial results. These forward-looking statements are provided for illustrative purposes only and are not intended to serve as, and must not be relied on by any investor as, a guarantee, an assurance, a prediction or a definitive statement of fact or probability. Actual events and circumstances are difficult or impossible to predict and will differ from assumptions. Many actual events and circumstances are beyond our control.
These forward-looking statements are subject to a number of risks and uncertainties, including changes in domestic and foreign business, market, financial, political and legal conditions; failure to realize the anticipated benefits of the business combination; risks relating to the uncertainty of our projected financial information; future global, regional or local economic and market conditions; the development, effects and enforcement of laws and regulations; our ability to manage future growth; our ability to develop new products and services, bring them to market in a timely manner and make enhancements to our platform; the effects of competition on our future business; our ability to issue equity or equity-linked securities; the outcome of any potential litigation, government and regulatory proceedings, investigations and inquiries; and those factors described or referenced in filings with the Securities and Exchange Commission. If any of these risks materialize or our assumptions prove incorrect, actual results could differ materially from the results implied by these forward-looking statements. There may be additional risks that we do not presently know or that we currently believe are immaterial that could also cause actual results to differ from those contained in the forward-looking statements. In addition, forward-looking statements reflect our expectations, plans or forecasts of future events and views as of the date of this press release. We anticipate that subsequent events and developments will cause our assessments to change.
We caution readers not to place undue reliance on forward-looking statements. Forward-looking statements speak only as of the date they are made, and we undertake no obligation to update publicly or otherwise revise any forward-looking statements, whether as a result of new information, future events, or other factors that affect the subject of these statements, except where we are expressly required to do so by law. All written and oral forward-looking statements attributable to us are expressly qualified in their entirety by this cautionary statement.
Explanation and Reconciliation of Non-GAAP Financial Measures
Bitcoin Depot reports its financial results in accordance with accounting principles generally accepted in the United States of America (“GAAP”). This press release includes both historical and projected Adjusted EBITDA, Adjusted Gross Profit, and certain ratios and other metrics derived therefrom such as Adjusted EBITDA margin and Adjusted Gross Profit margin, which are not prepared in accordance with GAAP.
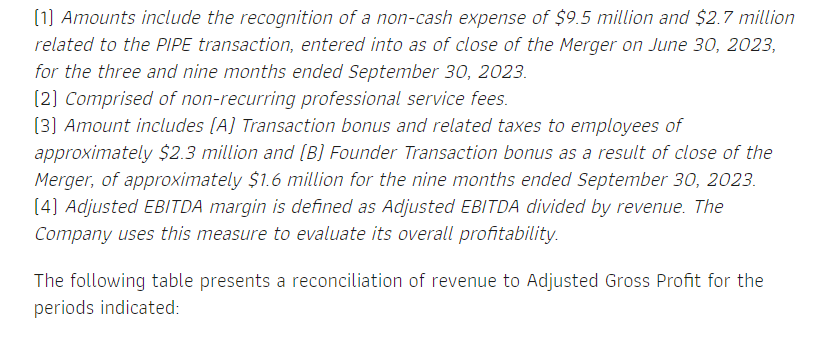
Bitcoin Depot defines Adjusted EBITDA as net income before interest expense, income tax expense, depreciation and amortization, non-recurring expenses, stock-based compensation, expenses related to the PIPE financing and miscellaneous cost adjustments. Such items are excluded from Adjusted EBITDA because these items are non-cash in nature, or because the amount and timing of these items is unpredictable, not driven by core results of operations and renders comparisons with prior periods and competitors less meaningful. In addition, Bitcoin Depot defines Adjusted Gross Profit (a non-GAAP financial measure) as revenue less cost of revenue (excluding depreciation and amortization) and depreciation and amortization adjusted to add back depreciation and amortization. Bitcoin Depot believes Adjusted EBITDA and Adjusted Gross Profit each provide useful information to investors and others in understanding and evaluating Bitcoin Depot’s results of operations, as well as provide a useful measure for period-to-period comparisons of Bitcoin Depot’s business performance. Adjusted EBITDA and Adjusted Gross Profit are each key measurements used internally by management to make operating decisions, including those related to operating expenses, evaluate performance and perform strategic and financial planning. However, you should be aware that Adjusted EBITDA and Adjusted Gross Profit are not measures of financial performance calculated in accordance with GAAP and may exclude items that are significant in understanding and assessing Bitcoin Depot’s financial results, and further, that Bitcoin Depot may incur future expenses similar to those excluded when calculating these measures. Bitcoin Depot primarily relies on GAAP results and uses both Adjusted EBITDA and Adjusted Gross Profit on a supplemental basis. Neither Adjusted EBITDA or Adjusted Gross Profit should be considered in isolation from, or as an alternative to, net income, cash flows from operations or other measures of profitability, liquidity or performance under GAAP and may not be indicative of Bitcoin Depot’s historical or future operating results. Bitcoin Depot’s computation of both Adjusted EBITDA and Adjusted Gross Profit may not be comparable to other similarly titled measures computed by other companies because not all companies calculate such measures in the same fashion. As such, undue reliance should not be placed on such measures.
Due to the high variability and difficulty in making accurate forecasts and projections of some of the information excluded from the projections of Adjusted EBITDA, together with some of the excluded information not being ascertainable or accessible, Bitcoin Depot is unable to quantify certain amounts that would be required to be included in the most directly comparable GAAP financial measures without unreasonable effort. Consequently, no disclosure of estimated comparable GAAP measures is included and no reconciliation of the forward-looking non-GAAP financial measures is included.
The following table presents a reconciliation of revenue to Adjusted EBITDA for the periods indicated:
Contacts:
Investors Cody Slach, Alex Kovtun Gateway Group, Inc. 949-574-3860 BTM@gateway-grp.com
Media Zach Kadletz, Brenlyn Motlagh, Ryan Deloney Gateway Group, Inc. 949-574-3860 BTM@gateway-grp.com
ATLANTA, Nov. 09, 2023 (GLOBE NEWSWIRE) — Bitcoin Depot Inc. (“Bitcoin Depot” or the “Company”) (NASDAQ: BTM), a U.S.-based Bitcoin ATM operator and leading fintech company, today announced its partnership with CORD Financial Services, LLC (CORD), a leading provider of innovative ATM solutions, to distribute Bitcoin Depot kiosks across the U.S.
CORD and Bitcoin Depot will secure Bitcoin ATM placements within CORD’s established base of customers and to customers new to CORD. In addition to now offering Bitcoin ATM services, CORD is a leader in the ATM Services Business, offering full-service ATM placements, cash management, transaction processing, merchant services, ATM equipment, sales, and 24/7 customer and technical support.
“This partnership will allow Bitcoin Depot to expand our retail locations while leveraging CORD’s expertise and customer relationships in the ATM industry,” said Bitcoin Depot CEO Brandon Mintz. “CORD has an impressive history of reliable ATM services and a demonstrated mastery of the conventional ATM space. We look forward to leveraging their relationship network and brand awareness to drive additional placement opportunities for our business.”
“Our mission is to deliver comprehensive ATM business solutions with the highest value and professional integrity,” said CORD Financial President Kenneth Gilbert. “Bitcoin Depot is the ideal partner to advance that objective, and we look forward to bringing a financial technology-driven Bitcoin ATM solution to our customer base.”
The combination of CORD’s robust infrastructure and network positions them as a fitting partner for distributing Bitcoin Depot’s state-of-the-art Bitcoin ATMs to the market, broadening Bitcoin Depot’s mission of bringing Bitcoin to the masses.
About Bitcoin Depot Bitcoin Depot (Nasdaq: BTM) was founded in 2016 with the mission to connect those who prefer to use cash to the broader, digital financial system. Bitcoin Depot provides its users with simple, efficient and intuitive means of converting cash into Bitcoin, which users can deploy in the payments, spending and investing space. Users can convert cash to Bitcoin at Bitcoin Depot’s kiosks and at thousands of name-brand retail locations in 48 U.S. states through its BDCheckout product. The Company has the largest market share in North America with approximately 6,400 kiosk locations as of June 30, 2023. Learn more at www.bitcoindepot.com.
About Cord Financial: CORD Financial Services is a leading provider of innovative ATM solutions, products, and services that support merchants with responsive, knowledgeable, and caring people. CORD offers full -service ATM placements, cash management, ATM transaction processing, ATM equipment sales, ATM parts, and outstanding 24/7 customer and technical support.
Contacts:
Investors Cody Slach, Alex Kovtun Gateway Group, Inc. 949-574-3860 BTM@gateway-grp.com
Media Zach Kadletz, Brenlyn Motlagh, Ryan Deloney Gateway Group, Inc. 949-574-3860 BTM@gateway-grp.com
Joe Gomes, Managing Director, Equity Research Analyst, Generalist , Noble Capital Markets, Inc.
Joshua Zoepfel, Research Associate, Noble Capital Markets, Inc.
Refer to the full report for the price target, fundamental analysis, and rating.
Mining Slightly Down. Bit Digital produced 111.6 BTC during the month, a 14% decrease from last month due to an increase in network difficulty, a power utility mandated maintenance outage that temporarily reduced operating hash rate at one location, and the relocation of miners from one hosting location following the conclusion of that hosting agreement. The Company had an active hash rate of 2.0 EH/s compared to 1.19 EH/s last month.
Staking Side. The Company had approximately 12,752 ETH actively staked in native and liquid staking protocols as of October 31, 2023, with 12,352 ETH natively staked and 400 ETH deployed in liquid staking protocols. Bit Digital earned a blended APY of approximately 4.25% on its staked ETH position for the month compared to roughly 4.1% last month, and earned aggregate staking rewards of approximately 46.08 ETH.
Equity Research is available at no cost to Registered users of Channelchek. Not a Member? Click ‘Join’ to join the Channelchek Community. There is no cost to register, and we never collect credit card information.
This Company Sponsored Research is provided by Noble Capital Markets, Inc., a FINRA and S.E.C. registered broker-dealer (B/D).
*Analyst certification and important disclosures included in the full report. NOTE: investment decisions should not be based upon the content of this research summary. Proper due diligence is required before making any investment decision.
ATLANTA, Oct. 30, 2023 (GLOBE NEWSWIRE) — Bitcoin Depot Inc. (“Bitcoin Depot” or the “Company”), a U.S.-based Bitcoin ATM operator and leading fintech company, will hold a conference call and live audio webcast on Monday, November 13th at 11:00 a.m. Eastern time (8:00 a.m. Pacific Time) to discuss its financial results for the third quarter ended September 30, 2023. Bitcoin Depot plans to release results before the market open on the same day.
Call Date: Monday, November 13, 2023 Time: 11:00 a.m. Eastern time (8:00 a.m. Pacific time) U.S. dial-in: 646-307-1963 International dial-in: 800-715-9871 Conference ID: 8247570
The conference call will broadcast live and be available for replay here following the call.
Please call the conference telephone number approximately 10 minutes before the start time. An operator will register your name and organization. If you have any difficulty connecting with the conference call, please contact Bitcoin Depot’s investor relations team at 1-949-574-3860.
A replay of the call will be available beginning after 3:00 p.m. Eastern time on November 13, 2023 through November 20, 2023.
U.S. replay number: 609-800-9909 International replay number: 800-770-2030 Conference ID: 8247570
About Bitcoin Depot Bitcoin Depot Inc. (Nasdaq: BTM) was founded in 2016 with the mission to connect those who prefer to use cash to the broader, digital financial system. Bitcoin Depot provides its users with simple, efficient and intuitive means of converting cash into Bitcoin, which users can deploy in the payments, spending and investing space. Users can convert cash to Bitcoin at Bitcoin Depot’s kiosks and at thousands of name-brand retail locations through its BDCheckout product. The Company has the largest market share in North America with approximately 6,400 kiosk locations as of June 30, 2023. Learn more at www.bitcoindepot.com.
Contacts:
Investors Cody Slach, Alex Kovtun Gateway Group, Inc. 949-574-3860 BTM@gateway-grp.com
Media Zach Kadletz, Brenlyn Motlagh, Ryan Deloney Gateway Group, Inc. 949-574-3860 BTM@gateway-grp.com
Joe Gomes, Managing Director, Equity Research Analyst, Generalist , Noble Capital Markets, Inc.
Joshua Zoepfel, Research Associate, Noble Capital Markets, Inc.
Refer to the full report for the price target, fundamental analysis, and rating.
Business Diversification. Bit Digital is launching a new AI-focused business, Bit Digital AI, that will provide specialized infrastructure to support generative artificial intelligence (AI) workstreams. The new business materially diversifies Bit Digital’s revenue sources with a goal of providing a non-correlated income stream to help offset potential downturns in the core bitcoin mining and ETH staking business.
A Customer Contract. Bit Digital has entered into a binding term sheet with a customer to support their GPU-accelerated workloads. Bit Digital will provide the customer with rental services for a minimum of 1,024 GPUs and a maximum of 4,096 GPUs. The total number of GPUs, contract length, and corresponding unit pricing will be determined upon signing of the master service agreement.
Equity Research is available at no cost to Registered users of Channelchek. Not a Member? Click ‘Join’ to join the Channelchek Community. There is no cost to register, and we never collect credit card information.
This Company Sponsored Research is provided by Noble Capital Markets, Inc., a FINRA and S.E.C. registered broker-dealer (B/D).
*Analyst certification and important disclosures included in the full report. NOTE: investment decisions should not be based upon the content of this research summary. Proper due diligence is required before making any investment decision.
PHOENIX, Oct. 16, 2023 (GLOBE NEWSWIRE) — QuoteMedia, Inc. (OTCQB: QMCI), a leading provider of market data and financial applications, announced an agreement with Stirlingshire Investments.
Stirlingshire is an exciting market disruptor with a groundbreaking Hybrid Broker-Dealer framework that brings together the most advantageous aspects of the Full-Service Broker-Dealer and Discount Broker-Dealer models, while removing their limitations. By utilizing technology, Stirlingshire is able to dramatically reduce overhead and liability, while tying compensation much closer to performance. The result? A revolutionized industry that is Better for Clients, Better for Advisors.
Pursuant to the agreement QuoteMedia will be incorporating Quotestream® Trader, QuoteMedia’s streaming data application complete with trade integration, into Stirlingshire’s innovative trading platform. This allows Stirlingshire’s network of broker representatives and their retail clients to access real time market data, as well as comprehensive news, research, charting and analysis as part of their trading experience.
“Stirlingshire is dedicated to innovation, and QuoteMedia’s leading edge offerings are a perfect fit with our goals,” said Steven Woods, Stirlingshire’s Founder & CEO. “Our clientele quite justifiably expects best-in-class products and services from us, and the platform is receiving rave reviews. QuoteMedia’s applications and delivery technologies provide up-to-the-second market data and research information, and ensure our correspondent brokers and their customers are able to identify and capitalize on great investment opportunities.”
The partnership is a significant opportunity for QuoteMedia as well, according to QuoteMedia, Ltd. CEO Dave Shworan.
“Stirlingshire’s approach is truly innovative, and they are enjoying tremendous early success and growth,” said Shworan. “We are thrilled that they have chosen to incorporate our data and technology solutions, and that we can join them as they revolutionize the brokerage and investment industry. We look forward to a long and exciting partnership.”
About QuoteMedia
QuoteMedia is a leading software developer and cloud-based syndicator of financial market information and streaming financial data solutions to media, corporations, online brokerages, and financial services companies. The Company licenses interactive stock research tools such as streaming real-time quotes, market research, news, charting, option chains, filings, corporate financials, insider reports, market indices, portfolio management systems, and data feeds. QuoteMedia provides industry leading market data solutions and financial services for companies such as the Nasdaq Stock Exchange, TMX Group (TSX Stock Exchange), Canadian Securities Exchange (CSE), London Stock Exchange Group, FIS, U.S. Bank, Bank of Montreal (BMO), Broadridge Financial Systems, JPMorgan Chase, Scotiabank, CI Financial, Canaccord Genuity Corp., Hilltop Securities, Avantax, Stockhouse, Zacks Investment Research, General Electric, Boeing, Bombardier, Telus International, Business Wire, PR Newswire, The Goldman Sachs Group, Regal Securities, ChoiceTrade, Cetera Financial Group, Dynamic Trend, Inc., Credential Qtrade Securities, CNW Group, iA Private Wealth, Ally Invest, Inc., Suncor, Leede Jones Gable, Firstrade Securities, Charles Schwab, First Financial, Equisolve, Stock-Trak, Mergent, Cision and others. Quotestream®, QMod™ and Quotestream Connect™ are trademarks of QuoteMedia. For more information, please visit www.quotemedia.com .