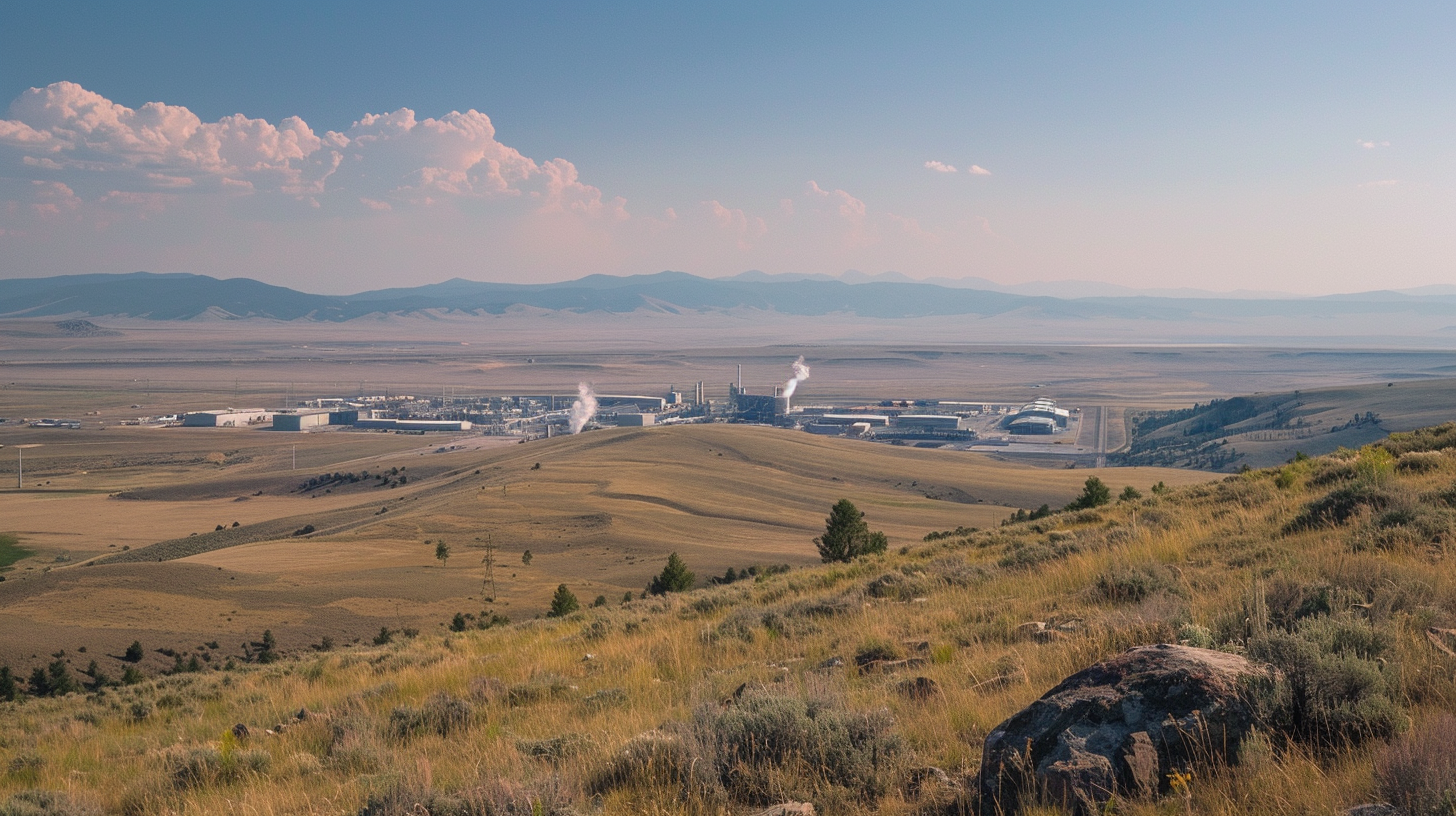
Endeavor Energy Partners, the top privately-held oil and gas producer in the prolific Permian Basin of west Texas and New Mexico, is considering a sale that could value the company at an astonishing $25-30 billion, according to a recent Reuters exclusive.
The news comes fresh off the heels of some absolutely massive M&A action among public oil independents, with the $60 billion tie-up between ExxonMobil and Pioneer Natural Resources followed by Chevron announcing the $50+ billion purchase of Hess Corp. Now the private players are looking to capitalize on the consolidation wave by monetizing their substantial acreage as well.
Driving the potential multi-billion dollar valuation is Endeavor’s premier 350,000 net acre position in the coveted Midland sub-basin, the sweet spot of the larger Permian. With oil prices still hovering near $80 per barrel despite recession fears, there remain plenty of companies willing to pay up for high-quality acreage that can drive efficient growth for years to come. And Endeavor’s assets definitely check those boxes.
The Visionary Behind Endeavor’s Rise
Endeavor traces its roots back 45 years when Texas oilman Autry Stephens founded the small independent. The 85-year old Stephens grew the company through shrewd acreage acquisitions and by managing costs tightly with vertically integrated services businesses.
Now with retirement on the horizon, Stephens has apparently decided that the time is right to capitalize on the current market enthusiasm and secure his life’s work’s future by selling Endeavor to one of the large public independents like an Exxon or Chevron. Certainly Stephens’ estate and early investors would realize a tremendous windfall from such a deal.
While Endeavor has reportedly considered offers before, this time the process seems to be progressing firmly with investment bankers at JP Morgan already preparing marketing materials for potential buyers. So while there’s no guarantee that Endeavor finds a buyer or completes a sale, things have moved beyond the tire-kicking stage.
Ripe for the Picking by “Big oil”
As mentioned previously, Endeavor’s footprint in the core of the Permian Basin makes the company a logical target for any number of deep-pocketed suitors from major integrateds to large E&Ps looking to expand their presence.
And most of the likeliest buyers like Exxon, Chevron, and ConocoPhillips have all recently pulled off huge, multi-billion dollar deals to consolidate acreage while still leaving their balance sheets relatively unscathed. Using their equity and maintaining strong investment grade credit ratings remains paramount for the majors.
For example, Chevron structured its takeover of Hess Corp such that the $50 billion price tag amounted to less than half of its current cash position. So the company would have no issues stepping up to buy another large, complementary Permian pure-play.
Of course Exxon is in the same boat having expertly engineered the Pioneer acquisition to be immediately accretive to earnings and cash flow. So whileAbsorbing all of Endeavor’s 350k acres might be a bridge too far for XOM, the supermajor could easily swallow a chunk of the company or join a consortium.
Not to be outdone, ConocoPhillips recently closed its buyout of existing partner Lime Rock’s 50% stake in the Canadian Surmont oil sands project proving its appetite for sizable deals remains healthy. CEO Ryan Lance has also been vocal about wanting to bulk up the company’s Permianpresence over the long term giving it both the strategic rationale and financial means to pursue Endeavor.
Each of these independent E&Ps seem well suited to provide a soft landing for founder Autry Stephens’ life work. Endeavor has quietly built up a world class asset base that now looks poised to fetch an exceptional valuation and secure a new, well-heeled owner. So investors will be following the sales process closely as a potential deal would recalibrate the consolidation environment. Of course, we will have to wait and see what 2024 ultimately has in store for one of the Permian’s great growth stories.
In a strategic move to bolster its presence in the prolific Permian Basin, Occidental Petroleum has reached an agreement to acquire CrownRock for a staggering $12 billion. This significant deal, part of a broader consolidation trend in the U.S. energy sector, positions Occidental to fortify its standing as the ninth-largest energy company in the U.S.
CrownRock, a major privately held energy producer operating in the Permian Basin, is currently developing a 100,000-acre position in the Midland Basin, a crucial segment spanning 20 counties in western Texas. The Midland Basin, contributing 15% of U.S. crude production in 2020, is a key focus for Occidental’s goal to increase its scale in the Permian.
The transaction is set to add a substantial 170,000 barrels of oil equivalent per day to Occidental’s production capabilities. Furthermore, with 1,700 undeveloped locations in the Permian, the deal positions Occidental for strategic expansion in a region vital to the nation’s energy landscape.
To finance this significant acquisition, Occidental plans to issue $9.1 billion in new debt, complemented by approximately $1.7 billion in common stock. Despite these financial obligations, Occidental remains committed to its goal of reducing its overall debt to below $15 billion, showcasing confidence in the long-term benefits of the CrownRock acquisition.
Occidental’s CEO, Vicki Hollub, emphasized the company’s dedication to managing its financial commitments. Despite a 10% drop in Occidental’s stock year-to-date, the acquisition of CrownRock marks the third major deal in the energy sector within a span of two months, highlighting Occidental’s determination to adapt and grow in a rapidly evolving industry.
Berkshire Hathaway, a major holder with about 26% of Occidental’s shares, was not involved in this particular deal. Occidental’s ticker symbol is OXY, and the company anticipates finalizing the CrownRock acquisition in the first quarter of 2024, adding another chapter to its dynamic expansion strategy.
This acquisition is a pivotal moment for Occidental Petroleum as it continues to navigate the evolving energy landscape, strategically positioning itself for future success in the Permian Basin.
Occidental Petroleum Corporation (NYSE: OXY), commonly known as Occidental, has a storied history dating back to its founding in 1920. Established in California, the company evolved from a small oil production venture into one of the largest independent oil and gas exploration and production companies globally. Over the years, Occidental has played a pivotal role in the energy industry, engaging in diverse operations such as oil and gas exploration, production, refining, and marketing. Known for its innovative technologies and strategic acquisitions, Occidental has expanded its reach across the Americas, the Middle East, and North Africa. The company’s commitment to responsible and sustainable energy practices aligns with its pursuit of operational excellence. As the ninth-largest energy company in the U.S., Occidental continues to navigate the dynamic energy landscape, adapting to industry trends and solidifying its position through strategic acquisitions, such as the recent $12 billion CrownRock deal, which reflects its dedication to growth and resilience in an ever-evolving market.
Alvopetro Energy Ltd.’s vision is to become a leading independent upstream and midstream operator in Brazil. Our strategy is to unlock the on-shore natural gas potential in the state of Bahia in Brazil, building off the development of our Caburé natural gas field and our strategic midstream infrastructure.
Michael Heim, Senior Vice President, Equity Research Analyst, Energy & Transportation, Noble Capital Markets, Inc.
Refer to the full report for the price target, fundamental analysis, and rating.
Alvopetro released November production volumes that accelerated its recent upward trend. Alvopetro reported November gas production of 12.9 mmcfe/day (up from 10.6 mmcfe/day in October), oil production of 15 boe/day (vs. 8 boe/day), and NGL production of 105 boe/day (up from 67 boe/day). Production was depressed over the summer due to allocation issues with a joint venture partner and demand issues from Bahia Gas, Alvopetro’s primary natural gas customer. Total production was 2,264 boe/day in November.
Total production remains below peak levels but is approaching that level quickly. Production peaked at 2,771 MBOE/day in the quarter ended March 31, 2023. However, with production rising 425 MBOE/day in the most recent month, it is quickly returning to past production levels. Importantly, oil and natural gas production is the fastest growing component of Alvopetro energy portfolio providing additional diversification and lessening its reliance on Bahia Gas.
Equity Research is available at no cost to Registered users of Channelchek. Not a Member? Click ‘Join’ to join the Channelchek Community. There is no cost to register, and we never collect credit card information.
This Company Sponsored Research is provided by Noble Capital Markets, Inc., a FINRA and S.E.C. registered broker-dealer (B/D).
*Analyst certification and important disclosures included in the full report. NOTE: investment decisions should not be based upon the content of this research summary. Proper due diligence is required before making any investment decision.
As the next pivotal United Nations climate change conference quickly approaches, the COP28 summit to be held in Dubai has already attracted controversy before it even begins. Critics argue the UAE’s plans to use its host status to lobby for oil and gas deals creates an irreconcilable conflict of interest. This brewing scandal underscores risks for the energy investment community in navigating the global green transition.
Leaked documents revealed the summit’s president, Sultan Al-Jaber, intends to meet with officials from over a dozen countries to promote fossil fuel projects. As CEO of Abu Dhabi National Oil Company (ADNOC), the world’s 12th largest oil producer, Al-Jaber seemingly represents business as usual in the hydrocarbon sector – precisely as climate scientists urge rapid movement away from planet-warming emissions. This dual role as OPEC’s former president alongside COP28 president epitomizes the conference’s core tension.
While the UAE defends Al-Jaber’s energy background as an asset for summit leadership, others see an fox guarding the henhouse. Renewable energy interests hope COP meetings accelerate emissions cuts to open investment opportunities and meet targeted market shares. In contrast, unchecked fossil fuel dominance could strand assets and leave oil-rich economies behind. For financial institutions, balancing these competing interests grows increasingly complex.
As the global community seeks alignment on climate policy, COP28 takes on heightened importance after last year’s loss of momentum in Egypt. But with Al-Jaber pushing liquefied natural gas deals behind the scenes, the summit’s bold ambitions appear under threat – before even officially starting next week. This risks paralyzing investors betting on meaningful multilateral progress from the 12-day affair.
Rather than showcasing global unity, the conference could further fragment cooperative efforts. Those banking on strengthened commitments and standardized transparency may be severely disappointed. An already divided energy landscape would only become more fractured and filled with uncertainties.
While surging energy prices have boosted oil and gas profits recently, leaving firms cash rich for transitions, alerts sound over stranded asset dangers in the longer run. Without reliable political tailwinds, capital allocation planning swims in obscurity. Investors may continue clinging to the devil they know, slowing sustainability spending despite rhetorical Net Zero pledges.
ESG fund managers face particularly hard choices weighing reputational concerns with fiduciary obligations, as greenwashing allegations persist. Index providers must carefully contemplate emissions-heavy exposure amid heightening transition materiality. Even hydrocarbon majors pursuing renewables see climate credibility doubly damaged by COP28 coziness with embedded fossil fuel agendas.
In effect, the UAE’s COP28 aspirations throw harsh light on the messy entanglements linking energy incumbents to global cooperation imperatives. This summit was envisioned for closing gaps to carbon neutrality – not leveraging elite access for oil field services contracts or petrochemical exports. Dubai’s shone vision as progressive climate broker now sees tarnish.
While Al-Jaber resides at the controversy’s core, larger questions confront energy interests worldwide. How can multinational forums effectively drive sustainability without undermining diverse domestic interests or economic lifelines? Does climate progress rely on energy industrialists gradually conceding ground? Regardless of COP28’s impact, these dilemmas will persist in boardrooms everywhere industries collide with ecological boundaries.
For anxious energy investors, perhaps the greatest risk is policy paralysis. Without milestone markers implemented, capital deployment floats ambiguously while net-zero targets linger out of reach. Until political will consolidates around winding down emissions directly, bankers and shareholders face accumulating uncertainty handicapping strategic decision-making.
Of course, COP meetings have always brought thorny issues to the surface divisions easy to ignore otherwise. But the solution remains clear even if the path does not: economics needs ecology for human prosperity’s endurance. For financial players, that means sustained stakeholder value depends on sustainable business practices without exception. What hangs in the balance moving forward is how smoothly the global energy complex can stick that critical landing.
Michael Heim, Senior Vice President, Equity Research Analyst, Energy & Transportation, Noble Capital Markets, Inc.
Refer to the full report for the price target, fundamental analysis, and rating.
2023-2Q production rose as expected with new wells coming online. A robust summer of drilling resulted in higher production. Post-quarter flow rates allow us to bump up future production estimates.
Realized prices came in better than expected. The basin discount was reduced adding to the rise in oil index prices. Management added swaps at attractive prices in response to higher oil prices.
Equity Research is available at no cost to Registered users of Channelchek. Not a Member? Click ‘Join’ to join the Channelchek Community. There is no cost to register, and we never collect credit card information.
This Company Sponsored Research is provided by Noble Capital Markets, Inc., a FINRA and S.E.C. registered broker-dealer (B/D).
*Analyst certification and important disclosures included in the full report. NOTE: investment decisions should not be based upon the content of this research summary. Proper due diligence is required before making any investment decision.
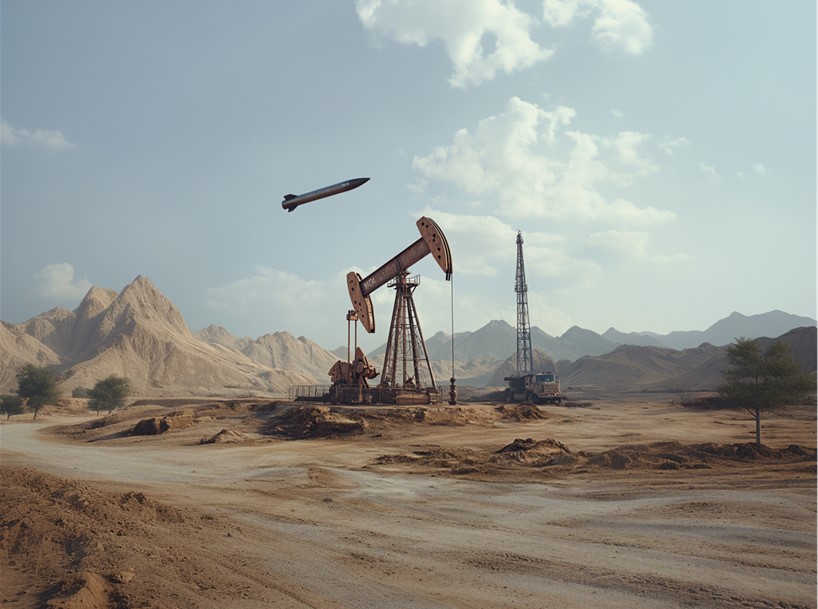
Oil markets were thrown into turmoil on Wednesday after the OPEC+ alliance unexpectedly postponed a critical meeting to determine production levels. Prices promptly plunged over 5% as hopes for additional output cuts to stabilize crude markets were dashed, at least temporarily.
The closely-watched meeting was originally slated for December 3-4. But OPEC+, which includes the 13 member countries of the Organization of Petroleum Exporting Countries along with Russia and other non-members, said the summit would now take place on December 6 instead, offering no explanation for the delay.
The last-minute postponement fueled speculation that the group is struggling to build consensus around boosting production cuts aimed at reversing oil’s steep two-month slide. Disagreements apparently center on Saudi dissatisfaction with other nations flouting their output quotas. Compliance has emerged as a major flashpoint as oil revenue pressures intensify amid rising recession fears.
Prices Rally on Cut Hopes
In recent weeks, oil had rebounded from mid-October lows on mounting expectations that OPEC+ would intervene to tighten supply and put a floor under prices once more.
The alliance has already removed over 5 million barrels per day since 2023 through unilateral Saudi production cuts and collective OPEC+ reductions. But crude has continued drifting lower, with Brent plunging below $80 per barrel last week for the first time since January.
Demand outlooks have deteriorated significantly, especially in China where crude imports fell in October to their lowest since 2007. At the same time, releases from strategic petroleum reserves and resilient non-OPEC production have expanded inventories, exacerbating the supply glut.
Output Quotas Trigger Internal Rifts
Energy analysts widely anticipate that OPEC+ will finalize plans at next week’s rescheduled talks to extend existing production cuts until mid-2024. Saudi Arabia and Russia, the alliance’s de factor leaders, both support additional trims.
However, firming up commitments from the broader group may prove challenging. Crude exports are critical to the economies of many member nations. With government budgets squeezed by weakened prices, some countries have little incentive to curb production.
Unconfirmed reports suggest that Saudi Arabia demanded Iraq and several other laggards bolster compliance with quotas before it agrees to further output reductions. But getting all parties in line with their assigned targets has long confounded the alliance.
Where Oil Goes Next
For now, oil markets are in limbo awaiting next Thursday’s OPEC+ gathering. Prices could see added volatility until the cartel unveils its plans.
Most analysts still expect that additional cuts will emerge, possibly in the 500,000 barrels per day range. That may be enough to place a temporary floor under the market and keep Brent crude from approaching $70 per barrel.
But if internal dissent paralyzes OPEC+ from reaching an agreement, or one that falls significantly short of projections, another downward spiral is probable. Pressure would only escalate on the alliance to take more drastic actions to stabilize prices in 2024 as economic storm clouds gather.
Oklahoma City-based Mach Natural Resources LP announced Monday that it has agreed to acquire oil and gas assets in Oklahoma’s Anadarko Basin from Paloma Partners IV, LLC for $815 million. The deal marks a significant expansion for Mach as it looks to increase production and proved reserves.
The acquisition includes approximately 62,000 net acres concentrated in the core counties of Canadian and Grady, along with recent production of around 32,000 barrels of oil equivalent per day. Mach cited substantial proved developed producing (PDP) reserves of 75 million barrels of oil equivalent and over a decade’s worth of drilling inventory supporting the transaction.
Mach was attracted to the assets’ high margin oil production and potential for further development. The company said the purchase advances its strategy of focusing on distributions, disciplined acquisitions, maintaining low leverage, and keeping the reinvestment rate under 50%. According to Mach, the deal is accretive to cash available for distribution and cash distribution per unit.
The properties change hands with one rig currently running in Grady County and plans for 6 more wells to be completed before the expected December 29 closing. Post-acquisition, Mach intends to add another rig, continuing its measured approach to capital spending.
The purchase price reflects discounted PDP value, presenting an opportunity for Mach to boost near-term cash flow. At the same time, the company is bringing aboard de-risked SCOOP/STACK drilling locations that can fuel longer-term growth.
To finance the $815 million transaction, Mach has lined up committed debt financing led by Chambers Energy Management and EOC Partners. The senior secured term loan will provide $825 million at the closing date. Mach stated that its leverage ratio will remain below 1.0x debt to EBITDA after absorbing the new debt.
Mach’s Chief Executive Officer commented, “This transaction creates significant value for our unitholders and represents an important step in executing our strategic vision. We look forward to developing these high-quality assets and welcoming a talented local team to the Mach family.”
The seller, Paloma Partners IV, is backed by private equity firms EnCap Investments and its affiliates. Paloma amassed the properties in 2017 and 2018 when SCOOP/STACK deal activity was high. Its divestiture to Mach comes amidst a cooling of M&A in the play.
Mach was founded in 2021 with an emphasis on shareholder returns and steady growth in Oklahoma’s Anadarko Basin. The company currently runs a two-rig development program on its legacy acreage position.
The Anadarko Basin has seen resurgent activity as producers apply drilling and completion technology to unlock the potential of the SCOOP and STACK plays. Operators continue to drive down costs and improve productivity in the prolific geological formations.
Mach’s new Grady County acreage provides exposure to the volatile oil window of the SCOOP Woodford condensate play. Well results in the area have benefited from longer laterals, increased sand loadings, and optimized well spacing.
Canadian County offers additional Woodford potential plus stacked pays in the Meramec, Osage and Oswego horizons. Together, these reservoirs offer a mix of liquids-rich gas and high-margin oil for Mach’s operated portfolio.
With its firm financial footing and expanded operational scale, Mach appears positioned for further consolidation in the Anadarko Basin. The company now controls over 150,000 net acres in the region. Its proven strategy may attract additional sellers seeking to divest non-core acreage and realize value from their own holdings.
Mach can leverage its expanded position and technical expertise to exploit not only the SCOOP and STACK but also emerging zones like the Osage and Cottage Grove. The company anticipates its enlarged inventory will support steady production growth and consistent cash returns in the years ahead.
Monday’s major acquisition cements Mach Natural Resource’s status as a premier independent operator in the Anadarko Basin. The company seems intent on delivering on its promises of accretive growth, high cash margins, and peer-leading capital discipline. For Mach, size and scale will likely prove critical in generating free cash flow and distributions in a commodity price environment with little room for error.
Crescent Point Energy has entered into an agreement to acquire fellow Canadian oil producer Hammerhead Resources in an all-stock deal valued at approximately $2.55 billion. The deal will expand Crescent Point’s presence in the Alberta Montney, adding over 100,000 contiguous net acres directly adjacent to its existing land position.
Under the terms, Hammerhead shareholders will receive 0.46 share of Crescent Point common stock and $21.00 cash for each Hammerhead share. That values Hammerhead at around $45,500 per flowing barrel of production.
Strategic Fit Strengthens Key Focus Areas
The acquisition solidifies Crescent Point’s dominant position in two of Canada’s premier unconventional oil plays. It becomes the largest landholder in both the Alberta Montney and Kaybob Duvernay resource plays.
Crescent Point gains over 800 net high-value drilling locations in the Montney through the deal. This boosts its total premium inventory depth to over 20 years, creating a strong long-term growth profile.
The acquired Montney lands also carry attractive royalty rates and have promising geological characteristics analogous to Crescent Point’s existing acreage. Horizontal drilling and completions technologies have unlocked the vast resource potential of the Montney in recent years.
Significant infrastructure owned by Hammerhead, including oil batteries, water disposal, and gas gathering lines, will also transfer over and support growth plans.
Immediate Impact on Cash Flow and Dividend
According to Crescent Point’s estimates, the deal will increase excess cash flow per share by over 15% on average from 2023-2027. This comes atop the company’s existing 5-10% organic growth outlook.
The increased cash generation provides support for a 15% dividend hike to $0.46 annually upon closing the acquisition. Crescent Point’s balance sheet remains a priority, with net debt expected to decline to 1.1x adjusted funds flow by year-end 2024.
Hammerhead’s current production of 56,000 boe/d (50% oil) is expected to increase to over 80,000 boe/d by 2024. With Hammerhead’s low-decline asset base, Crescent Point sees minimal stabilization capital required to sustain output.
Consolidation Creates Scale
Pro-forma the acquisition, Crescent Point will become Canada’s 7th largest energy producer pumping over 200,000 boe/d. The increased scale provides improved access to capital and potential cost efficiencies.
The company also gains key personnel from Hammerhead to further enhance technical and operational expertise across asset teams.
CEO Craig Bryksa said the deal transforms Crescent Point into a Montney and Duvernay focused producer, complemented by its Saskatchewan assets. The consolidation “is an integral part of our overall portfolio transformation,” Bryksa noted.
Crescent Point says its near-term priorities now center on integrating Hammerhead efficiently, executing planned programs, strengthening its balance sheet, and returning increasing capital to shareholders.
For Hammerhead, the transaction provides liquidity after joining the private equity backed company just two years ago. It also positions shareholders to participate in Crescent Point’s significant free cash flow growth in the coming years.
Subject to shareholder, court, and regulatory approvals, the acquisition is expected to close in Q4 2022. The deal will cement Crescent Point’s standing as a dominant Montney producer and provides visible growth underpinned by its expanded low-risk drilling inventory.
CALGARY, AB, Nov. 9, 2023 /CNW/ – InPlay Oil Corp. (TSX: IPO) (OTCQX: IPOOF) (“InPlay” or the “Company“) today announced that the Toronto Stock Exchange (“TSX“) has accepted InPlay’s notice of intention to renew its normal course issuer bid for a further one year term (the “NCIB“). The previous NCIB expired on October 16, 2023. Pursuant to the Company’s previous NCIB, the Company purchased in the open market through the facilities of the TSX and through other alternative Canadian trading platforms and cancelled an aggregate of 190,400 common shares (“Common Shares“) of the Company at an average price paid of $2.84 per Common Share.
Under the NCIB, InPlay may purchase for cancellation, from time to time, as InPlay considers advisable, up to a maximum of 6,637,064 Common Shares, which represents 10% of the Company’s public float of 66,370,643 Common Shares as at October 31, 2023. As of the same date, InPlay had 90,925,401 Common Shares issued and outstanding. Purchases of Common Shares may be made on the open market through the facilities of the TSX and through other alternative Canadian trading platforms at the prevailing market price at the time of such transaction. The actual number of Common Shares that may be purchased for cancellation and the timing of any such purchases will be determined by InPlay, subject to a maximum daily purchase limitation of 43,809 Common Shares which equates to 25% of InPlay’s average daily trading volume of 175,239 Common Shares for the six months ended October 31, 2023. InPlay may make one block purchase per calendar week which exceeds the daily repurchase restrictions. Any Common Shares that are purchased by InPlay under the NCIB will be cancelled.
The NCIB will commence on November 14, 2023 and will terminate on November 13, 2024 or such earlier time as the NCIB is completed or terminated at the option of InPlay.
InPlay believes that renewing the NCIB is a prudent step in this volatile energy market environment, when at times, the prevailing market price does not reflect the underlying value of its Common Shares. The timely repurchase of the Company’s Common Shares for cancellation represents confidence in the long term prospects and sustainability of its business model. This reduction in share count adds per share value to InPlay’s shareholders and adds another tool to management’s disciplined capital allocation strategy.
With the base dividend of $0.015/share per month, NCIB share repurchases and the Company’s continued efforts towards towards overall production per share growth, InPlay will be able to continue with its strategy of providing strong returns to shareholders.
About InPlay Oil Corp.
InPlay Oil is a junior oil and gas exploration and production company with operations in Alberta focused on light oil production. The Company operates long-lived, low-decline properties with drilling development and enhanced oil recovery potential as well as undeveloped lands with exploration possibilities. The Common Shares on the Toronto Stock Exchange under the symbol IPO and the OTCQX under the symbol IPOOF.
For further information please contact:
Doug Bartole President and Chief Executive Officer InPlay Oil Corp. Telephone: (587) 955-0632
This news release contains certain statements that may constitute forward-looking information within the meaning of applicable securities laws. This information includes, but is not limited to InPlay’s intentions with respect to the NCIB and purchases thereunder and the effects of repurchases under the NCIB. Although InPlay believes that the expectations and assumptions on which the forward-looking statements are based are reasonable, undue reliance should not be placed on the forward-looking statements because InPlay can give no assurance that they will prove to be correct. Since forward-looking statements address future events and conditions by their very nature they involve inherent risks and uncertainties. Actual results could defer materially from those currently anticipated due to a number of factors and risks. Certain of these risks are set out in more detail in InPlay’s Annual Information Form which has been filed on SEDAR+ and can be accessed at www.sedarplus.com.
The forward-looking statements contained in this press release are made as of the date hereof and InPlay undertakes no obligation to update publically or revise any forward-looking statements or information, whether as a result of new information, future events or otherwise, unless so required by applicable securities laws.
InPlay Oil is a junior oil and gas exploration and production company with operations in Alberta focused on light oil production. The company operates long-lived, low-decline properties with drilling development and enhanced oil recovery potential as well as undeveloped lands with exploration possibilities. The common shares of InPlay trade on the Toronto Stock Exchange under the symbol IPO and the OTCQX Exchange under the symbol IPOOF.
Michael Heim, Senior Vice President, Equity Research Analyst, Energy & Transportation, Noble Capital Markets, Inc.
Refer to the full report for the price target, fundamental analysis, and rating.
Production increased 6% quarter over quarter despite continued curtailments and unplanned downtime. Curtailments and well pressure issues have hampered production for InPlay and other Canadian producers in recent quarters. InPlay invested $27.5 million during the quarter to drill and make infrastructure improvements. This represents more than half of the year’s capital expenditure budget. During the quarter, the company completed six wells and upgraded a natural gas facility to process 66% more gas.
InPlay reported strong results in the 2023-3Q and 2023-4Q should be better. Management indicated that its investments should lead to the fourth quarter being the highest production quarter of the year. Management did not make any changes to its guidance for 2023, 2024, and 2025 production and fund flow generation. With a drop in capital expenditures in the upcoming quarter, management should have ample cash flow to pay dividends (7% yield), strategically repurchase shares, and explore small add-on acquisitions.
Equity Research is available at no cost to Registered users of Channelchek. Not a Member? Click ‘Join’ to join the Channelchek Community. There is no cost to register, and we never collect credit card information.
This Company Sponsored Research is provided by Noble Capital Markets, Inc., a FINRA and S.E.C. registered broker-dealer (B/D).
*Analyst certification and important disclosures included in the full report. NOTE: investment decisions should not be based upon the content of this research summary. Proper due diligence is required before making any investment decision.
CALGARY AB, Nov. 8, 2023 /CNW/ – InPlay Oil Corp. (TSX: IPO) (OTCQX: IPOOF) (“InPlay” or the “Company”) announces its financial and operating results for the three and nine months ended September 30, 2023. InPlay’s condensed unaudited interim financial statements and notes, as well as Management’s Discussion and Analysis (“MD&A”) for the three and nine months ended September 30, 2023 will be available at “www.sedar.com” and our website at “www.inplayoil.com“.
Third Quarter 2023 Financial & Operating Highlights
Realized average quarterly production of 9,003 boe/d(1) (57% light crude oil and NGLs), a 6% increase compared to 8,474 boe/d (57% light crude oil and NGLs) in the second quarter of 2023 despite extended curtailments and unplanned downtime experienced in the quarter of approximately 550 boe/d.
Generated strong quarterly adjusted funds flow (“AFF”)(2) of $25.2 million ($0.28 per basic share(3)), an increase of 16% from the second quarter of 2023.
Returned $4.0 million ($12.0 million in the first nine months of 2023) directly to shareholders through our monthly base dividend.
Increased revenues by 17% to $46.7 million compared to $39.8 million in the second quarter of 2023.
Improved field operating netbacks(3) by 8% compared to the second quarter of 2023.
Achieved net income of $7.5 million ($0.08 per basic share; $0.08 per diluted share). InPlay has now returned to a retained earnings position on the balance sheet demonstrating that the Company has generated positive earnings since inception (net of dividends paid).
Invested $27.5 million to drill, complete and equip three (2.9 net) Extended Reach Horizontal (“ERH”) wells in Willesden Green, three (3.0 net) ERH wells in Pembina and one (0.35 net) non-operated ERH well in Willesden Green.
Fourth Quarter Operational Update:
Drilled and completed two (1.6 net) ERH wells in Willesden Green which were recently put on production.
The three (3.0 net) Pembina ERH wells brought on production shortly before start of the quarter are producing at strong rates of approximately 260 boe/d(1) (87% light crude oil and NGLs) per well.
Brought online our second natural gas facility upgrade at Leafland, which has increased operated facility capacity by 66% while improving our liquids yield by 40%. Production benefits are already being realized through reduced back pressure on wells, lower declines and providing more consistent runtimes.
Current production is 9,700 boe/d(1) (60% light crude oil and NGLs) based on field estimates., excluding the impact of the two (1.6 net) ERH wells in Willesden Green showing strong flowback rates in the early clean up stage.
Third Quarter 2023 Financial & Operations Overview:
The third quarter of 2023 was a capital intensive quarter for the Company. InPlay invested $27.5 million drilling, completing and equipping three (2.9 net) ERH wells in Willesden Green and three (3.0 net) ERH wells in Pembina. The Company also participated in one (0.35 net) non-operated ERH well in Willesden Green not previously budgeted.
In addition to the upgrade of a natural gas facility in the second quarter, the Company completed a second material upgrade of a gas facility during the third quarter which was brought back on-line in early October. This project modernized existing infrastructure in the Leafland area of Willesden Green and has resulted in an approximate 66% increase to the natural gas processing capability of this facility. The addition of a refrigeration plant to this facility has also improved NGL recoveries by approximately 40%. This additional capacity has lowered field pressures in the area which is expected to improve production and reduce declines on existing wells and future drilling locations. This upgrade is expected to accommodate future development in Leafland and provide more consistent and reliable processing capacity within the Company’s operational control.
The Company has been focused on a high oil weighted drilling program. Three (2.9 net) Willesden Green ERH wells came on production in August into high pressure pipeline systems with average initial production (“IP”) rates per well of 203 boe/d(1) (94% light crude oil and NGLs) over their first 30 days and 215 boe/d(1) (93% light crude oil and NGLs) over their first 60 days. The impact of our facility improvements has enabled these wells to have multiple weeks of flat to improving production rates and after two months they continue to produce at an average rate of approximately 280 boe/d(1) (87% light crude oil and NGLs) per well. The production witnessed from the most recent six wells drilled in Willesden Green have recently benefitted from reduced field pressures and consistent facility runtimes resulting from our operated natural gas facility expansions.
In addition, three (3.0 net) Pembina ERH wells came on production at the end of September with average initial production (“IP”) rates per well of 227 boe/d(1) (88% light crude oil and NGLs) over their first 30 days. These wells have also continued to clean up after completions and are currently producing approximately 260 boe/d(1) (87% light crude oil and NGLs) per well.
Production for the three months ended September 30, 2023 averaged 9,003 boe/d(1) (57% light crude oil and NGLs), 6% higher compared to the three months ended June 30, 2023. Third quarter production was impacted by approximately 550 boe/d (52% light crude oil and NGLs) primarily due to the continuation of multiple third-party natural gas takeaway constraints on our operations and the commissioning of our expanded gas facility that slightly exceeded the anticipated startup timeline. The continued third-party facility outages forced the redirection of associated natural gas to less favorable third-party facilities impacting production through increased back pressure on producing wells as well as higher operating costs.
InPlay generated AFF(2) of $25.2 million ($0.28 per basic share) an increase of 16% from the second quarter of 2023. The Company achieved net income of $7.5 million ($0.08 per basic share; $0.08 per diluted share) and has returned to a retained earnings position on the balance sheet. This is evidence of the long-term sustainability of the Company as positive earnings have been generated since inception (net of dividends paid).
Outlook and Operations Update(5)
The majority of InPlay’s capital program for the year has been completed. The Company’s drilling program for the fourth quarter is underway with two (1.6 net) ERH wells in Willesden Green having been drilled to date. These two wells have been completed and are in the early stages of production. In addition, a 1.0 net Belly River well is now planned to be drilled in the fourth quarter and anticipated to come online in December with its first full month of production expected to commence in January 2024. This well replaces a previously planned one (0.8 net) Willesden Green well.
The investments made in increasing natural gas takeaway capacity through the two facility upgrades in Willesden Green will be important in alleviating potential production issues from third party facility outages going forward. These upgrades have increased our natural gas processing and takeaway capacity in Leafland from approximately 8,400 mcf/d to 17,300 mcf/d. These projects have already shown their importance by reducing back pressure on wells, lowering declines and providing more consistent runtimes, and the reduction in field pressures has the added benefit of improving our liquids weighting. Current production is approximately 9,700 boe/d(1) (60% light crude oil and NGLs) based on field estimates, excluding the impact of two (1.6 net) ERH wells in Willesden Green which are in early stage cleanup and with only four days of production are showing strong flowback rates.
As a result, the fourth quarter is forecasted to be our highest production quarter of the year and given the strong crude oil pricing environment and weak Canadian dollar, the fourth quarter is also projected to be our highest AFF quarter for the year. As the majority of the 2023 capital program was completed by the end of the third quarter, significant free adjusted funds flow (“FAFF”)(3) is expected to be generated in the fourth quarter resulting in a sizeable reduction to net debt prior to year-end.
The Company’s updated 2023 drilling program will be more active than previously planned by approximately 0.6 net wells consisting of 21 (17.1 net) horizontal wells. The changes include an additional one (0.35 net) non-op ERH Willesden Green well and a 1.0 net Belly River well instead of a previously planned one (0.8 net) Willesden Green well. As a result, InPlay has revised its 2023 development capital expenditure guidance to approximately $83 million(5). The timing of the Belly River well will not materially add to 2023 production but will pave the way for potentially an increased Belly River program in 2024 given the high oil weighting and high netback nature of this play. This area is defined by high light-oil weightings that receive a premium to the Mixed Sweet Blend (“MSW”), our pricing benchmark. Our two recent horizontal wells drilled in the area came online in November 2022 and have had operating netbacks of approximately $71.25/boe since being brought on production, and light oil and liquids weightings of approximately 94% to date. These wells have had very low decline rates over this period with average IP rates per well of 98 boe/d (97% light crude oil and NGLs) and 115 boe/d (92% light crude oil and NGLs) over their first 90 and 335 days respectively.
The Company remains committed to providing strong returns to shareholders. Our monthly base dividend of $0.015/share represents approximately a 7% yield at the current share price. To date, the Company has returned $16 million to shareholders through dividends since our inaugural dividend was declared in November 2022, representing approximately 7% of our current market capitalization while maintaining a strong financial position. The generation of shareholder returns through significant FAFF, top-tier production per share growth while maintaining low leverage all remain top priorities of InPlay.
InPlay would like to thank our staff, contractors, and suppliers for their continued dedication and execution, and thank the Board of Directors and shareholders for their continued guidance and support. We look forward to releasing our 2024 capital budget and associated guidance in January.
For further information please contact:
Doug Bartole President and Chief Executive Officer InPlay Oil Corp. Telephone: (587) 955-0632
See “Production Breakdown by Product Type” at the end of this press release.
2.
Capital management measure. See “Non-GAAP and Other Financial Measures” contained within this press release.
3.
Non-GAAP financial measure or ratio that does not have a standardized meaning under International Financial Reporting Standards (IFRS) and GAAP and therefore may not be comparable with the calculations of similar measures for other companies. Please refer to “Non-GAAP and Other Financial Measures” contained within this press release.
4.
Supplementary financial measure. See “Non-GAAP and Other Financial Measures” contained within this press release.
5.
See “Reader Advisories – Forward Looking Information and Statements” for key budget and underlying assumptions related to our previous and updated 2023 capital program and associated guidance.
Reader Advisories
Non-GAAP and Other Financial Measures
Throughout this press release and other materials disclosed by the Company, InPlay uses certain measures to analyze financial performance, financial position and cash flow. These non-GAAP and other financial measures do not have any standardized meaning prescribed under GAAP and therefore may not be comparable to similar measures presented by other entities. The non-GAAP and other financial measures should not be considered alternatives to, or more meaningful than, financial measures that are determined in accordance with GAAP as indicators of the Company performance. Management believes that the presentation of these non-GAAP and other financial measures provides useful information to shareholders and investors in understanding and evaluating the Company’s ongoing operating performance, and the measures provide increased transparency and the ability to better analyze InPlay’s business performance against prior periods on a comparable basis.
Non-GAAP Financial Measures and Ratios
Included in this document are references to the terms “free adjusted funds flow”, “operating income”, “operating netback per boe”, “operating income profit margin”, “Net Debt to EBITDA”, “Net Corporate Acquisitions”, “Debt adjusted production per share” and “EV / DAAFF”. Management believes these measures and ratios are helpful supplementary measures of financial and operating performance and provide users with similar, but potentially not comparable, information that is commonly used by other oil and natural gas companies. These terms do not have any standardized meaning prescribed by GAAP and should not be considered an alternative to, or more meaningful than “profit (loss) before taxes”, “profit (loss) and comprehensive income (loss)”, “adjusted funds flow”, “capital expenditures”, “corporate acquisitions, net of cash acquired”, “net debt”, “weighted average number of common shares (basic)” or assets and liabilities as determined in accordance with GAAP as a measure of the Company’s performance and financial position.
Free Adjusted Funds Flow
Management considers FAFF an important measure to identify the Company’s ability to improve its financial condition through debt repayment and its ability to provide returns to shareholders. FAFF should not be considered as an alternative to or more meaningful than AFF as determined in accordance with GAAP as an indicator of the Company’s performance. FAFF is calculated by the Company as AFF less exploration and development capital expenditures and property dispositions (acquisitions) and is a measure of the cashflows remaining after capital expenditures before corporate acquisitions that can be used for additional capital activity, corporate acquisitions, repayment of debt or decommissioning expenditures or potentially return of capital to shareholders. Refer to the “Forward Looking Information and Statements” section for a calculation of forecast FAFF.
Operating Income/Operating Netback per boe/Operating Income Profit Margin
InPlay uses “operating income”, “operating netback per boe” and “operating income profit margin” as key performance indicators. Operating income is calculated by the Company as oil and natural gas sales less royalties, operating expenses and transportation expenses and is a measure of the profitability of operations before administrative, share-based compensation, financing and other non-cash items. Management considers operating income an important measure to evaluate its operational performance as it demonstrates its field level profitability. Operating income should not be considered as an alternative to or more meaningful than net income as determined in accordance with GAAP as an indicator of the Company’s performance. Operating netback per boe is calculated by the Company as operating income divided by average production for the respective period. Management considers operating netback per boe an important measure to evaluate its operational performance as it demonstrates its field level profitability per unit of production. Operating income profit margin is calculated by the Company as operating income as a percentage of oil and natural gas sales. Management considers operating income profit margin an important measure to evaluate its operational performance as it demonstrates how efficiently the Company generates field level profits from its sales revenue. Refer below for a calculation of operating income, operating netback per boe and operating income profit margin.
(thousands of dollars)
Three Months Ended September 30
Nine Months Ended September 30
2023
2022
2023
2022
Revenue
46,672
56,985
131,735
180,429
Royalties
(5,387)
(10,607)
(16,178)
(28,017)
Operating expenses
(12,677)
(10,946)
(36,343)
(30,660)
Transportation expenses
(698)
(888)
(2,190)
(2,802)
Operating income
27,910
34,544
77,024
118,950
Sales volume (Mboe)
828.3
873.5
2,411.2
2,438.1
Per boe
Revenue
56.35
65.24
54.63
74.00
Royalties
(6.50)
(12.14)
(6.71)
(11.49)
Operating expenses
(15.31)
(12.53)
(15.07)
(12.58)
Transportation expenses
(0.85)
(1.02)
(0.90)
(1.15)
Operating netback per boe
33.69
39.55
31.95
48.78
Operating income profit margin
60 %
61 %
58 %
66 %
Net Debt to EBITDA
Management considers Net Debt to EBITDA an important measure as it is a key metric to identify the Company’s ability to fund financing expenses, net debt reductions and other obligations. EBITDA is calculated by the Company as adjusted funds flow before interest expense. When this measure is presented quarterly, EBITDA is annualized by multiplying by four. When this measure is presented on a trailing twelve month basis, EBITDA for the twelve months preceding the net debt date is used in the calculation. This measure is consistent with the EBITDA formula prescribed under the Company’s Senior Credit Facility. Net Debt to EBITDA is calculated as Net Debt divided by EBITDA. Refer to the “Forward Looking Information and Statements” section for a calculation of forecast Net Debt to EBITDA.
Net Corporate Acquisitions
Management considers Net corporate acquisitions an important measure as it is a key metric to evaluate the corporate acquisition in comparison to other transactions using the negotiated consideration value and ignoring changes to the fair value of the share consideration between the signing of the definitive agreement and the closing of the transaction. Net corporate acquisitions should not be considered as an alternative to or more meaningful than “Corporate acquisitions, net of cash acquired” as determined in accordance with GAAP as an indicator of the Company’s performance. Net corporate acquisitions is calculated as total consideration with share consideration adjusted to the value negotiated with the counterparty, less working capital balances assumed on the corporate acquisition. Refer below for a calculation of Net corporate acquisitions and reconciliation to the nearest GAAP measure, “Corporate acquisitions, net of cash acquired”.
(thousands of dollars)
Three Months Ended September 30
Nine Months Ended September 30
2023
2022
2023
2022
Corporate acquisitions, net of cash acquired
–
89
–
501
Share consideration
–
–
–
–
Non-cash working capital acquired
–
–
–
–
Derivative contracts
–
–
–
–
Net Corporate acquisitions
–
89
–
501(1)
(1) During the nine months ended September 30, 2022, the acquired amount of Property, plant and equipment was adjusted by $0.5 million as a result of adjustments relating to the acquisition of Prairie Storm, with a corresponding increase in the recognized amounts of Accounts payable and accrued liabilities.
Production per Debt Adjusted Share
InPlay uses “Production per debt adjusted share” as a key performance indicator. Debt adjusted shares should not be considered as an alternative to or more meaningful than common shares as determined in accordance with GAAP as an indicator of the Company’s performance. Debt adjusted shares is a non-GAAP measure used in the calculation of Production per debt adjusted share and is calculated by the Company as common shares outstanding plus the change in net debt divided by the Company’s current trading price on the TSX, converting net debt to equity. Debt adjusted shares should not be considered as an alternative to or more meaningful than weighted average number of common shares (basic) as determined in accordance with GAAP as an indicator of the Company’s performance. Management considers Debt adjusted share to be a key performance indicator as it adjusts for the effects of capital structure in relation to the Company’s peers. Production per debt adjusted share is calculated by the Company as production divided by debt adjusted shares. Management considers Production per debt adjusted share is a key performance indicator as it adjusts for the effects of changes in annual production in relation to the Company’s capital structure. Refer to the “Forward Looking Information and Statements” section for a calculation of forecast Production per debt adjusted share.
EV / DAAFF
InPlay uses “enterprise value to debt adjusted AFF” or “EV/DAAFF” as a key performance indicator. EV/DAAFF is calculated by the Company as enterprise value divided by debt adjusted AFF for the relevant period. Debt adjusted AFF (“DAAFF”) is calculated by the Company as adjusted funds flow plus financing costs. Enterprise value is a capital management measure that is used in the calculation of EV/DAAFF. Enterprise value is calculated as the Company’s market capitalization plus working capital (net debt). Management considers enterprise value a key performance indicator as it identifies the total capital structure of the Company. Management considers EV/DAAFF a key performance indicator as it is a key metric used to evaluate the sustainability of the Company relative to other companies while incorporating the impact of differing capital structures. Refer to the “Forward Looking Information and Statements” section for a calculation of forecast EV/DAAFF.
Capital Management Measures
Adjusted Funds Flow
Management considers adjusted funds flow to be an important measure of InPlay’s ability to generate the funds necessary to finance capital expenditures. Adjusted funds flow is a GAAP measure and is disclosed in the notes to the Company’s financial statements for the three months ended March 31, 2023. All references to adjusted funds flow throughout this MD&A are calculated as funds flow adjusting for decommissioning expenditures and transaction and integration costs. Decommissioning expenditures are adjusted from funds flow as they are incurred on a discretionary and irregular basis and are primarily incurred on previous operating assets. Transaction costs are non-recurring costs for the purposes of an acquisition, making the exclusion of these items relevant in Management’s view to the reader in the evaluation of InPlay’s operating performance. The Company also presents adjusted funds flow per share whereby per share amounts are calculated using weighted average shares outstanding consistent with the calculation of profit per common share.
Net Debt / Working Capital
Net debt / working capital is a GAAP measure and is disclosed in the notes to the Company’s financial statements for three months ended March 31, 2023. The Company closely monitors its capital structure with the goal of maintaining a strong balance sheet to fund the future growth of the Company. The Company monitors net debt / working capital as part of its capital structure. The Company uses net debt / working capital (bank debt plus accounts payable and accrued liabilities less accounts receivables and accrued receivables, prepaid expenses and deposits and inventory) as an alternative measure of outstanding debt. Management considers net debt / working capital an important measure to assist in assessing the liquidity of the Company.
Supplementary Measures
“Average realized crude oil price” is comprised of crude oil commodity sales from production, as determined in accordance with IFRS, divided by the Company’s crude oil production. Average prices are before deduction of transportation costs and do not include gains and losses on financial instruments.
“Average realized NGL price” is comprised of NGL commodity sales from production, as determined in accordance with IFRS, divided by the Company’s NGL production. Average prices are before deduction of transportation costs and do not include gains and losses on financial instruments.
“Average realized natural gas price” is comprised of natural gas commodity sales from production, as determined in accordance with IFRS, divided by the Company’s natural gas production. Average prices are before deduction of transportation costs and do not include gains and losses on financial instruments.
“Average realized commodity price” is comprised of commodity sales from production, as determined in accordance with IFRS, divided by the Company’s production. Average prices are before deduction of transportation costs and do not include gains and losses on financial instruments.
“Adjusted funds flow per weighted average basic share” is comprised of adjusted funds flow divided by the basic weighted average common shares.
“Adjusted funds flow per weighted average diluted share” is comprised of adjusted funds flow divided by the diluted weighted average common shares.
“Adjusted funds flow per boe” is comprised of adjusted funds flow divided by total production.
Forward-Looking Information and Statements
This news release contains certain forward–looking information and statements within the meaning of applicable securities laws. The use of any of the words “expect”, “anticipate”, “continue”, “estimate”, “may”, “will”, “project”, “should”, “believe”, “plans”, “intends”, “forecast” and similar expressions are intended to identify forward-looking information or statements. In particular, but without limiting the foregoing, this news release contains forward-looking information and statements pertaining to the following: the Company’s business strategy, milestones and objectives; the Company’s planned 2023 capital program including wells to be drilled and completed and the timing of the same; the expectation that our Leafland gas facility upgrade will accommodate full development, provide consistent and reliable processing capacity, improve production on existing wells and future drilling locations and reduce production declines; accommodate full development in Leafland and provide consistent and reliable processing capacity within the Company’s operational control; 2023 guidance based on the planned capital program and all associated underlying assumptions set forth in this press release including, without limitation, forecasts of 2023 annual average production levels, debt adjusted production levels, adjusted funds flow, free adjusted funds flow, Net Debt/EBITDA ratio, operating income profit margin, and Management’s belief that the Company can grow some or all of these attributes and specified measures; light crude oil and NGLs weighting estimates; that the fourth quarter is forecasted to be our highest production and AFF quarter of the year with significant FAFF generated resulting in a sizeable reduction to net debt and a material reduction to our leverage metrics; expectations regarding future commodity prices; future oil and natural gas prices; future liquidity and financial capacity; future results from operations and operating metrics; future costs, expenses and royalty rates; future interest costs; the exchange rate between the $US and $Cdn; future development, exploration, acquisition, development and infrastructure activities and related capital expenditures, including our planned 2023 capital program; the amount and timing of capital projects; forecasted spending on decommissioning; expectations regarding third party processing constraints and maintenance shut ins and the timing and impact of the same; that the Company has the financial capability to deliver consistent return to shareholders and the dividend is supportable at a $55 WTI pricing environment until 2025; the potential for an increased Belly River program in 2024; the timing of the release of the Company’s 2024 capital budget and associated guidance; and methods of funding our capital program.
Without limitation of the foregoing, readers are cautioned that the Company’s future dividend payments to shareholders of the Company, if any, and the level thereof will be subject to the discretion of the Board of Directors of InPlay. The Company’s dividend policy and funds available for the payment of dividends, if any, from time to time, is dependent upon, among other things, levels of FAFF, leverage ratios, financial requirements for the Company’s operations and execution of its growth strategy, fluctuations in commodity prices and working capital, the timing and amount of capital expenditures, credit facility availability and limitations on distributions existing thereunder, and other factors beyond the Company’s control. Further, the ability of the Company to pay dividends will be subject to applicable laws, including satisfaction of solvency tests under the Business Corporations Act (Alberta), and satisfaction of certain applicable contractual restrictions contained in the agreements governing the Company’s outstanding indebtedness.
Forward-looking statements or information are based on a number of material factors, expectations or assumptions of InPlay which have been used to develop such statements and information but which may prove to be incorrect. Although InPlay believes that the expectations reflected in such forward-looking statements or information are reasonable, undue reliance should not be placed on forward-looking statements because InPlay can give no assurance that such expectations will prove to be correct. In addition to other factors and assumptions which may be identified herein, assumptions have been made regarding, among other things: the impact of increasing competition; the general stability of the economic and political environment in which InPlay operates; the timely receipt of any required regulatory approvals; the ability of InPlay to obtain qualified staff, equipment and services in a timely and cost efficient manner; drilling results; the ability of the operator of the projects in which InPlay has an interest in to operate the field in a safe, efficient and effective manner; the ability of InPlay to obtain debt financing on acceptable terms; the anticipated tax treatment of the monthly base dividend; field production rates and decline rates; the ability to replace and expand oil and natural gas reserves through acquisition, development and exploration; the timing and cost of pipeline, storage and facility construction and the ability of InPlay to secure adequate product transportation; future commodity prices; that various conditions to a shareholder return strategy can be satisfied; the ongoing impact of the Russia/Ukraine conflict and war in the Middle East; currency, exchange and interest rates; regulatory framework regarding royalties, taxes and environmental matters in the jurisdictions in which InPlay operates; and the ability of InPlay to successfully market its oil and natural gas products.
The forward-looking information and statements included herein are not guarantees of future performance and should not be unduly relied upon. Such information and statements, including the assumptions made in respect thereof, involve known and unknown risks, uncertainties and other factors that may cause actual results or events to defer materially from those anticipated in such forward-looking information or statements including, without limitation: the continuing impact of the Russia/Ukraine conflict and war in the Middle East; inflation and the risk of a global recession; changes in our planned 2023 capital program; changes in our long range plan; changes in our approach to shareholder returns; changes in commodity prices and other assumptions outlined herein; the risk that dividend payments may be reduced, suspended or cancelled; the potential for variation in the quality of the reservoirs in which we operate; changes in the demand for or supply of our products; unanticipated operating results or production declines; changes in tax or environmental laws, royalty rates or other regulatory matters; changes in development plans or strategies of InPlay or by third party operators of our properties; changes in our credit structure, increased debt levels or debt service requirements; inaccurate estimation of our light crude oil and natural gas reserve and resource volumes; limited, unfavorable or a lack of access to capital markets; increased costs; a lack of adequate insurance coverage; the impact of competitors; and certain other risks detailed from time-to-time in InPlay’s continuous disclosure documents filed on SEDAR including our Annual Information Form and our MD&A.
This press release contains future-oriented financial information and financial outlook information (collectively, “FOFI”) about InPlay’s financial and leverage targets and objectives, InPlay’s long-term forecast, and potential dividends, all of which are subject to the same assumptions, risk factors, limitations, and qualifications as set forth in the above paragraphs. The actual results of operations of InPlay and the resulting financial results will likely vary from the amounts set forth in this press release and such variation may be material. InPlay and its management believe that the FOFI has been prepared on a reasonable basis, reflecting management’s reasonable estimates and judgments. However, because this information is subjective and subject to numerous risks, it should not be relied on as necessarily indicative of future results. Except as required by applicable securities laws, InPlay undertakes no obligation to update such FOFI. FOFI contained in this press release was made as of the date of this press release and was provided for the purpose of providing further information about InPlay’s anticipated future business operations and strategy. Readers are cautioned that the FOFI contained in this press release should not be used for purposes other than for which it is disclosed herein.
The internal projections, expectations, or beliefs underlying our Board approved 2023 capital budget and associated guidance, as well as management’s preliminary estimates and targets in respect of plans for 2024 and beyond (which are not based on Board approved budgets at this time), are subject to change in light of, among other factors, the impact of world events including the Russia/Ukraine conflict, ongoing results, prevailing economic circumstances, volatile commodity prices, and industry conditions and regulations. InPlay’s financial outlook and guidance provides shareholders with relevant information on management’s expectations for results of operations, excluding any potential acquisitions or dispositions, for such time periods based upon the key assumptions outlined herein. In this document reference is made to the Company’s longer range 2024 and beyond internal plan and associated economic model. Such information reflects internal estimates and targets used by management for the purposes of making capital investment decisions and for internal long-range planning and budget preparation. Readers are cautioned that events or circumstances could cause capital plans and associated results to differ materially from those predicted and InPlay’s guidance for 2023, and more particularly 2024 and beyond, may not be appropriate for other purposes. Accordingly, undue reliance should not be placed on same.
The forward-looking information and statements contained in this news release speak only as of the date hereof and InPlay does not assume any obligation to publicly update or revise any of the included forward-looking statements or information, whether as a result of new information, future events or otherwise, except as may be required by applicable securities laws.
Risk Factors to FLI
Risk factors that could materially impact successful execution and actual results of the Company’s 2023 capital program and associated guidance and long-term preliminary plans and estimates include:
volatility of petroleum and natural gas prices and inherent difficulty in the accuracy of predictions related thereto;
the extent of any unfavourable impacts of wildfires in the province of Alberta.
changes in Federal and Provincial regulations;
the Company’s ability to secure financing for the Board approved 2023 capital program and longer-term capital plans sourced from AFF, bank or other debt instruments, asset sales, equity issuance, infrastructure financing or some combination thereof; and
those additional risk factors set forth in the Company’s MD&A and most recent Annual Information Form filed on SEDAR
Key Budget and Underlying Material Assumptions to FLI
The Company’s 2023 guidance remains the same as previously released August 14, 2023, with updated capital expenditures to $83 million. The 2023 guidance calculations which are impacted by this change are outlined below.
Actuals FY 2022
Updated Guidance FY 2023
Previous Guidance FY 2023(1)
Adjusted Funds Flow
$ millions
$131
$103 – $108
$103 – $108
Capital Expenditures
$ millions
$77.6
$83
$75 – $80
Free Adjusted Funds Flow
$ millions
$53
$20 – $25
$23 – $33
Actuals FY 2022
Updated Guidance FY 2023
Previous Guidance FY 2023(1)
Adjusted Funds Flow
$ millions
$131
$103 – $108
$103 – $108
Interest
$/boe
1.49
1.00 – 1.50
1.00 – 1.50
EBITDA
$ millions
$136
$108 – $113
$108 – $113
Working Capital (Net Debt)
$ millions
($33)
($35) – ($30)
($31) – ($27)
Net Debt/EBITDA
0.2
0.2 – 0.3
0.2 – 0.3
Actuals FY 2022
Updated Guidance FY 2023
Previous Guidance FY 2023(1)
Production
Boe/d
9,105
9,100 – 9,500
9,100 – 9,500
Opening Working Cap. (Net Debt)
$ millions
($80.2)
($33)
($33)
Ending Working Cap. (Net Debt)
$ millions
($33)
($35) – ($30)
($31) – ($27)
Weighted avg. outstanding shares
# millions
86.9
88.7
88.7
Assumed Share price
$
3.39(4)
2.75
2.75
Prod. per debt adj. share growth(3)
51 %
(3%) – 3%
0% – 5%
Actuals FY 2022
Updated Guidance FY 2023
Previous Guidance FY 2023(1)
Share outstanding, end of year
# millions
87.0
89.4
89.4
Assumed Share price
$
3.03(5)
2.75
2.75
Market capitalization
$ millions
$263
$246
$246
Working Capital (Net Debt)
$ millions
($33)
($35) – ($30)
($31) – ($27)
Enterprise value
$millions
$296
$276 – $281
$273 – $277
Adjusted Funds Flow
$ millions
$131
$103 – $108
$103 – $108
Interest
$/boe
1.49
1.00 – 1.50
1.00 – 1.50
Debt Adjusted AFF
$ millions
$136
$108 – $113
$108 – $113
EV/DAAFF
2.2
2.7 – 2.5
2.6 – 2.4
The Company’s 2024 and 2025 preliminary plans remains the same as previously released January 18, 2023, with net debt (working capital) updated to reflect the updated forecast 2023 ending net debt. The 2024 and 2025 preliminary plan guidance calculations which are impacted by this change are outlined below.
Updated Preliminary Plan FY 2024(6)
Updated Preliminary Plan FY 2025(6)
Previous Preliminary Plan FY 2024(2)(6)
Previous Preliminary Plan FY 2025(2)(6)
Adjusted Funds Flow
$ millions
$138 – $150
$144 – $154
$138 – $150
$144 – $154
Interest
$/boe
0.00 – 0.10
0.00 – 0.10
0.00 – 0.10
0.00 – 0.10
EBITDA
$ millions
$138 – $150
$144 – $154
$138 – $150
$144 – $154
Working Capital (Net Debt)
$ millions
$2 – $14
$45 – $56
$5 – $17
$48 – $59
Net Debt/EBITDA
(0.0) – (0.1)
(0.3) – (0.4)
(0.0) – (0.2)
(0.3) – (0.5)
Updated Preliminary Plan FY 2024(6)
Updated Preliminary Plan FY 2025(6)
Previous Preliminary Plan FY 2024(2)(6)
Previous Preliminary Plan FY 2025(2)(6)
Production
Boe/d
10,250 – 11,250
10,950 – 11,950
10,250 – 11,250
10,950 – 11,950
Opening Working Cap. (Net Debt)
$ millions
($35) – ($30)
$2 – $14
($31) – ($27)
$5 – $17
Ending Working Cap. (Net Debt)
$ millions
$2 – $14
$45 – $56
$5 – $17
$48 – $59
Weighted avg. outstanding shares
# millions
89.1
89.1
89.1
89.1
Assumed Share price
$
2.75
2.75
2.75
2.75
Prod. per debt adj. share growth(3)
28% – 48%
21% – 39%
28% – 48%
21% – 39%
Updated Preliminary Plan FY 2024(6)
Updated Preliminary Plan FY 2025(6)
Previous Preliminary Plan FY 2024(2)(6)
Previous Preliminary Plan FY 2025(2)(6)
Share outstanding, end of year
# millions
89.4
89.4
89.4
89.4
Assumed Share price
$
2.75
2.75
2.75
2.75
Market capitalization
$ millions
$246
$246
$246
$246
Working Capital (Net Debt)
$ millions
$2 – $14
$45 – $56
$5 – $17
$48 – $59
Enterprise value
$millions
$232 – $244
$190 – $201
$229 – $241
$187 – $198
Adjusted Funds Flow
$ millions
$138 – $150
$144 – $154
$138 – $150
$144 – $154
Interest
$/boe
0.00 – 0.10
0.00 – 0.10
0.00 – 0.10
0.00 – 0.10
Debt Adjusted AFF
$ millions
$138 – $150
$144 – $154
$138 – $150
$144 – $154
EV/DAAFF
1.8 – 1.5
1.4 – 1.2
1.8 – 1.5
1.4 – 1.2
(1)
As previously released August 14, 2023.
(2)
As previously released January 18, 2023.
(3)
Production per debt adjusted share is calculated by the Company as production divided by debt adjusted shares. Debt adjusted shares is calculated by the Company as common shares outstanding plus the change in working capital (net debt) divided by the Company’s current trading price on the TSX, converting working capital (net debt) to equity. Future share prices are assumed to be consistent with the current share price.
(4)
Weighted average share price throughout 2022.
(5)
Ending share price at December 31, 2022.
(6)
InPlay’s estimates and plans for 2024 and beyond remain preliminary in nature and do not, at this time, reflect a Board approved capital expenditure budget.
See “Production Breakdown by Product Type” below
Quality and pipeline transmission adjustments may impact realized oil prices in addition to the MSW Differential provided above
Changes in working capital (net debt) are not assumed to have a material impact between the years presented above.
Test Results and Initial Production Rates
Test results and initial production (“IP”) rates disclosed herein, particularly those short in duration, may not necessarily be indicative of long-term performance or of ultimate recovery. A pressure transient analysis or well-test interpretation has not been carried out and thus certain of the test results provided herein should be considered to be preliminary until such analysis or interpretation has been completed.
Production Breakdown by Product Type
Disclosure of production on a per boe basis in this press release consists of the constituent product types as defined in NI 51–101 and their respective quantities disclosed in the table below:
Light and Medium Crude oil(bbls/d)
NGLs(boe/d)
Conventional Natural gas(Mcf/d)
Total(boe/d)
Q1 2022 Average Production
3,571
1,307
20,054
8,221
Q2 2022 Average Production
3,865
1,333
23,191
9,063
Q3 2022 Average Production
3,717
1,432
26,075
9,495
2022 Average Production
3,766
1,402
23,623
9,105
Q1 2023 Average Production
3,788
1,458
22,648
9,020
Q2 2023 Average Production
3,658
1,187
21,772
8,474
Q3 2023 Average Production
3,697
1,420
23,316
9,003
2023 Annual Guidance
4,105
1,332
23,175
9,300(1)
2024 Annual Preliminary Plan
4,655
1,565
27,180
10,750(2)
2025 Annual Preliminary Plan
4,900
1,685
29,190
11,450(2)
Current Production
4,365
1,455
23,280
9,700
Q3 Pembina Wells (per well) – IP30
197
4
156
227
Q3 Pembina Wells (per well) – Current
220
5
210
260
Q3 WG Wells (per well) – IP30
188
3
72
203
Q3 WG Wells (per well) – IP60
196
3
96
215
Q3 WG Wells (per well) – Current
236
8
215
280
Notes:
1.
This reflects the mid-point of the Company’s 2023 production guidance range of 9,100 to 9,500 boe/d.
2.
This reflects the midpoint of the Company’s annual production preliminary estimate range.
3.
With respect to forward–looking production guidance, product type breakdown is based upon management’s expectations based on reasonable assumptions but are subject to variability based on actual well results.
References to crude oil, light oil, NGLs or natural gas production in this press release refer to the light and medium crude oil, natural gas liquids and conventional natural gas product types, respectively, as defined in National Instrument 51-101, Standards of Disclosure for Oil and Gas Activities (“Nl 51-101”).
BOE equivalent Barrel of oil equivalents or BOEs may be misleading, particularly if used in isolation. A BOE conversion ratio of 6 mcf: 1 bbl is based on an energy equivalency conversion method primarily applicable at the burner tip and does not represent a value equivalency at the wellhead. Given that the value ratio based on the current price of crude oil as compared to natural gas is significantly different than the energy equivalency of 6:1, utilizing a 6:1 conversion basis may be misleading as an indication of value.
CALGARY, AB, Nov. 8, 2023 /CNW/ – Alvopetro Energy Ltd. (TSXV: ALV) (OTCQX: ALVOF) is pleased to announce financial results for the three and nine months ended September 30, 2023 and an operational update.
All references herein to $ refer to United States dollars, unless otherwise stated and all tabular amounts are in thousands of United States dollars, except as otherwise noted.
President & CEO, Corey C. Ruttan commented:
“While sales volumes were lower in Q3 2023 due to temporary reductions in demand, we were still able to generate record operating netbacks of $70.34/boe and $9.6 million of funds flow from operations. Our production rates in October increased back up to 1,839 boepd. Capital expenditures in Q3 were focused on drilling our 183-A3 well, the first fit-for-purpose development well on our Murucututu natural gas field. The initial results from drilling are promising and we look forward to completing the well and bringing it on production later in the year.”
Operational Update
We completed drilling the 183-A3 well on our 100% owned Murucututu natural gas field in October. The well was drilled to a total measured depth of 3,540 metres and, based on open-hole logs, the well encountered potential net natural gas pay in both the Caruaçu Member of the Maracangalha Formation and the Gomo Member of the Candeias Formation, with an aggregate 127.7 metres total vertical depth of potential natural gas pay, using a 6% porosity cut-off, 50% Vshale cut-off and 50% water saturation cutoff. Subject to equipment availability and regulatory approvals, we expect to commence completion operations on the well later this month. The well will then be put on production directly into the adjacent field production facility.
October sales volumes increased to 1,839 boepd, an 8% increase from Q3 2023. October sales included natural gas sales of 10.6 MMcfpd, associated natural gas liquids sales from condensate of 67 bopd and oil sales of 8 bopd, based on field estimates.
In October we completed the BL-06 well on our Bom Lugar field and brought the well on production. October production volumes are expected to be sold in November. Based on field production data, the well is currently producing at an average of 14 bopd.
Financial and Operating Highlights – Third Quarter of 2023
With reduced offtake from Bahiagás during the quarter following reductions in end user consumption, our average daily sales decreased to 1,696 boepd (-14% from Q2 2023 and -36% from Q3 2022).
Our average realized natural gas price increased to $13.06/Mcf, a 17% increase from Q3 2022 with the 3% increase in our contracted natural gas price, enhanced sales tax credits available in 2023 and a 7% appreciation in the average BRL to USD in Q3 2023 compared to Q3 2022. With the higher natural gas price, our overall realized price per boe increased to $78.90 (+15% from Q3 2022 and +2% from Q2 2023).
Our natural gas, condensate and oil revenue was $12.3 million in Q3 2023, a decrease of $4.4 million (-26%) compared to Q3 2022 and a decrease of $1.6 million (-12%) compared to Q2 2023.
Our operating netback improved to $70.34 per boe (+$10.51 per boe from Q3 2022 and +$0.73 per boe from Q2 2023) with higher realized sales prices, partially offset by the impact of fixed operating costs with lower sales volumes.
We generated funds flows from operations of $9.6 million ($0.26 per basic and $0.25 per diluted share), a decrease of $3.7 million compared to Q3 2022 and $1.4 million compared to Q2 2023.
We reported net income of $5.8 million in Q3 2023, a decrease of $3.0 million (-34%) compared to Q3 2022 and $4.0 million (-41%) compared to Q2 2023.
Capital expenditures totaled $10.7 million, including drilling costs for the 183-A3 well on our Murucututu natural gas field, drilling and completion costs for the BL-06 well on our Bom Lugar field, and long-lead purchases for future capital projects.
Our working capital surplus was $11.4 million as of September 30, 2023, decreasing $6.7 million from June 30, 2023 and $3.3 million from December 31, 2022.
The following table provides a summary of Alvopetro’s financial and operating results for three and nine months ended September 30, 2023 and September 30, 2022. The consolidated financial statements with the Management’s Discussion and Analysis (“MD&A”) are available on our website at www.alvopetro.com and will be available on the SEDAR+ website at www.sedarplus.ca.
As at and Three Months EndedSeptember 30,
As at and Nine Months EndedSeptember 30,
2023
2022
Change (%)
2023
2022
Change (%)
Financial
($000s, except where noted)
Natural gas, oil and condensate sales
12,313
16,672
(26)
44,387
46,431
(4)
Net income
5,819
8,795
(34)
27,873
26,541
5
Per share – basic ($)(1)
0.16
0.26
(38)
0.75
0.78
(4)
Per share – diluted ($)(1)
0.15
0.24
(38)
0.74
0.72
3
Cash flows from operating activities
12,469
13,838
(10)
39,798
35,168
13
Per share – basic ($)(1)
0.34
0.40
(15)
1.07
1.03
4
Per share – diluted ($)(1)
0.33
0.37
(11)
1.05
0.96
9
Funds flow from operations (2)
9,618
13,348
(28)
35,637
36,686
(3)
Per share – basic ($)(1)
0.26
0.39
(33)
0.96
1.08
(11)
Per share – diluted ($)(1)
0.25
0.36
(31)
0.94
1.00
(6)
Dividends declared
5,122
2,896
77
15,335
8,340
84
Per share(1)
0.14
0.08
75
0.42
0.24
75
Capital expenditures
10,703
8,713
23
22,515
18,851
19
Cash and cash equivalents
22,779
17,380
31
22,779
17,380
31
Net working capital surplus(2)
11,392
12,225
(7)
11,392
12,225
(7)
Weighted average shares outstanding
Basic (000s)(1)
37,138
34,434
8
37,086
34,107
9
Diluted (000s)(1)
37,868
36,939
3
37,748
36,693
3
Operations
Natural gas, NGLs and crude oil sales:
Natural gas (Mcfpd), by field:
Caburé (Mcfpd)
8,949
15,139
(41)
11,757
14,344
(18)
Murucututu (Mcfpd)
726
–
–
467
–
–
Total natural gas (Mcfpd)
9,675
15,139
(36)
12,224
14,344
(15)
NGLs – condensate (bopd)
81
117
(31)
101
104
(3)
Oil (bopd)
3
2
50
4
6
(33)
Total (boepd)
1,696
2,642
(36)
2,142
2,501
(14)
Average realized prices(2):
Natural gas ($/Mcf)
13.06
11.18
17
12.57
11.03
14
NGLs – condensate ($/bbl)
89.43
101.57
(12)
85.31
109.38
(22)
Oil ($/bbl)
73.08
80.92
(10)
69.18
83.59
(17)
Total ($/boe)
78.90
68.59
15
75.90
68.00
12
Operating netback ($/boe)(2)
Realized sales price
78.90
68.59
15
75.90
68.00
12
Royalties
(2.04)
(5.42)
(62)
(2.14)
(5.05)
(58)
Production expenses
(6.52)
(3.34)
95
(5.22)
(3.77)
38
Operating netback
70.34
59.83
18
68.54
59.18
16
Operating netback margin(2)
89 %
87 %
2
90 %
87 %
3
Notes:
(1)
Per share amounts are based on weighted average shares outstanding other than dividends per share, which is based on the number of common shares outstanding at each dividend record date. The weighted average number of diluted common shares outstanding in the computation of funds flow from operations and cash flows from operating activities per share is the same as for net income per share.
(2)
See “Non-GAAP and Other Financial Measures” section within this news release.
Q3 2023 Results Webcast
Alvopetro will host a live webcast to discuss our Q3 2023 financial results at 9:00 am Mountain time on Thursday November 9, 2023. Details for joining the event are as follows:
The webcast will include a question and answer period. Online participants will be able to ask questions through the Zoom portal. Dial-in participants can email questions directly to socialmedia@alvopetro.com.
Long-term Incentive Compensation Grants
In connection with our long-term incentive compensation program, Alvopetro’s Board of Directors (the “Board”) has approved the annual rolling grants to officers, directors and certain employees under Alvopetro’s Omnibus Incentive Plan. A total of 638,000 stock options, 107,000 restricted share units (“RSUs”) and 31,000 deferred share units (“DSUs”) were approved by the Board and are expected to be granted on November 17, 2023. Of the total grants, 271,000 stock options, 70,000 RSUs and 31,000 DSUs will be granted to directors and officers. Each stock option, RSU and DSU entitles the holder to purchase one common share. Each stock option granted will have an exercise price based on the volume weighted average trading price of Alvopetro’s shares on the TSX Venture Exchange for the five (5) consecutive trading days up to and including November 17, 2023. All stock options granted expire five (5) years from the date of the grant. All RSUs and DSUs granted expire ten (10) years from the date of the grant.
Alvopetro Energy Ltd.’svision is to become a leading independent upstream and midstream operator in Brazil. Our strategy is to unlock the on-shore natural gas potential in the state of Bahia in Brazil, building off the development of our Caburé and Murucututu natural gas fields and our strategic midstream infrastructure.
Neither the TSX Venture Exchange nor its Regulation Services Provider (as that term is defined in the policies of the TSX Venture Exchange) accepts responsibility for the adequacy or accuracy of this news release.
Abbreviations:
$000s
=
thousands of U.S. dollars
bbls
=
barrels
boepd
=
barrels of oil equivalent (“boe”) per day
bopd
=
barrels of oil and/or natural gas liquids (condensate) per day
BRL
=
Brazilian Real
Mcf
=
thousand cubic feet
Mcfpd
=
thousand cubic feet per day
MMcf
=
million cubic feet
MMcfpd
=
million cubic feet per day
NGLs
=
natural gas liquids
Q2 2023
=
three months ended June 30, 2023
Q3 2022
=
three months ended September 30, 2022
Q3 2023
=
three months ended September 30, 2023
USD
=
United States dollars
Non-GAAP and Other Financial Measures
This news release contains references to various non-GAAP financial measures, non-GAAP ratios, capital management measures and supplementary financial measures as such terms are defined in National Instrument 52-112 Non-GAAP and Other Financial Measures Disclosure. Such measures are not recognized measures under GAAP and do not have a standardized meaning prescribed by IFRS and might not be comparable to similar financial measures disclosed by other issuers. While these measures may be common in the oil and gas industry, the Company’s use of these terms may not be comparable to similarly defined measures presented by other companies. The non-GAAP and other financial measures referred to in this report should not be considered an alternative to, or more meaningful than measures prescribed by IFRS and they are not meant to enhance the Company’s reported financial performance or position. These are complementary measures that are used by management in assessing the Company’s financial performance, efficiency and liquidity and they may be used by investors or other users of this document for the same purpose. Below is a description of the non-GAAP financial measures, non-GAAP ratios, capital management measures and supplementary financial measures used in this news release. For more information with respect to financial measures which have not been defined by GAAP, including reconciliations to the closest comparable GAAP measure, see the “Non-GAAP Measures and Other Financial Measures” section of the Company’s MD&A which may be accessed through the SEDAR+ website at www.sedarplus.ca.
Non-GAAP Financial Measures
Operating netback
Operating netback is calculated as natural gas, oil and condensate revenues less royalties and production expenses. This calculation is provided in the “Operating Netback” section of the Company’s MD&A using our IFRS measures. The Company’s MD&A may be accessed through the SEDAR+ website at www.sedarplus.ca. Operating netback is a common metric used in the oil and gas industry used to demonstrate profitability from operations.
Non-GAAP Financial Ratios
Operating netback per boe
Operating netback is calculated on a per unit basis, which is per barrel of oil equivalent (“boe”). It is a common non-GAAP measure used in the oil and gas industry and management believes this measurement assists in evaluating the operating performance of the Company. It is a measure of the economic quality of the Company’s producing assets and is useful for evaluating variable costs as it provides a reliable measure regardless of fluctuations in production. Alvopetro calculated operating netback per boe as operating netback divided by total sales volumes (barrels of oil equivalent). This calculation is provided in the “Operating Netback” section of the Company’s MD&A using our IFRS measures. The Company’s MD&A may be accessed through the SEDAR+ website at www.sedarplus.ca. Operating netback is a common metric used in the oil and gas industry used to demonstrate profitability from operations on a per unit basis (boe).
Operating netback margin
Operating netback margin is calculated as operating netback per boe divided by the realized sales price per boe. Operating netback margin is a measure of the profitability per boe relative to natural gas, oil and condensate sales revenues per boe and is calculated as follows:
Three Months Ended September 30,
Nine Months EndedSeptember 30,
2023
2022
2023
2022
Operating netback – $ per boe
70.34
59.83
68.54
59.18
Average realized price – $ per boe
78.90
68.59
75.90
68.00
Operating netback margin
89 %
87 %
90 %
87 %
Funds Flow from Operations Per Share
Funds flow from operations per share is a non-GAAP ratio that includes all cash generated from operating activities and is calculated before changes in non-cash working capital, divided by the weighted the weighted average shares outstanding for the respective period. For the periods reported in this news release the cash flows from operating activities per share and funds flow from operations per share is as follows:
Three Months EndedSeptember 30,
Nine Months EndedSeptember 30,
$ per share
2023
2022
2023
2022
Per basic share:
Cash flows from operating activities
0.34
0.40
1.07
1.03
Funds flow from operations
0.26
0.39
0.96
1.08
Per diluted share:
Cash flows from operating activities
0.33
0.37
1.05
0.96
Funds flow from operations
0.25
0.36
0.94
1.00
Capital Management Measures
Funds Flow from Operations
Funds flow from operations is a non-GAAP capital management measure that includes all cash generated from operating activities and is calculated before changes in non-cash working capital. The most comparable GAAP measure to funds flow from operations is cash flows from operating activities. Management considers funds flow from operations important as it helps evaluate financial performance and demonstrates the Company’s ability to generate sufficient cash to fund future growth opportunities. Funds flow from operations should not be considered an alternative to, or more meaningful than, cash flows from operating activities however management finds that the impact of working capital items on the cash flows reduces the comparability of the metric from period to period. A reconciliation of funds flow from operations to cash flows from operating activities is as follows:
Three Months Ended September 30,
Nine Months EndedSeptember 30,
2023
2022
2023
2022
Cash flows from operating activities
12,469
13,838
39,798
35,168
(Deduct) add back changes in non-cash working capital
(2,851)
(490)
(4,161)
1,518
Funds flow from operations
9,618
13,348
35,637
36,686
Net Working Capital
Net working capital is computed as current assets less current liabilities. Net working capital is a measure of liquidity, is used to evaluate financial resources, and is calculated as follows:
As at September 30,
2023
2022
Total current assets
27,354
24,545
Total current liabilities
(15,962)
(12,320)
Net working capital
11,392
12,225
Supplementary Financial Measures
“Average realized natural gas price – $/Mcf” is comprised of natural gas sales as determined in accordance with IFRS, divided by the Company’s natural gas sales volumes.
“Average realized NGL – condensate price – $/bbl” is comprised of condensate sales as determined in accordance with IFRS, divided by the Company’s NGL sales volumes from condensate.
“Average realized oil price – $/bbl” is comprised of oil sales as determined in accordance with IFRS, divided by the Company’s oil sales volumes.
“Average realized price – $/boe” is comprised of natural gas, condensate and oil sales as determined in accordance with IFRS, divided by the Company’s total natural gas, NGL and oil sales volumes (barrels of oil equivalent).
“Dividends per share” is comprised of dividends declared, as determined in accordance with IFRS, divided by the number of shares outstanding at the dividend record date.
“Royalties per boe” is comprised of royalties, as determined in accordance with IFRS, divided by the total natural gas, NGL and oil sales volumes (barrels of oil equivalent).
“Production expenses per boe” is comprised of production expenses, as determined in accordance with IFRS, divided by the total natural gas, NGL and oil sales volumes (barrels of oil equivalent).
BOE Disclosure
The term barrels of oil equivalent (“boe”) may be misleading, particularly if used in isolation. A boe conversion ratio of six thousand cubic feet per barrel (6 Mcf/bbl) of natural gas to barrels of oil equivalence is based on an energy equivalency conversion method primarily applicable at the burner tip and does not represent a value equivalency at the wellhead. All boe conversions in this news release are derived from converting gas to oil in the ratio mix of six thousand cubic feet of gas to one barrel of oil.
Testing and Well Results
Data obtained from the 183-A3 well identified in this press release, including hydrocarbon shows, open-hole logging, net pay and porosities should be considered to be preliminary until testing, detailed analysis and interpretation has been completed. Hydrocarbon shows can be seen during the drilling of a well in numerous circumstances and do not necessarily indicate a commercial discovery or the presence of commercial hydrocarbons in a well. There is no representation by Alvopetro that the data relating to the 183-A3 well contained in this press release is necessarily indicative of long-term performance or ultimate recovery. The reader is cautioned not to unduly rely on such data as such data may not be indicative of future performance of the well or of expected production or operational results for Alvopetro in the future.
Forward-Looking Statements and Cautionary Language
This news release contains forward-looking information within the meaning of applicable securities laws. The use of any of the words “will”, “expect”, “intend” and other similar words or expressions are intended to identify forward-looking information. Forward‐looking statements involve significant risks and uncertainties, should not be read as guarantees of future performance or results, and will not necessarily be accurate indications of whether or not such results will be achieved. A number of factors could cause actual results to vary significantly from the expectations discussed in the forward-looking statements. These forward-looking statements reflect current assumptions and expectations regarding future events. Accordingly, when relying on forward-looking statements to make decisions, Alvopetro cautions readers not to place undue reliance on these statements, as forward-looking statements involve significant risks and uncertainties. More particularly and without limitation, this news release contains forward-looking statements concerning potential net natural gas pay in the 183-A3 well, the timing of competion of the 183-A3 well, anticipated timing of commencing production from the 183-A3 well, expectations regarding future development plans for the Murucututu natural gas field , plans relating to the Company’s operational activities, proposed exploration development activities and the timing for such activities, exploration and development prospects of Alvopetro, capital spending levels, future capital and operating costs, future production and sales volumes, production allocations from the Caburé natural gas field, the expected natural gas price, gas sales and gas deliveries under Alvopetro’s long-term gas sales agreement, anticipated timing for upcoming drilling and testing of other wells, projected financial results, the expected timing and outcomes of certain of Alvopetro’s testing activities, and sources and availability of capital. Forward-looking statements are necessarily based upon assumptions and judgments with respect to the future including, but not limited to, expectations and assumptions concerning the timing of regulatory licenses and approvals, equipment availability, the success of future drilling, completion, testing, recompletion and development activities and the timing of such activities, the performance of producing wells and reservoirs, well development and operating performance, expectations regarding Alvopetro’s working interest and the outcome of any redeterminations, environmental regulation, including regulation relating to hydraulic fracturing and stimulation, the ability to monetize hydrocarbons discovered, the outlook for commodity markets and ability to access capital markets, foreign exchange rates, general economic and business conditions, forecasted demand for oil and natural gas, the impact of global pandemics, weather and access to drilling locations, the availability and cost of labour and services, the regulatory and legal environment and other risks associated with oil and gas operations. The reader is cautioned that assumptions used in the preparation of such information, although considered reasonable at the time of preparation, may prove to be incorrect. Actual results achieved during the forecast period will vary from the information provided herein as a result of numerous known and unknown risks and uncertainties and other factors. In addition, the declaration, timing, amount and payment of future dividends remain at the discretion of the Board of Directors. Although we believe that the expectations and assumptions on which the forward-looking statements are based are reasonable, undue reliance should not be placed on the forward-looking statements because we can give no assurance that they will prove to be correct. Since forward looking statements address future events and conditions, by their very nature they involve inherent risks and uncertainties. Actual results could differ materially from those currently anticipated due to a number of factors and risks. These include, but are not limited to, risks associated with the oil and gas industry in general (e.g., operational risks in development, exploration and production; delays or changes in plans with respect to exploration or development projects or capital expenditures; the uncertainty of reserve estimates; the uncertainty of estimates and projections relating to production, costs and expenses, reliance on industry partners, availability of equipment and personnel, uncertainty surrounding timing for drilling and completion activities resulting from weather and other factors, changes in applicable regulatory regimes and health, safety and environmental risks), commodity price and foreign exchange rate fluctuations, market uncertainty associated with financial institution instability, and general economic conditions. The reader is cautioned that assumptions used in the preparation of such information, although considered reasonable at the time of preparation, may prove to be incorrect. Although Alvopetro believes that the expectations and assumptions on which such forward-looking information is based are reasonable, undue reliance should not be placed on the forward-looking information because Alvopetro can give no assurance that it will prove to be correct. Readers are cautioned that the foregoing list of factors is not exhaustive. Additional information on factors that could affect the operations or financial results of Alvopetro are included in our annual information form which may be accessed on Alvopetro’s SEDAR+ profile at www.sedarplus.ca. The forward-looking information contained in this news release is made as of the date hereof and Alvopetro undertakes no obligation to update publicly or revise any forward-looking information, whether as a result of new information, future events or otherwise, unless so required by applicable securities laws.
All amounts expressed are in U.S. dollars, denominated by “$”
TORONTO–(BUSINESS WIRE)– Largo Inc. (“Largo” or the “Company“) (TSX: LGO) (NASDAQ: LGO) today announces its third quarter 2023 financial results.
Largo Reports Third Quarter 2023 Financial Results; Announces First Commercial Shipment of Ilmenite as By-Product of its Vanadium Operations in Brazil (Photo: Business Wire)
Q3 2023 and Other Highlights
Revenues of $44.0 million vs. revenues of $54.3 million in Q3 2022; Decline driven by lower vanadium prices and lower vanadium sales volumes; Revenues per lb sold3 of V2O5 equivalent of $8.34 vs. $8.80 in Q3 2022
Operating costs of $42.5 million vs. $45.6 million in Q3 2022; Cash operating costs excluding royalties1 per pound sold of $5.44 vs. 4.86 per lb sold in Q3 2022
Net loss of $11.9 million vs. net loss of $2.6 million in Q3 2022; Basic loss per share of $0.19 vs. basic loss per share of $0.04 in Q3 2022
Cash used before working capital items of $4.4 million vs. cash provided before working capital items of $4.3 million in Q3 2022
Cash balance of $39.5 million, net working capital surplus of $91.0 million and debt of $65.0 million exiting Q3 2023
V2O5 equivalent sales of 2,385 tonnes (inclusive of 256 tonnes of purchased material) vs. 2,796 tonnes (inclusive of 351 tonnes of purchased material) sold in Q3 2022
Production of 2,163 tonnes (4.8 million lbs1) of V2O5 vs. 2.906 tonnes in Q3 2022
Largo Clean Energy’s (“LCE”) 6 megawatt-hour (“MWh”) vanadium redox flow battery (“VRFB”) deployment for Enel Green Power España (“EGPE”) was validated to operate on test conditions according to EGPE specifications and LCE test procedures in October
The Company successfully commissioned and is in the process of ramping up production of its new ilmenite concentrate plant with initial production of 350 tonnes in August and 700 tonnes in September; The first commercial shipment of ilmenite is in progress and should contribute to the Company’s revenues in Q4 2023 as a by-product of its vanadium operations
Q3 2023 results conference call: Thursday, November 9th at 1:00 p.m. ET
Vanadium Market Update2
The average benchmark price per lb of V2O5 in Europe was $8.03, a 2.5% decrease from the average of $8.23 seen in Q3 2022
Vanadium spot demand was soft in Q3 2023, primarily due to adverse conditions in the Chinese and European steel industries. However, strong demand growth from the aerospace and energy storage sectors continued
Daniel Tellechea, Director and Interim CEO of Largo commented: “Q3 2023 was a challenging quarter for Largo, primarily due to the tragic accident that occurred at the Company’s chemical plant in July as well as technical delays in commissioning our new crushing plant. The accident at the chemical plant resulted in a capacity bottleneck in the evaporator section of the plant, which resulted in lower overall production rates of vanadium in July and August. In early September, our operating team recommissioned the evaporator circuit, which is now operating at its original capacity. A delay in ramp up of the new magnetic separation crushing plant also temporarily impacted vanadium production in Q3 2023. The new crushing plant was designed to offset the impact of lower mined vanadium grades, as per the Company’s mine plan. The operating team is in the process of resolving these issues, and we are pleased to report that the crushing plant exceeded 1,000 tonnes of contained V2O5 in October, despite additional crushing plant improvements scheduled to be implemented in November and December.”
He continued: “It is our priority to continue to optimize our operations, reduce costs, and achieve production and sales targets safely. In light of this, we maintain our guidance for 2023. Additionally, further measures are being implemented to improve the organization’s performance, including optimizing operational efficiencies through the implementation of the new crushing system, concentrating on increasing production of high purity vanadium, restructuring equipment maintenance processes to further reduce costs, and ramping up ilmenite production starting in the fourth quarter of 2023 to diversify revenues. We are beginning to see a notable reduction in key consumable costs, such as sodium carbonate, as well as ongoing overhead cost reductions through a reduction of the number of contractors at the mine through efficiency improvement programs and further reductions in the headcount at LCE. The Company considers these ongoing initiatives to be a vitally important measures to counter the current decrease in vanadium prices.”
He concluded: “During this past year, we have also made several significant investments that are necessary for the sustainability of our operations in a lower vanadium price environment. Among these investments are an increased waste rock pre-stripping and aggressive infill drilling program to optimize production in the years to come. Our team has successfully built and commissioned an ilmenite plant to diversify future revenues as a by-product of the vanadium mine, built a new magnetic separation crushing plant for the purpose of mining lower-grade material without reducing production levels, and delivered the Company’s first vanadium battery to EGPE, our European energy storage customer. A substantial investment has been made in LCE, which is not yet generating significant revenues, but continues to consume cash. With our current strategic review process in place, Largo expects to optimize the value proposition of LCE and participate in one of the most significant macrotrends, the clean energy transition with vanadium as a critical material. With these investments, we believe that Largo is on the path to a brighter future.”
Financial and Operating Results – Highlights
(thousands of U.S. dollars, except as otherwise stated)
Three months ended
Nine months ended
Sept. 30, 2023
Sept. 30, 2022
Sept. 30, 2023
Sept. 30, 2022
Revenues
43,983
54,258
154,514
181,750
Operating costs
(42,580)
(45,602)
(131,540)
(125,264)
Net income (loss)
(11,884)
(2,601)
(19,057)
13,410
Basic earnings (loss) per share
(0.19)
(0.04)
(0.30)
0.21
Cash (used) provided before working capital items
(4,360)
4,328
7,631
35,479
Cash operating costs excl. royalties3 ($/lb)
5.44
4.86
5.25
4.37
Cash
39,572
62,713
39,572
62,713
Debt
65,000
15,000
65,000
15,000
Total mined – dry basis (tonnes)
6,406,626
4,178,185
11,373,683
7,780,061
Total ore mined (tonnes)
447,165
351,450
1,279,024
1,033,375
Effective grade4 of ore milled (%)
0.94
1.28
1.04
1.32
V2O5 equivalent produced (tonnes)
2,163
2,906
6,913
8,432
Q3 2023 Notes
The decrease in operating costs in Q3 2023 is largely attributable to lower overall sales in the period, which includes a reduction in the sale of purchased products and lower royalties due to lower sales.
V2O5 equivalent production of 2,163 tonnes in Q3 2023 decreased from 2,639 tonnes produced in Q2 2023. Production in July 2023 was 644 tonnes, with 775 tonnes produced in August and 744 tonnes produced in September, for a total of 2,163 tonnes of V2O5 equivalent produced. July and August production were negatively impacted as a result of the chemical plant operating at limited capacity due to the accident in the evaporation section of the plant in July 2023. In addition, September production was negatively impacted by low availability of the crushing circuit, combined with the planned lower vanadium grade of ore mined. V2O5 production in October continued to improve with 866 tonnes produced.
The Company is actively working to achieve higher levels of operational stability to better manage its costs which have increased due in part to lower grades of ore mined as compared with prior quarters. The lower grade of ore mined in Q3 2023 was according to plan, representing a 27% decrease year-over-year. The Company is actively working towards increasing the availability of its new crushing system to offset lowers grades of ore mined and reach production of 1,000 tonnes of V2O5 per month in future months.
Total mined (dry basis) of 6.4 million tonnes increased by 53% and total ore mined of 447,165 tonnes was 27% higher than Q3 2022, respectively. Increased mining rates and higher mining costs impacted the Company’s financial performance in Q3 2023.
As part of its ongoing mitigation efforts, the Company is focused on reducing its fixed cost structure through contract renegotiations and an optimization of key operational areas, including mining, maintenance, equipment rental and consumables.
The commissioning and ramp up of the ilmenite plant commenced in Q3 2023 with production of 350 tonnes in August and 700 tonnes in September. The Company expects the ramp up to conclude in Q2 2024 with revenue expectations in Q4 2023.
Exploration and evaluation costs of $2.3 million increased by $1.8 million from Q3 2022. This was driven by infill drilling and geological model work at the Maracás Menchen Mine and diamond drilling at Campo Alegre de Lourdes to support the maintenance of the Company’s mineral rights. During Q3 2023, the Company completed approximately 9,100 metres of diamond drilling in the near mine deep drilling and exploration program. In the nine months ended September 30, 2023, approximately 19,100 metres of diamond drillholes have been completed in Campo Alegre de Lourdes and Maracas targets. A re-assay program began in Q2 2023 to perform chemical analysis on previously interpreted results. The focus of this program is to increase measured and indicated resources. Approximately 5,000 samples were prepared and sent to the external laboratory for analysis in Q3 2023.
The information provided within this release should be read in conjunction with Largo’s unaudited condensed interim consolidated financial statements for the three and nine months ended September 30, 2023 and 2022 and its management’s discussion and analysis (“MD&A”) for the three and nine months ended September 30, 2023 which are available on our website at www.largoinc.com or on the Company’s respective profiles at www.sedarplus.com and www.sec.gov.
About Largo
Largo is a globally recognized vanadium company known for its high-quality VPURE™ and VPURE+™ products, sourced from its Maracás Menchen Mine in Brazil. The Company is currently focused on implementing an ilmenite concentrate plant and is undertaking a strategic evaluation of its U.S.-based clean energy business, including its advanced VCHARGE vanadium battery technology to maximize the value of the organization. Largo’s strategic business plan centers on maintaining its position as a leading vanadium supplier with a growth strategy to support a low-carbon future.
Largo’s common shares trade on the Nasdaq Stock Market and on the Toronto Stock Exchange under the symbol “LGO”. For more information on the Company, please visit www.largoinc.com.
This press release contains “forward-looking information” and “forward-looking statements” within the meaning of applicable Canadian and United States securities legislation. Forward-looking information in this press release includes, but is not limited to, statements with respect to the timing and amount of estimated future production and sales; the future price of commodities; costs of future activities and operations, including, without limitation, achieving operational stability and managing unit costs; and the expected completion of the ilmenite plan ramp up in Q4 2023.
The following are some of the assumptions upon which forward-looking information is based: that general business and economic conditions will not change in a material adverse manner; demand for, and stable or improving price of V2O5, other vanadium products, ilmenite and titanium dioxide pigment; receipt of regulatory and governmental approvals, permits and renewals in a timely manner; that the Company will not experience any material accident, labour dispute or failure of plant or equipment or other material disruption in the Company’s operations at the Maracás Menchen Mine or relating to Largo Clean Energy; the availability of financing for operations and development; the availability of funding for future capital expenditures; the ability to replace current funding on terms satisfactory to the Company; the ability to mitigate the impact of heavy rainfall; the reliability of production, including, without limitation, access to massive ore, the Company’s ability to procure equipment, services and operating supplies in sufficient quantities and on a timely basis; that the estimates of the resources and reserves at the Maracás Menchen Mine are within reasonable bounds of accuracy (including with respect to size, grade and recovery and the operational and price assumptions on which such estimates are based); the accuracy of the Company’s mine plan at the Maracás Menchen Mine, the competitiveness of the Company’s vanadium redox flow battery (“VRFB“) technology; the ability to obtain funding through government grants and awards for the Green Energy sector, the accuracy of cost estimates and assumptions on future variations of VCHARGE battery system design, that the Company’s current plans for ilmenite and VRFBs can be achieved; the Company’s “two-pillar” business strategy will be successful; the Company’s sales and trading arrangements will not be affected by the evolving sanctions against Russia; and the Company’s ability to attract and retain skilled personnel and directors; the ability of management to execute strategic goals.
Forward-looking statements can be identified by the use of forward-looking terminology such as “plans”, “expects” or “does not expect”, “is expected”, “budget”, “scheduled”, “estimates”, “forecasts”, “intends”, “anticipates” or “does not anticipate”, or “believes”, or variations of such words and phrases or statements that certain actions, events or results “may”, “could”, “would”, “might” or “will be taken”, “occur” or “be achieved”. All information contained in this news release, other than statements of current and historical fact, is forward looking information. Forward-looking statements are subject to known and unknown risks, uncertainties and other factors that may cause the actual results, level of activity, performance or achievements of Largo to be materially different from those expressed or implied by such forward-looking statements, including but not limited to those risks described in the annual information form of Largo and in its public documents filed on www.sedarplus.caand available on www.sec.govfrom time to time. Forward-looking statements are based on the opinions and estimates of management as of the date such statements are made. Although management of Largo has attempted to identify important factors that could cause actual results to differ materially from those contained in forward-looking statements, there may be other factors that cause results not to be as anticipated, estimated or intended. There can be no assurance that such statements will prove to be accurate, as actual results and future events could differ materially from those anticipated in such statements. Accordingly, readers should not place undue reliance on forward-looking statements. Largo does not undertake to update any forward-looking statements, except in accordance with applicable securities laws. Readers should also review the risks and uncertainties sections of Largo’s annual and interim MD&A which also apply.
Trademarks are owned by Largo Inc.
Non-GAAP5 Measures
The Company uses certain non-GAAP measures in this press release, which are described in the following section. Non-GAAP financial measures and non-GAAP ratios are not standardized financial measures under IFRS, the Company’s GAAP, and might not be comparable to similar financial measures disclosed by other issuers. These measures are intended to provide additional information and should not be considered in isolation or as a substitute for measures of performance prepared in accordance with IFRS.
Revenues Per Pound
This press release refers to revenues per pound sold, a non-GAAP performance measure that is used to provide investors with information about a key measure used by management to monitor performance of the Company.
This measure, along with cash operating costs and total cash costs, is considered to be one of the key indicators of the Company’s ability to generate operating earnings and cash flow from its Maracás Menchen Mine and sales activities. This revenues per pound measure does not have any standardized meaning prescribed by IFRS and differs from measures determined in accordance with IFRS. This measure is intended to provide additional information and should not be considered in isolation or as a substitute for measures of performance prepared in accordance with IFRS. This measure is not necessarily indicative of net earnings or cash flow from operating activities as determined under IFRS.
The following table provides a reconciliation of this measure per pound sold to revenues as per the Q3 2022 unaudited condensed interim consolidated financial statements.
Three months ended
Nine months ended
September 30, 2023
September 30, 2022
September 30, 2023
September 30, 2022
Revenues – V2O5 produced1
$
25,268
$
30,831
$
90,352
$
98,621
V2O5 sold – produced (000s lb)
3,017
3,745
9,898
10,824
V2O5 revenues per pound of V2O5 sold – produced ($/lb)
$
8.38
$
8.23
$
9.13
$
9.11
Revenues – V2O5 purchased1
$
2,066
$
1,655
$
7,531
$
3,184
V2O5 sold – purchased (000s lb)
309
207
1,014
339
V2O5 revenues per pound of V2O5 sold – purchased ($/lb)
$
6.69
$
8.00
$
7,43
$
9.39
Revenues – V2O51
$
27,334
$
32,486
$
97,883
$
101,805
V2O5 sold (000s lb)
3,326
3,952
10,912
11,163
V2O5 revenues per pound of V2O5 sold ($/lb)
$
8.22
$
8.22
$
8.97
$
9.12
Revenues – V2O3 produced1
$
3,734
$
3,798
$
7,575
$
3,798
V2O3 sold – produced (000s lb)
308
308
619
308
V2O3 revenues per pound of V2O3 sold – produced ($/lb)
$
12.12
$
12.33
$
12.24
$
12.33
Revenues – V2O3 purchased1
$
—
$
482
$
1,155
$
482
V2O3 sold – purchased (000s lb)
—
43
88
43
V2O3 revenues per pound of V2O3 sold – purchased ($/lb)
$
—
$
11.21
$
13.13
$
11.21
Revenues – V2O31
$
3,734
$
4,280
$
8,730
$
4,280
V2O3 sold (000s lb)
308
350
707
350
V2O3 revenues per pound of V2O3 sold ($/lb)
$
12.12
$
12.23
$
12.35
$
12.23
Revenues – FeV produced1
$
11,750
$
12,756
$
46,408
$
54,667
FeV sold – produced (000s kg)
444
394
1,591
1,576
FeV revenues per kg of FeV sold – produced ($/kg)
$
26.46
$
32.38
$
29.17
$
34.69
Revenues – FeV purchased1
$
1,058
$
4,736
$
1,386
$
20,998
FeV sold – purchased (000s kg)
39
159
50
516
FeV revenues per kg of FeV sold – purchased ($/kg)
$
27.13
$
29.79
$
27.72
$
40.69
Revenues – FeV1
$
12,808
$
17,492
$
47,794
$
75,665
FeV sold (000s kg)
483
553
1,641
2,092
FeV revenues per kg of FeV sold ($/kg)
$
26.52
$
31.63
$
29,12
$
36.17
Revenues1
$
43,876
$
54,258
$
154,407
$
181,750
V2O5 equivalent sold (000s lb)
5,259
6,164
17,177
18,340
Revenues per pound sold ($/lb)
$
8.34
$
8.80
$
8.99
$
9.91
1. As per note 18 of the Company’s Q3 2023 unaudited condensed interim consolidated financial statements.
Cash Operating Costs Per Pound
The Company’s MD&A refers to cash operating costs per pound and cash operating costs excluding royalties per pound, which are non-GAAP ratios based on cash operating costs and cash operating costs excluding royalties, which are non-GAAP financial measures, in order to provide investors with information about a key measure used by management to monitor performance. This information is used to assess how well the Maracás Menchen Mine is performing compared to plan and prior periods, and also to assess its overall effectiveness and efficiency.
Cash operating costs includes mine site operating costs such as mining costs, plant and maintenance costs, sustainability costs, mine and plant administration costs, royalties and sales, general and administrative costs (all for the Mine properties segment), but excludes depreciation and amortization, share-based payments, foreign exchange gains or losses, commissions, reclamation, capital expenditures and exploration and evaluation costs. Operating costs not attributable to the Mine properties segment are also excluded, including conversion costs, product acquisition costs, distribution costs and inventory write-downs.
Cash operating costs excluding royalties is calculated as cash operating costs less royalties. Cash operating costs per pound and cash operating costs excluding royalties per pound are obtained by dividing cash operating costs and cash operating costs excluding royalties, respectively, by the pounds of vanadium equivalent sold that were produced by the Maracás Menchen Mine. Cash operating costs, cash operating costs excluding royalties, cash operating costs per pound and cash operating costs excluding royalties per pound, along with revenues, are considered to be key indicators of the Company’s ability to generate operating earnings and cash flow from its Maracás Menchen Mine. These measures differ from measures determined in accordance with IFRS, and are not necessarily indicative of net earnings or cash flow from operating activities as determined under IFRS.
The following table provides a reconciliation of cash operating costs and cash operating costs excluding royalties, cash operating costs per pound and cash operating costs excluding royalties per pound for the Maracás Menchen Mine to operating costs as per the Q3 2023 unaudited condensed interim consolidated financial statements.
Three months ended
Nine months ended
September 30, 2023
September 30, 2022
September 30, 2023
September 30, 2022
Operating costsi
$
42,580
$
45,602
$
131,540
$
125,264
Professional, consulting and management feesii
747
1,181
2,215
3,784
Other general and administrative expensesiii
408
383
1,032
859
Less: iron ore costsi
(145
)
(200
)
(638
)
(637
)
Less: conversion costsi
(1,413
)
(1,655
)
(5,551
)
(5,839
)
Less: product acquisition costsi
(5,449
)
(7,248
)
(13,380
)
(20,651
)
Less: distribution costsi
(2,202
)
(2,581
)
(6,174
)
(6,887
)
Less: inventory write-downiv
(978
)
(1,655
)
(1,661
)
(1,655
)
Less: depreciation and amortization expensei
(6,003
)
(5,111
)
(19,456
)
(14,923
)
Cash operating costs
27,545
28,716
87,927
79,315
Less: royalties1
(2,024
)
(2,497
)
(6,919
)
(8,264
)
Cash operating costs excluding royalties
25,521
26,219
81,008
71,050
Produced V2O5 sold (000s lb)
4,693
5,390
15,434
16,272
Cash operating costs per pound ($/lb)
$
5.87
$
5.33
$
5.70
$
4.87
Cash operating costs excluding royalties per pound ($/lb)
$
5.44
$
4.86
$
5.25
$
4.37
i. As per note 19 of the Company’s Q3 2023 unaudited condensed interim consolidated financial statements.
ii. As per the Mine properties segment in note 15 of the Company’s Q3 2023 unaudited condensed interim consolidated financial statements.
iii. As per the Mine properties segment in note 15 of the Company’s Q3 2023 unaudited condensed interim consolidated financial statements less the increase in legal provisions of $0.4 million (Q3 2023) and $0.8 million (nine months ended September 30, 2023) as noted in the “other general and administrative expenses” section on page 6 of the Company’s Q3 2023 management discussion and analysis.
iv. As per notes 5 and 19 of the Company’s Q3 2023 unaudited condensed interim consolidated financial statements for purchased finished products.
____________________________ 1 Conversion of tonnes to pounds, 1 tonne = 2,204.62 pounds or lbs. 2 Fastmarkets Metal Bulletin. 3 The cash operating costs excluding royalties and revenues per pound per pound sold are reported on a non-GAAP basis. Refer to the “Non-GAAP Measures” section of this press release. Revenues per pound sold are calculated based on the quantity of V2O5 sold during the stated period. 4 Effective grade represents the percentage of magnetic material mined multiplied by the percentage of V2O5 in the magnetic concentrate 5 GAAP – Generally Accepted Accounting Principles
Investor Relations Alex Guthrie Senior Manager, External Relations +1.416.861.9778 aguthrie@largoinc.com