Alvopetro Announces 33% Increase In Quarterly Dividend To US$0.08 Per Share, Year-End 2021 Financial Results, Filing Of Annual Information Form And An Operational Update
Research, News, and Market Data on Alvopetro Energy
CALGARY, AB, March 17, 2022 /CNW/ – Alvopetro Energy Ltd. (TSXV:ALV) (OTCQX: ALVOF) announces a US$0.08 per common share dividend, our year-end 2021 financial results, filing of our annual information form and an operational update.
All references herein to $ refer to United States dollars, unless otherwise stated and all tabular amounts are in thousands of United States dollars, except as otherwise noted.
President and CEO, Corey Ruttan commented:
“With ongoing strong performance from our Caburé project, along with the recent increase in our realized natural gas pricing to US$11.28/Mcf, we are pleased to announce a 33% increase in our quarterly dividend. We continue to target a balanced and disciplined stakeholder return and organic growth model and on March 2, 2022, we commenced our 2022 drilling campaign targeting the first of two, high-impact, conventional natural gas exploration prospects.”
Dividend
Alvopetro announces that our Board of Directors has declared a quarterly dividend of $0.08 per common share, payable in cash on April 14, 2022, to shareholders of record at the close of business on March 31, 2022. This dividend is designated as an “eligible dividend” for Canadian income tax purposes. Alvopetro’s cash flows are linked to US dollars and as such, dividends are being paid in US dollars.
Dividend payments to non-residents of Canada will be subject to withholding taxes at the Canadian statutory rate of 25%. Shareholders may be entitled to a reduced withholding tax rate under a tax treaty between their country of residence and Canada. For further information, see Alvopetro’s website at https://alvopetro.com/Dividends-Non-resident-Shareholders.
Operational Update
Our average daily sales have continued at consistent rates following our fourth quarter 2021 average of 2,432 boepd, averaging 2,509 boepd in January 2022 and 2,479 boepd in February 2022. Effective February 1, 2022, our natural gas price increased 48% to BRL1.94/m3 ($11.28/Mcf based on our average heat content and the average February 2022 BRL/USD foreign exchange rate of 5.1966). Our new contracted price is effective for all natural gas sales from February 1 to July 31, 2022.
On March 2, 2022, we spud our 182-C1 well on Block 182, the first of two conventional natural gas exploration wells planned for 2022. We anticipate the well will take approximately 42 days to drill and thereafter the rig will move to the 183-B1 well on the adjacent Block 183. Following these two wells, we plan to drill our first fit-for-purpose Murucututu development well.
We have now completed construction of our Murucututu pipeline and are currently installing field production facilities. We expect our 183(1) well to be tied-in and on production in the second quarter.
December 31, 2021 Reserves and Net Asset Value
On March 8, 2022, Alvopetro announced its December 31, 2021 reserves based upon the independent reserve assessment and evaluation prepared by GLJ Ltd. (“GLJ”) dated March 7, 2022 with an effective date of December 31, 2021 (the “GLJ Reserves and Resources Report”). The GLJ Report assigned total proved plus probable (“2P”) reserves of 8.7 MMboe and a before tax value discounted at 10% of $297.0 million. Following this evaluation and based on updated year-end 2021 financial results, the Company’s net asset value based on its 2P reserves is $299.6 million, reflecting CAD$11.18 per common share. The GLJ Reserves and Resources Report also included an assessment of the Murucututu natural gas resource which has not been reflected in the table below, with risked best estimate contingent resource of 3.5 MMboe and risked best estimate prospective resource of 12.1 MMboe (before tax net present value, discounted at 10% of $60.7 million and $208.7 million, respectively).
|
Base Net Asset Value (in $000s, other than per share amounts)
|
Total Proved
|
Total Proved plus Probable
|
Total Proved plus Probable plus Possible
|
|
Before Tax Net Present Value(a), discounted at 10%
|
173,759
|
297,000
|
416,723
|
|
Working capital, net of debt – as of December 31, 2021(b)
|
2,552
|
2,552
|
2,552
|
|
Total Base Net Asset Value (b)(c)(d)
|
176,311
|
299,552
|
419,275
|
|
CAD$ per basic share(e)
|
6.58
|
11.18
|
15.65
|
|
(a)
|
See “Oil and Natural Gas Reserves” section within this new release
|
|
(b)
|
See “Non-GAAP and Other Financial Measures” section within this new release
|
|
(c)
|
Alvopetro has reflected the contractual obligations pursuant to our September 2018 Gas Treatment Agreement with Enerflex, including the equipment rental component of the agreement which is treated as a right of use asset and reflected as a capital lease obligation on our financial statements. As the future capital lease payments reduce the forecasted future net revenue in all reserves categories, the capital lease obligation as reflected on the Company’s financial statements has not been included in the table above.
|
|
(d)
|
The net asset value reflected above includes the present value of before tax cash flows from the Company’s reserves only. No amounts have been included with respect to contingent or prospective resource volumes.
|
|
(e)
|
Converted to CAD$ based on the exchange rate on March 17, 2022. The per share calculation is computed based on 33.9 million common shares outstanding as of March 17, 2022.
|
Financial and Operating Highlights – Fourth Quarter of 2021
- Our daily sales averaged 2,432 boepd in Q4 2021, a 25% increase from the Q4 2020 average of 1,950 boepd and a 1% decrease from the Q3 2021 average of 2,459 boepd. In Q4 2021, 95.7% of our sales volumes were from natural gas with 4.2% from NGLs from condensate and the remainder from crude oil sales.
- Our operating netback of $36.38 per boe in Q4 2021 improved 30% from Q4 2020 due to an increase in our realized natural gas price and improved commodity prices overall, offset by increased royalties. The current quarter’s netback was consistent with Q3 2021.
- We reported net income of $2.6 million, compared to $2.8 million in Q4 2020 and $1.5 million in Q3 2021.
- We generated funds flow from operations in Q4 2021 of $6.5 million ($0.19 per basic share and $0.18 per diluted share) and cash flows from operating activities of $7.1 million ($0.21 per basic share and $0.20 per diluted share).
- Capital expenditures totaled $1.5 million, focused on our Murucututu/Gomo pipeline extension.
- We declared our second dividend of $0.06 per share to shareholders of record on December 30, 2021. Total dividends of $2.0 million were paid on January 14, 2022.
- As at December 31, 2021, we had a net working capital surplus of $9.1 million, including $11.5 million in cash and cash equivalents. The Company’s working capital net of our credit facility balance of $6.5 million improved to $2.6 million, compared to $0.3 million as of September 30, 2021. In February 2022, we repaid an additional $1.5 million of our Credit Facility, bringing the outstanding balance to $5.0 million.
Financial and Operating Highlights – Year-End 2021
- Our annual sales averaged 2,358 boepd (95.5% natural gas, 4.4% NGLs from condensate and marginal crude oil production).
- We recognized net income of $6.6 million, compared to $5.7 million in 2020.
- We generated funds flow from operations of $24.6 million ($0.74 per basic share on $0.71 per diluted share) compared to $6.2 million in 2020 ($0.19 per basic share and $0.18 per diluted share).
- Capital expenditures totaled $4.5 million, focused on our Murucututu pipeline extension and our initial costs for our planned 2022 exploration program.
- We completed a share restructuring in September 2021, involving a share repurchase and a consolidation resulting in a reduction in our common shares outstanding from 99.8 million to 32.9 million immediately following the restructuring.
- We commenced quarterly dividend payments of $0.06/share, with dividends declared to shareholders of record on September 29, 2021 and December 30, 2021.
The following table provides a summary of Alvopetro’s financial and operating results for periods noted. The consolidated financial statements with the Management’s Discussion and Analysis (“MD&A”) are available on our website at www.alvopetro.com and will be available on the System for Electronic Document Analysis and Retrieval (SEDAR) website at www.sedar.com.
|
As at and Three MonthsEnded December 31,
|
Year EndedDecember 31,
|
|
2021
|
2020
|
Change (%)
|
2021
|
2020
|
|
Financial
|
|
|
|
|
|
|
($000s, except where noted)
|
|
|
|
|
|
|
Natural gas, oil and condensate sales
|
9,896
|
5,887
|
68
|
34,980
|
11,308
|
|
Net income
|
2,575
|
2,754
|
(6)
|
6,614
|
5,706
|
|
Per share – basic ($)
|
0.08
|
0.08
|
–
|
0.20
|
0.17
|
|
Per share – diluted ($)(1)
|
0.07
|
0.08
|
(13)
|
0.19
|
0.16
|
|
Cash flow from operating activities
|
7,088
|
3,124
|
127
|
24,291
|
3,061
|
|
Per share – basic ($)
|
0.21
|
0.09
|
133
|
0.73
|
0.09
|
|
Per share – diluted ($)(1)
|
0.20
|
0.09
|
122
|
0.70
|
0.09
|
|
Funds flow from operations (2)
|
6,480
|
4,252
|
52
|
24,637
|
6,216
|
|
Per share – basic ($)
|
0.19
|
0.13
|
46
|
0.74
|
0.19
|
|
Per share – diluted ($)(1)
|
0.18
|
0.13
|
38
|
0.71
|
0.18
|
|
Capital expenditures(3)
|
1,470
|
452
|
225
|
4,513
|
3,814
|
|
Total assets
|
81,231
|
80,388
|
1
|
81,231
|
80,388
|
|
Cash and cash equivalents
|
11,469
|
5,159
|
122
|
11,469
|
5,159
|
|
Net working capital surplus (2)
|
9,097
|
5,539
|
64
|
9,097
|
5,539
|
|
Working capital, net of debt (net debt)(2)
|
2,552
|
(9,884)
|
126
|
2,552
|
(9,884)
|
|
Weighted average shares outstanding (000s)
|
|
|
|
|
|
|
Basic
|
33,824
|
33,086
|
2
|
33,103
|
32,871
|
|
Diluted (1)
|
35,986
|
33,557
|
7
|
34,928
|
35,145
|
|
Operations
|
|
|
|
|
|
|
Natural gas, crude oil and natural gas liquids sales:
|
|
|
|
|
|
|
Natural gas (Mcfpd)
|
13,966
|
11,163
|
25
|
13,517
|
5,346
|
|
NGLs – condensate (bopd)
|
103
|
89
|
16
|
103
|
44
|
|
Oil (bopd)
|
2
|
–
|
–
|
2
|
5
|
|
Total (boepd)
|
2,432
|
1,950
|
25
|
2,358
|
940
|
|
|
|
|
|
|
|
Average realized prices(2):
|
|
|
|
|
|
|
Natural gas ($/Mcf)
|
7.07
|
5.36
|
32
|
6.50
|
5.36
|
|
NGL – condensate ($/bbl)
|
84.36
|
46.97
|
80
|
75.89
|
46.57
|
|
Oil ($/bbl)
|
76.47
|
–
|
–
|
63.61
|
36.81
|
|
Company total ($/boe)
|
44.22
|
32.82
|
35
|
40.64
|
32.88
|
|
|
|
|
|
|
|
Operating netback ($/boe) (2)
|
|
|
|
|
|
|
Realized sales price
|
44.22
|
32.82
|
35
|
40.64
|
32.88
|
|
Royalties
|
(4.22)
|
(1.51)
|
179
|
(3.61)
|
(2.15)
|
|
Production expenses
|
(3.62)
|
(3.39)
|
7
|
(3.64)
|
(3.88)
|
|
Operating netback
|
36.38
|
27.92
|
30
|
33.39
|
26.85
|
|
|
|
|
|
|
|
Notes:
|
|
|
(1)
|
The weighted average number of diluted common shares outstanding in the computation of funds flow from operations and cash flows from operating activities per share is the same as for net income per share.
|
|
(2)
|
See “Non-GAAP and Other Financial Measures” section within this news release.
|
|
(3)
|
Includes non-cash capital expenditures of $0.4 million for the year-ended December 31, 2020.
|
2021 Results Webcast
Alvopetro will host a live webcast to discuss the 2021 financial results at 8:00 am Mountain time on March 18, 2022. Details for joining the event are as follows:
DATE: March 18, 2022TIME: 8:00 AM Mountain/10:00 AM EasternLINK: https://zoom.us/j/99386897923 DIAL-IN NUMBERS: https://zoom.us/u/aixrWbAbO WEBINAR ID: 993 8689 7923
The webcast will include a question and answer period. Online participants will be able to ask questions through the Zoom portal. Dial-in participants can email questions directly to [email protected].
Corporate Presentation
Alvopetro’s updated corporate presentation is available on our website at:
http://www.alvopetro.com/corporate-presentation.
Social Media
Follow Alvopetro on our social media channels at the following links:
Twitter – https://twitter.com/AlvopetroEnergy Instagram – https://www.instagram.com/alvopetro/ LinkedIn – https://www.linkedin.com/company/alvopetro-energy-ltd
Alvopetro Energy Ltd.’s vision is to become a leading independent upstream and midstream operator in Brazil. Our strategy is to unlock the on-shore natural gas potential in the state of Bahia in Brazil, building off the development of our Caburé natural gas field and our strategic midstream infrastructure.
Neither the TSX Venture Exchange nor its Regulation Services Provider (as that term is defined in the policies of the TSX Venture Exchange) accepts responsibility for the adequacy or accuracy of this news release.
All amounts contained in this new release are in United States dollars, unless otherwise stated and all tabular amounts are in thousands of United States dollars, except as otherwise noted.
|
Abbreviations:
|
|
|
|
|
2P
|
=
|
proved plus probable reserves
|
|
boepd
|
=
|
barrels of oil equivalent (“boe”) per day
|
|
bopd
|
=
|
barrels of oil and/or natural gas liquids (condensate) per day
|
|
BRL
|
=
|
Brazilian Real
|
|
CAD$
|
=
|
Canadian dollars
|
|
m3
|
=
|
cubic metre
|
|
Mboe
|
=
|
thousand barrels of oil equivalent
|
|
MMboe
|
=
|
million barrels of oil equivalent
|
|
Mcf
|
=
|
thousand cubic feet
|
|
MMcf
|
=
|
million cubic feet
|
|
MMcfpd
|
=
|
million cubic feet per day
|
|
NGLs
|
=
|
natural gas liquids
|
|
Q3 2021
|
=
|
three months ended September 30, 2021
|
|
Q4 2020
|
=
|
three months ended December 31, 2020
|
|
Q4 2021
|
=
|
three months ended December 31, 2021
|
Oil and Natural Gas Reserves
The disclosure in this news release summarizes certain information contained in the GLJ Reserves and Resources Report but represents only a portion of the disclosure required under NI 51-101. For additional details, see our news release dated March 8, 2022. Full disclosure with respect to the Company’s reserves as at December 31, 2021 is contained in the Company’s annual information form for the year ended December 31, 2021 which has been filed on SEDAR (www.sedar.com). All net present values in this press release are based on estimates of future operating and capital costs and GLJ’s forecast prices as of December 31, 2021. The reserves definitions used in this evaluation are the standards defined by the Canadian Oil and Gas Evaluation Handbook (COGEH) reserve definitions and are consistent with NI 51-101 and used by GLJ. The net present values of future net revenue attributable to the Alvopetro’s reserves estimated by GLJ do not represent the fair market value of those reserves. Other assumptions and qualifications relating to costs, prices for future production and other matters are summarized herein. The recovery and reserve estimates of the Company’s reserves provided herein are estimates only and there is no guarantee that the estimated reserves will be recovered. Actual reserves may be greater than or less than the estimates provided herein. Possible reserves are those additional reserves that are less certain to be recovered than probable reserves. There is a 10% probability that the quantities actually recovered will equal or exceed the sum of proved plus probable plus possible reserves.
Contingent Resources
This news release discloses estimates of Alvopetro’s contingent resources and the net present value associated with net revenues associated with the production of such contingent resources as included in the GLJ Reserves and Resources Report. There is no certainty that it will be commercially viable to produce any portion of such contingent resources and the estimated future net revenues do not necessarily represent the fair market value of such contingent resources. Estimates of contingent resources involve additional risks over estimates of reserves. For additional details with respect to Alvopetro’s contingent resources evaluated as at December 31, 2021, see our news release dated March 8, 2022 and additional details contained in the Company’s annual information form for the year ended December 31, 2021 which has been filed on SEDAR (www.sedar.com).
Prospective Resources
This news release discloses estimates of Alvopetro’s prospective resources included in the GLJ Reserves and Resources Report. There is no certainty that any portion of the prospective resources will be discovered and even if discovered, there is no certainty that it will be commercially viable to produce any portion. Estimates of prospective resources involve additional risks over estimates of reserves. The accuracy of any resources estimate is a function of the quality and quantity of available data and of engineering interpretation and judgment. While resources presented herein are considered reasonable, the estimates should be accepted with the understanding that reservoir performance subsequent to the date of the estimate may justify revision, either upward or downward. For additional details with respect to Alvopetro’s prospective resources evaluated as at December 31, 2021, see our news release dated March 8, 2022 and additional details contained in the Company’s annual information form for the year ended December 31, 2021 which has been filed on SEDAR (www.sedar.com).
Non-GAAP and Other Financial Measures
This news release contains references to various non-GAAP financial measures, non-GAAP ratios, capital management measures and supplementary financial measures as such terms are defined in National Instrument 52-112 Non-GAAP and Other Financial Measures Disclosure. Such measures are not recognized measures under GAAP and do not have a standardized meaning prescribed by IFRS and might not be comparable to similar financial measures disclosed by other issuers. While these measures may be common in the oil and gas industry, the Company’s use of these terms may not be comparable to similarly defined measures presented by other companies. The non-GAAP and other financial measures referred to in this report should not be considered an alternative to, or more meaningful than measures prescribed by IFRS and they are not meant to enhance the Company’s reported financial performance or position. These are complementary measures that are used by management in assessing the Company’s financial performance, efficiency and liquidity and they may be used by investors or other users of this document for the same purpose. Below is a description of the non-GAAP financial measures, non-GAAP ratios, capital management measures and supplementary financial measures used in this news release. For more information with respect to financial measures which have not been defined by GAAP, including reconciliations to the closest comparable GAAP measure, see the “Non-GAAP Measures and Other Financial Measures” section of the Company’s MD&A which may be accessed through the SEDAR website at www.sedar.com.
Non-GAAP Financial Measures
Operating netback
Operating netback is calculated as natural gas, oil and condensate revenues less royalties and production expenses. This calculation is provided in the “Operating Netback” section of the Company’s MD&A using our IFRS measures. The Company’s MD&A may be accessed through the SEDAR website at SEDAR website at www.sedar.com. Operating netback is a common metric used in the oil and gas industry used to demonstrate profitability from operations.
Net Asset Value
Net asset value is calculated as the net present value of the Company’s 2P reserves discounted at 10% (before-tax) plus the Company’s working capital net of debt as of December 31, 2021. Working capital net of debt is a capital management measure described in further detail below The Company uses net asset value as a way to reflect the Company’s aggregate value of oil and gas reserves and working capital net of debt.
Non-GAAP Financial Ratios
Operating netback per boe
Operating netback is calculated on a per unit basis, which is per barrel of oil equivalent (“boe”). It is a common non-GAAP measure used in the oil and gas industry and management believes this measurement assists in evaluating the operating performance of the Company. It is a measure of the economic quality of the Company’s producing assets and is useful for evaluating variable costs as it provides a reliable measure regardless of fluctuations in production. Alvopetro calculated operating netback per boe as operating netback divided by total sales volumes (barrels of oil equivalent). This calculation is provided in the “Operating Netback” section of the Company’s MD&A using our IFRS measures. The Company’s MD&A may be accessed through the SEDAR website at SEDAR website at www.sedar.com. Operating netback is a common metric used in the oil and gas industry used to demonstrate profitability from operations on a per unit basis (boe).
Funds Flow from Operations Per Share
Funds flow from operations per share is a non-GAAP ratio that includes all cash generated from operating activities and is calculated before changes in non-cash working capital, divided by the weighted the weighted average shares outstanding for the respective period. For the periods reported in this news release the cash flows from operating activities per share and funds flow from operations per share is as follows:
|
Three Months Ended
December 31,
|
Year Ended
December 31,
|
|
$ per share
|
2021
|
2020
|
2021
|
2020
|
|
Per basic share:
|
|
|
|
|
|
Cash flows from operating activities
|
0.21
|
0.09
|
0.73
|
0.09
|
|
Funds flow from operations
|
0.19
|
0.13
|
0.74
|
0.19
|
|
|
|
|
|
|
Per diluted share:
|
|
|
|
|
|
Cash flows from operating activities
|
0.20
|
0.09
|
0.70
|
0.09
|
|
Funds flow from operations
|
0.18
|
0.13
|
0.71
|
0.18
|
Net Asset Value Per Share
Net asset value is calculated as the net asset value (discussed above) divided by the total shares outstanding, which is 33,903,629 as of the date of this news release. Net asset value per share is stated in CAD$ using the March 17, 2022 USD/CAD exchange rate of 1.265. The Company uses net asset value per share as a way to reflect the Company’s aggregate value of oil and gas reserves and working capital net of debt on a per share basis.
Capital Management Measures
Funds Flow from Operations
Funds flow from operations is a non-GAAP capital management measure that includes all cash generated from operating activities and is calculated before changes in non-cash working capital. The most comparable GAAP measure to funds flow from operations is cash flows from operating activities. Management considers both funds flow from operations important as it helps evaluate financial performance and demonstrates the Company’s ability to generate sufficient cash to fund future growth opportunities. Funds flow from operations should not be considered an alternative to, or more meaningful than, cash flows from operating activities however management finds that the impact of working capital items on the cash flows reduces the comparability of the metric from period to period. A reconciliation of funds flow from operations to cash flows from operating activities is as follows:
|
Three Months Ended
December 31,
|
Year Ended
December 31,
|
|
2021
|
2020
|
2021
|
2020
|
|
Cash flows from operating activities
|
7,088
|
3,124
|
24,291
|
3,061
|
|
Add back changes in non-cash working capital
|
(608)
|
1,128
|
346
|
3,155
|
|
Funds flow from operations
|
6,480
|
4,252
|
24,637
|
6,216
|
Net Working Capital
Net working capital is computed as current assets less current liabilities. Net working capital is a measure of liquidity, is used to evaluate financial resources, and is calculated as follows:
|
|
As at December 31,
|
|
|
2021
|
2020
|
|
Total current assets
|
|
17,188
|
8,487
|
|
Total current liabilities
|
|
(8,091)
|
(2,948)
|
|
Net working capital surplus
|
|
9,097
|
5,539
|
Working Capital Net of Debt (Net Debt)
Working capital net of debt is computed as net working capital surplus decreased by the carrying amount of the Credit Facility. Working capital net of debt is used by management to assess the Company’s overall financial position. As of December 31, 2021, Alvopetro’s net working capital surplus exceeds the balance outstanding on the Credit Facility.
|
|
As at December 31,
|
|
|
2021
|
2020
|
|
Net working capital surplus
|
|
9,097
|
5,539
|
|
Credit Facility, balance outstanding
|
|
(6,545)
|
(15,423)
|
|
Working capital, net of debt (net debt)
|
|
2,552
|
(9,884)
|
Supplementary Financial Measures
“Average realized natural gas price – $/Mcf” is comprised of natural gas sales as determined in accordance with IFRS, divided by the Company’s natural gas sales volumes.
“Average realized NGL – condensate price – $/bbl” is comprised of condensate sales as determined in accordance with IFRS, divided by the Company’s NGL sales volumes from condensate.
“Average realized oil price – $/bbl” is comprised of oil sales as determined in accordance with IFRS, divided by the Company’s oil sales volumes.
“Average realized price – $/boe” is comprised of natural gas, condensate and oil sales as determined in accordance with IFRS, divided by the Company’s total natural gas, condensate and oil sales volumes (barrels of oil equivalent).
“Royalties per boe” is comprised of royalties, as determined in accordance with IFRS, divided by the total natural gas, condensate and oil sales volumes (barrels of oil equivalent).
“Production expenses per boe” is comprised of production expenses, as determined in accordance with IFRS, divided by the total natural gas, condensate and oil sales volumes (barrels of oil equivalent).
Forward-Looking Statements and Cautionary Language
This news release contains “forward-looking information” within the meaning of applicable securities laws. The use of any of the words “will”, “expect”, “intend” and other similar words or expressions are intended to identify forward-looking information. Forward–looking statements involve significant risks and uncertainties, should not be read as guarantees of future performance or results, and will not necessarily be accurate indications of whether or not such results will be achieved. A number of factors could cause actual results to vary significantly from the expectations discussed in the forward-looking statements. These forward-looking statements reflect current assumptions and expectations regarding future events. Accordingly, when relying on forward-looking statements to make decisions, Alvopetro cautions readers not to place undue reliance on these statements, as forward-looking statements involve significant risks and uncertainties. More particularly and without limitation, this news release contains forward-looking information concerning the plans relating to the Company’s operational activities, the expected natural gas price, gas sales and gas deliveries under Alvopetro’s long-term gas sales agreement, forecasted earnings, and the Company’s plans for dividends in the future. The forward–looking statements are based on certain key expectations and assumptions made by Alvopetro, including but not limited to equipment availability, the timing of regulatory licenses and approvals, the success of future drilling, completion, testing, recompletion and development activities, the outlook for commodity markets and ability to access capital markets, the impact of the COVID-19 pandemic and other significant worldwide events, the performance of producing wells and reservoirs, well development and operating performance, foreign exchange rates, general economic and business conditions, weather and access to drilling locations, the availability and cost of labour and services, environmental regulation, including regulation relating to hydraulic fracturing and stimulation, the ability to monetize hydrocarbons discovered, the regulatory and legal environment and other risks associated with oil and gas operations. The reader is cautioned that assumptions used in the preparation of such information, although considered reasonable at the time of preparation, may prove to be incorrect. Actual results achieved during the forecast period will vary from the information provided herein as a result of numerous known and unknown risks and uncertainties and other factors. In addition, the declaration, timing, amount and payment of future dividends remain at the discretion of the Board of Directors. Although Alvopetro believes that the expectations and assumptions on which such forward-looking information is based are reasonable, undue reliance should not be placed on the forward-looking information because Alvopetro can give no assurance that it will prove to be correct. Readers are cautioned that the foregoing list of factors is not exhaustive. Additional information on factors that could affect the operations or financial results of Alvopetro are included in our annual information form which may be accessed on Alvopetro’s SEDAR profile at www.sedar.com. The forward-looking information contained in this news release is made as of the date hereof and Alvopetro undertakes no obligation to update publicly or revise any forward-looking information, whether as a result of new information, future events or otherwise, unless so required by applicable securities laws.
SOURCE Alvopetro Energy Ltd.


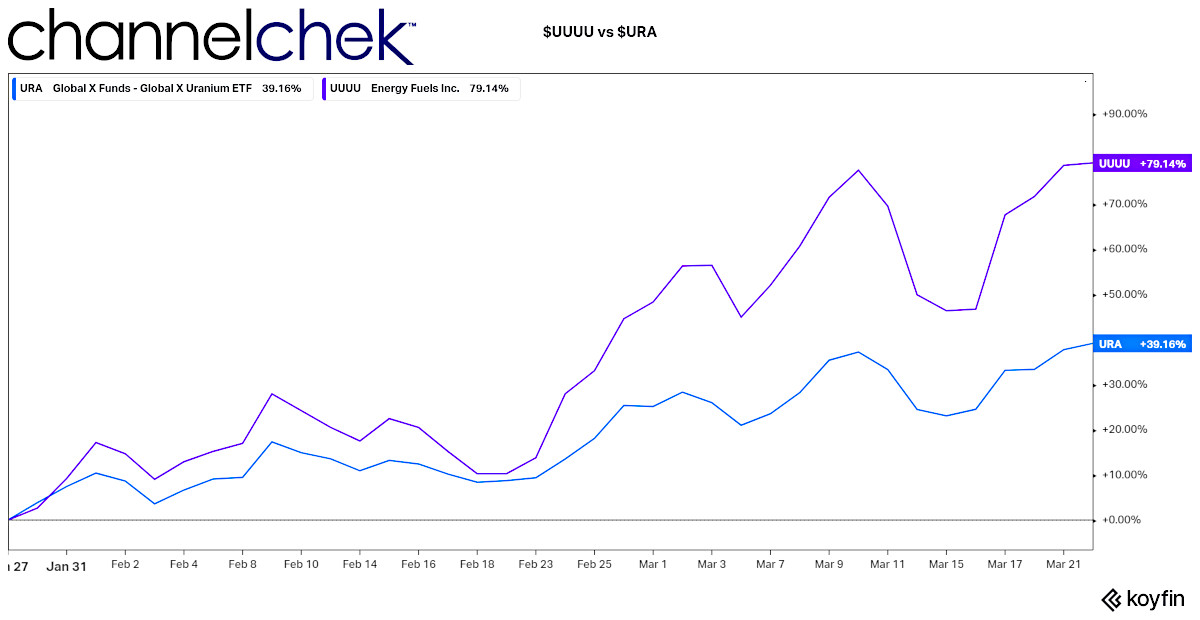
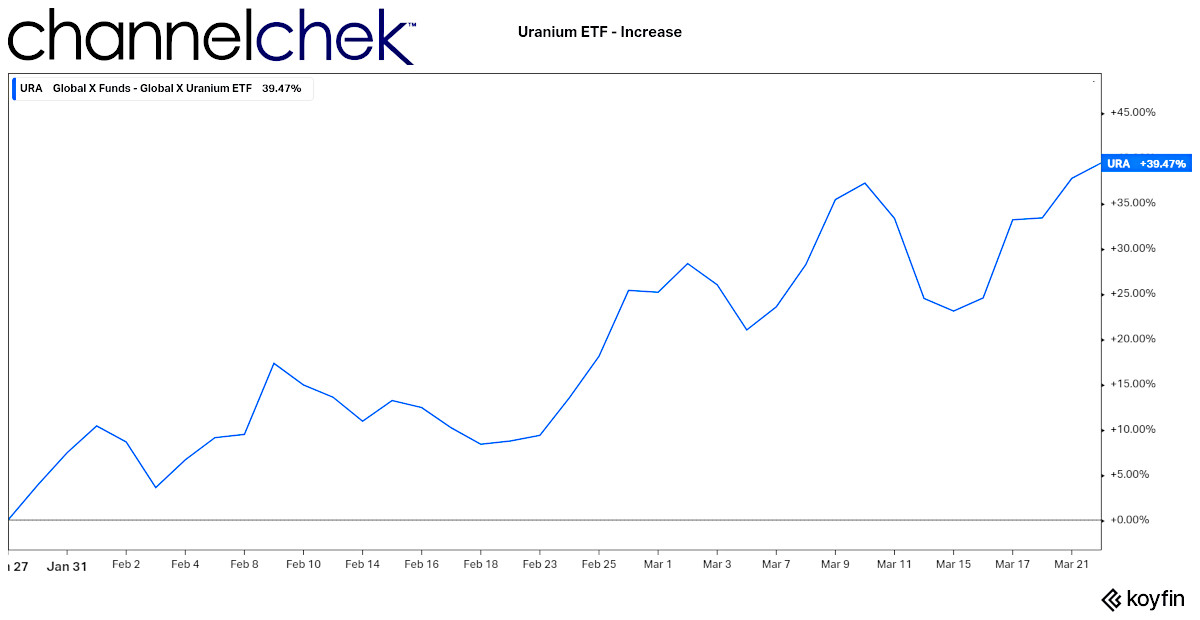 Using $URA as price proxy, Price increase since January 27, 2022