![]()
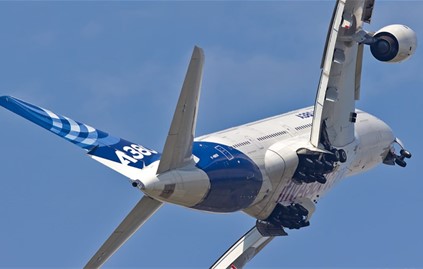
Japan Airlines Enters into New Fuel Sales Agreement with Gevo for 5.3 Million Gallons of Sustainable Aviation Fuel Per Year Over Five Years
Research, News, and Market Data on Gevo
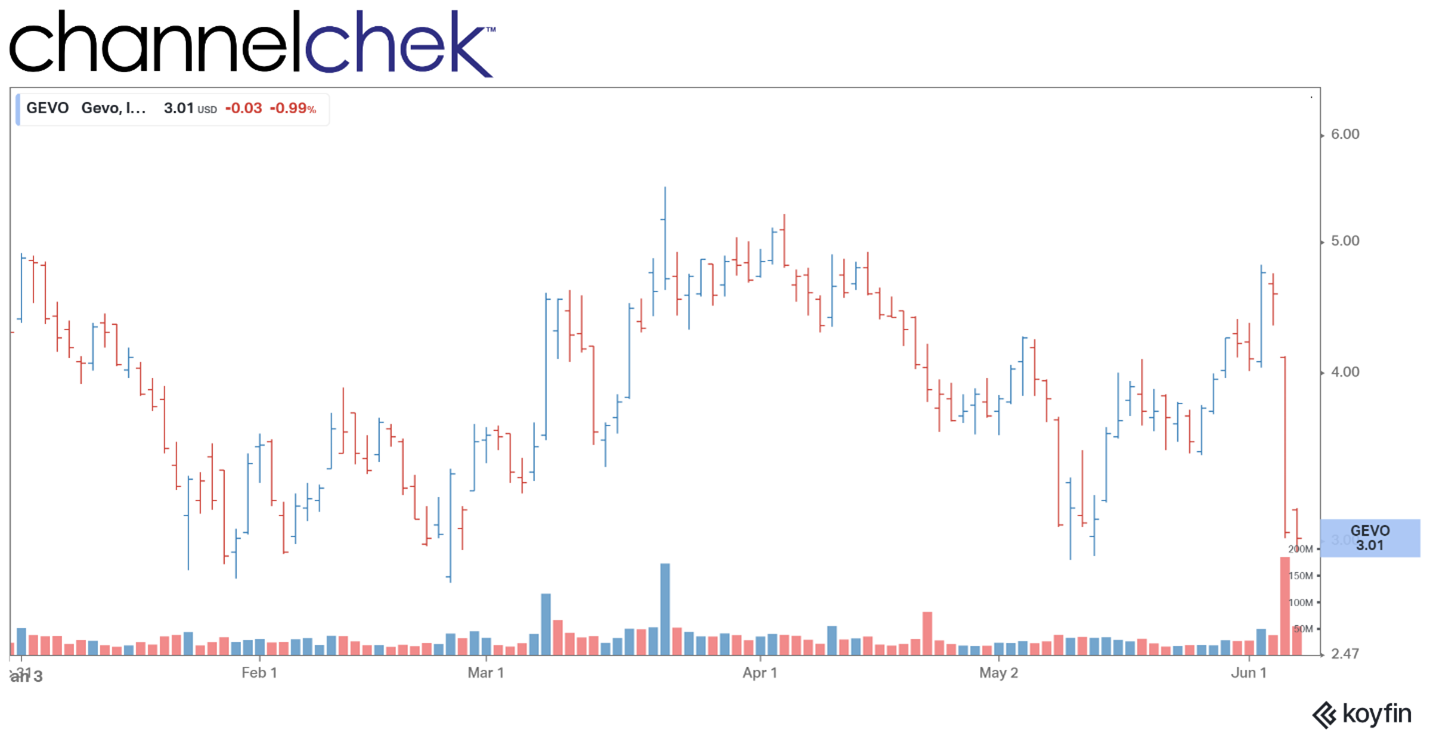
ENGLEWOOD, Colo., June 07, 2022 (GLOBE NEWSWIRE) — Gevo, Inc. (NASDAQ: GEVO) is pleased to announce a new fuel sales agreement with Japan Airlines Co., Ltd. (JAL). The Agreement outlines the details for the purchase of 5.3 million gallons per year of sustainable aviation fuel (SAF) for five years with deliveries expected to begin in 2027.
JAL is a member of oneworld® Alliance, and this Agreement falls within the purview of a memorandum of understanding (MoU) that
oneworld and Gevo signed in March 2022, laying the groundwork for the associated world-class airlines in the Alliance to purchase up to 200 million gallons of SAF from Gevo’s commercial operations. The agreement with JAL will further enhance Gevo’s global footprint for its sustainable fuel products, and also supports Gevo’s efforts in pursuit of its stated goal of producing and commercializing a billion gallons of SAF by 2030.
“Our sustainable aviation fuel is a drop-in fuel that delivers renewable energy where it’s needed,” said Dr. Patrick R. Gruber, Gevo’s Chief Executive Officer. “Our process is a model of efficiency, designed to allow the same acre of farmland to produce SAF from corn using atmospheric carbon while simultaneously adding high-value nutritional products to the food chain.”
Gevo uses the Argonne GREET® model established by Argonne National Laboratory with the support of the U.S. Department of Energy to measure greenhouse gas emissions. Argonne GREET provides an accurate lifecycle inventory of carbon and leverages the decarbonizing impact of sustainable agriculture and fuel-production practices. Gevo’s Net-Zero business systems are expected to reduce greenhouse-gas emissions to net-zero over the entire lifecycle of each gallon of advanced renewable fuel produced, including its SAF, and that includes the emissions resulting from burning the fuel in engines to power transportation.
As the airline industry has worked to reduce carbon dioxide emissions by cutting the quantity of fuel used, JAL and other oneworld members acknowledge that, to achieve further reductions in emissions going forward, they need to change the fuels, too, and expect that the use of SAF will become widespread toward 2030 and on. JAL and oneworld have the common ultimate goal of net-zero emission by 2050, with an intermediate target of replacing 10% of conventional jet fuel to SAF by 2030, and Gevo is a vital part of achieving that goal.
“JAL sees the value in reducing its dependence on fossil fuels while still being able to continue to use its existing aircraft,” says Gruber. “Our agreement will empower the company to achieve carbon-emissions reductions now as it explores other technologies to manage its energy transition.”
The agreement with JAL is subject to certain conditions precedent, including Gevo developing, financing and constructing one or more production facilities to produce the SAF contemplated by the agreement.
About Gevo
Gevo’s mission is to transform renewable energy and carbon into energy-dense liquid hydrocarbons. These liquid hydrocarbons can be used for drop-in transportation fuels such as gasoline, jet fuel and diesel fuel, that when burned have the potential to yield net-zero greenhouse gas emissions when measured across the full life cycle of the products. Gevo uses low-carbon renewable resource-based carbohydrates as raw materials and is in an advanced state of developing renewable electricity and renewable natural gas for use in production processes, resulting in low-carbon fuels with substantially reduced carbon intensity (the level of greenhouse gas emissions compared to standard petroleum fossil-based fuels across their life cycle). Gevo’s products perform as well or better than traditional fossil-based fuels in infrastructure and engines, but with substantially reduced greenhouse gas emissions. In addition to addressing the problems of fuels, Gevo’s technology also enables certain plastics, such as polyester, to be made with more sustainable ingredients. Gevo’s ability to penetrate the growing low-carbon fuels market depends on the price of oil and the value of abating carbon emissions that would otherwise increase greenhouse gas emissions. Gevo believes that its proven, patented technology enabling the use of a variety of low-carbon sustainable feedstocks to produce price-competitive low-carbon products such as gasoline components, jet fuel and diesel fuel yields the potential to generate project and corporate returns that justify the build-out of a multi-billion-dollar business.
Gevo believes that the Argonne National Laboratory GREET model is the best available standard of scientific-based measurement for life cycle inventory or LCI. Learn more at Gevo’s website: www.gevo.com
About Japan Airlines
Japan Airlines (JAL) was founded in 1951 and became the first international airline in Japan. A member of the oneworld® alliance, the airline now reaches 349 airports in 52 countries and regions together with its codeshare partners with a modern fleet of 230 aircraft. JAL Mileage Bank (JMB), the airline’s loyalty program, is one of the largest mileage programs in Asia. Awarded as one of the most punctual major international airlines and a certified 5-Star Airline by Skytrax, JAL is committed to providing customers with the highest levels of flight safety and quality in every aspect of its service, and one of the most preferred airlines in the world. Learn more about Japan Airlines here: https://www.jal.com/en/
Forward-Looking Statements
Certain statements in this press release may constitute “forward-looking statements” within the meaning of the Private Securities Litigation Reform Act of 1995. These forward-looking statements relate to a variety of matters, without limitation, including the agreement with JAL, Gevo’s ability to develop, finance and construct one or more production facilities to produce the SAF contemplated by the agreement with JAL, the timing of Gevo producing the SAF for JAL, Gevo’s estimate of the future revenue from the agreement with JAL, Gevo’s technology, and other statements that are not purely statements of historical fact. These forward-looking statements are made on the basis of the current beliefs, expectations and assumptions of the management of Gevo and are subject to significant risks and uncertainty. Investors are cautioned not to place undue reliance on any such forward-looking statements. All such forward-looking statements speak only as of the date they are made, and Gevo undertakes no obligation to update or revise these statements, whether as a result of new information, future events or otherwise. Although Gevo believes that the expectations reflected in these forward-looking statements are reasonable, these statements involve many risks and uncertainties that may cause actual results to differ materially from what may be expressed or implied in these forward-looking statements. For a further discussion of risks and uncertainties that could cause actual results to differ from those expressed in these forward-looking statements, as well as risks relating to the business of Gevo in general, see the risk disclosures in the Annual Report on Form 10-K of Gevo for the year ended December 31, 2021, and in subsequent reports on Forms 10-Q and 8-K and other filings made with the U.S. Securities and Exchange Commission by Gevo.
Media Contact
Heather L. Manuel
+1 303-883-1114
[email protected]