Image Courtesy of Alvopetro Energy
Why Natural Gas Opportunities Should Not Always be Lumped in With the Oil Sector
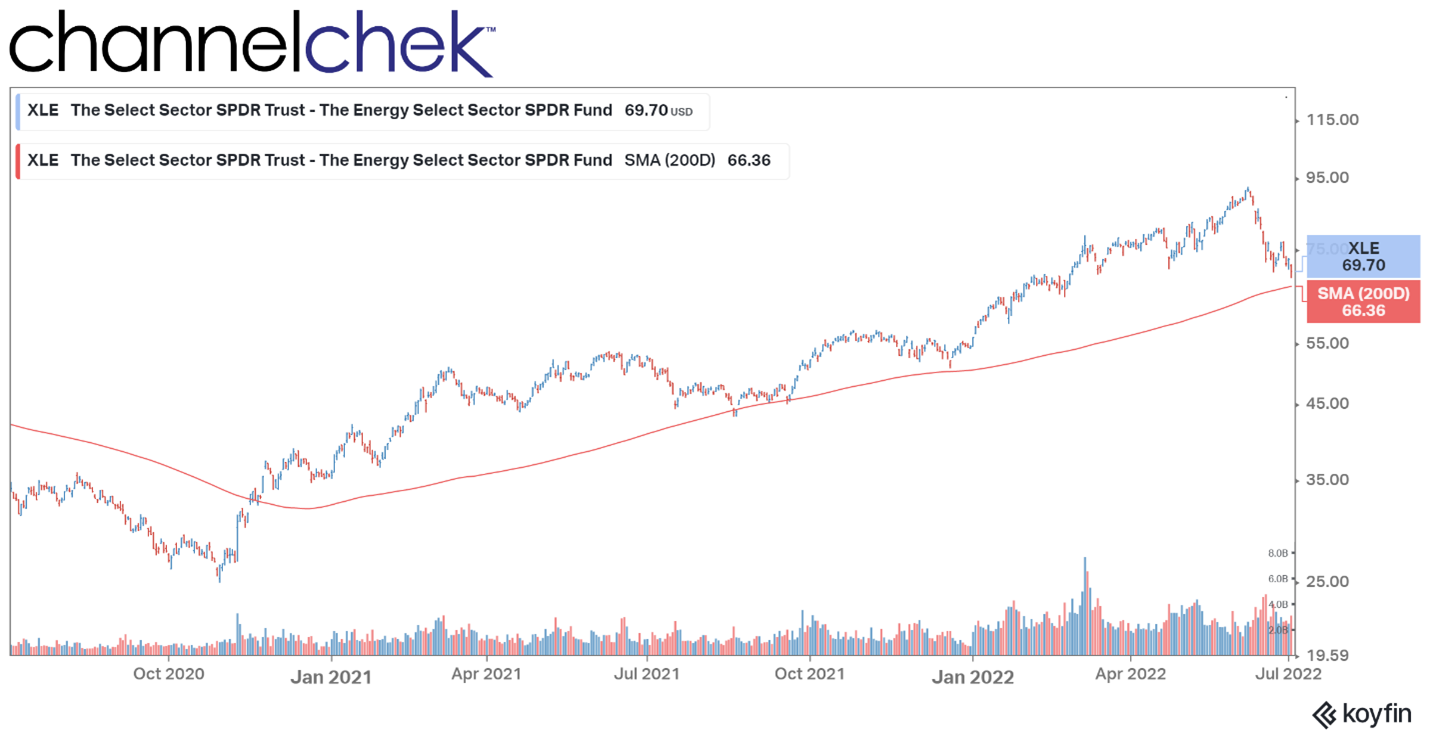
Oil and gas companies were the all-stars in 2021, and so far, in 2022, it is the only group in the green. The category’s performance during June was met with some deflated exuberance and has dipped, but is showing a return of 30.5% YTD. The reason for this is the rising demand for oil and the rising demand for natural gas that began long before Russia’s invasion of Ukraine. What is more compelling is if you look at the prices of oil and natural gas separately, you find natural gas prices are up an additional 18% over the price of oil. These are North American prices, but the trend is the same or more dramatic in other parts of the globe.
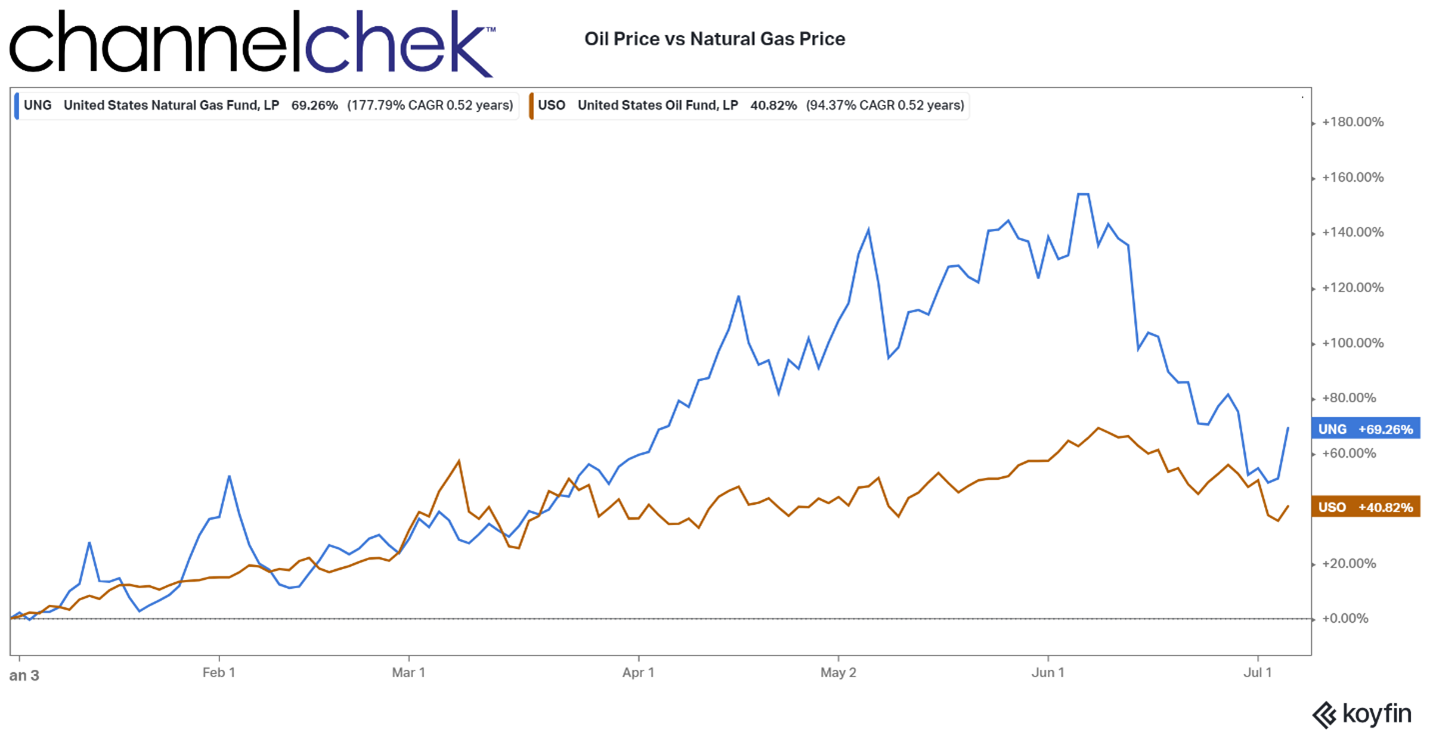
Source: Koyfin
The demand for natural gas began before the European war and is expected to outlast it. In fact, the rise in gas prices began in October 2020. So the upward trajectory is 20 months old and has included large dips and spikes as part of its climb. For investors on the fence about committing more to the energy sector, looking at the prices of the underlying commodity is critical to judge entry points. For those considering the only sector that is green this year, they may wish to further refine their selection and look at pure-play producers of natural gas.
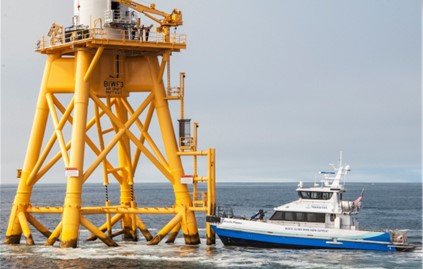
Natural gas is now viewed as a bridge source of energy. It has become clear that if more of our energy is to come from wind and solar, there will be a very long period where we will still require reliable, high-output energy from traditional sources. One of the reasons there are rising prices among all fossil fuels is because of the abrupt way many countries changed their energy policies. Most oil companies still don’t know where the country they operate in stands from quarter to quarter on oil acceptance. This is a problem, especially for the larger less nimble companies that are torn between using resources to build out biofuels or to lease and develop a production facility.
A clearer understanding of the benefits of natural gas allows it to be listed in the European sustainability classification as “Transitional
Activities” beginning in 2023. The category includes those not considered fully sustainable but have emissions below the industry average, and do not lock in polluting assets or crowd out greener alternatives.
Natural gas has quickly become the “must-have” ingredient for countries transitioning to alternative fuels.
There are many companies involved in the production of natural gas, most are part of a larger oil producer. If you wish to benefit from the increased demand of the “greener ” natural gas, a Google search of “pure play natural gas producers” will provide you with many companies to review. At the top of the list, assuming it’s alphabetized, is a unique company with a situation you may find quite compelling, Alvopetro Energy (ALVOF, ALV:CA) .
Alvopetro
Two years ago, Canadian independent Alvopetro managed to get approved to become Brazil’s first, and still only, non-government-owned producer of natural gas. Location sometimes is everything, and Brazil is the ninth-largest economy in the world.
Aside from current earnings that exceed expectations and a unique sharing policy with investors, Alvopetro has tremendous profitability per unit of production. In accounting, it’s called “netback,” it is the cash left after subtracting from revenues all costs associated with bringing the gas from the ground to market, including transportation, royalties, and production expenses. In this category, ALVOF is at the top of the industry.
The reasons Alvopetro has such a high netback are many, involving both costs and pricing. They have a low cost structure, including enviable operating costs, a low 15% tax rate, and transportation costs are minimal because an industrial area located fewer than 10 miles away has a demand for natural gas that exceeds supply. The pricing structure would also seem ideal for the company and shareholders as it assures prices move with what is happening internationally, yet it doesn’t subject the company to the daily ups and downs of the natural gas market. Alvopetro has negotiated a price formula that resets every six months on a price basket of the most common oil and gas benchmarks. This creates a natural hedge for the company and its customers.
Unique to ALVOF is its policy of reinvesting and distributing earnings. The company last paid a dividend that equates to a yield of 6.42% at today’s share price of $4.99. I spoke with CEO Corey Ruttan and he explained to me that “they follow a balanced approach taking roughly half of cashflows to reinvest in organic growth and return the other half to stakeholders.” On the organic growth front, Alvopetro has already announced discoveries at both their 2022 exploration prospects. On the return part of the model, they have paid down nearly all debt. The stakeholders include debt providers and shareholders and with the former being nearly repaid it paves the way for potential increases in returns to shareholders.
Channelchek just did a C-Suite interview with Corey Ruttan the President and CEO of Alvopetro. In the discussion, you’ll learn in much greater detail the nuances that make this natural gas provider extremely unique for investors. Additional research reports on the company can be found here.
Take Away
Oil and gas producers have been the outperformers for over a year. They track the prices of the commodities they produce fairly closely. When one looks at the price of natural gas compared to oil, it has been pulling more than its share of the price increases. Because it is a very clean-burning fossil fuel it is now being viewed as “green energy” and more importantly recognized as critical to any global energy transformation.
There are many pure-play natural gas producers, Channelchek outlined the one above with a higher than average netback margin and a generous policy toward shareholders. Sign-up here for Channelchek and gain access to all equity research and receive news and ideas in your inbox each day.
Managing Editor, Channelchek
Suggested Content

Uranium and Natural Gas Investments Turn Green in 2023 |
Elon Musk Talks About Tesla Bots, Birth Rates, and Federal Incentives |
Using Current Dollar Strength to Refine Your Watch List |

Interview with Alovpetro Energy (ALVOF)(ALV.V) President & CEO Corey Ruttan |
Sources
https://www.ft.com/content/3488236e-ff3b-47ad-9482-296c2f64a1f1
https://news.alphastreet.com/alvopetro-energy-ltd-alv-q1-2022-earnings-call-transcript/
https://www.argusmedia.com/en/news/2119344-alvopetro-breaks-petrobras-gas-monopoly-in-bahia
Corey Ruttan
President and CEO Alvopetro Energy
Stay up to date. Follow us:
 |