Alvopetro Energy Ltd.’s vision is to become a leading independent upstream and midstream operator in Brazil. Our strategy is to unlock the on-shore natural gas potential in the state of Bahia in Brazil, building off the development of our Caburé natural gas field and our strategic midstream infrastructure.
Michael Heim, CFA, Senior Research Analyst, Noble Capital Markets, Inc.
Refer to the full report for the price target, fundamental analysis, and rating.
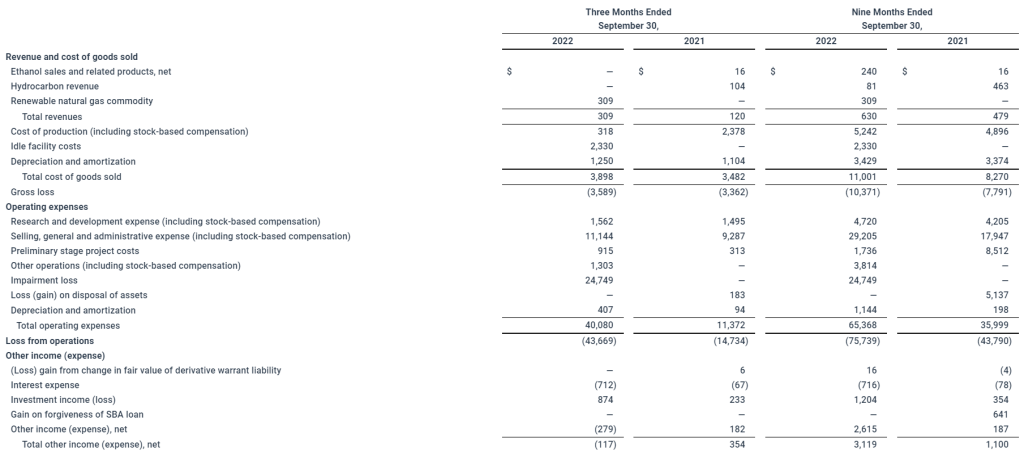
Alvopetro reported 2022-3Q results significantly higher than last year and above our expectations. Revenues rose 67% due to a 7% increase in production and a 58% increase in gas prices. Higher sales translated into higher cash flow ($13.8 million versus $7.2 million) and earnings ($8.8 million versus $0.0).
Results were due to operations improvements and are likely to continue. The company expanded its gas processing facilities in July raising capacity to 3,000 boe/d. With quarterly results, management indicated that October total production averaged 2,720 boe/d, a nice rise above 2022-3Q levels of 2,642 boe/d.
This Company Sponsored Research is provided by Noble Capital Markets, Inc., a FINRA and S.E.C. registered broker-dealer (B/D).
*Analyst certification and important disclosures included in the full report. NOTE: investment decisions should not be based upon the content of this research summary. Proper due diligence is required before making any investment decision.
CALGARY, AB, Nov. 15, 2022 /CNW/ – Alvopetro Energy Ltd. (TSXV:ALV); (OTCQX: ALVOF) is pleased to announce a 50% increase in our quarterly dividend, to US$0.12 per common share, an intention to launch a share buyback program under a normal course issuer bid (“NCIB”) and operating and financial results for the third quarter of 2022 including another record quarter of funds flow from operations of $13.3 million. We will host a live webcast to discuss Q3 2022 results on Wednesday November 16, 2022, beginning at 9:00 am Mountain time.
President & CEO, Corey C. Ruttan commented:
“With continued strong operating and financial results, and with our debt now fully repaid, we are pleased to announce a 50% increase in our quarterly dividend following on the 33% increase earlier this year. Our dividend program and the proposed NCIB will provide us with maximum flexibility to meet our strategy to maintain a balanced organic growth and stakeholder return model.”
All references herein to $ refer to United States dollars, unless otherwise stated and all tabular amounts are in thousands of United States dollars, except as otherwise noted.
Quarterly Dividend Increased 50% to $0.12 per Share
Alvopetro is pleased to announce that our Board of Directors has approved a 50% increase in our quarterly dividend, to $0.12 per common share, payable in cash on January 13, 2023, to shareholders of record at the close of business on December 30, 2022. This dividend is designated as an “eligible dividend” for Canadian income tax purposes.
Dividend payments to non-residents of Canada will be subject to withholding taxes at the Canadian statutory rate of 25%. Shareholders may be entitled to a reduced withholding tax rate under a tax treaty between their country of residence and Canada. For further information, see Alvopetro’s website at https://alvopetro.com/Dividends-Non-resident-Shareholders.
Normal Course Issuer Bid
In connection with our long-standing balanced and disciplined stakeholder return and organic growth model, our Board has provided approval to submit an application to launch a share buyback program under a NCIB, subject to securities law and customary approvals. Once approved, the NCIB, combined with our quarterly dividends, will provide us with flexibility in managing our returns to stakeholders.
Financial and Operating Highlights – Third Quarter of 2022
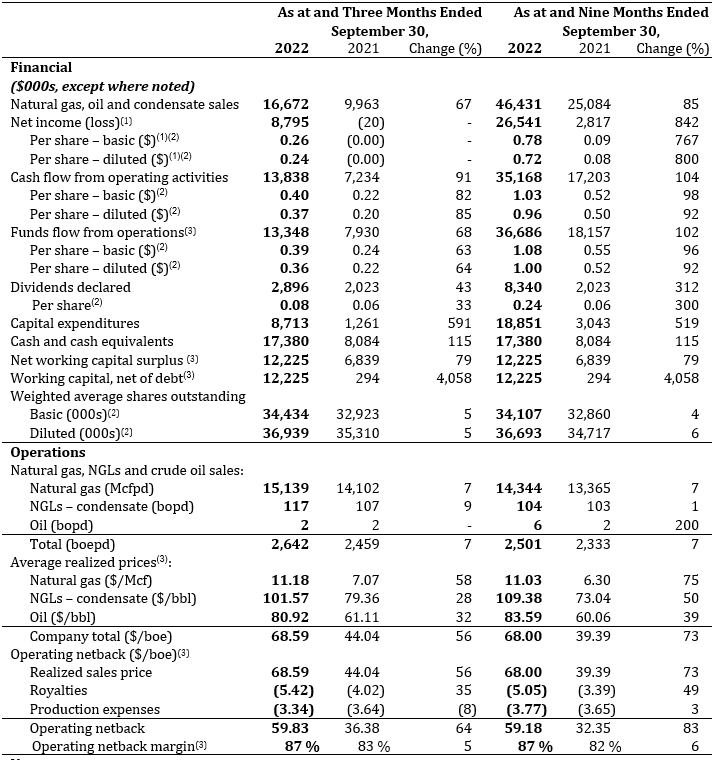
Daily sales averaged 2,642 boepd in Q3 2022, a 7% increase from the Q3 2021 average of 2,459 boepd and a 12% increase from the Q2 2022 average of 2,359 boepd. The expansion of our gas processing facility was completed at the end of July and available processing capacity has now increased to 500,000 m3/d (18 MMcfpd) contributing to higher volumes in the quarter.
As of August 1, 2022, Alvopetro’s natural gas price has been reset to the new ceiling price of $10.22/MMBtu. Due to the appreciation of the BRL in the first half of 2022 compared to second half of 2021, the BRL contracted price remained consistent at BRL1.94/m3. With all natural gas sales in Q3 2022 at the ceiling price, our average realized natural gas price increased to $11.18/Mcf compared to the Q3 2021 average price of $7.07/Mcf. Higher commodity prices and higher daily sales volumes resulted in a 67% increase in our natural gas, condensate and oil revenue compared to Q3 2021.
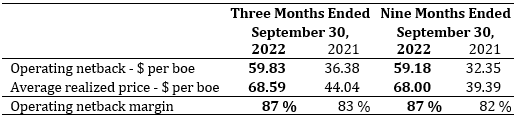
Our operating netback was $59.83 per boe in Q3 2022, an improvement of $23.45 per boe from Q3 2021 (+64%). Despite consistent BRL denominated natural gas pricing, our operating netback decreased $4.13 per boe from Q2 2022 (-6%) due to the devaluation of the BRL relative to the USD and lower Brent pricing on condensate.
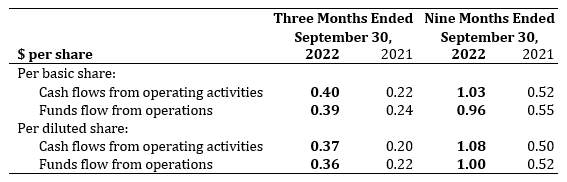
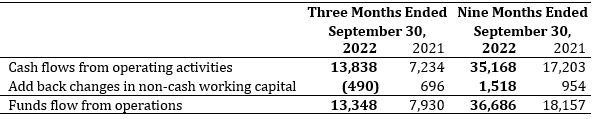
We generated cash flows from operating activities of $13.8 million ($0.40 per basic share and $0.37 per diluted share) and funds flows from operations of $13.3 million ($0.39 per basic share and $0.36 per diluted share), increases of $6.6 million and $5.4 million, respectively compared to Q3 2021.
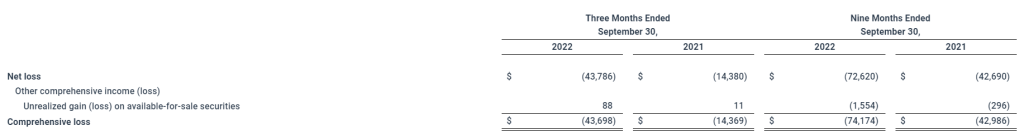
We reported net income of $8.8 million in Q3 2022 compared to a loss of $0.02 million in Q3 2021.
Capital expenditures totaled $8.7 million, and included drilling costs for our 183-B1, 182-C2 and Unit-C wells, testing costs on our 182-C1 well, long lead purchases and development costs on our Murucututu project.
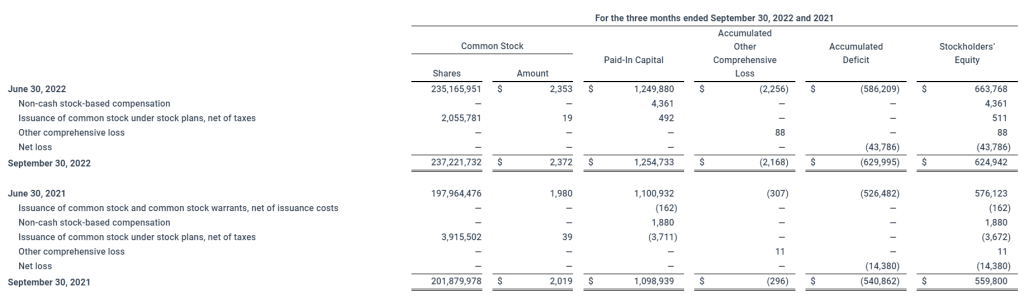
All outstanding warrants were exercised in the quarter, with 1,342,978 warrants exercised by way of cashless exercise and 1,342,978 warrants exercised at a strike price of $1.80 per share. Alvopetro received cash proceeds of $2.4 million and issued a total of 2,081,616 common shares on the exercise.
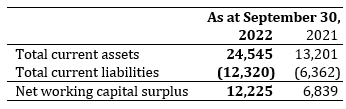
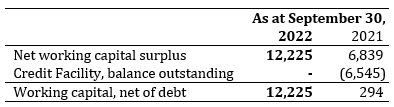
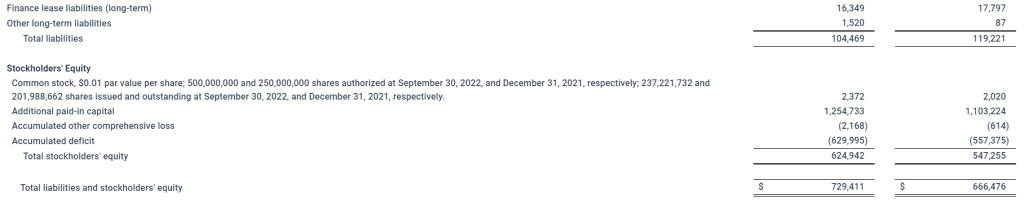
We repaid the final $2.5 million outstanding on the credit facility and the facility has now been cancelled. As at September 30, 2022, we had a net working capital surplus of $12.2 million, including $17.4 million in cash and cash equivalents.
Our October 2022 sales volumes averaged 2,720 boepd based on field estimates, with natural gas sales of 15.6MMcfpd and natural gas liquids from condensate of 124 bopd.
The following table provides a summary of Alvopetro’s financial and operating results for three and nine months ended September 30, 2022 and September 30, 2021. The consolidated financial statements with the Management’s Discussion and Analysis (“MD&A) are available on our website at www.alvopetro.com and will be available on the System for Electronic Document Analysis and Retrieval (SEDAR) website at www.sedar.com.
Notes:
The 2021 comparative periods in the table above have been restated. See “Restatement of the 2021 Comparative Period” section within the MD&A and Note 14 of the unaudited interim condensed consolidated financial statements for the three and nine months ended September 30, 2022 for further details.
Per share amounts are based on weighted average shares outstanding other than dividends per share, which is based on the number of common shares outstanding at each dividend record date. The weighted average number of diluted common shares outstanding in the computation of funds flow from operations and cash flows from operating activities per share is the same as for net income per share.
See “Non-GAAP and Other Financial Measures” section within this news release.
Third Quarter 2022 Results Webcast
Alvopetro will host a live webcast to discuss Q3 2022 financial results at 9:00 am Mountain time on November 16, 2022. Details for joining the event are as follows:
The webcast will include a question-and-answer period. Online participants will be able to ask questions through the Zoom portal. Dial-in participants can email questions directly to socialmedia@alvopetro.com.
Long-term Incentive Compensation Grants
In connection with our long-term incentive compensation program, Alvopetro’s Board of Directors (the “Board”) has approved the annual rolling grants to officers, directors and certain employees under Alvopetro’s Omnibus Incentive Plan. A total of 536,000 stock options, 122,000 restricted share units (“RSUs”) and 40,000 deferred share units (“DSUs”) were approved by the Board and are expected to be granted on November 24, 2022. Of the total grants, 248,000 stock options, 101,000 RSUs and 40,000 DSUs were granted to directors and officers. Each stock option, RSU and DSU entitles the holder to purchase one common share. Each stock option granted will have an exercise price based on the volume weighted average trading price of Alvopetro’s shares on the TSX Venture Exchange for the five (5) consecutive trading days up to and including November 24, 2022. All stock options, RSUs and DSUs granted expire five (5) years from the date of the grant.
Alvopetro Energy Ltd.’svision is to become a leading independent upstream and midstream operator in Brazil. Our strategy is to unlock the on-shore natural gas potential in the state of Bahia in Brazil, building off the development of our Caburé natural gas field and our strategic midstream infrastructure.
Neither the TSX Venture Exchange nor its Regulation Services Provider (as that term is defined in the policies of the TSX Venture Exchange) accepts responsibility for the adequacy or accuracy of this news release.
Abbreviations:
bbls
=
barrels
boepd
=
barrels of oil equivalent (“boe”) per day
bopd
=
barrels of oil and/or natural gas liquids (condensate) per day
BRL
=
Brazilian Real
m3
=
cubic metre
Mcf
=
thousand cubic feet
Mcfpd
=
thousand cubic feet per day
MMcf
=
million cubic feet
MMcfpd
=
million cubic feet per day
NGLs
=
natural gas liquids
Q2 2022
=
three months ended June 30, 2022
Q3 2021
=
three months ended September 30, 2021
Q3 2022
=
three months ended September 30, 2022
Non-GAAP and Other Financial Measures
This news release contains references to various non-GAAP financial measures, non-GAAP ratios, capital management measures and supplementary financial measures as such terms are defined in National Instrument 52-112 Non-GAAP and Other Financial Measures Disclosure. Such measures are not recognized measures under GAAP and do not have a standardized meaning prescribed by IFRS and might not be comparable to similar financial measures disclosed by other issuers. While these measures may be common in the oil and gas industry, the Company’s use of these terms may not be comparable to similarly defined measures presented by other companies. The non-GAAP and other financial measures referred to in this report should not be considered an alternative to, or more meaningful than measures prescribed by IFRS and they are not meant to enhance the Company’s reported financial performance or position. These are complementary measures that are used by management in assessing the Company’s financial performance, efficiency and liquidity and they may be used by investors or other users of this document for the same purpose. Below is a description of the non-GAAP financial measures, non-GAAP ratios, capital management measures and supplementary financial measures used in this news release. For more information with respect to financial measures which have not been defined by GAAP, including reconciliations to the closest comparable GAAP measure, see the “Non-GAAP Measures and Other Financial Measures” section of the Company’s MD&A which may be accessed through the SEDAR website at www.sedar.com.
Non-GAAP Financial Measures
Operating netback
Operating netback is calculated as natural gas, oil and condensate revenues less royalties and production expenses. This calculation is provided in the “Operating Netback” section of the Company’s MD&A using our IFRS measures. The Company’s MD&A may be accessed through the SEDAR website at www.sedar.com. Operating netback is a common metric used in the oil and gas industry used to demonstrate profitability from operations.
Non-GAAP Financial Ratios
Operating netback per boe
Operating netback is calculated on a per unit basis, which is per barrel of oil equivalent (“boe”). It is a common non-GAAP measure used in the oil and gas industry and management believes this measurement assists in evaluating the operating performance of the Company. It is a measure of the economic quality of the Company’s producing assets and is useful for evaluating variable costs as it provides a reliable measure regardless of fluctuations in production. Alvopetro calculated operating netback per boe as operating netback divided by total sales volumes (barrels of oil equivalent). This calculation is provided in the “Operating Netback” section of the Company’s MD&A using our IFRS measures. The Company’s MD&A may be accessed through the SEDAR website at www.sedar.com. Operating netback is a common metric used in the oil and gas industry used to demonstrate profitability from operations on a per unit basis (boe).
Operating netback margin
Operating netback margin is calculated as operating netback per boe divided by the realized sales price per boe. Operating netback margin is a measure of the profitability per boe relative to natural gas, oil and condensate sales revenues per boe and is calculated as follows:
Funds Flow from Operations Per Share
Funds flow from operations per share is a non-GAAP ratio that includes all cash generated from operating activities and is calculated before changes in non-cash working capital, divided by the weighted the weighted average shares outstanding for the respective period. For the periods reported in this news release the cash flows from operating activities per share and funds flow from operations per share is as follows:
Capital Management Measures
Funds Flow from Operations
Funds flow from operations is a non-GAAP capital management measure that includes all cash generated from operating activities and is calculated before changes in non-cash working capital. The most comparable GAAP measure to funds flow from operations is cash flows from operating activities. Management considers funds flow from operations important as it helps evaluate financial performance and demonstrates the Company’s ability to generate sufficient cash to fund future growth opportunities. Funds flow from operations should not be considered an alternative to, or more meaningful than, cash flows from operating activities however management finds that the impact of working capital items on the cash flows reduces the comparability of the metric from period to period. A reconciliation of funds flow from operations to cash flows from operating activities is as follows:
Net Working Capital
Net working capital is computed as current assets less current liabilities. Net working capital is a measure of liquidity, is used to evaluate financial resources, and is calculated as follows:
Working Capital Net of Debt
Working capital net of debt is computed as net working capital surplus decreased by the carrying amount of the Credit Facility. Working capital net of debt is used by management to assess the Company’s overall financial position.
Supplementary Financial Measures
“Average realized natural gas price – $/Mcf” is comprised of natural gas sales as determined in accordance with IFRS, divided by the Company’s natural gas sales volumes.
“Average realized NGL – condensate price – $/bbl” is comprised of condensate sales as determined in accordance with IFRS, divided by the Company’s NGL sales volumes from condensate.
“Average realized oil price – $/bbl” is comprised of oil sales as determined in accordance with IFRS, divided by the Company’s oil sales volumes.
“Average realized price – $/boe” is comprised of natural gas, condensate and oil sales as determined in accordance with IFRS, divided by the Company’s total natural gas, condensate and oil sales volumes (barrels of oil equivalent).
“Royalties per boe” is comprised of royalties, as determined in accordance with IFRS, divided by the total natural gas, condensate and oil sales volumes (barrels of oil equivalent).
“Production expenses per boe” is comprised of production expenses, as determined in accordance with IFRS, divided by the total natural gas, condensate and oil sales volumes (barrels of oil equivalent).
BOE Disclosure
The term barrels of oil equivalent (“boe”) may be misleading, particularly if used in isolation. A boe conversion ratio of six thousand cubic feet per barrel (6 Mcf/bbl) of natural gas to barrels of oil equivalence is based on an energy equivalency conversion method primarily applicable at the burner tip and does not represent a value equivalency at the wellhead. All boe conversions in this MD&A are derived from converting gas to oil in the ratio mix of six thousand cubic feet of gas to one barrel of oil.
Forward-Looking Statements and Cautionary Language
This news release contains forward-looking information within the meaning of applicable securities laws. The use of any of the words “will”, “expect”, “intend” and other similar words or expressions are intended to identify forward-looking information. Forward‐looking statements involve significant risks and uncertainties, should not be read as guarantees of future performance or results, and will not necessarily be accurate indications of whether or not such results will be achieved. A number of factors could cause actual results to vary significantly from the expectations discussed in the forward-looking statements. These forward-looking statements reflect current assumptions and expectations regarding future events. Accordingly, when relying on forward-looking statements to make decisions, Alvopetro cautions readers not to place undue reliance on these statements, as forward-looking statements involve significant risks and uncertainties. More particularly and without limitation, this news release contains forward-looking information concerning the Company’s dividend policy, plans for dividends in the future, and the timing and taxation of such dividends, the Company’s intention to proceed with an NCIB, plans relating to the Company’s operational activities, the expected natural gas price, gas sales and gas deliveries under Alvopetro’s long-term gas sales agreement, exploration and development prospects of Alvopetro, the expected timing of certain of Alvopetro’s testing and operational activities, future results from operations, and the Company’s plans for dividends in the future. Forward-looking statements are necessarily based upon assumptions and judgments with respect to the future including, but not limited to, expected approvals and timing thereof with respect to an NCIB, equipment availability, the timing and results of testing the 183-B1 well, the 182-C2 well and the Unit C well, the success of future drilling, completion, recompletion and development activities, foreign exchange rates, expectations regarding Alvopetro’s working interest and the outcome of any redeterminations, the outlook for commodity markets and ability to access capital markets, the impact of the COVID-19 pandemic, the performance of producing wells and reservoirs, well development and operating performance, the timing of regulatory licenses and approvals, general economic and business conditions, forecasted demand for oil and natural gas, weather and access to drilling locations, the availability and cost of labour and services, environmental regulation, including regulation relating to hydraulic fracturing and stimulation, the ability to monetize hydrocarbons discovered, the regulatory and legal environment and other risks associated with oil and gas operations. The reader is cautioned that assumptions used in the preparation of such information, although considered reasonable at the time of preparation, may prove to be incorrect. Actual results achieved during the forecast period will vary from the information provided herein as a result of numerous known and unknown risks and uncertainties and other factors. In addition, the declaration, timing, amount and payment of future dividends remain at the discretion of the Board of Directors. Although Alvopetro believes that the expectations and assumptions on which such forward-looking information is based are reasonable, undue reliance should not be placed on the forward-looking information because Alvopetro can give no assurance that it will prove to be correct. Readers are cautioned that the foregoing list of factors is not exhaustive. Additional information on factors that could affect the operations or financial results of Alvopetro are included in our restated annual information form which may be accessed on Alvopetro’s SEDAR profile at www.sedar.com. The forward-looking information contained in this news release is made as of the date hereof and Alvopetro undertakes no obligation to update publicly or revise any forward-looking information, whether as a result of new information, future events or otherwise, unless so required by applicable securities laws.
SOURCE Alvopetro Energy Ltd.
For further information: Corey C. Ruttan, President, Chief Executive Officer and Director, or Alison Howard, Chief Financial Officer, Phone: 587.794.4224, Email: info@alvopetro.com, www.alvopetro.com, TSX-V: ALV, OTCQX: ALVOF
Energy Fuels is a leading U.S.-based uranium mining company, supplying U3O8 to major nuclear utilities. Energy Fuels also produces vanadium from certain of its projects, as market conditions warrant, and is ramping up commercial-scale production of REE carbonate. Its corporate offices are in Lakewood, Colorado, near Denver, and all its assets and employees are in the United States. Energy Fuels holds three of America’s key uranium production centers: the White Mesa Mill in Utah, the Nichols Ranch in-situ recovery (“ISR”) Project in Wyoming, and the Alta Mesa ISR Project in Texas. The White Mesa Mill is the only conventional uranium mill operating in the U.S. today, has a licensed capacity of over 8 million pounds of U3O8 per year, has the ability to produce vanadium when market conditions warrant, as well as REE carbonate from various uranium-bearing ores. The Nichols Ranch ISR Project is on standby and has a licensed capacity of 2 million pounds of U3O8 per year. The Alta Mesa ISR Project is also on standby and has a licensed capacity of 1.5 million pounds of U3O8 per year. In addition to the above production facilities, Energy Fuels also has one of the largest NI 43-101 compliant uranium resource portfolios in the U.S. and several uranium and uranium/vanadium mining projects on standby and in various stages of permitting and development. The primary trading market for Energy Fuels’ common shares is the NYSE American under the trading symbol “UUUU,” and the Company’s common shares are also listed on the Toronto Stock Exchange under the trading symbol “EFR.” Energy Fuels’ website is www.energyfuels.com.
Michael Heim, CFA, Senior Research Analyst, Noble Capital Markets, Inc.
Refer to the full report for the price target, fundamental analysis, and rating.
Energy Fuel reached a definitive agreement to sell the Alta Mesa mill to enCore Energy for $120 million. Energy Fuels will receive $60 million in cash upon closing and $60 million in convertible debt bearing an 8% annual interest rate. The mill is one of 11 licensed uranium processing plants and has an operating capacity of 1.5 million pounds per year. UUUU acquired Alta Mesa in 2016 for $13.6 million.
Energy Fuel, which operates Alta Mesa on a standby basis, did not have plans to activate the plant in the near future. Energy Fuel retains three other processing mills including the White Mesa mill which is licensed to produce 8 million pounds of uranium per year. We believe the White Mesa mill is large enough to meet all of UUUU’s uranium production needs in addition to producing vanadium and rare earth elements.The Alta Mesa plant costs approximately $2 million annually to maintain.
This Company Sponsored Research is provided by Noble Capital Markets, Inc., a FINRA and S.E.C. registered broker-dealer (B/D).
*Analyst certification and important disclosures included in the full report. NOTE: investment decisions should not be based upon the content of this research summary. Proper due diligence is required before making any investment decision.
Non-dilutive sale of asset expected to materially enhance Energy Fuels’ balance sheet and help to fund the rapid advancement and expansion of near-term U.S. uranium and rare earth production
LAKEWOOD, Colo., Nov. 14, 2022 /CNW/ – Energy Fuels Inc. (NYSE American: UUUU) (TSX: EFR) (“Energy Fuels” or the “Company”), a leading U.S. producer of uranium and rare earth elements (“REE“), is pleased to announce that it has entered into a definitive agreement to sell three wholly-owned subsidiaries that together hold Energy Fuels’ Alta Mesa ISR Project (“Alta Mesa“) to enCore Energy (“enCore“) for total consideration of $120 million (the “Transaction“). The Transaction is expected to close by the end of 2022 or early 2023.
The Transaction is significant for the Company, as the cash received is expected to fully finance much of the Company’s uranium, REE, vanadium and medical isotope business plans for the next two to three years without diluting shareholders. These plans may include:
Ramping-up uranium production at one or more of the White Mesa Mill, the Nichols Ranch ISR Project, the Pinyon Plain mine, the La Sal Complex, and/or the Whirlwind mine which total up to two (2) million pounds of U3O8 per year of near-term, lower cost U.S. production capacity in order to fulfill commitments under existing and future long-term uranium supply agreements and as market conditions may warrant;
Accelerating the licensing and development of the Company’s larger-scale uranium mines, including the Sheep Mountain, Roca Honda, and/or Bullfrog projects, which together will add over five (5) million pounds of production capacity in the next several years;
Establishing an “ore purchasing” program to secure additional feed to the White Mesa Mill, from others in the region as uranium mining picks up in the region, thereby maximizing the facility’s existing eight (8) million pounds per year licensed uranium production capacity and having sole ownership of this production;
Financing the construction of “first to market” in the U.S. “Phase 1” REE separation infrastructure (up to 2,500 – 5,000 MT per year TREO capacity, including 500 – 1,000 MT per year of NdPr oxide or oxalate expected) at the White Mesa Mill;
Advancing the design, engineering and permitting of a planned, large “world significant” “Phase 2” crack-and-leach and “light” and “heavy” REE separation facility (up to 15,000 mT per year TREO capacity).
Developing the Company’s Bahia heavy mineral sand and REE project in Brazil upon successful acquisition of the project; and
Acquiring additional monazite supply to feed the Company’s rapidly growing REE business.
The $120 million of total consideration will be paid by enCore to Energy Fuels as follows:
$60 million cash at closing; and
$60 million in a secured convertible note (the “Note”), payable in two years from the closing, bearing annual interest of eight percent (8%). The Note will be convertible at Energy Fuels’ election into enCore shares at a 20% premium to the 10-day volume-weighted average price of enCore shares ending the day before the closing. enCore is currently traded on the TSXV and has applied for a listing on the NASDAQ. The Note will be guaranteed by enCore Energy Corp., will be fully secured by Alta Mesa, and enCore will not be permitted to further encumber Alta Mesa with any third-party indebtedness, royalty or stream while the Note is outstanding. Unless a block trade or similar distribution is executed by Energy Fuels to sell the enCore common shares underlying the Note, Energy Fuels will be limited to converting the Note into a maximum of $10 million principal amount of the Note per thirty (30) day period.
Furthermore, enCore will assume all reclamation liabilities associated with Alta Mesa (approximately $10.3 million) and pay Energy Fuels the cash collateral on the existing reclamation bonds (approximately $3.6 million). Once the reclamation liabilities are transferred to enCore, Energy Fuels will be nearly 60% collateralized on its remaining reclamation obligations. The Company also estimates that the sale of Alta Mesa will reduce Energy Fuels’ cash burn by approximately $2 million per year.
Energy Fuels acquired Alta Mesa in 2016 for approximately $13.6 million of shares, and currently carries this project on its balance sheet at $8.2 million. The Transaction represents an exceptional return on investment for Energy Fuels, and the value metrics of the Transaction compare favorably against precedent transactions within the uranium sector. Energy Fuels expects to replace the expected uranium production from Alta Mesa through permitting and production from its existing larger mining projects, ore purchases, toll milling arrangements, additional alternate feed and clean-up material, and potentially other transactions as market conditions may warrant.
Mark S. Chalmers, President and CEO of Energy Fuels stated: “This is a unique transaction for Energy Fuels. Not only does it allow us to monetize the Alta Mesa Project for $120 million, it allows our company to focus and accelerate our higher priority uranium and rare earth projects without dilution to our shareholders. This non-dilutive transaction will add cash to Energy Fuels’ significant working capital position, which was $122 million at September 30, 2022. Energy Fuels will also retain some exposure to short-term market upside and optionality at Alta Mesa and enCore through the convertible note.
“With recent uranium market strength and having secured new long-term uranium contracts with major U.S. nuclear utilities earlier this year, the Company is beginning to perform the work needed to recommence production at one or more of our projects, with production expected to start as soon as 2023. We have already hired about 20 people, and the cash we receive from the Alta Mesa transaction will help further fund this ramp-up. On top of this, the Company plans to establish an “ore purchasing” program from future uranium mining from others that maximizes the underutilized uranium production capacity of the White Mesa Mill with the uranium produced going 100% to our account in a way that others cannot. Energy Fuels absolutely intends to retain our position as the leading producer of uranium in the U.S. through our remaining outstanding portfolio of ISR and conventional uranium assets, and this transaction with enCore helps to both finance and focus our plans in this regard without dilution associated with equity financings.
“This cash also helps facilitate our plans to install rare earth separation infrastructure at our White Mesa Mill, including the expected capacity to produce approximately 500 – 1,000 tonnes per annum of separated ‘light’ rare earth oxides (or oxalates) by the end of 2023 or early 2024. We are also working on a number of fronts to secure additional monazite supply to feed our new rare earth infrastructure, and we expect this cash to significantly help finance purchases of monazite, fund our Bahia project in Brazil upon successful completion of that acquisition, and otherwise help in this regard. If we are successful with our rare earth initiatives, we have the potential to be the ‘first-to-market’ in the U.S. for the sale of commercial quantities of separated NdPr oxides (or oxalates), a raw material for rare earth permanent magnets used in electric vehicle drivetrains, wind energy systems, and defense applications. For reference, high-efficiency EVs each require about one to two kilograms of NdPr oxide. Therefore, in the next 12-18 months, if we are successful in constructing our Phase 1 rare earth separation capabilities, Energy Fuels could be domestically producing enough magnet material for 250,000 to 1 million EV drivetrains per year.
“I also believe this Transaction represents an important step forward for enCore Energy. Alta Mesa is a fully permitted and developed U.S. uranium project, and enCore’s President and CEO, Paul Goranson, knows it well, having constructed and operated it himself about ten years ago. To us, this appears to be a value creative transaction for both Energy Fuels and enCore.”
The closing of the Transaction is expected to occur by December 31, 2022. If the Transaction is not completed due to certain circumstances, enCore is required to pay to Energy Fuels a $6 million break fee.
Cantor Fitzgerald Canada Corporation is acting as Energy Fuels’ financial advisor and Dorsey & Whitney LLP and Dentons are acting as Energy Fuels’ legal advisors in connection with the Transaction.
About Energy Fuels: Energy Fuels is a leading U.S.-based uranium mining company, supplying U3O8 to major nuclear utilities. The Company also produces vanadium from certain of its projects, as market conditions warrant, and is ramping up to full commercial-scale production of RE Carbonate. Its corporate offices are in Lakewood, Colorado near Denver, and all its assets and employees are in the United States. Energy Fuels holds three of America’s key uranium production centers: the White Mesa Mill in Utah, the Nichols Ranch ISR Project in Wyoming, and the Alta Mesa ISR Project in Texas. The White Mesa Mill is the only conventional uranium mill operating in the U.S. today, has a licensed capacity of over 8 million pounds of U3O8 per year, and has the ability to produce vanadium when market conditions warrant, as well as RE Carbonate from various uranium-bearing ores. The Nichols Ranch ISR Project is currently on standby and has a licensed capacity of 2 million pounds of U3O8 per year. The Alta Mesa ISR Project is also currently on standby and has a licensed capacity of 1.5 million pounds of U3O8 per year. In addition to the above production facilities, Energy Fuels also has one of the largest S-K 1300 and NI 43-101 compliant uranium resource portfolios in the U.S. and several uranium and uranium/vanadium mining projects on standby and in various stages of permitting and development. The primary trading market for Energy Fuels’ common shares is the NYSE American under the trading symbol “UUUU,” and the Company’s common shares are also listed on the Toronto Stock Exchange under the trading symbol “EFR.” Energy Fuels’ website is www.energyfuels.com.
Cautionary Note Regarding Forward-Looking Statements: This news release contains certain “Forward Looking Information” and “Forward Looking Statements” within the meaning of applicable United States and Canadian securities legislation, which may include, but are not limited to, statements with respect to: production and sales forecasts; the ability of the Company to accelerate uranium and rare earth production; scalability, and the Company’s ability and readiness to re-start, expand or deploy any of its existing projects or capacity to respond to any improvements in uranium market conditions;; any expectation as to the timing of the closing of the Transaction or whether the closing will in fact occur; any expectation that the Transaction may fully finance much of the Company’s uranium, rare earth, vanadium, and medical isotope business plans for the next two to three years; any expectation that the Company may license and eventually produce uranium from its Sheep Mountain, Roca Honda and/or Bullfrog projects; any expectation as to recommencement of production at any of the Company’s uranium mines or the timing thereof; any expectation as to the ability of the Company to secure any new sources of ore or other processing opportunities at the Mill through an ore purchasing program; any expectation as to timelines for the permitting and development of projects; any expectation that the Company will maintain its position as a leading uranium company in the United States; any expectation with respect to timelines to production; any expectation that the Mill will be successful in producing RE Carbonate and/or separated REE oxides or oxalates on a full-scale commercial basis; any expectation that Energy Fuels will be successful in developing U.S. separation, or other value-added U.S. REE production capabilities at the Mill, or otherwise, including the timing of any such initiatives and the expected production capacity or capital and operating costs associated with any such production capabilities; any expectation with respect to the quantities of monazite sands to be acquired by Energy Fuels, the quantities of RE Carbonate to be produced by the Mill or the quantities of contained TREO in the Mill’s RE Carbonate; any expectation that the Company may sell its separated NdPr oxide (or oxalate) to major electric vehicle manufacturers in the U.S. and Europe; any expectation that the Bahia Project has the potential to feed the Mill with REE and uranium-bearing monazite sand for decades; any expectation as to the quantities to be delivered under existing uranium sales contracts, or that such contracts may help underpin the Company’s uranium business for many years to come; and any expectation that the Company will generate net income in future periods. Generally, these forward-looking statements can be identified by the use of forward-looking terminology such as “plans,” “expects,” “does not expect,” “is expected,” “is likely,” “budgets,” “scheduled,” “estimates,” “forecasts,” “intends,” “anticipates,” “does not anticipate,” or “believes,” or variations of such words and phrases, or state that certain actions, events or results “may,” “could,” “would,” “might” or “will be taken,” “occur,” “be achieved” or “have the potential to.” All statements, other than statements of historical fact, herein are considered to be forward-looking statements. Forward-looking statements involve known and unknown risks, uncertainties and other factors which may cause the actual results, performance or achievements of the Company to be materially different from any future results, performance or achievements express or implied by the forward-looking statements. Factors that could cause actual results to differ materially from those anticipated in these forward-looking statements include risks associated with: commodity prices and price fluctuations; processing and mining difficulties, upsets and delays; permitting and licensing requirements and delays; changes to regulatory requirements; legal challenges; the availability of sources of Alternate Feed Materials and other feed sources for the Mill; competition from other producers; public opinion; government and political actions; available supplies of monazite sands; the ability of the Mill to produce RE Carbonate to meet commercial specifications on a commercial scale at acceptable costs; the ability of Neo to separate the RE Carbonate produced by the Mill to meet commercial specifications on a commercial scale at acceptable costs; market factors, including future demand for REEs; the ability of the Mill to be able to separate radium or other radioisotopes at reasonable costs or at all; market prices and demand for medical isotopes; and the other factors described under the caption “Risk Factors” in the Company’s most recently filed Annual Report on Form 10-K, which is available for review on EDGAR at www.sec.gov/edgar.shtml, on SEDAR at www.sedar.com, and on the Company’s website at www.energyfuels.com. Forward-looking statements contained herein are made as of the date of this news release, and the Company disclaims, other than as required by law, any obligation to update any forward-looking statements whether as a result of new information, results, future events, circumstances, or if management’s estimates or opinions should change, or otherwise. There can be no assurance that forward-looking statements will prove to be accurate, as actual results and future events could differ materially from those anticipated in such statements. Accordingly, the reader is cautioned not to place undue reliance on forward-looking statements. The Company assumes no obligation to update the information in this communication, except as otherwise required by law.
SOURCE Energy Fuels Inc.
For further information: Investor Inquiries: Energy Fuels Inc., Curtis Moore, VP – Marketing and Corporate Development, (303) 974-2140 or Toll free: (888) 864-2125, investorinfo@energyfuels.com, www.energyfuels.com
Michael Heim, CFA, Senior Research Analyst, Noble Capital Markets, Inc.
Refer to the full report for the price target, fundamental analysis, and rating.
Permex announced it has received approval to uplist to the NYSE. Shares are expected to begin trading on November 15 under the symbol OILS (warrants will trade under OILSW). The uplisting follows a October 31st announcement that Permex would consolidate outstanding shares on the basis of a one for every sixty pre-consolidation shares. We indicated at the time that we believed management was doing a reverse stock split as a prerequisite to uplisting on the NYSE. We believe listing on the NYSE will greatly enhance the company’s ability to attract investor attention and unlock Permex’s hidden value.
Permex has filed an offering registration. On November 4th, Permex file a S-1 Registration Statement with the SEC to offer 2 million common shares (post reverse stock split currently trading under the symbol OIL on the Toronto exchange and on the OTC under the symbol OILCD.) On November 9th, the company filed an addendum increasing the share offering to 3.6 million shares which now include a warrant to purchase shares at a 125% premium to the offering price. The offering is being done in conjunction with the uplisting implying it will be completed by November 15th.
This Company Sponsored Research is provided by Noble Capital Markets, Inc., a FINRA and S.E.C. registered broker-dealer (B/D).
*Analyst certification and important disclosures included in the full report. NOTE: investment decisions should not be based upon the content of this research summary. Proper due diligence is required before making any investment decision.
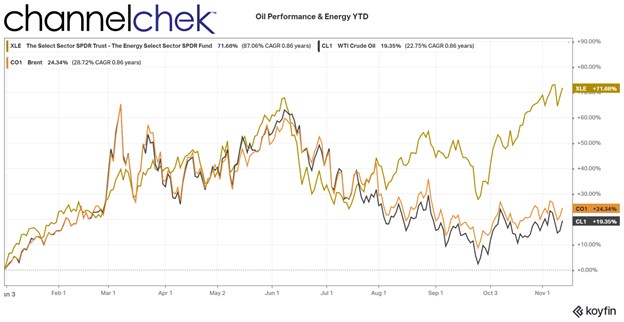
Factors Still Point to Higher Oil Prices and Sizeable Bets on Crude
There are many factors impacting why traditional energy prices and producers may have a hurricane-force tailwind heading into the holidays and next year.
A boost in demand for oil is expected as China just announced that it is lowering its quarantine requirements for visitors from outside the country. But Chinese Covid policies aren’t the only impetus pushing up oil demand – around the globe, there are supply challenges that are playing out. Oil hasn’t risen above $100 a barrel since early Summer, some traders are speculating it will rise above $200 in the coming months. Here’s why.
China
In addition to the announcement that the CPR was cutting the required quarantine period for the country (to five days from seven, with three days of home isolation), the required PCR test hurdle is being lowered as well. And airlines no longer run the risk of being suspended if the travelers they bring in that test positive is five or more.
Europe
The European Union has agreed to stop all oil imports from Russia on Dec. 5. The plan is to cap the prices at which EU nations would buy oil from Russia, that price is expected to be near $60 per barrel. Russia has reacted by increasing exports to Asia, but the price cap is expected to reduce its exports and lower total supply by up to one million barrels per day.
United States
Back in May, the U.S. took the drastic step of increasing available supply by selling oil from the U.S. Strategic Petroleum Reserve at a rate of nearly one million barrels per day starting in May. The increased supply has kept oil prices down. But the sales are unsustainable and expected to be reduced. Congress has allowed another sale of 26 million barrels that are expected to carry through to October 2023. This is a much slower pace of oil releases from the reserves. Plus, the reserves will need to be replenished.
After the Congressionally approved release, the reserve will be down to 348 million barrels, this is half the quantity compared to January of this year —the lowest since 1983. Congress has said that the reserve must stay above 252.4 million barrels, and the incoming Congress is expected to be more conservative when it comes to using these strategic assets to control prices.
Production growth overall in the U.S. has stalled after having increased through most of the year. Government data show that U.S. production dropped to 11.9 million barrels per day last week, this is tied for the lowest level in several months. Supplies of products such as diesel and heating oil in the U.S. are at multiyear lows. So there is not abundant supply should a weather-related or some other fuel-demanding crisis surface.
Oil is now trading between $92 and $93 a barrel. It had reached a high above $130 in March, shortly after the war began, and hasn’t seen the $100 a barrel level since late June.
Trading this week showed significant flows into an options contract that speculates that $200 per barrel may be in store. The most actively traded Brent crude options contract on Thursday was an option to buy Brent at $200 in March 2023. This was the most active oil contract of the day.
How significant is this bullish activity surrounding oil prices? The ratio of bullish to bearish bets in the options market is wider than at any time in recorded history, according to Bloomberg. Oil options traders are positioned more aggressively than ever before.
Take Away
Oil demand could rise soon in China as travel restrictions are lessened. Elsewhere in the world, oil demand is expected to increase as supplies remain the same or decrease. Demand remained elevated globally despite slower economies.
With supply likely to drop and demand ramping up, $200 by the third week in March is one price expectation for a record number of trades transacted at recently. More than doubling in a few months sounds unthinkable, but the massive trades were transacted by experienced institutional traders.
DALLAS, Nov. 10, 2022 (GLOBE NEWSWIRE) — Permex Petroleum Corporation (CSE: OIL) (OTCQB: OILCD) (FSE: 75P) (“Permex” or the “Company”), an independent energy company engaged in the acquisition, exploration, development and production of oil and natural gas properties on private, state and federal land in the United States, today announced that it has received approval to uplist its common shares and list its warrants on the NYSE American in connection with an underwritten public offering of its common shares (or common share equivalents) and warrants to purchase common shares. Trading of the Company’s common shares and warrants is expected to commence on the NYSE at the opening of trading on November 15, 2022 under the ticker symbols “OILS” and “OILSW,” respectively. Permex’s listing is subject to meeting all NYSE American requirements at the time of listing. Trading on the OTCQB will cease concurrent with the NYSE American listing.
This press release shall not constitute an offer to sell or the solicitation of an offer to buy these securities, nor shall there be any sale of these securities in any state or jurisdiction in which such offer, solicitation or sale would be unlawful prior to registration or qualification under the securities laws of any such state or jurisdiction.
About Permex Petroleum Corporation
Permex Petroleum is a uniquely positioned junior oil and gas company with assets and operations across the Permian Basin of West Texas and the Delaware Sub-Basin of New Mexico. The Company focuses on combining its low-cost development of Held by Production assets for sustainable growth with its current and future Blue-Sky projects for scale growth. The Company, through its wholly-owned subsidiary, Permex Petroleum US Corporation, is a licensed operator in both states, and owns and operates on private, state and federal land. For more information, please visit www.permexpetroleum.com.
FORWARD-LOOKING STATEMENTS
Statements in this press release may constitute forward-looking statements for the purposes of the safe harbor provisions under the Private Securities Litigation Reform Act of 1995 and other federal securities laws. These forward-looking statements are made on the basis of the current beliefs, expectations and assumptions of management, are not guarantees of performance and are subject to significant risks and uncertainty. These forward- looking statements should, therefore, be considered in light of various important factors, including those set forth in Company’s reports that it files from time to time with the U.S. Securities and Exchange Commission and the Canadian securities regulators which you should review. When used in this press release, words such as “will,” “could,” “plan,” “estimate”, “expect”, “intend”, “may”, “potential”, “believe”, “should” and similar expressions, are forward-looking statements. Forward-looking statements may include, without limitation, statements relating to the Company’s listing on NYSE American, financial condition and operating results, legal, economic, business, competitive and/or regulatory factors affecting Permex’s businesses and any other statements regarding events or developments Permex believes or anticipates will or may occur in the future. These forward-looking statements should not be relied upon as predictions of future events, and the Company cannot assure you that the events or circumstances discussed or reflected in these statements will be achieved or will occur. If such forward-looking statements prove to be inaccurate, the inaccuracy may be material. You should not regard these statements as a representation or warranty by the Company or any other person that it will achieve its objectives and plans in any specified timeframe, or at all. You are cautioned not to place undue reliance on these forward-looking statements, which speak only as of the date of this press release. The Company disclaims any obligation to publicly update or release any revisions to these forward- looking statements, whether as a result of new information, future events or otherwise, after the date of this news release or to reflect the occurrence of unanticipated events, except as required by law.
InPlay Oil is a junior oil and gas exploration and production company with operations in Alberta focused on light oil production. The company operates long-lived, low-decline properties with drilling development and enhanced oil recovery potential as well as undeveloped lands with exploration possibilities. The common shares of InPlay trade on the Toronto Stock Exchange under the symbol IPO and the OTCQX Exchange under the symbol IPOOF.
Michael Heim, CFA, Senior Research Analyst, Noble Capital Markets, Inc.
Refer to the full report for the price target, fundamental analysis, and rating.
Third-quarter results were below expectations due to lower-than-expected energy pricing. Production levels were in line with expectations and management guidance given on September 29. Realized oil and gas prices were well below U.S. reported oil and gas prices when adjusted to Canadian prices, reflecting a widening basis discount for western Canada production. We will incorporate a widening basis differential going forward.
InPlay is able to offset a weakening pricing environment with ever-improving production results. Management provided production guidance for 2023-25 for the first time. Guidance was well above production levels assumed in our models and reflects an acceleration of capital investments going forward. We believe increased investment is prudent at current payback rates of less than one year. We also believe management’s commitment to higher spending levels is a positive sign that it believes it has ample areas to drill at attractive returns.
This Company Sponsored Research is provided by Noble Capital Markets, Inc., a FINRA and S.E.C. registered broker-dealer (B/D).
*Analyst certification and important disclosures included in the full report. NOTE: investment decisions should not be based upon the content of this research summary. Proper due diligence is required before making any investment decision.
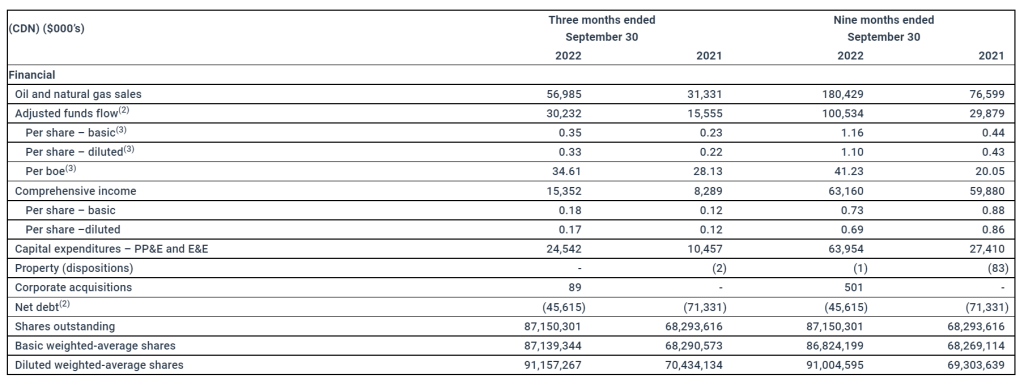
CALGARY, Alberta, Nov. 09, 2022 (GLOBE NEWSWIRE) — InPlay Oil Corp. (TSX: IPO) (OTCQX: IPOOF) (“InPlay” or the “Company”) announces its record setting financial and operating results for the three and nine months ended September 30, 2022 and the implementation of an inaugural base dividend. The implementation of the inaugural base dividend is a significant milestone in the Company’s strategy of providing additional strong returns to shareholders through the return of capital along with the generation of free adjusted funds flow (“FAFF”)(4) and top-tier light oil weighted production per share growth which has been made possible by the Company’s strong financial and operational position.
InPlay’s condensed unaudited interim financial statements and notes, as well as Management’s Discussion and Analysis (“MD&A”) for the three and nine months ended September 30, 2022 will be available at “www.sedar.com” and our website at “www.inplayoil.com”. An updated presentation will be posted to our website in due course.
Inaugural Base Dividend
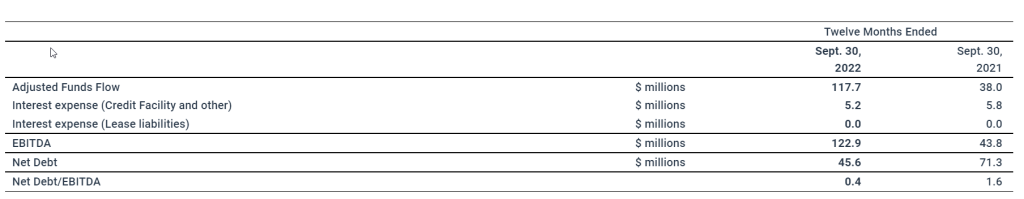
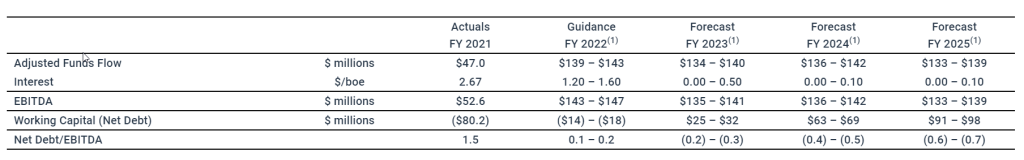
InPlay is pleased to announce that its Board of Directors has approved the implementation of a base cash dividend of $0.015/share per month. The initial dividend is payable on November 30, 2022 to holders of the Company’s common shares of record at the close of business on November 18, 2022. The Company continues to make strong progress with respect to its debt reduction targets with a trailing 12 month net debt(2) to earnings before interest, taxes and depletion (“EBITDA”) ratio(4) of less than 0.4x at the end of the third quarter, which is forecast to be approximately 0.1x to 0.2x at year end (inclusive of the monthly base dividend). Any dividend payment after the initial one will be subject to the approval of InPlay’s Board of Directors at the time of declaration.
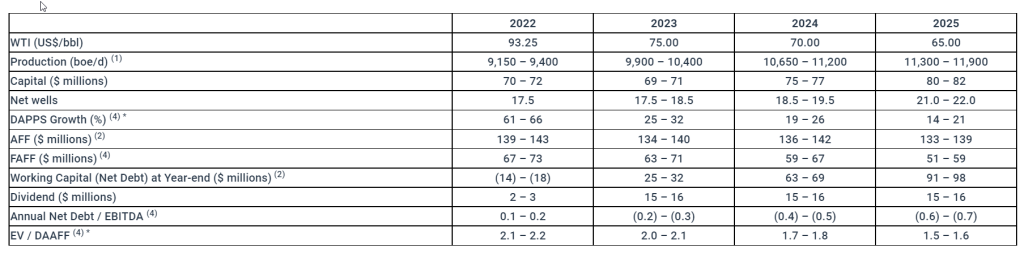
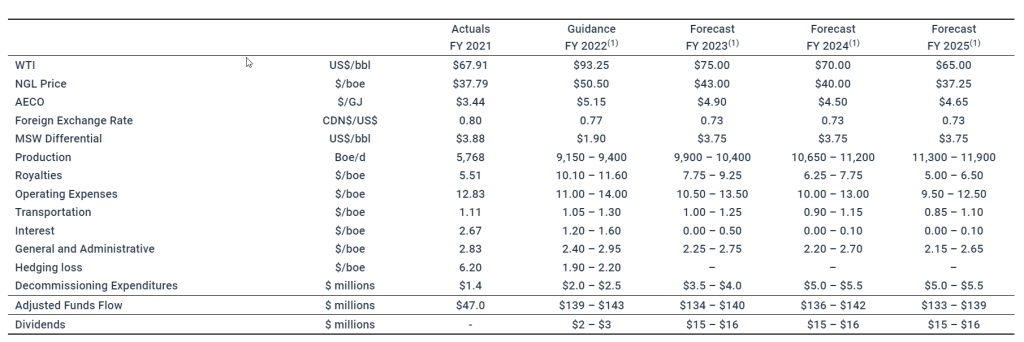
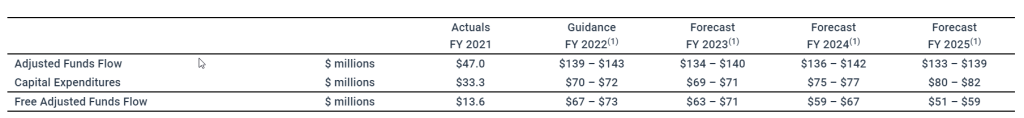
In determining the initial base dividend rate, InPlay’s Board of Directors took into account the Company’s strong balance sheet and the sustainability of the dividend in the event of a significant drop in commodity prices. In accordance with the recently released long term forecast, the Company projects that the base dividend is sustainable in a flat US$55/bbl WTI price environment in 2023 through 2025 with net debt to EBITDA levels remaining below 0.3x. Using forward strip pricing, as disclosed in our long term forecast announced on Sept 28, 2022 (which is approximately USD $5 – $7 per barrel lower than current WTI forward strip pricing), the Company is forecasting strong FAFF resulting in a build in our positive working capital balance (inclusive of capital expenditures and the monthly base dividend) to $91 – $98 million through the end of 2025 as outlined in greater detail in the “Outlook” section below. Over time, the Company anticipates that excess FAFF will be used for special dividends, share buybacks, tactical capital investment and strategic acquisitions.
The monthly cash dividend is expected to be designated as an “eligible dividend” for Canadian federal and provincial income tax purposes.
Third Quarter 2022 Financial & Operating Highlights
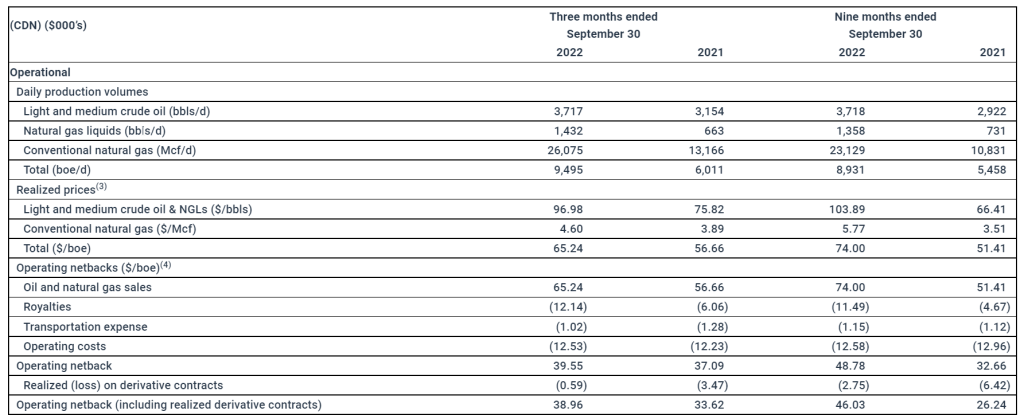
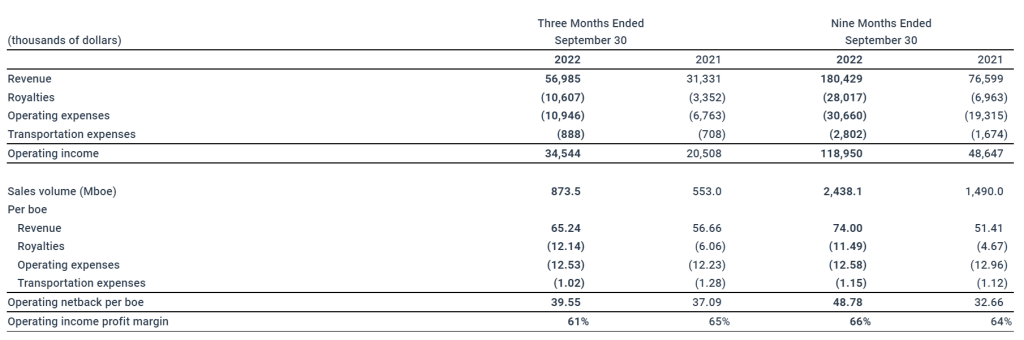
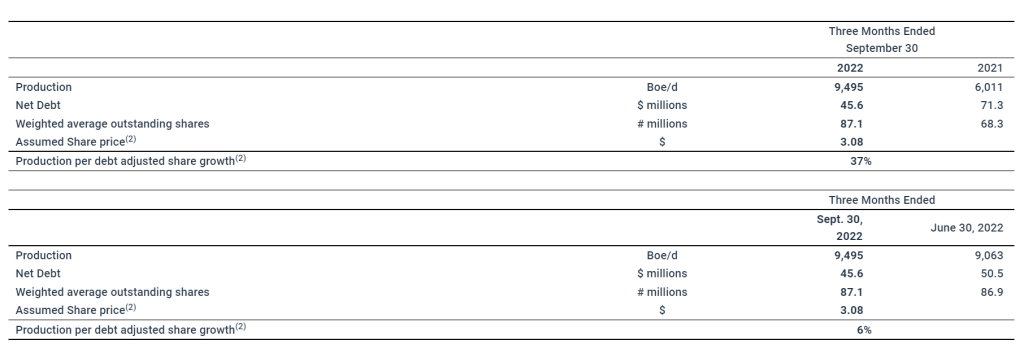
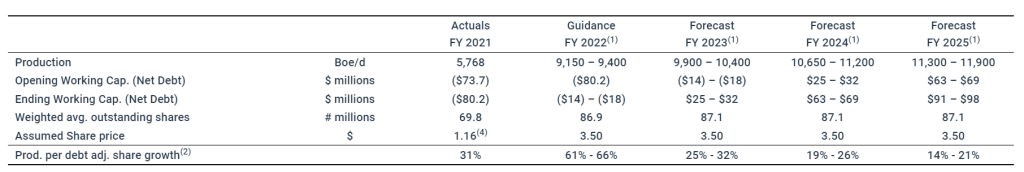
Achieved record average quarterly production of 9,495 boe/d(1) (54% light crude oil and NGLs), an increase of 58% from third quarter production in 2021 of 6,011 boe/d(1) (64% light crude oil and NGLs) and an increase of 5% compared to our previous record of 9,063 boe/d(1) (57% light crude oil and NGLs) in the second quarter of 2022. Average production per weighted average basic share increased 24% compared to the third quarter of 2021 (37% on a debt adjusted(4) basis) and 4% compared to the second quarter of 2022 (6% on a debt adjusted basis).
Generated quarterly adjusted funds flow (“AFF”)(2) of $30.2 million ($0.35 per weighted average basic share(3)), an increase of 94% compared to $15.6 million ($0.23 per weighted average basic share) in the third quarter of 2021. On a year-to-date basis, generated AFF of $100.5 million ($1.16 per weighted average basic share(3)), an increase of 236% compared to $29.9 million ($0.44 per weighted average basic share) in 2021.
Increased operating netbacks(4) on a year to date basis by 49% to $48.78/boe from $32.66/boe in 2021.
Realized quarterly operating income(4) of $34.5 million, an increase of 68% compared to $20.5 million in the third quarter of 2021. On a year-to-date basis, realized quarterly operating income $119.0 million, an increase of 145% compared to $48.6 million in 2021.
Maintained operating expenses at $12.53/boe compared to $12.23/boe in the third quarter of 2021 and $12.28/boe in the second quarter of 2022, despite rising costs of industry services as well as fuel and energy costs.
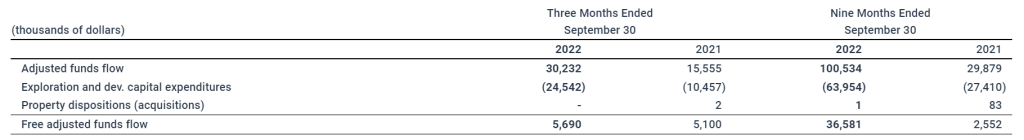
Generated FAFF of $5.7 million resulting in a 10% reduction to net debt from June 30, 2022 with the majority of 2022 annual capital expenditures already incurred. Strong FAFF and resulting debt reductions are expected to accumulate throughout the fourth quarter (inclusive of the monthly base dividend).
Achieved a trailing twelve month net debt to EBITDA ratio of less than 0.4x to September 30, 2022 with a ratio of between 0.1x to 0.2x forecasted by year end (inclusive of the monthly base dividend).
Realized net income of $15.4 million ($0.18 per basic share; $0.17 per diluted share). On a year-to-date basis, realized net income of $63.2 million ($0.73 per basic share; $0.69 per diluted share).
Financial and Operating Results
Third Quarter 2022 Financial & Operations Overview
Production averaged 9,495 boe/d(1) (54% light crude oil & NGLs) of sales in the third quarter of 2022, the sixth consecutive quarter that the Company has increased its quarterly production record. Quarterly production increased by 58% compared to 6,011 boe/d(1) (64% light crude oil & NGLs) in the third quarter of 2021 and 5% compared to 9,063 boe/d(1) (57% light crude oil & NGLs) in the second quarter of 2022, our previous quarterly record. This resulted in $30.2 million of AFF generated during the third quarter of 2022 and $5.7 million of FAFF which has reduced net debt levels by 10% to $45.6 million at September 30, 2022. On a year-to-date basis, the Company has generated AFF of $100.5 million and FAFF of $36.6 million resulting in a 43% reduction to net debt from December 31, 2021. Liquidity ratios to the end of the quarter continued to improve resulting in a trailing twelve month net debt to EBITDA ratio of less than 0.4x to September 30, 2022.
InPlay’s capital program for the third quarter of 2022 consisted of $24.5 million of capital expenditures. During the quarter, the Company completed and brought on production two (1.9 net) Extended Reach Horizontal (“ERH”) wells in Willesden Green that were drilled in the second quarter. Also in Willesden Green, the Company drilled, completed and brought on production three (2.9 net) ERH wells. Drilling operations were completed on an additional two (1.9 net) ERH wells in Willesden Green during the third quarter and these wells were brought on production in October. The Company also allocated capital to the construction of two Vapor Recovery Units which will increase gas conservation and reduce greenhouse gas emissions.
Efficient field operations and increased production levels allowed the Company to limit operating cost increases, achieving operating costs of $12.53/boe compared to $12.23/boe in the third quarter of 2021 and $12.28/boe in the second quarter of 2022. The Company continues to focus on operational efficiency and is proactive in reducing the impact of the inflationary pressures and supply chain disruptions that are impacting the oil and gas industry. This resulted in strong operating income and operating netbacks during the quarter of $34.5 million and $39.55/boe respectively.
Outlook
InPlay began its fourth quarter capital program drilling one (0.95 net) ERH well in Willesden Green which was brought on production in late October and is flowing without artificial lift and the start of drilling operations with our first two (2.0 net) Belly River wells. InPlay utilized the technologies and expertise developed in our Cardium play over the years to complete these Belly River drills in 5.4 and 5.6 days respectively. This was a dramatic improvement compared to our most recent two one-mile drilling operations in the area in 2016 averaging approximately 10 days per well and approximately 2.5 days quicker than recent one-mile wells drilled in the area by other operators.
Given the continued strong operational results and positive future commodity prices, the Company reiterates its 2022 guidance and long-term forecast as released September 27, 2022 with the incorporation of the base dividend. The Company remains committed to providing top-tier production per share growth and a return of capital to shareholders. This base dividend and the recently implemented share buyback program in addition to our forecasted measured production per share growth places InPlay in a solid position to continue realizing on meaningful returns to shareholders over the long term.
The table below reiterates the highlights of our 2022 guidance and long-term forecast at our current share price, including the impact of our inaugural base dividend:
* Assumes a $3.50 share price
The amounts above do not include potential future purchases through the Company’s normal course issuer bid (“NCIB”).
As outlined above in the long term forecast, the Company is forecasting to generate material FAFF resulting in a growing positive working capital balance through to 2025. Our strategy for the accumulating additional FAFF is to provide additional means for returns to shareholders through dividends, share buybacks, increased tactical capital investment and accretive strategic acquisitions.
InPlay is pleased to achieve this significant milestone of implementing our inaugural base dividend and would like to thank our employees, board members, lenders and shareholders for their support. The Company looks forward to releasing our 2023 budget outlining our capital program for the year in early January.
Doug Bartole President and Chief Executive Officer InPlay Oil Corp. Telephone: (587) 955-0632
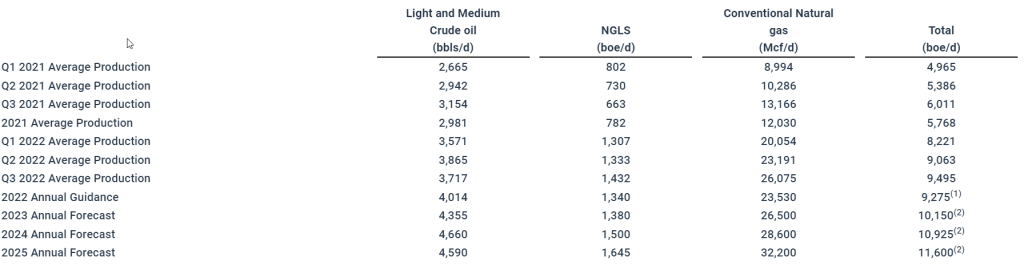
See “Production Breakdown by Product Type” at the end of this press release.
Capital management measure. See “Non-GAAP and Other Financial Measures” contained within this press release.
Supplementary financial measure. See “Non-GAAP and Other Financial Measures” contained within this press release.
Non-GAAP financial measure or ratio that does not have a standardized meaning under International Financial Reporting Standards (IFRS) and GAAP and therefore may not be comparable with the calculations of similar measures for other companies. Please refer to “Non-GAAP and Other Financial Measures” contained within this press release.
Reader Advisories
Non-GAAP and Other Financial Measures
Throughout this press release and other materials disclosed by the Company, InPlay uses certain measures to analyze financial performance, financial position and cash flow. These non-GAAP and other financial measures do not have any standardized meaning prescribed under GAAP and therefore may not be comparable to similar measures presented by other entities. The non-GAAP and other financial measures should not be considered alternatives to, or more meaningful than, financial measures that are determined in accordance with GAAP as indicators of the Company performance. Management believes that the presentation of these non-GAAP and other financial measures provides useful information to shareholders and investors in understanding and evaluating the Company’s ongoing operating performance, and the measures provide increased transparency and the ability to better analyze InPlay’s business performance against prior periods on a comparable basis.
Non-GAAP Financial Measures and Ratios
Included in this document are references to the terms “free adjusted funds flow”, “operating income”, “operating netback per boe”, “operating income profit margin”, “Net Debt to EBITDA” and “Debt adjusted production per share”. Management believes these measures and ratios are helpful supplementary measures of financial and operating performance and provide users with similar, but potentially not comparable, information that is commonly used by other oil and natural gas companies. These terms do not have any standardized meaning prescribed by GAAP and should not be considered an alternative to, or more meaningful than “profit (loss) before taxes”, “profit (loss) and comprehensive income (loss)”, “adjusted funds flow”, “capital expenditures”, “corporate acquisitions, net of cash acquired”, “net debt”, “weighted average number of common shares (basic)” or assets and liabilities as determined in accordance with GAAP as a measure of the Company’s performance and financial position.
Free Adjusted Funds Flow
Management considers FAFF an important measure to identify the Company’s ability to improve its financial condition through debt repayment and its ability to provide returns to shareholders. FAFF should not be considered as an alternative to or more meaningful than AFF as determined in accordance with GAAP as an indicator of the Company’s performance. FAFF is calculated by the Company as AFF less exploration and development capital expenditures and property dispositions (acquisitions) and is a measure of the cashflow remaining after capital expenditures before corporate acquisitions that can be used for additional capital activity, corporate acquisitions, repayment of debt or decommissioning expenditures or potentially return of capital to shareholders. Refer below for a calculation of historical FAFF and to the “Forward Looking Information and Statements” section for a calculation of forecast FAFF.
Operating Income/Operating Netback per boe/Operating Income Profit Margin
InPlay uses “operating income”, “operating netback per boe” and “operating income profit margin” as key performance indicators. Operating income is calculated by the Company as oil and natural gas sales less royalties, operating expenses and transportation expenses and is a measure of the profitability of operations before administrative, share-based compensation, financing and other non-cash items. Management considers operating income an important measure to evaluate its operational performance as it demonstrates its field level profitability. Operating income should not be considered as an alternative to or more meaningful than net income as determined in accordance with GAAP as an indicator of the Company’s performance. Operating netback per boe is calculated by the Company as operating income divided by average production for the respective period. Management considers operating netback per boe an important measure to evaluate its operational performance as it demonstrates its field level profitability per unit of production. Operating income profit margin is calculated by the Company as operating income as a percentage of oil and natural gas sales. Management considers operating income profit margin an important measure to evaluate its operational performance as it demonstrates how efficiently the Company generates field level profits from its sales revenue. Refer below for a calculation of operating income, operating netback per boe and operating income profit margin.
Net Debt to EBITDA
Management considers Net Debt to EBITDA an important measure as it is a key metric to identify the Company’s ability to fund financing expenses, net debt reductions and other obligations. EBITDA is calculated by the Company as adjusted funds flow before interest expense. When this measure is presented quarterly, EBITDA is annualized by multiplying by four. When this measure is presented on a trailing twelve month basis, EBITDA for the twelve months preceding the net debt date is used in the calculation. This measure is consistent with the EBITDA formula prescribed under the Company’s Senior Credit Facility. Net Debt to EBITDA is calculated as Net Debt divided by EBITDA. Refer below for a calculation of Net Debt to EBITDA and to the “Forward Looking Information and Statements” section for a calculation of forecast Net Debt to EBITDA.
Production per Debt Adjusted Share
InPlay uses “Production per debt adjusted share” as a key performance indicator. Debt adjusted shares should not be considered as an alternative to or more meaningful than common shares as determined in accordance with GAAP as an indicator of the Company’s performance. Debt adjusted shares is a non-GAAP measure used in the calculation of Production per debt adjusted share and is calculated by the Company as common shares outstanding plus the change in net debt divided by the Company’s current trading price on the TSX, converting net debt to equity. Debt adjusted shares should not be considered as an alternative to or more meaningful than weighted average number of common shares (basic) as determined in accordance with GAAP as an indicator of the Company’s performance. Management considers Debt adjusted share is a key performance indicator as it adjusts for the effects of capital structure in relation to the Company’s peers. Production per debt adjusted share is calculated by the Company as production divided by debt adjusted shares. Management considers Production per debt adjusted share is a key performance indicator as it adjusts for the effects of changes in annual production in relation to the Company’s capital structure. Refer below for a calculation of Production per debt adjusted share and to to the “Forward Looking Information and Statements” section for a calculation of forecast Production per debt adjusted share.
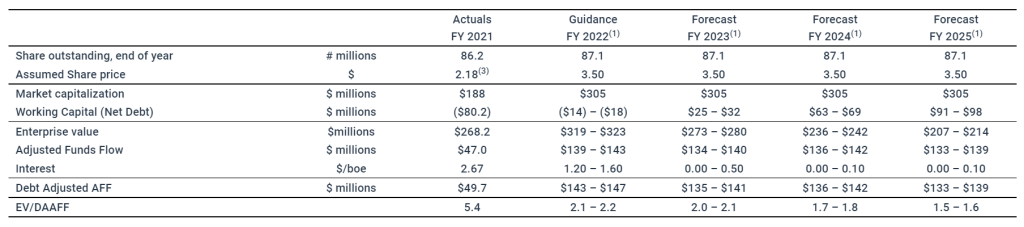
EV / DAAFF
InPlay uses “enterprise value to debt adjusted AFF” or “EV/DAAFF” as a key performance indicator. EV/DAAFF is calculated by the Company as enterprise value divided by debt adjusted AFF for the relevant period. Debt adjusted AFF (“DAAFF”) is calculated by the Company as adjusted funds flow plus financing costs. Enterprise value is a capital management measures that is used in the calculation of EV/DAAFF. Enterprise value is calculated as the Company’s market capitalization plus working capital (net debt). Management considers enterprise value a key performance indicator as it identifies the total capital structure of the Company. Management considers EV/DAAFF a key performance indicator as it is a key metric used to evaluate the sustainability of the Company relative to other companies while incorporating the impact of differing capital structures. Refer to the “Forward Looking Information and Statements” section for a calculation of forecast EV/DAAFF.
Capital Management Measures
Adjusted Funds Flow
Management considers adjusted funds flow to be an important measure of InPlay’s ability to generate the funds necessary to finance capital expenditures. AFF is a GAAP measure and is disclosed in the notes to the Company’s consolidated financial statements for the year ending December 31, 2021 and the most recently filed quarterly financial statements. All references to AFF throughout this document are calculated as funds flow adjusting for decommissioning expenditures and transaction and integration costs. This item is adjusted from funds flow as decommissioning expenditures are incurred on a discretionary and irregular basis and are primarily incurred on previous operating assets and transaction costs are non-recurring costs for the purposes of an acquisition, making the exclusion of these items relevant in Management’s view to the reader in the evaluation of InPlay’s operating performance. The Company also presents AFF per share whereby per share amounts are calculated using weighted average shares outstanding consistent with the calculation of profit (loss) per common share.
Net Debt / Working Capital
Net debt / working capital is a GAAP measure and is disclosed in the notes to the Company’s consolidated financial statements for the year ending December 31, 2021 and the most recently filed quarterly financial statements. The Company closely monitors its capital structure with a goal of maintaining a strong balance sheet to fund the future growth of the Company. The Company monitors net debt / working capital as part of its capital structure. The Company uses net debt / working capital (bank debt plus accounts payable and accrued liabilities less accounts receivables and accrued receivables, prepaid expenses and deposits and inventory) as an alternative measure of outstanding debt. Management considers net debt / working capital an important measure to assist in assessing the liquidity of the Company.
Supplementary Measures
“Average realized crude oil price” is comprised of crude oil commodity sales from production, as determined in accordance with IFRS, divided by the Company’s crude oil production. Average prices are before deduction of transportation costs and do not include gains and losses on financial instruments.
“Average realized NGL price” is comprised of NGL commodity sales from production, as determined in accordance with IFRS, divided by the Company’s NGL production. Average prices are before deduction of transportation costs and do not include gains and losses on financial instruments.
“Average realized natural gas price” is comprised of natural gas commodity sales from production, as determined in accordance with IFRS, divided by the Company’s natural gas production. Average prices are before deduction of transportation costs and do not include gains and losses on financial instruments.
“Average realized commodity price” is comprised of commodity sales from production, as determined in accordance with IFRS, divided by the Company’s production. Average prices are before deduction of transportation costs and do not include gains and losses on financial instruments.
“AFF per weighted average basic share” is comprised of AFF divided by the basic weighted average common shares.
“AFF per weighted average diluted share” is comprised of AFF divided by the diluted weighted average common shares.
“AFF per boe” is comprised of AFF divided by total production.
Forward-Looking Information and Statements
This news release contains certain forward–looking information and statements within the meaning of applicable securities laws. The use of any of the words “expect”, “anticipate”, “continue”, “estimate”, “may”, “will”, “project”, “should”, “believe”, “plans”, “intends”, “forecast”, “targets”, “framework” and similar expressions are intended to identify forward-looking information or statements. In particular, but without limiting the foregoing, this news release contains forward looking information and statements pertaining to the following: the Company’s business strategy, milestones and objectives including, without limitation, the Company’s forecast net debt to EBITDA ratio at year ended 2022; InPlay’s expectations regarding the sustainability of the base monthly dividend, including in the event of a drop in commodity prices; the projection that the dividend is sustainable in a flat $US 55/bbl WTI price environment; the expectation that the net debt to EBITDA ratio will continue to drop; the anticipated generation of strong FAFF through 2025 and our expected working capital balance; the expectation that additional FAFF will be used for special dividends, share buybacks, tactical capital investment and strategic acquisitions; the expectation of strong debt reductions in the fourth quarter of 2022; the expected results from the construction of the two Vapor Recovery Units; the anticipated timing of the release of the Company’s 2023 budget; expectations regarding future commodity prices; future oil and natural gas prices; future liquidity and financial capacity; future results from operations and operating metrics; future costs, expenses and royalty rates; future interest costs; the exchange rate between the $US and $Cdn; the anticipated tax treatment of the monthly base dividend; future development, exploration, acquisition, development and infrastructure activities and related capital expenditures, including our planned 2022 capital program and associated guidance and long-term forecast to 2025.
Without limitation of the foregoing, readers are cautioned that the Company’s future dividend payments to shareholders of the Company, if any, and the level thereof will be subject to the discretion of the Board of Directors of InPlay. The Company’s dividend policy and funds available for the payment of dividends, if any, from time to time, is dependent upon, among other things, levels of FAFF, leverage ratios, financial requirements for the Company’s operations and execution of its growth strategy, fluctuations in commodity prices and working capital, the timing and amount of capital expenditures, credit facility availability and limitations on distributions existing thereunder, and other factors beyond the Company’s control. Further, the ability of the Company to pay dividends will be subject to applicable laws, including satisfaction of solvency tests under the Business Corporations Act (Alberta), and satisfaction of certain applicable contractual restrictions contained in the agreements governing the Company’s outstanding indebtedness.
Forward-looking statements or information are based on a number of material factors, expectations or assumptions of InPlay which have been used to develop such statements and information but which may prove to be incorrect. Although InPlay believes that the expectations reflected in such forward looking statements or information are reasonable, undue reliance should not be placed on forward-looking statements because InPlay can give no assurance that such expectations will prove to be correct. In addition to other factors and assumptions which may be identified herein, assumptions have been made regarding, among other things: the impact of increasing competition; the general stability of the economic and political environment in which InPlay operates; the timely receipt of any required regulatory approvals; the ability of InPlay to obtain qualified staff, equipment and services in a timely and cost efficient manner; drilling results; the ability of the operator of the projects in which InPlay has an interest in to operate the field in a safe, efficient and effective manner; the ability of InPlay to obtain debt financing on acceptable terms; the timing and amount of purchases under the Company’s NCIB; the anticipated tax treatment of the monthly base dividend; field production rates and decline rates; the ability to replace and expand oil and natural gas reserves through acquisition, development and exploration; the timing and cost of pipeline, storage and facility construction and the ability of InPlay to secure adequate product transportation; future commodity prices; that various conditions to a shareholder return strategy can be satisfied; expectations regarding the potential impact of COVID-19 and the Russia/Ukraine conflict; currency, exchange and interest rates; regulatory framework regarding royalties, taxes and environmental matters in the jurisdictions in which InPlay operates; and the ability of InPlay to successfully market its oil and natural gas products. The forward-looking information and statements included herein are not guarantees of future performance and should not be unduly relied upon. Such information and statements, including the assumptions made in respect thereof, involve known and unknown risks, uncertainties and other factors that may cause actual results or events to defer materially from those anticipated in such forward-looking information or statements including, without limitation: the continuing impact of the COVID-19 pandemic and the Russia/Ukraine conflict; inflation and the risk of a global recession; changes in our planned 2022 capital program; changes in our approach to shareholder returns, including in relation to the Company’s NCIB and the timing and amount of any potential purchases thereunder; changes in commodity prices and other assumptions outlined herein; the risk that dividend payments may be reduced, suspended or cancelled; the potential for variation in the quality of the reservoirs in which we operate; changes in the demand for or supply of our products; unanticipated operating results or production declines; changes in tax or environmental laws, royalty rates or other regulatory matters; changes in development plans or strategies of InPlay or by third party operators of our properties; changes in our credit structure, increased debt levels or debt service requirements; inaccurate estimation of our light crude oil and natural gas reserve and resource volumes; limited, unfavorable or a lack of access to capital markets; increased costs; a lack of adequate insurance coverage; the impact of competitors; and certain other risks detailed from time-to-time in InPlay’s continuous disclosure documents filed on SEDAR including our Annual Information Form and our MD&A.
This press release contains future-oriented financial information and financial outlook information (collectively, “FOFI”) about InPlay’s financial and leverage targets and objectives, InPlay’s long-term forecast, and potential dividends and share buybacks, all of which are subject to the same assumptions, risk factors, limitations, and qualifications as set forth in the above paragraphs. The actual results of operations of InPlay and the resulting financial results will likely vary from the amounts set forth in this press release and such variation may be material. InPlay and its management believe that the FOFI has been prepared on a reasonable basis, reflecting management’s best estimates and judgments. However, because this information is subjective and subject to numerous risks, it should not be relied on as necessarily indicative of future results. Except as required by applicable securities laws, InPlay undertakes no obligation to update such FOFI. FOFI contained in this press release was made as of the date of this press release and was provided for the purpose of providing further information about InPlay’s anticipated future business operations and strategy. Readers are cautioned that the FOFI contained in this press release should not be used for purposes other than for which it is disclosed herein.
The internal projections, expectations, or beliefs underlying our Board approved 2022 capital budget and associated guidance, as well as management’s preliminary estimates and targets in respect of plans for 2023 and beyond, are subject to change in light of the impact of the COVID-19 pandemic, and any related actions taken by businesses and governments, ongoing results, prevailing economic circumstances, volatile commodity prices, and industry conditions and regulations. InPlay’s financial outlook and guidance provides shareholders with relevant information on management’s expectations for results of operations, excluding any potential acquisitions or dispositions, for such time periods based upon the key assumptions outlined herein. In this document reference is made to the Company’s longer range 2023 and beyond internal plan and associated economic model. Such information reflects internal targets used by management for the purposes of making capital investment decisions and for internal long range planning and budget preparation. Readers are cautioned that events or circumstances could cause capital plans and associated results to differ materially from those predicted and InPlay’s guidance for 2022, and more particularly 2023 and beyond, may not be appropriate for other purposes. Accordingly, undue reliance should not be placed on same.
The forward-looking information and statements contained in this news release speak only as of the date hereof and InPlay does not assume any obligation to publicly update or revise any of the included forward-looking statements or information, whether as a result of new information, future events or otherwise, except as may be required by applicable securities laws.
The key budget and underlying material assumptions used by the Company in the development of its 2022 guidance and long-term forecast including forecasted production, operating income, capital expenditures, AFF, FAFF, working capital (net debt), Net Debt/EBITDA, production per debt adjusted share and EV/DAAFF are as follows:
Production Breakdown by Product Type Disclosure of production on a per boe basis in this press release consists of the constituent product types as defined in NI 51-101 and their respective quantities disclosed in the table below:
Notes:
This reflects the mid-point of the Company’s 2022 production guidance range of 9,150 to 9,400 boe/d.
This reflects the mid-point of the Company’s annual production forecast range.
With respect to forward-looking production guidance, product type breakdown is based upon management’s expectations based on reasonable assumptions but are subject to variability based on actual well results.
References to crude oil, NGLs or natural gas production in this press release refer to the light and medium crude oil, natural gas liquids and conventional natural gas product types, respectively, as defined in National Instrument 51-101, Standards of Disclosure for Oil and Gas Activities (“Nl 51-101”).
BOE Equivalent Barrel of oil equivalents or BOEs may be misleading, particularly if used in isolation. A BOE conversion ratio of 6 mcf: 1 bbl is based on an energy equivalency conversion method primarily applicable at the burner tip and does not represent a value equivalency at the wellhead. Given that the value ratio based on the current price of crude oil as compared to natural gas is significantly different than the energy equivalency of 6:1, utilizing a 6:1 conversion basis may be misleading as an indication of value.
Energy Fuels is a leading U.S.-based uranium mining company, supplying U3O8 to major nuclear utilities. Energy Fuels also produces vanadium from certain of its projects, as market conditions warrant, and is ramping up commercial-scale production of REE carbonate. Its corporate offices are in Lakewood, Colorado, near Denver, and all its assets and employees are in the United States. Energy Fuels holds three of America’s key uranium production centers: the White Mesa Mill in Utah, the Nichols Ranch in-situ recovery (“ISR”) Project in Wyoming, and the Alta Mesa ISR Project in Texas. The White Mesa Mill is the only conventional uranium mill operating in the U.S. today, has a licensed capacity of over 8 million pounds of U3O8 per year, has the ability to produce vanadium when market conditions warrant, as well as REE carbonate from various uranium-bearing ores. The Nichols Ranch ISR Project is on standby and has a licensed capacity of 2 million pounds of U3O8 per year. The Alta Mesa ISR Project is also on standby and has a licensed capacity of 1.5 million pounds of U3O8 per year. In addition to the above production facilities, Energy Fuels also has one of the largest NI 43-101 compliant uranium resource portfolios in the U.S. and several uranium and uranium/vanadium mining projects on standby and in various stages of permitting and development. The primary trading market for Energy Fuels’ common shares is the NYSE American under the trading symbol “UUUU,” and the Company’s common shares are also listed on the Toronto Stock Exchange under the trading symbol “EFR.” Energy Fuels’ website is www.energyfuels.com.
Michael Heim, CFA, Senior Research Analyst, Noble Capital Markets, Inc.
Refer to the full report for the price target, fundamental analysis, and rating.
CEO Marc Chalmers held a call with analysts and investors devoid of new announcements. Financial results were not even discussed save a quick mention that net income was $(9.2) million versus $(7.9) million, in line with our $(8.8) million estimate. Working capital remains strong at $122 million, 73% of which is cash. Management acknowledged that new releases have been slow this quarter, but emphasized that Energy Fuels is making extraordinary progress towards its goals. In a shortened and noticeably energetic presentation, management said several key quotes demonstrating their optimism towards the progress the company was making.
Uranium production is close. Management indicated that “utilities are moving away from Russian supply”. It reiterated that it has entered into three contracts with utilities that begin in 2023 and that the company has hired 20 employees to get uranium mining to be “push button ready” in “12 months or less”. Mr. Chalmers indicated that utilities in existing supply contracts want to “flex up” to higher levels and that he expects the company to sign additional contracts soon. UUUU has 760,000 lbs. in inventory to fulfill contracts and expects to mine 130,000-140,000 lbs. and produce 170,000 lbs. from unprocessed ore in 2023. No update on DOE plans to purchase up to 1 million lbs. for a national uranium reserve but UUUU is in a good position to be selected.
This Company Sponsored Research is provided by Noble Capital Markets, Inc., a FINRA and S.E.C. registered broker-dealer (B/D).
*Analyst certification and important disclosures included in the full report. NOTE: investment decisions should not be based upon the content of this research summary. Proper due diligence is required before making any investment decision.
GEVO TO HOST CONFERENCE CALL TODAY AT 4:30 P.M. ET
ENGLEWOOD, Colo., Nov. 08, 2022 (GLOBE NEWSWIRE) — Gevo, Inc. (NASDAQ: GEVO) (“Gevo”, the “Company”, “we”, “us” or “our”) today announced financial results for the third quarter of 2022 and recent corporate highlights.
Recent Corporate Highlights
On September 15, 2022, Gevo held a groundbreaking ceremony at the future site of its first commercial-scale sustainable aviation fuel (“SAF”) facility known as Net-Zero 1 (“NZ-1”) to be constructed in Lake Preston, South Dakota.
On September 19, 2022, the U.S. Department of Agriculture (“USDA”) tentatively selected Gevo’s Climate-Smart Farm to Flight proposal for a grant providing up to $30 million.
As part of the oneworld® Alliance, Qatar Airways (“Qatar”) has entered into a new fuel sales agreement with Gevo for 5 million gallons of sustainable aviation fuel (“SAF”) per year over five years with delivery of fuel expected to begin in 2028.
Iberia Airlines also entered into a new fuel sales agreement with Gevo for 6 million gallons of SAF per year over five years with delivery of fuel expected to begin in 2028
Gevo now has more than 375 million gallons per year (“MGPY”) of financeable SAF and hydrocarbon fuel supply agreements, which based on current market projections and operating assumptions, represent approximately $2.3 billion in expected revenue per year, inclusive of the value of environmental benefits.
The Company recently signed an agreement with Summit Carbon Solutions (“Summit”), whereby Summit is expected to safely capture, transport, and permanently store Gevo’s renewable CO2 from its Net-Zero 1 (“NZ-1”) plant in Lake Preston, South Dakota which will further reduce the carbon intensity of the fuel to be produced at NZ-1 and thus increase the expected value of associated environmental benefits.
2022 Third Quarter Financial Highlights
Ended the quarter with cash, cash equivalents, restricted cash and marketable securities of $500.4 million compared to $546.8 million as of the end of Q2 2022 and $475.8 million as of the end of Q4 2021
Revenue of $0.3 million for the quarter is related to initial sales of RNG from Gevo’s RNG project and compares to $0.1 million in Q3 2021
Loss from operations of $(43.7) million for the quarter includes a $24.7 million impairment loss and compares to $(14.7) million in Q3 2021
Non-GAAP cash EBITDA loss1 of $(37.8) million for the quarter compared to $(9.3) million in Q3 2021
GAAP net loss per share and non-GAAP adjusted net loss per share2 of $(0.19) for the quarter includes $(0.10) of impairment loss per share and compares to $(0.07) in Q3 2021
Management Comment
Commenting on the third quarter of 2022 and recent corporate events, Dr. Patrick R. Gruber, Gevo’s Chief Executive Officer, said “We are moving forward on our NZ-1 site in Lake Preston, South Dakota. Temporary roads are being constructed around the location while significant volumes of dirt are being moved in advance of initial foundation work. We are planning to get as much of this preliminary infrastructure done as possible before winter weather in South Dakota limits consistent access to the site. We are excited to be making visible progress on NZ-1 and we will finalize engineering plans as well as the debt financing package for the project over the next few quarters. Once that is complete, the pace of construction activities are expected to increase significantly.”
Net-Zero 1 Status
Following the recent groundbreaking ceremony in Lake Preston, South Dakota, the NZ-1 project is on schedule with initial volumes of SAF expected to be delivered in 2025. NZ-1 is being currently designed to produce approximately 62 million gallons per year (“MGPY”) of total hydrocarbon volumes, including 55 MGPY of SAF, which would fulfill part of Gevo’s more than 375 MGPY of SAF and hydrocarbon supply agreements. Construction activities at NZ-1 in 2022 are for site preparation purposes and will make the location ready for more substantial construction work that is expected to begin in 2023. In an effort to remain on schedule for a 2025 start-up, Gevo will fund initial construction activities from cash reserves. The Company expects to arrange debt and third-party equity financing in 2023 that, when combined with Gevo’s equity contribution, will fully fund NZ-1’s construction and commissioning.
The transition to an ethanol-to-SAF design from Gevo’s original isobutanol-to-SAF and isooctane design continues to yield improved output expectations as pre-project planning has been completed through phase 2 of front-end loading work (“FEL-2”). The results of this work, combined with support from the Clean Fuel Production Credit (“CFPC”) that was included in the Inflation reduction Act that was signed into law in August, have led to a forecasted, base-case Project EBITDA3 for NZ-1 to be approximately $300 million per year, a 50% increase from the prior estimate of $200 million per year. The total installed cost for NZ-1, including the capital required for the alcohol-to-jet fuel plant as well as any site development costs, is currently forecasted to be approximately $850 million, a 33% increase from the prior estimate of $640 million. This increase is primarily due to increased steel, equipment, and supply chain costs related to the inflationary environment.
Progress on Key NZ1 Development Milestones
Through year-end 2022:
Close the purchase of the land for NZ1 in Lake Preston, South Dakota
Execute development agreements for:
Wind energy
Wastewater (design no longer requires)
Green hydrogen
Select engineering, procurement, and construction (“EPC”) contractor
Select fabricator for hydrocarbon plant modules
Substantial Completion of Front End Engineering Design
Break ground and begin site preparation at Lake Preston
Through first-half 2023:
Close the construction financing, including non-recourse debt
Order long lead equipment
Throughout the remainder of 2022 and 2023, Gevo expects to update stockholders about certain key milestones related to the development, financing, and construction of NZ-1 as well as subsequent Net-Zero plants. Updates to those milestones will be found in the Company’s press releases and investor presentations in the Investor Relations section of Gevo’s website.
Third Quarter 2022 Financial Results
Revenue. During the three months ended September 30, 2022, the Company sold 41,791 MMBtu of renewable natural gas (“RNG”) from Gevo’s RNG Project in Northwest Iowa. Revenue increased $0.2 million during the three months ended September 30, 2022, compared to the three months ended September 30, 2021, which consisted of ethanol and hydrocarbons from the Company’s development plant in Luverne, Minnesota (the “Luverne Facility”). In the third quarter of 2022, the Company’s RNG production began ramping up resulting in biogas commodity sales of $0.3 million, while the activities at the Luverne Facility were minimized to care and maintenance, as the Company has shifted focus to its Net Zero projects.
Cost of production. Cost of production decreased $2.1 million during the three months ended September 30, 2022, compared to the three months ended September 30, 2021, primarily due to moving the Luverne Facility to care and maintenance status.
Idle facility costs. The Company incurred $2.3 million of idle facility costs during the three months ended September 30, 2022, due to putting Gevo’s Luverne Facility into care and maintenance status in the third quarter of 2022. Included in idle facility costs are those costs related to removing flammable and other hazardous items from the site, writing off certain patents related to production at the Luverne Facility and costs related to the workforce adjustments. The Company plans to utilize the Luverne Facility to advance the Company’s technology and operational knowledge to help us in achieving operational success as we scale up the production and delivery of SAF for Gevo’s customers through the Company’s Net-Zero Projects.
Depreciation and amortization. Depreciation and amortization in cost of goods sold increased $0.1 million during the three months ended September 30, 2022, compared to the three months ended September 30, 2021, mainly due to placing the RNG Project assets into service in third quarter of 2022.
Research and development expense. Research and development expense was relatively flat for the three months ended September 30, 2022, compared to the three months ended September 30, 2021. These costs are primarily employee and consultant related expenses, along with some patent and lab supply costs.
Selling, general and administrative expense. Selling, general and administrative expense increased $1.9 million during the three months ended September 30, 2022, compared to the three months ended September 30, 2021, primarily due to increases in personnel costs related to strategic hiring and professional fees, as well as non-cash stock-based compensation which reflects higher amortization expense for the stock awards issued in the prior period with higher market value.
Preliminary stage project costs. Preliminary stage project costs are related to the Company’s future Net-Zero Projects and Verity project and consist primarily of employee expenses, preliminary engineering and technical consulting costs. Preliminary stage project costs increased $0.6 million during the three months ended September 30, 2022, compared to the three months ended September 30, 2021, primarily due to increases in personnel costs, consulting and professional fees for the Company’s Net Zero Projects and Verity project.
Other operations. Other operations expense increased $1.3 million during the three months ended September 30, 2022, compared to the three months ended September 30, 2021, primarily due to increases in engineering personnel and other non-capitalizable costs for NZ1.
Impairment loss. The Company recorded a $24.7 million impairment loss on long-lived assets, which reduced the carrying value of certain property, plant, and equipment, and a leased right of use (“ROU”) asset, at the Agri-Energy segment to its fair value. The impairments recorded to date relate to the determination to suspend production at the Luverne Facility and shift the plant into an idled, care and maintenance status during the third quarter of 2022.
Depreciation and amortization expense. Depreciation and amortization expense increased $0.3 million during the three months ended September 30, 2022, compared to the three months ended September 30, 2021, primarily due to the amortization of the Company’s patents.
Loss from operations. Excluding the one-time charge of $24.7 million for impairment, the loss from operations increased by $4.2 million during the three months ended September 30, 2022, compared to the three months ended September 30, 2021, primarily due to the increased activities for the Company’s Net Zero platform and Verity projects, as well as non-capitalizable cost for NZ1.
Interest expense. Interest expense increased $0.6 million during the three months ended September 30, 2022, compared to the three months ended September 30, 2021, primarily due to the interest on the RNG bonds and the imputed interest on the Company’s RNG related dairy leases, both of which were capitalized into construction in process during the construction phase of Gevo’s RNG Project in the previous periods.
Interest and dividend income. Interest and dividend income increased $0.6 million during the three months ended September 30, 2022, compared to the three months ended September 30, 2021, primarily due to the interest earned on the Company’s investments.
Other income (expense). Other income (expense) for the three months ended September 30, 2022, consists primarily of losses on disposal of fixed assets.
During the nine months ended September 30, 2022, net cash used for operating activities was $36.8 million compared to $28.7 million for the nine months ended September 30, 2021. Non-cash charges primarily consisted of an impairment loss of $24.7 million, depreciation and amortization of $4.5 million, non-cash interest expense of $2.8 million related to debt issuance costs, stock-based compensation expense of $12.6 million. The net cash outflow from changes in operating assets and liabilities increased $7.9 million, primarily due to an increase of cash outflows of $4.0 million in prepaid expenses and other current assets due to the payments for licensing fees and deposits to secure long-lead equipment power transmission and distribution facilities for NZ1, partially offset by $4.2 million of decreased cash payments for the RNG Project.
Webcast and Conference Call Information
Hosting today’s conference call at 4:30 p.m. ET will be Dr. Patrick R. Gruber, Chief Executive Officer, L. Lynn Smull, Chief Financial Officer, and John Richardson, Director of Investor Relations. They will review Gevo’s financial results and provide an update on recent corporate highlights.
To participate in the live call, please register through the following event weblink: https://register.vevent.com/register/BIc9b140adb9fa4b89a10bb2deaacbece5. After registering, participants will be provided with a dial-in number and pin.
To listen to the conference call (audio only), please register through the following event weblink: https://edge.media-server.com/mmc/p/pasbrjrz.
A webcast replay will be available two hours after the conference call ends on November 8, 2022. The archived webcast will be available in the Investor Relations section of Gevo’s website at www.gevo.com.
About Gevo
Gevo’s mission is to transform renewable energy and carbon into energy-dense liquid hydrocarbons. These liquid hydrocarbons can be used for drop-in transportation fuels such as gasoline, jet fuel, and diesel fuel, that when burned have potential to yield net-zero greenhouse gas emissions when measured across the full lifecycle of the products. Gevo uses low-carbon renewable resource-based carbohydrates as raw materials, and is in an advanced state of developing renewable electricity and renewable natural gas for use in production processes, resulting in low-carbon fuels with substantially reduced carbon intensity (the level of greenhouse gas emissions compared to standard petroleum fossil-based fuels across their lifecycle). Gevo’s products perform as well or better than traditional fossil-based fuels in infrastructure and engines, but with substantially reduced greenhouse gas emissions. In addition to addressing the problems of fuels, Gevo’s technology also enables certain plastics, such as polyester, to be made with more sustainable ingredients. Gevo’s ability to penetrate the growing low-carbon fuels market depends on the price of oil and the value of abating carbon emissions that would otherwise increase greenhouse gas emissions. Gevo believes that it possesses the technology and know-how to convert various carbohydrate feedstocks through a fermentation process into alcohols and then transform the alcohols into renewable fuels and materials, through a combination of its own technology, know-how, engineering, and licensing of technology and engineering from Axens North America, Inc., which yields the potential to generate project and corporate returns that justify the build-out of a multi-billion-dollar business.
Gevo believes that Argonne National Laboratory GREET model is the best available standard of scientific based measurement for life cycle inventory or LCI.
Learn more at Gevo’s website: www.gevo.com
Forward-Looking Statements
Certain statements in this press release may constitute “forward-looking statements” within the meaning of the Private Securities Litigation Reform Act of 1995. These forward-looking statements relate to a variety of matters, including, without limitation, whether our fuel sales agreements are financeable, the timing of our Net-Zero 1 project, our financial condition, our results of operation and liquidity, our business development activities, our Net-Zero Projects, financial projections related to our business, our RNG project, our fuel sales agreements, our plans to develop our business, our ability to successfully develop, construct and finance our operations and growth projects, our ability to achieve cash flow from our planned projects, the ability of our products to contribute to lower greenhouse gas emissions, particulate and sulfur pollution, and other statements that are not purely statements of historical fact These forward-looking statements are made based on the current beliefs, expectations and assumptions of the management of Gevo and are subject to significant risks and uncertainty. Investors are cautioned not to place undue reliance on any such forward-looking statements. All such forward-looking statements speak only as of the date they are made, and Gevo undertakes no obligation to update or revise these statements, whether as a result of new information, future events or otherwise. Although Gevo believes that the expectations reflected in these forward-looking statements are reasonable, these statements involve many risks and uncertainties that may cause actual results to differ materially from what may be expressed or implied in these forward-looking statements. For a further discussion of risks and uncertainties that could cause actual results to differ from those expressed in these forward-looking statements, as well as risks relating to the business of Gevo in general, see the risk disclosures in the Annual Report on Form 10-K of Gevo for the year ended December 31, 2021 and in subsequent reports on Forms 10-Q and 8-K and other filings made with the U.S. Securities and Exchange Commission by Gevo.
Non-GAAP Financial Information
This press release contains financial measures that do not comply with U.S. generally accepted accounting principles (GAAP), including non-GAAP cash EBITDA loss, non-GAAP adjusted net loss and non-GAAP adjusted net loss per share. Non-GAAP cash EBITDA loss excludes depreciation and amortization and non-cash stock-based compensation from GAAP loss from operations. Non-GAAP adjusted net loss and adjusted net loss per share exclude non-cash gains and/or losses recognized in the quarter due to the changes in the fair value of certain of Gevo’s financial instruments, such as warrants, convertible debt and embedded derivatives, from GAAP net loss. Management believes these measures are useful to supplement its GAAP financial statements with this non-GAAP information because management uses such information internally for its operating, budgeting and financial planning purposes. These non-GAAP financial measures also facilitate management’s internal comparisons to Gevo’s historical performance as well as comparisons to the operating results of other companies. In addition, Gevo believes these non-GAAP financial measures are useful to investors because they allow for greater transparency into the indicators used by management as a basis for its financial and operational decision making. Non-GAAP information is not prepared under a comprehensive set of accounting rules and therefore, should only be read in conjunction with financial information reported under U.S. GAAP when understanding Gevo’s operating performance. A reconciliation between GAAP and non-GAAP financial information is provided in the financial statement tables below
1Cash EBITDA loss is a non-GAAP measure calculated by adding back depreciation and amortization and non-cash stock-based compensation to GAAP loss from operations. A reconciliation of cash EBITDA loss to GAAP loss from operations is provided in the financial statement tables following this release. 2Adjusted net loss per share is a non-GAAP measure calculated by adding back non-cash gains and/or losses recognized in the quarter due to the changes in the fair value of certain of our financial instruments, such as warrants, convertible debt and embedded derivatives, to GAAP net loss per share. A reconciliation of adjusted net loss per share to GAAP net loss per share is provided in the financial statement tables following this release. 3Project EBITDA is a non-GAAP financial measure that we define as total operating revenues less total operating expenses for the project.
Gevo, Inc. Condensed Consolidated Balance Sheets Information (Unaudited, in thousands, except share and per share amounts)
Gevo, Inc. Condensed Consolidated Statements of Operations Information (Unaudited, in thousands, except share and per share amounts)
Gevo, Inc. Condensed Consolidated Statements of Comprehensive Income (Unaudited, in thousands, except share and per share amounts)
Gevo, Inc. Condensed Consolidated Statements of Stockholders’ Equity Information (Unaudited, in thousands, except share amounts)
Gevo, Inc. Condensed Consolidated Cash Flow Information (Unaudited, in thousands)
Gevo, Inc. Reconciliation of GAAP to Non-GAAP Financial Information (Unaudited, in thousands, except share and per share amounts)
CALGARY, AB, Nov. 7, 2022 /CNW/ – Alvopetro Energy Ltd. (TSXV: ALV) (OTCQX: ALVOF) announces initial results from the first interval tested in our 183-B1 well on our 100% owned and operated Block 183 and October 2022 sales volumes.
In July 2022, we completed drilling the 183-B1 exploration well to a total measured depth (“MD”) of 2,917 metres. Based on open-hole wireline logs and fluid samples confirming hydrocarbons, the well discovered hydrocarbons in multiple formations with a total of 34.3 metres of potential net hydrocarbon pay, with an average porosity of 10.6% and average water saturation of 29.0% using a 6% porosity cut-off, 50% Vshale cut-off and 50% water saturation cut-off.
Alvopetro has completed the 183-B1 formation test in the Sergi formation, the deepest of three formations with hydrocarbons shows during drilling of the well. We perforated a total of 26.5 metres in the Sergi formation at various intervals between 2,811 metres MD and 2,886 metres MD. We initially swabbed 63 bbls of oil and 7 bbls of completions fluid during the initially clean-up period. After a short shut-in we then initiated the production test. Cumulatively, over the duration of the 72-hour production test, we recovered 59 bbls of 43°API oil, 7 bbls of water identified as completion fluid, and 0.28 MMcf of associated gas. The daily oil rate recovered during swabbing operations averaged 20 bopd.
The 183-B1 well has now been shut-in to measure reservoir pressure and obtain pressure build‑up data to undertake a pressure transient analysis, which will help predict productivity of this first zone. After completing the pressure build-up test, the first interval will be suspended temporarily with a bridge plug and the test will proceed up-hole to test the Agua Grande formation.
October Sales Volumes
October sales volumes averaged 2,720 boepd, including natural gas sales of 15.6 MMcfpd and associated natural gas liquids sales from condensate of 124 bopd, based on field estimates, an increase of 3% over our average daily sales volumes in the third quarter. October sales volumes include initial sales volumes from our 183(1) well on our Murucututu project where we commenced production in mid-October following completion of the commissioning of field production facility. Our team continues to optimize the field production facility at the wellsite. Since coming on production, the well has averaged approximately 0.42 MMcfpd based on field estimates.
Q3 2022 Results Webcast
Alvopetro anticipates announcing Q3 2022 results on November 15, 2022 after markets close and will host a live webcast to discuss the results at 9:00 am Mountain time on November 16, 2022. Details for joining the event are as follows:
The webcast will include a question-and-answer period. Online participants will be able to ask questions through the Zoom portal. Dial-in participants can email questions directly to socialmedia@alvopetro.com.
Alvopetro Energy Ltd.’svision is to become a leading independent upstream and midstream operator in Brazil. Our strategy is to unlock the on-shore natural gas potential in the state of Bahia in Brazil, building off the development of our Caburé natural gas field and our strategic midstream infrastructure.
Neither the TSX Venture Exchange nor its Regulation Services Provider (as that term is defined in the policies of the TSX Venture Exchange) accepts responsibility for the adequacy or accuracy of this news release.
All amounts contained in this new release are in United States dollars, unless otherwise stated and all tabular amounts are in thousands of United States dollars, except as otherwise noted.
Abbreviations:
API
=
American Petroleum Institute
°API
=
an indication of the specific gravity of crude oil measured on the API gravity scale.
bbls
=
barrels
boepd
=
barrels of oil equivalent (“boe”) per day
bopd
=
barrels of oil and/or natural gas liquids (condensate) per day
MMcf
=
million cubic feet
MMcfpd
=
million cubic feet per day
BOE Disclosure. The term barrels of oil equivalent (“boe”) may be misleading, particularly if used in isolation. A boe conversion ratio of six thousand cubic feet per barrel (6Mcf/bbl) of natural gas to barrels of oil equivalence is based on an energy equivalency conversion method primarily applicable at the burner tip and does not represent a value equivalency at the wellhead. All boe conversions in this news release are derived from converting gas to oil in the ratio mix of six thousand cubic feet of gas to one barrel of oil.
Testing and Well Results. Data obtained from the 183-B1 well identified in this press release, including hydrocarbon shows, open-hole logging, net pay and porosities and initial testing data, should be considered to be preliminary until detailed pressure transient and other analysis and interpretation has been completed. Hydrocarbon shows can be seen during the drilling of a well in numerous circumstances and do not necessarily indicate a commercial discovery or the presence of commercial hydrocarbons in a well. There is no representation by Alvopetro that the data relating to the 183-B1 well contained in this press release is necessarily indicative of long-term performance or ultimate recovery. The reader is cautioned not to unduly rely on such data as such data may not be indicative of future performance of the well or of expected production or operational results for Alvopetro in the future.
Forward-Looking Statements and Cautionary Language. This news release contains “forward-looking information” within the meaning of applicable securities laws. The use of any of the words “will”, “expect”, “intend” and other similar words or expressions are intended to identify forward-looking information. Forward‐looking statements involve significant risks and uncertainties, should not be read as guarantees of future performance or results, and will not necessarily be accurate indications of whether or not such results will be achieved. A number of factors could cause actual results to vary significantly from the expectations discussed in the forward-looking statements. These forward-looking statements reflect current assumptions and expectations regarding future events. Accordingly, when relying on forward-looking statements to make decisions, Alvopetro cautions readers not to place undue reliance on these statements, as forward-looking statements involve significant risks and uncertainties. More particularly and without limitation, this news release contains forward-looking information concerning potential hydrocarbon pay in the 183-B1 well, anticipated production from our Murucututu project, exploration and development prospects of Alvopetro and the expected timing of certain of Alvopetro’s testing and operational activities. The forward‐looking statements are based on certain key expectations and assumptions made by Alvopetro, including but not limited to expectations and assumptions concerning testing results of the 183-B1 well and the 182-C2 well, equipment availability, the timing of regulatory licenses and approvals, the success of future drilling, completion, testing, recompletion and development activities, the outlook for commodity markets and ability to access capital markets, the impact of the COVID-19 pandemic, the performance of producing wells and reservoirs, well development and operating performance, foreign exchange rates, general economic and business conditions, weather and access to drilling locations, the availability and cost of labour and services, environmental regulation, including regulation relating to hydraulic fracturing and stimulation, the ability to monetize hydrocarbons discovered, expectations regarding Alvopetro’s working interest and the outcome of any redeterminations, the regulatory and legal environment and other risks associated with oil and gas operations. The reader is cautioned that assumptions used in the preparation of such information, although considered reasonable at the time of preparation, may prove to be incorrect. Actual results achieved during the forecast period will vary from the information provided herein as a result of numerous known and unknown risks and uncertainties and other factors. Although Alvopetro believes that the expectations and assumptions on which such forward-looking information is based are reasonable, undue reliance should not be placed on the forward-looking information because Alvopetro can give no assurance that it will prove to be correct. Readers are cautioned that the foregoing list of factors is not exhaustive. Additional information on factors that could affect the operations or financial results of Alvopetro are included in our annual information form which may be accessed on Alvopetro’s SEDAR profile at www.sedar.com. The forward-looking information contained in this news release is made as of the date hereof and Alvopetro undertakes no obligation to update publicly or revise any forward-looking information, whether as a result of new information, future events or otherwise, unless so required by applicable securities laws.
The Consequences of this Year’s Voting Should Create Opportunity for Investors
Once inconceivable in most voting districts throughout the U.S., ballots across the country this year will ask voters to decide on gambling measures, drug laws, and extra taxes based on defined demographics. While this is of interest to investors as it shows how trends are forming or continuing and can point to more potential for growth. Of the 130 ballot measures being decided upon on Tuesday, many will alter spending patterns and bolster industries.
What’s Being Decided Upon
Each year a number of states, including Maryland and Arkansas, are asking voters to decide upon legalizing recreational marijuana. Fully five states could move toward ending the use of involuntary prison labor. Nebraska and Nevada are asking voters if they should increase the minimum wage statewide. Gambling, firearms, and immigration are also the subject of state-level referendums.
A proposition in California would legalize online sports betting in that large potential market. Gaming companies, including DraftKings (DKNG) and FanDuel (DUEL) have poured nearly $160 million into the measure. It is not expected to pass, if it does, the news may cause a rally in these and other online gambling companies. Over $375 million has been spent by supporters and those against this measure.
Also being decided by California’s voters is a proposition that would raise taxes on personal incomes of $2 million or more. The revenue would be set aside to fund the state’s electric-vehicle production and help prevent wildfires. This is a very contentious measure that pit many from the same political party against each other.
In general environmental groups and companies perceived to benefit from a quicker evolving EV infrastructure support the “yes” campaign. Governor Newsom, and the California Teachers Association, a powerful state union, have joined business groups to oppose the measure, saying it would benefit a select number of large corporations as they transition to electric vehicles.
Recreational weed in Maryland? The pollsters seem to think it stands a good chance of passing. There are four other states (Arkansas, Missouri, North Dakota and South Dakota) where recreational cannabis is also on the ballot, those outcomes won’t be known until after the votes are counted.
To date, 19 states and the District of Columbia have legalized the adult recreational use of marijuana. Colorado could become the second state behind Oregon to legalize the personal use of psilocybin, the active ingredient in psychedelic mushrooms and other plant-based hallucinogens.
Massachusetts voters get to decide if they raise their income taxes by 4% if they have personal incomes of $1 million or more. This would leave the total rate for that bracket to 9%. Should this pass and bring in additional funds, they are earmarked for education and transportation.
Voters in five states will weigh whether to explicitly outlaw involuntary servitude as part of the punishment for a crime. Alabama, Louisiana, Oregon, Tennessee, and Vermont will all consider these questions on the topic; there is a growing movement to change the 13th Amendment so it no longer allows slavery as a form of criminal punishment. This could potentially benefit the industry in these states.
On immigration, Ohio voters are considering whether to ban all local governments from allowing noncitizens to vote. San Francisco and New York have passed laws allowing noncitizens to vote for local offices and ballot measures. These face legal challenges.
Elsewhere, ballot measures will ask voters whether to extend certain benefits to immigrants in the country illegally, including the ability to obtain a driver’s license in Massachusetts and pay in-state college tuition in Arizona.
Take Away
They say elections have consequences. As various states elect to adopt or deny changes in the running of their state, investors may be able to position themselves to benefit from trends, changes, and additional funds being made available.