TORONTO–(BUSINESS WIRE)– Largo Inc. (“Largo” or the “Company”) (TSX: LGO) (NASDAQ: LGO) today announces the appointment of Helen Cai as an independent director to its Board of Directors (the “Board”) and the resignation of Ms. Koko Yamamoto.
Helen Cai Joins Largo’s Board of Directors (Photo: Business Wire)
Ms. Cai is a finance and investment professional with two decades of experience in capital markets and all aspects of corporate finance, from strategic planning to merger and acquisition (“M&A”) transactions. Ms. Cai is currently an independent director of Barrick Gold Corporation and most recently worked as a managing director with China International Capital Corporation until the spring of 2021. Prior to this, Ms. Cai worked as a research analyst with the Goldman Sachs Group covering American mining and technology sectors and was highly ranked by the StarMine analyst ranking service. As a lead research analyst at China International Capital Corporation, Ms. Cai was ranked as Best Analyst by Institutional Investor and Asia Money in their China Research Sector Polls for multiple years when covering Hong Kong and Chinese listed companies. The landmark cross-border financing and M&A transactions she led subsequently as a senior investment banker also won various awards from Asia Money and The Asset. Ms. Cai is a Chartered Financial Analyst and Chartered Alternative Investment Analyst and was educated at Tsinghua University in China and the Massachusetts Institute of Technology in the United States, where she received two master’s degrees and multiple fellowship awards.
J. Alberto Arias Chairman of the Board stated, “On behalf of the Board, I am very pleased to welcome Helen to the Company who brings extensive knowledge of the metals and technology sectors, global financial markets, and particularly China, where she is currently based. With her addition, the Board has gained an invaluable member with deep global strategic experience, specifically in China, which is by far the leading producer and consumer of vanadium. China is experiencing the fastest growth in vanadium flow battery deployments, which is expected to become a key catalyst and driver for future vanadium demand growth.” He continued: “We also want to thank Koko for her contribution to Largo’s Board over the last eight years.”
Helen Cai commented: “I am thrilled to be joining Largo’s Board at this incredibly exciting time in the Company’s development. I look forward to collaborating with the Board and management as the Company advances its strategic growth plans to promote the use of vanadium and vanadium-based energy storage.”
Koko Yamamoto stated: “During my tenure as a director, I have enjoyed working with the management team at Largo to promote the use of vanadium and vanadium-based energy storage. As I step away and pursue other opportunities, I remain a supporter of the Company and will continue to be a cheerleader for Largo, its ambitions, and the contribution it is making to advance a low carbon future.”
About Largo
Largo has a long and successful history as one of the world’s preferred vanadium companies through the supply of its VPURETM and VPURE+TM products, which are sourced from one of the world’s highest-grade vanadium deposits at the Company’s Maracás Menchen Mine in Brazil. Aiming to enhance value creation at Largo, the Company is in the process of implementing a titanium dioxide pigment plant using feedstock sourced from its existing operations in addition to advancing its U.S.-based clean energy division with its VCHARGE vanadium batteries. Largo’s VCHARGE vanadium batteries contain a variety of innovations, enabling an efficient, safe and ESG-aligned long duration solution that is fully recyclable at the end of its 25+ year lifespan. Producing some of the world’s highest quality vanadium, Largo’s strategic business plan is based on two pillars: 1.) leading vanadium supplier with an outlined growth plan and 2.) U.S.-based energy storage business to support a low carbon future.
Largo’s common shares trade on the Nasdaq Stock Market and on the Toronto Stock Exchange under the symbol “LGO”. For more information on the Company, please visit www.largoinc.com.
For further information, please contact:
Investor Relations Alex Guthrie Senior Manager, External Relations +1.416.861.9778 aguthrie@largoinc.com
InPlay Oil is a junior oil and gas exploration and production company with operations in Alberta focused on light oil production. The company operates long-lived, low-decline properties with drilling development and enhanced oil recovery potential as well as undeveloped lands with exploration possibilities. The common shares of InPlay trade on the Toronto Stock Exchange under the symbol IPO and the OTCQX Exchange under the symbol IPOOF.
Michael Heim, Senior Vice President, Equity Research Analyst, Energy & Transportation, Noble Capital Markets, Inc.
Refer to the full report for the price target, fundamental analysis, and rating.
Production levels hit by curtailments. InPlay reported average quarterly production of 9,020 boe/d in the 2023-1Q vs. 8,221 boe/d for 2022-1Q, and below last quarter’s production and our expectations. Management indicated that gas curtailments reduced production by 625 boe/d. Increased back pressure has become an issue in recent quarters as production is rising faster than the infrastructure can handle, even as new infrastructure investments are being made.
Lower production caused bottom-line numbers to be below expectations. Although InPlay did a good job holding the line on costs, it was unable to offset the reduction in sales. As a result, management lowered cash flow guidance for the year. Cash flow should improve in upcoming quarters due to accelerated drilling activity including bringing two wells online with impressive flow rates.
Equity Research is available at no cost to Registered users of Channelchek. Not a Member? Click ‘Join’ to join the Channelchek Community. There is no cost to register, and we never collect credit card information.
This Company Sponsored Research is provided by Noble Capital Markets, Inc., a FINRA and S.E.C. registered broker-dealer (B/D).
*Analyst certification and important disclosures included in the full report. NOTE: investment decisions should not be based upon the content of this research summary. Proper due diligence is required before making any investment decision.
CALGARY, AB, May 12, 2023 /CNW/ – InPlay Oil Corp. (TSX: IPO) (OTCQX: IPOOF) (“InPlay” or the “Company”) announces its financial and operating results for the three months ended March 31, 2023. InPlay’s condensed unaudited interim financial statements and notes, as well as Management’s Discussion and Analysis (“MD&A”) for the three months ended March 31, 2023 will be available at “www.sedar.com” and our website at “www.inplayoil.com“. Our corporate presentation will soon be available on our website.
First Quarter 2023 Financial & Operating Highlights
Achieved average quarterly production of 9,020 boe/d(1) (58% light crude oil and NGLs), an increase of 21% on a debt adjusted per share basis compared to 8,221 boe/d(1) (59% light crude oil and NGLs) in the first quarter of 2022.
Generated strong quarterly adjusted funds flow (“AFF”)(2) of $21.3 million ($0.24 per weighted average basic share(3)).
Maintained balance sheet strength with a low net debt(2) to earnings before interest, taxes and depletion (“EBITDA”)(3) ratio of 0.4 on a trailing twelve month basis down from 1.0 in the first quarter of 2022.
Executed the most active quarter in the Company’s history drilling four (3.2 net) extended reach horizontal (“ERH”) wells in Willesden Green, two (2.0 net) ERH wells in Pembina and two (0.3 net) non-operated Willesden Green ERH wells. InPlay also started the upgrade of an operated gas facility in Willesden Green providing additional capacity. One (0.95 net) additional Willesden Green well which was planned for the second quarter was drilled in March and drilling operations began on another one (0.95 net) Willesden Green well in the first quarter.
Returned $4.4 million in the quarter directly to shareholders through $4.0 million in dividends and $0.4 million of share repurchases under the Company’s Normal Course Issuer Bid.
Realized net income of $9.3 million ($0.11 per basic share; $0.10 per diluted share).
Financial capability to deliver consistent returns to shareholders with the dividend supportable at a $55 WTI pricing environment until 2025.
First Quarter 2023 Financial & Operations Overview:
InPlay’s capital program for the first quarter of 2023 was the Company’s most active quarter in our history. During the quarter, InPlay invested $29.6 million drilling, completing and equipping four (3.2 net) ERH wells in Willesden Green, two (2.0 net) ERH wells in Pembina and two (0.3 net) non-operated Willesden Green ERH wells. Completion operations on two wells were advanced into the quarter that were originally planned to occur in the second quarter to ensure these wells could be brought on production prior to spring breakup. InPlay also advanced the initiation of its second quarter capital program into the first quarter by drilling in Willesden Green an additional one (0.95 net) ERH well in March and beginning the drilling operations on another one (0.95 net) ERH well. During the quarter, the Company also started construction on the first of two planned natural gas facility upgrades in Willesden Green in 2023.
In one area of Pembina, as published in our March 15, 2023 press release, the Company had natural gas production curtailments beginning February 15th from a third party natural gas facility due to capacity constraints. This impacted production in the quarter by approximately 475 boe/d (68% natural gas). InPlay actively responded to mitigate the impact of this curtailment on revenue by shutting in wells with high gas weightings, maximizing oil production and AFF in the strong oil pricing environment. The impact of the constraints was also mitigated by the fact that due to expected weaker natural gas pricing in 2023, InPlay previously shifted 2023 drilling plans away from this prolific production area due to its higher gas weighted production, and its higher gas processing fees in comparison to our Willesden Green property.
In Willesden Green, two (1.6 net) ERH wells that were brought on production in early February had average initial production (“IP”) rates per well of 579 boe/d (73% light crude oil and NGLs) and 428 boe/d (70% light crude oil and NGLs) over their first 30 and 60 days respectively. The Company also brought on production another two (1.6 net) ERH Willesden Green wells in early March. The average IP rates for these wells was 722 boe/d (82% light crude oil and NGLs) and 564 boe/d (81% light crude oil and NGLs) per well over their first 30 and 60 days respectively. These four wells have delivered IP rates significantly above internal expectations and their high production rates led to increased back pressure in the area resulting in operated and non-operated curtailments of approximately 150 boe/d (57% light crude oil and NGLs) during the quarter due to temporarily backing out production from our older lower pressured offsetting wells. During April, InPlay completed the upgrade on the first of two natural gas processing facilities in the Willesden Green area which allowed curtailed production to be brought back online.
Production averaged 9,020 boe/d (58% light crude oil & NGLs) (1) in the first quarter of 2023 resulting in $21.3 million of AFF. The impact on production due to the two above mentioned curtailments was approximately 625 boe/d (48% light crude oil & NGLs) in the first quarter of 2023. During the quarter, InPlay increased light oil and NGLs weighting by approximately 1.5% over the fourth quarter of 2022, and this weighting is expected to continue to increase as the Company is focused on drilling in areas with higher oil weightings.
Outlook and Operations Update(5)
InPlay continues to be excited about 2023 as our drilling continues to outperform our expectations including the two oil focused wells drilled in Pembina in the first quarter and brought on production in April. The two (2.0 net) ERH wells had average IP rates over their first 25 days of 307 boe/d (89% light crude oil and NGLs) per well, exceeding our internal forecasts with a strong oil and liquids weighting. These wells are expected to remain at an elevated oil weighting and flat for a few months as we continue to see strong pressures, decreasing water cuts and the artificial lift equipment is operating at maximum pumping capacity.
Capital activity planned for the second quarter will include completing and bringing on production three (2.9 net) ERH wells in Willesden Green which commenced drilling in March and finished in April. These wells are expected to be completed in late May and brought on production in early June. Continued work on our second significant upgrade to an operated natural gas plant in Willesden Green is also planned for the quarter. This upgrade is expected to be online in the second half of July and provides InPlay with considerable increased operated natural gas capacity to facilitate continued development and growth in Willesden Green in the current and future years. Drilling activity is expected to resume in late June or early July but overall capital spending in the second quarter is expected to be significantly lower than the first quarter providing strong free adjusted funds flow(3).
A three week turnaround at the Company’s largest non-operated midstream natural gas facility is expected to occur in June. InPlay proactively secured capacity at alternative facilities for a significant amount of impacted gas production and the production of oil and NGLs in the second quarter of 2023 is not expected to be materially affected.
InPlay responded quickly and effectively to address the production curtailments impacting the Company in the first quarter. Natural decline of InPlay and other operators’ production in Pembina continues to reduce the impact of curtailed production, which is currently estimated at 825 boe/d (68% natural gas), compared to the 950 boe/d (68% natural gas) impact during the last half of the first quarter. We expect natural declines will continue to reduce the impact of curtailed production through the summer and alternative options to bring the remaining curtailed production fully back online are currently being evaluated. The Company anticipates all curtailed production to be back online early in the fourth quarter of 2023 which will be sold into the much higher future winter natural gas prices.
Strong fundamentals have InPlay continuing to focus on high oil weighted properties as we have a much more favorable outlook for oil prices versus natural gas prices, specifically in the second half of 2023. This focus is due to light oil and NGLs representing an estimated 86% of our overall forecasted corporate revenue in 2023. The 2023 capital program will remain flexible and the Company will revisit this program should commodity prices continue to remain volatile.
Similar to other operators, InPlay has had production in the Pembina region affected by the recent wildfires in Alberta. Our first priority was ensuring the safety of our employees, contractors, the community and our infrastructure, which to date has been accomplished. The Company started shutting in production and facilities late on May 4th and had concluded shutting in all affected wells and facilities by late in the day on May 5th. Affected production shut in peaked at approximately 3,400 boe/d (52% light oil and liquids). Since the weekend the fire hazard has somewhat diminished in the area. Production has started to be brought back on over the past few days and we will continue to restart the remaining production down as services allow. We will continue to monitor the hazards and act accordingly. The Company thanks its field employees for their diligent and quick action in safely shutting in operations.
Strong results from our 2023 drilling program to date has InPlay reiterating our previous production guidance of 9,500 – 10,500 boe/d(1). However, given the curtailments experienced to date in 2023 and their expected impact over the next few quarters, the Company is forecasting 2023 average production to be within the lower half of this guidance at 9,500 – 10,000 boe/d(1) but at the higher end of our light crude oil and NGLs weighting guidance at 59% – 61%.
The Company continues to expect near term volatility in commodity prices, specifically natural gas prices, but with the United States refined product inventory levels at five year lows, oil inventory at the five year average and refineries starting back up after maintenance downtime, we anticipate the second half of 2023 to have higher oil prices. The Company’s downside exposure to lower forward summer 2023 natural gas prices are protected with hedges put in place of 12,500 GJ/day swaps at $3.73 AECO per GJ for April to October 2023. InPlay forecasts 2023 AFF(2) of $117 to $123 million with FAFF(3) of $37 to $48 million. The Company’s leverage metrics are forecasted to remain at very low levels, with net debt to EBITDA(3) forecast to be 0.0x – 0.2x for 2023.
The Company continues to remain focused on providing strong returns to shareholders through the payment of our monthly dividend of $0.015/share (which is expected to be only 13%-14% of forecasted 2023 AFF), timely share repurchases under our normal course issuer bid and top-tier production per debt adjusted share growth. The Company’s strong debt position, disciplined and adaptable capital allocation, and high quality asset base provides InPlay with a competitive advantage to continue to provide strong returns to shareholders in a volatile commodity pricing environment. The Company forecasts our base monthly dividend to be sustainable in a scenario where WTI dropped to US $55/bbl through to the end of 2025.
On behalf of our employees, management team and Board of Directors, we would like to thank our shareholders for their support and look forward to updating you on our progress throughout the year.
Notes:
1.
See “Production Breakdown by Product Type” at the end of this press release.
2.
Capital management measure. See “Non-GAAP and Other Financial Measures” contained within this press release.
3.
Non-GAAP financial measure or ratio that does not have a standardized meaning under International Financial Reporting Standards (IFRS) and GAAP and therefore may not be comparable with the calculations of similar measures for other companies. Please refer to “Non-GAAP and Other Financial Measures” contained within this press release.
4.
Supplementary financial measure. See “Non-GAAP and Other Financial Measures” contained within this press release.
5.
See “Reader Advisories – Forward Looking Information and Statements” for key budget and underlying assumptions related to our previous and updated 2023 capital program and associated guidance.
Reader Advisories
Non-GAAP and Other Financial Measures
Throughout this press release and other materials disclosed by the Company, InPlay uses certain measures to analyze financial performance, financial position and cash flow. These non-GAAP and other financial measures do not have any standardized meaning prescribed under GAAP and therefore may not be comparable to similar measures presented by other entities. The non-GAAP and other financial measures should not be considered alternatives to, or more meaningful than, financial measures that are determined in accordance with GAAP as indicators of the Company performance. Management believes that the presentation of these non-GAAP and other financial measures provides useful information to shareholders and investors in understanding and evaluating the Company’s ongoing operating performance, and the measures provide increased transparency and the ability to better analyze InPlay’s business performance against prior periods on a comparable basis.
Non-GAAP Financial Measures and Ratios
Included in this document are references to the terms “free adjusted funds flow”, “operating income”, “operating netback per boe”, “operating income profit margin”, “Net Debt to EBITDA”, “Net Corporate Acquisitions”, “Debt adjusted production per share” and “EV / DAAFF”. Management believes these measures and ratios are helpful supplementary measures of financial and operating performance and provide users with similar, but potentially not comparable, information that is commonly used by other oil and natural gas companies. These terms do not have any standardized meaning prescribed by GAAP and should not be considered an alternative to, or more meaningful than “profit (loss) before taxes”, “profit (loss) and comprehensive income (loss)”, “adjusted funds flow”, “capital expenditures”, “corporate acquisitions, net of cash acquired”, “net debt”, “weighted average number of common shares (basic)” or assets and liabilities as determined in accordance with GAAP as a measure of the Company’s performance and financial position.
Free Adjusted Funds Flow
Management considers FAFF an important measure to identify the Company’s ability to improve its financial condition through debt repayment and its ability to provide returns to shareholders. FAFF should not be considered as an alternative to or more meaningful than AFF as determined in accordance with GAAP as an indicator of the Company’s performance. FAFF is calculated by the Company as AFF less exploration and development capital expenditures and property dispositions (acquisitions) and is a measure of the cashflow remaining after capital expenditures before corporate acquisitions that can be used for additional capital activity, corporate acquisitions, repayment of debt or decommissioning expenditures or potentially return of capital to shareholders. Refer below for a calculation of historical FAFF and to the “Forward Looking Information and Statements” section for a calculation of forecast FAFF.
Operating Income/Operating Netback per boe/Operating Income Profit Margin
InPlay uses “operating income”, “operating netback per boe” and “operating income profit margin” as key performance indicators. Operating income is calculated by the Company as oil and natural gas sales less royalties, operating expenses and transportation expenses and is a measure of the profitability of operations before administrative, share-based compensation, financing and other non-cash items. Management considers operating income an important measure to evaluate its operational performance as it demonstrates its field level profitability. Operating income should not be considered as an alternative to or more meaningful than net income as determined in accordance with GAAP as an indicator of the Company’s performance. Operating netback per boe is calculated by the Company as operating income divided by average production for the respective period. Management considers operating netback per boe an important measure to evaluate its operational performance as it demonstrates its field level profitability per unit of production. Operating income profit margin is calculated by the Company as operating income as a percentage of oil and natural gas sales. Management considers operating income profit margin an important measure to evaluate its operational performance as it demonstrates how efficiently the Company generates field level profits from its sales revenue. Refer below for a calculation of operating income, operating netback per boe and operating income profit margin.
Net Debt to EBITDA
Management considers Net Debt to EBITDA an important measure as it is a key metric to identify the Company’s ability to fund financing expenses, net debt reductions and other obligations. EBITDA is calculated by the Company as adjusted funds flow before interest expense. When this measure is presented quarterly, EBITDA is annualized by multiplying by four. When this measure is presented on a trailing twelve month basis, EBITDA for the twelve months preceding the net debt date is used in the calculation. This measure is consistent with the EBITDA formula prescribed under the Company’s Senior Credit Facility. Net Debt to EBITDA is calculated as Net Debt divided by EBITDA. Refer below for a calculation of Net Debt to EBITDA and to the “Forward Looking Information and Statements” section for a calculation of forecast Net Debt to EBITDA.
Net Corporate Acquisitions
Management considers Net corporate acquisitions an important measure as it is a key metric to evaluate the corporate acquisition in comparison to other transactions using the negotiated consideration value and ignoring changes to the fair value of the share consideration between the signing of the definitive agreement and the closing of the transaction. Net corporate acquisitions should not be considered as an alternative to or more meaningful than “Corporate acquisitions, net of cash acquired” as determined in accordance with GAAP as an indicator of the Company’s performance. Net corporate acquisitions is calculated as total consideration with share consideration adjusted to the value negotiated with the counterparty, less working capital balances assumed on the corporate acquisition. Refer below for a calculation of Net corporate acquisitions and reconciliation to the nearest GAAP measure, “Corporate acquisitions, net of cash acquired”.
Production per Debt Adjusted Share
InPlay uses “Production per debt adjusted share” as a key performance indicator. Debt adjusted shares should not be considered as an alternative to or more meaningful than common shares as determined in accordance with GAAP as an indicator of the Company’s performance. Debt adjusted shares is a non-GAAP measure used in the calculation of Production per debt adjusted share and is calculated by the Company as common shares outstanding plus the change in net debt divided by the Company’s current trading price on the TSX, converting net debt to equity. Debt adjusted shares should not be considered as an alternative to or more meaningful than weighted average number of common shares (basic) as determined in accordance with GAAP as an indicator of the Company’s performance. Management considers Debt adjusted share is a key performance indicator as it adjusts for the effects of capital structure in relation to the Company’s peers. Production per debt adjusted share is calculated by the Company as production divided by debt adjusted shares. Management considers Production per debt adjusted share is a key performance indicator as it adjusts for the effects of changes in annual production in relation to the Company’s capital structure. Refer below for a calculation of Production per debt adjusted share and to the “Forward Looking Information and Statements” section for a calculation of forecast Production per debt adjusted share.
EV / DAAFF
InPlay uses “enterprise value to debt adjusted AFF” or “EV/DAAFF” as a key performance indicator. EV/DAAFF is calculated by the Company as enterprise value divided by debt adjusted AFF for the relevant period. Debt adjusted AFF (“DAAFF”) is calculated by the Company as adjusted funds flow plus financing costs. Enterprise value is a capital management measures that is used in the calculation of EV/DAAFF. Enterprise value is calculated as the Company’s market capitalization plus working capital (net debt). Management considers enterprise value a key performance indicator as it identifies the total capital structure of the Company. Management considers EV/DAAFF a key performance indicator as it is a key metric used to evaluate the sustainability of the Company relative to other companies while incorporating the impact of differing capital structures. Refer to the “Forward Looking Information and Statements” section for a calculation of forecast EV/DAAFF.
Capital Management Measures
Adjusted Funds Flow
Management considers adjusted funds flow to be an important measure of InPlay’s ability to generate the funds necessary to finance capital expenditures. Adjusted funds flow is a GAAP measure and is disclosed in the notes to the Company’s financial statements for the three months ended March 31, 2023. All references to adjusted funds flow throughout this MD&A are calculated as funds flow adjusting for decommissioning expenditures and transaction and integration costs. Decommissioning expenditures are adjusted from funds flow as they are incurred on a discretionary and irregular basis and are primarily incurred on previous operating assets. Transaction costs are non-recurring costs for the purposes of an acquisition, making the exclusion of these items relevant in Management’s view to the reader in the evaluation of InPlay’s operating performance. The Company also presents adjusted funds flow per share whereby per share amounts are calculated using weighted average shares outstanding consistent with the calculation of profit per common share.
Net Debt / Working Capital
Net debt / working capital is a GAAP measure and is disclosed in the notes to the Company’s financial statements for three months ended March 31, 2023. The Company closely monitors its capital structure with a goal of maintaining a strong balance sheet to fund the future growth of the Company. The Company monitors net debt / working capital as part of its capital structure. The Company uses net debt / working capital (bank debt plus accounts payable and accrued liabilities less accounts receivables and accrued receivables, prepaid expenses and deposits and inventory) as an alternative measure of outstanding debt. Management considers net debt / working capital an important measure to assist in assessing the liquidity of the Company.
Supplementary Measures
“Average realized crude oil price” is comprised of crude oil commodity sales from production, as determined in accordance with IFRS, divided by the Company’s crude oil production. Average prices are before deduction of transportation costs and do not include gains and losses on financial instruments.
“Average realized NGL price” is comprised of NGL commodity sales from production, as determined in accordance with IFRS, divided by the Company’s NGL production. Average prices are before deduction of transportation costs and do not include gains and losses on financial instruments.
“Average realized natural gas price” is comprised of natural gas commodity sales from production, as determined in accordance with IFRS, divided by the Company’s natural gas production. Average prices are before deduction of transportation costs and do not include gains and losses on financial instruments.
“Average realized commodity price” is comprised of commodity sales from production, as determined in accordance with IFRS, divided by the Company’s production. Average prices are before deduction of transportation costs and do not include gains and losses on financial instruments.
“Adjusted funds flow per weighted average basic share” is comprised of adjusted funds flow divided by the basic weighted average common shares.
“Adjusted funds flow per weighted average diluted share” is comprised of adjusted funds flow divided by the diluted weighted average common shares.
“Adjusted funds flow per boe” is comprised of adjusted funds flow divided by total production.
Forward-Looking Information and Statements This news release contains certain forward–looking information and statements within the meaning of applicable securities laws. The use of any of the words “expect”, “anticipate”, “continue”, “estimate”, “may”, “will”, “project”, “should”, “believe”, “plans”, “intends”, “forecast” and similar expressions are intended to identify forward-looking information or statements. In particular, but without limiting the foregoing, this news release contains forward-looking information and statements pertaining to the following: the Company’s business strategy, milestones and objectives; the Company’s planned 2023 capital program including wells to be drilled and completed and the timing of the same and that the operated natural gas plant in Willesden Green is expected to be online in the second half of July; 2023 guidance based on the planned capital program and all associated underlying assumptions set forth in this press release including, without limitation, forecasts of 2023 annual average production levels, debt adjusted production levels, adjusted funds flow, free adjusted funds flow, Net Debt/EBITDA ratio, operating income profit margin, and Management’s belief that the Company can grow some or all of these attributes and specified measures; light crude oil and NGLs weighting estimates; expectations regarding future commodity prices; future oil and natural gas prices; future liquidity and financial capacity; future results from operations and operating metrics; future costs, expenses and royalty rates; future interest costs; the exchange rate between the $US and $Cdn; future development, exploration, acquisition, development and infrastructure activities and related capital expenditures, including our planned 2023 capital program; the amount and timing of capital projects; forecasted spending on decommissioning; that the Company has the financial capability to deliver consistent return to shareholders and the dividend is supportable at a $55 WTI pricing environment until 2025; that the Company’s light oil and NGLs weighting is expected to continue to increase as the Company is focused on drilling in areas with higher oil weightings; that the production profile of the two Pembina wells brought on production in April is expected to remain flat for a few months; the expectation that the second quarter will provide strong free adjusted funds flow; the expectation that all curtailed production will be back online in the fourth quarter of 2023; and methods of funding our capital program.
Without limitation of the foregoing, readers are cautioned that the Company’s future dividend payments to shareholders of the Company, if any, and the level thereof will be subject to the discretion of the Board of Directors of InPlay. The Company’s dividend policy and funds available for the payment of dividends, if any, from time to time, is dependent upon, among other things, levels of FAFF, leverage ratios, financial requirements for the Company’s operations and execution of its growth strategy, fluctuations in commodity prices and working capital, the timing and amount of capital expenditures, credit facility availability and limitations on distributions existing thereunder, and other factors beyond the Company’s control. Further, the ability of the Company to pay dividends will be subject to applicable laws, including satisfaction of solvency tests under the Business Corporations Act (Alberta), and satisfaction of certain applicable contractual restrictions contained in the agreements governing the Company’s outstanding indebtedness.
Forward-looking statements or information are based on a number of material factors, expectations or assumptions of InPlay which have been used to develop such statements and information but which may prove to be incorrect. Although InPlay believes that the expectations reflected in such forward looking statements or information are reasonable, undue reliance should not be placed on forward-looking statements because InPlay can give no assurance that such expectations will prove to be correct. In addition to other factors and assumptions which may be identified herein, assumptions have been made regarding, among other things: the impact of increasing competition; the general stability of the economic and political environment in which InPlay operates; the timely receipt of any required regulatory approvals; the ability of InPlay to obtain qualified staff, equipment and services in a timely and cost efficient manner; drilling results; the ability of the operator of the projects in which InPlay has an interest in to operate the field in a safe, efficient and effective manner; the ability of InPlay to obtain debt financing on acceptable terms; the timing and amount of purchases under the Company’s NCIB; the anticipated tax treatment of the monthly base dividend; field production rates and decline rates; the ability to replace and expand oil and natural gas reserves through acquisition, development and exploration; the timing and cost of pipeline, storage and facility construction and the ability of InPlay to secure adequate product transportation; future commodity prices; that various conditions to a shareholder return strategy can be satisfied; expectations regarding the potential impact of COVID-19 and the Russia/Ukraine conflict; currency, exchange and interest rates; regulatory framework regarding royalties, taxes and environmental matters in the jurisdictions in which InPlay operates; and the ability of InPlay to successfully market its oil and natural gas products.
The forward-looking information and statements included herein are not guarantees of future performance and should not be unduly relied upon. Such information and statements, including the assumptions made in respect thereof, involve known and unknown risks, uncertainties and other factors that may cause actual results or events to defer materially from those anticipated in such forward-looking information or statements including, without limitation: the continuing impact of the COVID-19 pandemic and the Russia/Ukraine conflict; inflation and the risk of a global recession; changes in our planned 2023 capital program; changes in our long range plan; changes in our approach to shareholder returns, including in relation to the Company’s NCIB and the timing and amount of any potential purchases thereunder; changes in commodity prices and other assumptions outlined herein; the risk that dividend payments may be reduced, suspended or cancelled; the potential for variation in the quality of the reservoirs in which we operate; changes in the demand for or supply of our products; unanticipated operating results or production declines; changes in tax or environmental laws, royalty rates or other regulatory matters; changes in development plans or strategies of InPlay or by third party operators of our properties; changes in our credit structure, increased debt levels or debt service requirements; inaccurate estimation of our light crude oil and natural gas reserve and resource volumes; limited, unfavorable or a lack of access to capital markets; increased costs; a lack of adequate insurance coverage; the impact of competitors; and certain other risks detailed from time-to-time in InPlay’s continuous disclosure documents filed on SEDAR including our Annual Information Form and our MD&A.
This press release contains future-oriented financial information and financial outlook information (collectively, “FOFI”) about InPlay’s financial and leverage targets and objectives, InPlay’s long-term forecast, and potential dividends and share buybacks, all of which are subject to the same assumptions, risk factors, limitations, and qualifications as set forth in the above paragraphs. The actual results of operations of InPlay and the resulting financial results will likely vary from the amounts set forth in this press release and such variation may be material. InPlay and its management believe that the FOFI has been prepared on a reasonable basis, reflecting management’s reasonable estimates and judgments. However, because this information is subjective and subject to numerous risks, it should not be relied on as necessarily indicative of future results. Except as required by applicable securities laws, InPlay undertakes no obligation to update such FOFI. FOFI contained in this press release was made as of the date of this press release and was provided for the purpose of providing further information about InPlay’s anticipated future business operations and strategy. Readers are cautioned that the FOFI contained in this press release should not be used for purposes other than for which it is disclosed herein.
The internal projections, expectations, or beliefs underlying our Board approved 2023 capital budget and associated guidance, as well as management’s preliminary estimates and targets in respect of plans for 2024 and beyond (which are not based on Board approved budgets at this time), are subject to change in light of, among other factors, the impact of world events including pandemics and the Russia/Ukraine conflict, ongoing results, prevailing economic circumstances, volatile commodity prices, and industry conditions and regulations. InPlay’s financial outlook and guidance provides shareholders with relevant information on management’s expectations for results of operations, excluding any potential acquisitions or dispositions, for such time periods based upon the key assumptions outlined herein. In this document reference is made to the Company’s longer range 2024 and beyond internal plan and associated economic model. Such information reflects internal estimates and targets used by management for the purposes of making capital investment decisions and for internal long range planning and budget preparation. Readers are cautioned that events or circumstances could cause capital plans and associated results to differ materially from those predicted and InPlay’s guidance for 2023, and more particularly 2024 and beyond, may not be appropriate for other purposes. Accordingly, undue reliance should not be placed on same.
The forward-looking information and statements contained in this news release speak only as of the date hereof and InPlay does not assume any obligation to publicly update or revise any of the included forward-looking statements or information, whether as a result of new information, future events or otherwise, except as may be required by applicable securities laws.
Risk Factors to FLI
Risk factors that could materially impact successful execution and actual results of the Company’s 2023 capital program and associated guidance and long-term preliminary plans and estimates include:
volatility of petroleum and natural gas prices and inherent difficulty in the accuracy of predictions related thereto;
the extent of any unfavorable impacts of wildfires in the province of Alberta;
changes in Federal and Provincial regulations;
the Company’s ability to secure financing for the Board approved 2023 capital program and longer term capital plans sourced from AFF, bank or other debt instruments, asset sales, equity issuance, infrastructure financing or some combination thereof;
those additional risk factors set forth in the Company’s MD&A and most recent Annual Information Form filed on SEDAR
Key Budget and Underlying Material Assumptions to FLI
The key budget and underlying material assumptions used by the Company in the development of its current and previous 2023 guidance and preliminary estimates are as follows:
The change in the current 2023 guidance from prior guidance results from forecasted production to be within the lower half of guidance given the curtailments experienced to date in 2023 and their expected impact over the next few quarters as detailed in this press release.
The Company’s 2024 and 2025 preliminary plans remains the same as previously released January 18, 2023, with net debt (working capital) updated to reflect the updated 2023 ending net debt. The 2024 and 2025 preliminary plan guidance calculations which are impacted by this change and the change in assumed share price to $2.75 are outlined below.
See “Production Breakdown by Product Type” below
Quality and pipeline transmission adjustments may impact realized oil prices in addition to the MSW Differential provided above
Changes in working capital (net debt) are not assumed to have a material impact between the years presented above.
The assumptions above do not include potential future purchases through the Company’s NCIB.
Test Results and Initial Production Rates
Test results and initial production (“IP”) rates disclosed herein, particularly those short in duration, may not necessarily be indicative of long term performance or of ultimate recovery. A pressure transient analysis or well-test interpretation has not been carried out and thus certain of the test results provided herein should be considered to be preliminary until such analysis or interpretation has been completed.
Production Breakdown by Product Type
Disclosure of production on a per boe basis in this press release consists of the constituent product types as defined in NI 51–101 and their respective quantities disclosed in the table below:
References to crude oil, light oil, NGLs or natural gas production in this press release refer to the light and medium crude oil, natural gas liquids and conventional natural gas product types, respectively, as defined in National Instrument 51-101, Standards of Disclosure for Oil and Gas Activities (“Nl 51-101”).
BOE equivalent Barrel of oil equivalents or BOEs may be misleading, particularly if used in isolation. A BOE conversion ratio of 6 mcf: 1 bbl is based on an energy equivalency conversion method primarily applicable at the burner tip and does not represent a value equivalency at the wellhead. Given that the value ratio based on the current price of crude oil as compared to natural gas is significantly different than the energy equivalency of 6:1, utilizing a 6:1 conversion basis may be misleading as an indication of value.
SOURCE InPlay Oil Corp.
For further information: Doug Bartole, President and Chief Executive Officer, InPlay Oil Corp., Telephone: (587) 955-0632; Darren Dittmer, Chief Financial Officer, InPlay Oil Corp., Telephone: (587) 955-0634
Alvopetro Energy Ltd.’s vision is to become a leading independent upstream and midstream operator in Brazil. Our strategy is to unlock the on-shore natural gas potential in the state of Bahia in Brazil, building off the development of our Caburé natural gas field and our strategic midstream infrastructure.
Michael Heim, Senior Vice President, Equity Research Analyst, Energy & Transportation, Noble Capital Markets, Inc.
Refer to the full report for the price target, fundamental analysis, and rating.
2023-1Q results continued a steady upward production trend and biannual gas price resetting that has lead to higher revenues, fund flow from operations, and earnings. Results were generally in line with expectations. Although gas sales and prices were previously disclosed, total revenues were slightly below expectations due to lower natural gas liquid pricing. Royalty rates fell sharply due to a restructuring and lower natural gas prices.
Sale decline further explained. April volumes averaged 1,972 boepd vs. 2023-1Q production of 2,767 boepd. Management cited reduced demand and higher nominated volumes from its partner in the Cabure unit. Sales in the Cabure field are subject to a partnership agreement based on reserves in the ground. Alvopetro’s partner can then nominate the amount of reserves that are sold from its “piggy bank.” Bahia Gas, the consumer of Alvopetro’s gas supply, can take gas on a firm or interruptible basis. For a 7-10 day period, it took gas primarily from firm customers decreasing the demand for other customers.
Equity Research is available at no cost to Registered users of Channelchek. Not a Member? Click ‘Join’ to join the Channelchek Community. There is no cost to register, and we never collect credit card information.
This Company Sponsored Research is provided by Noble Capital Markets, Inc., a FINRA and S.E.C. registered broker-dealer (B/D).
*Analyst certification and important disclosures included in the full report. NOTE: investment decisions should not be based upon the content of this research summary. Proper due diligence is required before making any investment decision.
Largo has a long and successful history as one of the world’s preferred vanadium companies through the supply of its VPURE™ and VPURE+™ products, which are sourced from one of the world’s highest-grade vanadium deposits at the Company’s Maracás Menchen Mine in Brazil. Aiming to enhance value creation at Largo, the Company is in the process of implementing a titanium dioxide pigment plant using feedstock sourced from its existing operations in addition to advancing its U.S.-based clean energy division with its VCHARGE vanadium batteries. Largo’s VCHARGE vanadium batteries contain a variety of innovations, enabling an efficient, safe and ESG-aligned long duration solution that is fully recyclable at the end of its 25+ year lifespan. Producing some of the world’s highest quality vanadium, Largo’s strategic business plan is based on two pillars: 1.) leading vanadium supplier with an outlined growth plan and 2.) U.S.-based energy storage business support a low carbon future.
Michael Heim, Senior Vice President, Equity Research Analyst, Energy & Transportation, Noble Capital Markets, Inc.
Refer to the full report for the price target, fundamental analysis, and rating.
Quarterly results reviewed. As indicated in an earlier report, first-quarter results were generally in line with expectations. Revenues ran a bit above expectations on favorable pricing, but costs were higher than expected as well.
Production and sales guidance reductions. Management reduced production and sales guidance by roughly 20% due to drilling delays caused by wet weather. Management explained that vanadium production requires blending, and we believe regular drilling is needed to identify blending supplies. Drilling has resumed, and management should have a better idea what production and sales could look like for the rest of 2024 soon.
Equity Research is available at no cost to Registered users of Channelchek. Not a Member? Click ‘Join’ to join the Channelchek Community. There is no cost to register, and we never collect credit card information.
This Company Sponsored Research is provided by Noble Capital Markets, Inc., a FINRA and S.E.C. registered broker-dealer (B/D).
*Analyst certification and important disclosures included in the full report. NOTE: investment decisions should not be based upon the content of this research summary. Proper due diligence is required before making any investment decision.
All dollar amounts expressed are in thousands of U.S. dollars unless otherwise indicated.
Q1 2023 and Other Highlights
Revenues of $57.4 million, a 35% increase over Q1 2022, mainly due to greater sales quantities at a higher revenue per lb sold1; Revenues per pound sold1 of $9.14, a 5% increase over Q1 2022
Operating costs of $45.9 million vs. $29.0 million in Q1 2022, and cash operating costs excluding royalties per pound1 of V2O5 equivalent sold of $5.15 vs. $3.97 in Q1 2022
Net loss of $1.2 million vs. a net loss of $2.0 million in Q1 2022
Cash provided before working capital items of $8.2 million, a 42% increase over Q1 2022
In January 2023, the Company secured two debt facilities: a two-year debt facility of $15.0 million, bearing interest at 6.85% per annum with payments due quarterly and principal repayments starting after a grace period of 180 days, and a three-year debt facility of $10.0 million, bearing interest at 8.36% per annum with an initial fee of 0.70% and payments due semi-annually with principal repayments starting after a grace period of 360 days
Cash balance of $61.6 million, debt of $65.0 million and a net working capital2 surplus of $119.3 million exiting Q1 2023
Total V2O5 equivalent sales of 2,849 tonnes (including 245 tonnes of purchased material), a 28% increase over Q1 2022; V2O5 production 2,111 tonnes (4.6 million lbs3) vs. 2,441 tonnes (4.4 million lbs3) in Q1 2022
The Company has adjusted its annual 2023 V2O5 equivalent production guidance to 9,000 – 11,000 tonnes from 11,000 – 12,000 tonnes, its annual 2023 V2O5 equivalent sales guidance to 8,700 – 10,700 tonnes from 10,300 – 11,300 tonnes and its cash operating cost excluding royalties per lb sold guidance to $4.85 – 5.65 from $4.85 – 5.25
Q1 2023 results conference call and webcast: Thursday, May 11th at 1:00 p.m. ET
Vanadium Market Update4
Spot demand remained strong in Q1 2023, primarily due to higher-than-expected demand from the aerospace sector with demand in the energy storage market anticipated to increase in future quarters largely due to anticipated Chinese vanadium redox flow battery (“VRFB”) deployments
The average benchmark price per pound of V2O5 in Europe was $10.39 in Q1 2023, a 3% decrease from the average of $10.72 seen in Q1 2022; The average benchmark price per kg of ferrovanadium (“FeV”) in Europe was $39.46 in Q1 2023, a 15% decrease from the average of $46.17 seen in Q1 2022, mainly due to lower spot demand from the steel sector in the quarter
TORONTO–(BUSINESS WIRE)– Largo Inc. (“Largo” or the “Company“) (TSX: LGO) (NASDAQ: LGO) today released financial and operating results for the three months ended March 31, 2023. The Company reported quarterly vanadium pentoxide (“V2O5”) equivalent sales of 2,849 tonnes at a cash operating cost excluding royalties per pound1 sold of $5.15.
Largo Reports First Quarter 2023 Financial Results and Provides Update to 2023 Operational and Sales Outlook (Photo: Business Wire)
Daniel Tellechea, Interim CEO and Director of Largo, stated: “While first quarter results were in line with our annual 2023 guidance, we have revised our 2023 production, sales and cost guidance due to heavy rain in December causing the Company to delay its infill drilling campaign for 2023, which is required for further refinement of the Company’s short-term mining model. Returning to normalized production levels remains the top priority for Largo as we work through this period of adjustment in our mining operations.”
He continued: “However, we should not overlook the upcoming catalysts for the Company in 2023. We continued to progress with the construction of our ilmenite concentration plant during the first quarter and expect to complete construction in Q2 2023, with commissioning and ramp up following shortly thereafter. In addition, installation of our 6.1 megawatt-hour vanadium battery in Spain continued during Q1 2023 with final provisional acceptance scheduled for Q3 2023.” He concluded: “As for the market, vanadium prices decreased approximately 6% in April 2023 as a result of lower short-term steel demand. Despite this, we believe vanadium’s long-term and medium-term fundamentals remain strong, with considerable demand growth expected in the future from battery applications.”
Q1 2023 Financial Highlights
During Q1 2023, the Company recognized revenues of $57.4 million from sales of 2,849 tonnes of V2O5 equivalent (Q1 2022 – 2,232 tonnes). This represents a 35% increase in revenues over Q1 2022 ($42.7 million) and is mainly due to greater sales quantities at a higher revenue per lb sold1.
Operating costs of $45.9 million in Q1 2023 (Q1 2022 – $29.0 million) include direct mine and production costs of $28.4 million (Q1 2022 – $17.6 million), conversion costs of $1.9 million (Q1 2022 – $1.8 million), product acquisition costs of $4.2 million (Q1 2022 – $1.6 million), royalties of $2.4 million (Q1 2022 – $2.0 million), distribution costs of $1.4 million (Q1 2022 – $1.4 million), depreciation and amortization of $7.3 million (Q1 2022 – $4.3 million) and iron ore costs of $0.3 million (Q1 2022 – $0.2 million). The increase in direct mine and production costs is attributable to low ore availability due in part to the heavy rains in December 2022, as well as a shutdown for the completion of the planned maintenance and refractory refurbishment in the kiln. Higher mining costs, the lack of production stability and the ramp up following the shutdown negatively impacted costs in Q1 2023. In addition, as compared with Q1 2022, the Company experienced cost increases in critical consumables, including sodium carbonate, as well as increased consumption of ammonium sulfate.
Cash operating costs excluding royalties per pound1 sold were $5.15 in Q1 2023, compared with $3.97 in Q1 2022. The increase seen in Q1 2023 compared with Q1 2022 is largely due to the reasons noted above for operating costs, with the previously noted plant shutdowns negatively impacting operational and financial performance for the quarter.
Professional, consulting and management fees were $5.5 million in Q1 2023, compared with $5.9 million in Q1 2022, representing a 6% decrease. The decrease is primarily due to lower costs incurred for Largo Physical Vanadium Corp. (“LPV”) in Q1 2023 than in the previous comparative quarter.
Other general and administrative expenses were $3.3 million in Q1 2023, compared with $1.7 million in Q1 2022. The increase is primarily attributable to increased depreciation in Q1 2023 from the Company’s software intangible asset, as well as increased IT related costs in support of the Company’s enterprise resource planning (“ERP”) software implementation. The Company also saw increased costs at LCE, which are primarily related to increased travel costs arising from its battery installation activities in Spain.
Share-based payments in Q1 2023 decreased from Q1 2022 by 266% to an expense recovery of $1.3 million. The decrease was attributable to the reversal of share-based payment expenditures on forfeited unvested stock options and restricted share units (“RSUs”) as well as a reduced number of stock options and RSUs granted in Q1 2023, as compared with Q1 2022.
Finance costs were $1.4 million in Q1 2023, compared with $0.2 million in Q1 2022. The increase is attributable to increased debt, as well as an initial financing fee on the Company’s new debt facilities.
Technology start-up costs were $2.8 million in Q1 2023, representing a 7% decrease over Q1 2022. These costs relate to activities at LCE focussed on the deployment of its initial VCHARGE VRFB system in Spain with the quarter seeing increased activity by the field service team and higher transportation and installation costs.
Cash provided by financing activities in Q1 2023 increased from cash provided by financing activities in Q1 2022 by $24.9 million. The movement is primarily due to the receipt of debt of $25.0 million.
Cash used in investing activities in Q1 2023 of $23.4 million is an increase from the $4.3 million seen in Q1 2022. This is primarily due to capital expenditures for the ilmenite project and purchases of vanadium assets by LPV of $8.6 million.
Additional Corporate Updates
Q1 2023 Production Overview: Production of 2,111 tonnes of V2O5 in Q1 2023 was 14% lower than the 2,442 tonnes of V2O5 produced in Q1 2022. In Q1 2023, the Company experienced reduced massive ore inventory arising from the heavy rainfall in December 2022. The planned kiln maintenance and refractory refurbishment initially scheduled for February was completed in January during the stoppage in operations. In Q1 2023, the transition in mining contractor was completed and 341,967 tonnes of ore were mined with an effective grade5 of 0.81% of V2O5. The ore mined in Q1 2023 was 13% higher than in Q1 2022. The Company produced 78,695 tonnes of concentrate with an effective grade5 of 2.99%. The global recovery6 achieved in Q1 2023 was 83.0%, an increase of 7.1% from the 77.5% achieved in Q1 2022 and 11.1% higher than the 74.7% achieved in Q4 2022. The global recovery6 in January was 83.1%, with 82.9% achieved in February and 82.7% achieved in March. Subsequent to Q1 2023, production in April 2023 was 676 tonnes of V2O5 equivalent.
Q1 2023 High Purity Production: In Q1 2023, the Company produced 1,041 V2O5 equivalent tonnes of high purity products, including 813 tonnes of high purity V2O5 and 228 tonnes of high purity vanadium trioxide (“V2O3”). This represented 49% of the total quarterly production.
Q1 2023 Sales Overview and Outlook: In Q1 2023, the Company sold 2,849 tonnes of V2O5 equivalent (Q1 2022 – 2,232 tonnes), including 245 tonnes of purchased products (Q1 2022 – 79 tonnes). Logistical challenges and transport costs have eased from their highs and the Company expects further improvements in the coming quarters and the Company continued to deliver on all its commercial commitments. The Company has also committed to the purchase of 60 tonnes per month of V2O5 from third parties for the remainder of the year. Subsequent to Q1 2023, sales in April 2023 were 1,101 tonnes of V2O5 equivalent, including 78 tonnes of purchased material.
Stack Manufacturing Facility Improvements at LCE: All building improvements at Largo Clean Energy’s (“LCE”) facility in Wilmington, Massachusetts were completed during Q1 2023. Stack manufacturing has moved into its final location and LCE will now begin the process of restarting and scaling up the capacity to 12.5 megawatts (“MW”) by the end of the year, with an ultimate capacity of 100 MW by the end of 2025. The sub-scale and chemistry teams have moved into their new lab, which, following an upgrade over the next two quarters, will increase the material and core technology testing capacity to support new vendors and performance improvements.
Promotion of Paul Vollant to Chief Commercial Officer: Effective May 9, 2023, Largo has promoted Paul Vollant to Chief Commercial Officer in order to oversee all sales and strategic business development efforts related to the commodity division of the Company. His promotion reflects an unwavering commitment and support of the Company’s sales efforts to date, including the establishment and oversight of Largo’s sales and trading department. Mr. Vollant is highly experienced in the sales and marketing of metals and minerals and has specialized in strategic metals, particularly vanadium and titanium. Mr. Vollant joined Largo in 2019 as Director of Sales and Trading and was subsequently promoted to Vice President of Commercial in 2021.
Update of 2023 Production and Sales Strategy Outlook
The Company is in the process of reviewing its short-term mine model to incorporate on-going infill drilling at the Campbell Pit. Based on results to date and expected future results, the Company has adjusted its annual 2023 production, sales and cash cost guidance.
Q1 2023 Webcast and Conference Call Information
To join the conference call without operator assistance, you may register and enter your phone number at https://emportal.ink/40oF5sO to receive an instant automated call back.
You can also dial direct to be entered to the call by an Operator via dial-in details below.
To view press releases or any additional financial information, please visit the Investor Resources section of the Company’s website at: www.largoinc.com/English/investor-resources
A playback recording will be available on the Company’s website for a period of 60-days following the conference call.
The information provided within this release should be read in conjunction with Largo’s unaudited condensed interim financial statements for the three months ended March 31, 2023 and 2022 and its management’s discussion and analysis for the three months ended March 31, 2023 which are available on our website at www.largoinc.com or on the Company’s respective profiles at www.sedar.com and www.sec.gov.
About Largo
Largo has a long and successful history as one of the world’s preferred vanadium companies through the supply of its VPURETM and VPURE+TM products, which are sourced from one of the world’s highest-grade vanadium deposits at the Company’s Maracás Menchen Mine in Brazil. Aiming to enhance value creation at Largo, the Company is in the process of implementing an ilmenite concentration plant using feedstock sourced from its existing operations in addition to advancing its U.S.-based clean energy division with its VCHARGE vanadium batteries. Largo’s VCHARGE vanadium batteries contain a variety of innovations, enabling an efficient, safe and ESG-aligned long duration solution that is fully recyclable at the end of its 25+ year lifespan. Producing some of the world’s highest quality vanadium, Largo’s strategic business plan is based on two pillars: 1.) leading vanadium supplier with an outlined growth plan and 2.) U.S.-based energy storage business support a low carbon future.
Largo’s common shares trade on the Nasdaq Stock Market and on the Toronto Stock Exchange under the symbol “LGO”. For more information, please visit www.largoinc.com.
This press release contains “forward-looking information” and “forward-looking statements” within the meaning of applicable Canadian and United States securities legislation. Forward‐looking information in this press release includes, but is not limited to, statements with respect to the timing and amount of estimated future production and sales; the future price of commodities; costs of future activities and operations, including, without limitation, the effect of inflation and exchange rates; the effect of unforeseen equipment maintenance or repairs on production; timing of ilmenite production; the ability to produce high purity V2O5 and V2O3 according to customer specifications; the extent of capital and operating expenditures; the ability of the Company to make improvements on its current short-term mine plan; the impact of global delays and related price increases on the Company’s global supply chain and future sales of vanadium products. Forward‐looking information in this press release also includes, but is not limited to, statements with respect to our ability to build, finance and successfully operate a VRFB business, the projected timing and cost of the completion of the EGPE project; our ability to protect and develop our technology, our ability to maintain our IP, the competitiveness of our product in an evolving market, our ability to market, sell and deliver our VCHARGE batteries on specification and at a competitive price, our ability to successfully deploy our VCHARGE batteries in foreign jurisdictions; our ability to negotiate and enter into a joint venture with Ansaldo Green Tech on terms satisfactory to the Company and the success of such joint venture; the receipt of necessary governmental permits and approvals on a timely basis, our ability to secure the required resources to build and deploy our VCHARGE batteries, and the adoption of VRFB technology generally in the market.
The following are some of the assumptions upon which forward-looking information is based: that general business and economic conditions will not change in a material adverse manner; demand for, and stable or improving price of V2O5 and other vanadium commodities; receipt of regulatory and governmental approvals, permits and renewals in a timely manner; that the Company will not experience any material accident, labour dispute or failure of plant or equipment or other material disruption in the Company’s operations at the Maracás Menchen Mine or relating to Largo Clean Energy, specially in respect of the installation and commissioning of the EGPE project; the availability of financing for operations and development; the availability of funding for future capital expenditures; the ability to replace current funding on terms satisfactory to the Company; the ability to mitigate the impact of heavy rainfall; the Company’s ability to procure equipment, services and operating supplies in sufficient quantities and on a timely basis; that the estimates of the resources and reserves at the Maracás Menchen Mine are within reasonable bounds of accuracy (including with respect to size, grade and recovery and the operational and price assumptions on which such estimates are based); the accuracy of the Company’s mine plan at the Maracás Menchen Mine, the competitiveness of the Company’s VRFB technology; the ability to obtain funding through government grants and awards for the Green Energy sector, the accuracy of cost estimates and assumptions on future variations of VCHARGE battery system design, that the Company’s current plans for ilmenite and VRFBs can be achieved; the Company’s “two-pillar” business strategy will be successful; the Company’s sales and trading arrangements will not be affected by the evolving sanctions against Russia; and the Company’s ability to attract and retain skilled personnel and directors; the ability of management to execute strategic goals.
Forward-looking statements can be identified by the use of forward-looking terminology such as “plans”, “expects” or “does not expect”, “is expected”, “budget”, “scheduled”, “estimates”, “forecasts”, “intends”, “anticipates” or “does not anticipate”, or “believes”, or variations of such words and phrases or statements that certain actions, events or results “may”, “could”, “would”, “might” or “will be taken”, “occur” or “be achieved”. All information contained in this news release, other than statements of current and historical fact, is forward looking information. Forward-looking statements are subject to known and unknown risks, uncertainties and other factors that may cause the actual results, level of activity, performance or achievements of Largo or Largo Clean Energy to be materially different from those expressed or implied by such forward-looking statements, including but not limited to those risks described in the annual information form of Largo and in its public documents filed on www.sedar.com and available on www.sec.gov from time to time. Forward-looking statements are based on the opinions and estimates of management as of the date such statements are made. Although management of Largo has attempted to identify important factors that could cause actual results to differ materially from those contained in forward-looking statements, there may be other factors that cause results not to be as anticipated, estimated or intended. There can be no assurance that such statements will prove to be accurate, as actual results and future events could differ materially from those anticipated in such statements. Accordingly, readers should not place undue reliance on forward-looking statements. Largo does not undertake to update any forward-looking statements, except in accordance with applicable securities laws. Readers should also review the risks and uncertainties sections of Largo’s annual and interim MD&As which also apply.
Trademarks are owned by Largo Inc.
Non-GAAP Measures
The Company uses certain non-GAAP measures in its press release, which are described in the following section. Non-GAAP financial measures and non-GAAP ratios are not standardized financial measures under IFRS, the Company’s GAAP, and might not be comparable to similar financial measures disclosed by other issuers. These measures are intended to provide additional information and should not be considered in isolation or as a substitute for measures of performance prepared in accordance with IFRS.
Revenues Per Pound
The Company’s press release refers to revenues per pound sold, V2 O5 revenues per pound of V2 O5 sold and FeV revenues per kg of FeV sold, which are non-GAAP financial measures that are used to provide investors with information about a key measure used by management to monitor performance of the Company.
These measures, along with cash operating costs, are considered to be key indicators of the Company’s ability to generate operating earnings and cash flow from its Maracás Menchen Mine and sales activities. These measures differ from measures determined in accordance with IFRS, and are not necessarily indicative of net earnings or cash flow from operating activities as determined under IFRS.
The following table provides a reconciliation of revenues per pound sold, V2O5 revenues per pound of V2O5 sold and FeV revenues per kg of FeV sold to revenues and the revenue information presented in note 18 as per the Q1 2023 unaudited condensed interim consolidated financial statements.
Cash Operating Costs and Cash Operating Costs Excluding Royalties
The Company’s press release refers to cash operating costs per pound and cash operating costs excluding royalties per pound, which are non-GAAP ratios based on cash operating costs and cash operating costs excluding royalties, which are non-GAAP financial measures, in order to provide investors with information about a key measure used by management to monitor performance. This information is used to assess how well the Maracás Menchen Mine is performing compared to plan and prior periods, and also to assess its overall effectiveness and efficiency.
Cash operating costs includes mine site operating costs such as mining costs, plant and maintenance costs, sustainability costs, mine and plant administration costs, royalties and sales, general and administrative costs (all for the Mine properties segment), but excludes depreciation and amortization, share-based payments, foreign exchange gains or losses, commissions, reclamation, capital expenditures and exploration and evaluation costs. Operating costs not attributable to the Mine properties segment are also excluded, including conversion costs, product acquisition costs, distribution costs and inventory write-downs.
Cash operating costs excluding royalties is calculated as cash operating costs less royalties.
Cash operating costs per pound and cash operating costs excluding royalties per pound are obtained by dividing cash operating costs and cash operating costs excluding royalties, respectively, by the pounds of vanadium equivalent sold that were produced by the Maracás Menchen Mine.
Cash operating costs, cash operating costs excluding royalties, cash operating costs per pound and cash operating costs excluding royalties per pound, along with revenues, are considered to be key indicators of the Company’s ability to generate operating earnings and cash flow from its Maracás Menchen Mine. These measures differ from measures determined in accordance with IFRS, and are not necessarily indicative of net earnings or cash flow from operating activities as determined under IFRS.
The following table provides a reconciliation of cash operating costs and cash operating costs excluding royalties, cash operating costs per pound and cash operating costs excluding royalties per pound for the Maracás Menchen Mine to operating costs as per the Q1 2023 unaudited condensed interim consolidated financial statements.
For further information, please contact:
Investor Relations Alex Guthrie Senior Manager, External Relations +1.416.861.9778 aguthrie@largoinc.com
Largo has a long and successful history as one of the world’s preferred vanadium companies through the supply of its VPURE™ and VPURE+™ products, which are sourced from one of the world’s highest-grade vanadium deposits at the Company’s Maracás Menchen Mine in Brazil. Aiming to enhance value creation at Largo, the Company is in the process of implementing a titanium dioxide pigment plant using feedstock sourced from its existing operations in addition to advancing its U.S.-based clean energy division with its VCHARGE vanadium batteries. Largo’s VCHARGE vanadium batteries contain a variety of innovations, enabling an efficient, safe and ESG-aligned long duration solution that is fully recyclable at the end of its 25+ year lifespan. Producing some of the world’s highest quality vanadium, Largo’s strategic business plan is based on two pillars: 1.) leading vanadium supplier with an outlined growth plan and 2.) U.S.-based energy storage business support a low carbon future.
Michael Heim, Senior Vice President, Equity Research Analyst, Energy & Transportation, Noble Capital Markets, Inc.
Refer to the full report for the price target, fundamental analysis, and rating.
Largo reported 2023-1Q results generally in line with our recently-revised estimates. Revenues were a few million higher than expected, but so were operating costs, leading to operating income near expectations. Income tax expenses of $1.8 million on $0.7 million of pretax income were unexpected causing a $1.2 million net loss ($0.02 p/s) versus our expectations for breakeven results. We will seek clarification on the 268% tax rate during the upcoming conference call (5/11 at 1:00 pm EST, 1-416-764-8650).
Production and sales numbers lowered for the rest of the year. Management lowered annual production guidance to 9,000-11,000 tonnes from 11,000-13,000 tonnes. It also lowered sales to 8,700-10,700 tonnes from 10,300-11,300 tonnes and raised the upper range of its operating costs per unit sold projections. The declines were split across the second, third, and fourth quarters implying that the heavy rainfall in December that affected inventory may continue longer than expected. We have adjusted the numbers in our models to reflect updated guidance.
Equity Research is available at no cost to Registered users of Channelchek. Not a Member? Click ‘Join’ to join the Channelchek Community. There is no cost to register, and we never collect credit card information.
This Company Sponsored Research is provided by Noble Capital Markets, Inc., a FINRA and S.E.C. registered broker-dealer (B/D).
*Analyst certification and important disclosures included in the full report. NOTE: investment decisions should not be based upon the content of this research summary. Proper due diligence is required before making any investment decision.
Alvopetro Energy Ltd.’s vision is to become a leading independent upstream and midstream operator in Brazil. Our strategy is to unlock the on-shore natural gas potential in the state of Bahia in Brazil, building off the development of our Caburé natural gas field and our strategic midstream infrastructure.
Michael Heim, Senior Vice President, Equity Research Analyst, Energy & Transportation, Noble Capital Markets, Inc.
Refer to the full report for the price target, fundamental analysis, and rating.
Production growth combined with price increases is leading to rising revenues. 2023-1Q production rose to 2,767 boepd (up 11% annually and 2% sequentially). Monthly production had been reported, so results were in line with expectations. Realized gas prices were $12.06/mcf (up 20% annually and 8% sequentially). A biannual price adjustment in February resulted in higher rates. This was also disclosed previously, so pricing was in line with our expectations. Energy sales revenues were $18.2 million slightly below our $18.8 million estimate due to lower-than-expected oil and NGL sales.
Top line growth is flowing through to the bottom line. The company reported record Funds Flow From Operations of $15.0 million versus $10.9 million for the same period last year and above our $11.4 million estimate. Net income was $12.8 million ($0.33 per diluted share) versus $15.1 million ($0.30) also above our $9.1 million ($0.24) estimate.
Equity Research is available at no cost to Registered users of Channelchek. Not a Member? Click ‘Join’ to join the Channelchek Community. There is no cost to register, and we never collect credit card information.
This Company Sponsored Research is provided by Noble Capital Markets, Inc., a FINRA and S.E.C. registered broker-dealer (B/D).
*Analyst certification and important disclosures included in the full report. NOTE: investment decisions should not be based upon the content of this research summary. Proper due diligence is required before making any investment decision.
What is Hydrogen, and Can it Really Become a Climate Change Solution?
As the United States and other countries react to achieve a goal of zero-carbon electricity generation by 2035, energy providers are swiftly ramping up renewable resources such as solar and wind. But because these technologies churn out electrons only when the sun shines and the wind blows, a backup from more reliable energy sources would prevent blackouts and brownouts. Currently, plants burning fossil fuels, primarily natural gas, fill in the gaps. Can we stop using fossil fuels now? – Paul Hoffman, Managing Editor, Channelchek
Hydrogen, or H₂, is getting a lot of attention lately as governments in the U.S., Canada and Europe push to cut their greenhouse gas emissions.
But what exactly is H₂, and is it really a clean power source?
I specialize in researching and developing H₂ production techniques. Here are some key facts about this versatile chemical that could play a much larger role in our lives in the future.
This article was republished with permission from The Conversation, a news site dedicated to sharing ideas from academic experts. It represents the research-based findings and thoughts of Hannes van der Watt, Research Assistant Professor, University of North Dakota.
So, What is Hydrogen?
Hydrogen is the most abundant element in the universe, but because it’s so reactive, it isn’t found on its own in nature. Instead, it is typically bound to other atoms and molecules in water, natural gas, coal and even biological matter like plants and human bodies.
Hydrogen can be isolated, however. And on its own, the H₂ molecule packs a heavy punch as a highly effective energy carrier.
It is already used in industry to manufacture ammonia, methanol and steel and in refining crude oil. As a fuel, it can store energy and reduce emissions from vehicles, including buses and cargo ships.
Hydrogen can also be used to generate electricity with lower greenhouse gas emissions than coal or natural gas power plants. That potential is getting more attention as the U.S. government proposes new rules that would require existing power plants to cut their carbon dioxide emissions.
Because it can be stored, H₂ could help overcome intermittency issues associated with renewable power sources like wind and solar. It can also be blended with natural gas in existing power plants to reduce the plant’s emissions.
Using hydrogen in power plants can reduce carbon dioxide emissions when either blended or alone in specialized turbines, or in fuel cells, which consume H₂ and oxygen, or O₂, to produce electricity, heat and water. But it’s typically not entirely CO₂-free. That’s in part because isolating H₂ from water or natural gas takes a lot of energy.
How is Hydrogen Produced?
There are a few common ways to produce H₂:
Electrolysis can isolate hydrogen by splitting water – H₂O – into H₂ and O₂ using an electric current.
Methane reforming uses steam to split methane, or CH₄, into H₂ and CO₂. Oxygen and steam or CO₂ can also be used for this splitting process.
Gasification transforms hydrocarbon-based materials – including biomass, coal or even municipal waste – into synthesis gas, an H₂-rich gas that can be used as a fuel either on its own or as a precursor for producing chemicals and liquid fuels.
Each has benefits and drawbacks.
Green, Blue, Gray – What Do the Colors Mean?
Hydrogen is often described by colors to indicate how clean, or CO₂-free, it is. The cleanest is green hydrogen.
Green H₂ is produced using electrolysis powered by renewable energy sources, such as wind, solar or hydropower. While green hydrogen is completely CO₂-free, it is costly, at around US$4-$9 per kilogram ($2-$4 per pound) because of the high energy required to split water.
The largest share of hydrogen today is made from natural gas, meaning methane, which is a potent greenhouse gas. IRENA (2020), Green Hydrogen: A guide to policymaking
Other less energy-intensive techniques can produce H₂ at a lower cost, but they still emit greenhouse gases.
Gray H₂ is the most common type of hydrogen. It is made from natural gas through methane reforming. This process releases carbon dioxide into the atmosphere and costs around $1-$2.50 per kilogram (50 cents-$1 per pound).
If gray hydrogen’s CO₂ emissions are captured and locked away so they aren’t released into the atmosphere, it can become blue hydrogen. The costs are higher, at around $1.50-$3 per kilogram (70 cents-$1.50 per pound) to produce, and greenhouse gas emissions can still escape when the natural gas is produced and transported.
Another alternative is turquoise hydrogen, produced using both renewable and nonrenewable resources. Renewable resources provide clean energy to convert methane – CH₄ – into H₂ and solid carbon, rather than that carbon dioxide that must be captured and stored. This type of pyrolysis technology is still new, and is estimated to cost between $1.60 and $2.80 per kilogram (70 cents-$1.30 per pound).
Can We Switch Off the Lights on Fossil Fuels Now?
Over 95% of the H₂ produced in the U.S. today is gray hydrogen made with natural gas, which still emits greenhouse gases.
Whether H₂ can ramp up as a natural gas alternative for the power industry and other uses, such as for transportation, heating and industrial processes, will depend on the availability of low-cost renewable energy for electrolysis to generate green H₂.
It will also depend on the development and expansion of pipelines and other infrastructure to efficiently store, transport and dispense H₂.
Without the infrastructure, H₂ use won’t grow quickly. It’s a modern-day version of “Which came first, the chicken or the egg?” Continued use of fossil fuels for H₂ production could spur investment in H₂ infrastructure, but using fossil fuels releases greenhouse gases.
What Does the Future Hold for Hydrogen?
Although green and blue hydrogen projects are emerging, they are small so far.
Policies like Europe’s greenhouse gas emissions limits and the 2022 U.S. Inflation Reduction Act, which offers tax credits up to $3 per kilogram ($1.36 per pound) of H₂, could help make cleaner hydrogen more competitive.
Hydrogen demand is projected to increase up to two to four times its current level by 2050. For that to be green H₂ would require significant amounts of renewable energy at the same time that new solar, wind and other renewable energy power plants are being built to provide electricity directly to the power sector.
While green hydrogen is a promising trend, it is not the only solution to meeting the world’s energy needs and carbon-free energy goals. A combination of renewable energy sources and clean H₂, including blue, green or turquoise, will likely be necessary to meet the world’s energy needs in a sustainable way.
Energy Fuels is a leading U.S.-based uranium mining company, supplying U3O8 to major nuclear utilities. Energy Fuels also produces vanadium from certain of its projects, as market conditions warrant, and is ramping up commercial-scale production of REE carbonate. Its corporate offices are in Lakewood, Colorado, near Denver, and all its assets and employees are in the United States. Energy Fuels holds three of America’s key uranium production centers: the White Mesa Mill in Utah, the Nichols Ranch in-situ recovery (“ISR”) Project in Wyoming, and the Alta Mesa ISR Project in Texas. The White Mesa Mill is the only conventional uranium mill operating in the U.S. today, has a licensed capacity of over 8 million pounds of U3O8 per year, has the ability to produce vanadium when market conditions warrant, as well as REE carbonate from various uranium-bearing ores. The Nichols Ranch ISR Project is on standby and has a licensed capacity of 2 million pounds of U3O8 per year. The Alta Mesa ISR Project is also on standby and has a licensed capacity of 1.5 million pounds of U3O8 per year. In addition to the above production facilities, Energy Fuels also has one of the largest NI 43-101 compliant uranium resource portfolios in the U.S. and several uranium and uranium/vanadium mining projects on standby and in various stages of permitting and development. The primary trading market for Energy Fuels’ common shares is the NYSE American under the trading symbol “UUUU,” and the Company’s common shares are also listed on the Toronto Stock Exchange under the trading symbol “EFR.” Energy Fuels’ website is www.energyfuels.com.
Michael Heim, Senior Vice President, Equity Research Analyst, Energy & Transportation, Noble Capital Markets, Inc.
Refer to the full report for the price target, fundamental analysis, and rating.
Energy Fuels reported 2023-1Q results in line with expectations absent non-recurring items. UUUU reported revenues of $19.6 million (versus our $18 million est.) largely due to the previously-announced sale of uranium to the government. Net income was $114.7 million ($0.72 per share) with a $116.5 million net gain on the sale of the Alta Mesa project. Absent the gain, the company would have reported a slight loss, in line with our projections.
UUUU’s rare earth elements (REE) plan is becoming clearer. Phase 1 of a plan to separate rare earth elements such as the valuable NdPr. has begun. When completed in 2023/24, UUUU will be able to produce 800-1,000 metric tons (0.8-1.0 million kg) of “commercial quantities of separated NdPr.” At the current spot price of $64 per kg, sales could approach $64 million. Sales of other separated REE would be incremental. And, production is expected to grow 2-3 times upon completion of Phase 2 in 2026 leading us to believe annual sales from REE could be several hundred million. For a company that has not generated annual revenues above $30 million the last ten years, the prospect of generating hundreds of million in sales is exciting.
Equity Research is available at no cost to Registered users of Channelchek. Not a Member? Click ‘Join’ to join the Channelchek Community. There is no cost to register, and we never collect credit card information.
This Company Sponsored Research is provided by Noble Capital Markets, Inc., a FINRA and S.E.C. registered broker-dealer (B/D).
*Analyst certification and important disclosures included in the full report. NOTE: investment decisions should not be based upon the content of this research summary. Proper due diligence is required before making any investment decision.
The Company sold 300,000 pounds of uranium at a gross margin of 58%, 79,344 pounds of vanadium at a gross margin of 37%, and the Alta Mesa property for a total gain of $116.45 million; Working capital increased, total assets increased, and total liabilities decreased.
LAKEWOOD, Colo., May 5, 2023 /CNW/ – Energy Fuels Inc. (NYSE American: UUUU) (TSX: EFR) (“Energy Fuels” or the “Company”) today reported its financial results for the quarter ended March 31, 2023. The Company’s Quarterly Report on Form 10-Q has been filed with the U.S. Securities and Exchange Commission (“SEC“) and may be viewed on the Electronic Document Gathering and Retrieval System (“EDGAR“) at www.sec.gov/edgar.shtml, on the System for Electronic Document Analysis and Retrieval (“SEDAR“) at www.sedar.com, and on the Company’s website at www.energyfuels.com. Unless noted otherwise, all dollar amounts are in U.S. dollars.
Financial Highlights:
As of March 31, 2023, the Company had a robust balance sheet with $143.61 million of working capital (versus $116.97 million at December 31, 2022), including $43.83 million of cash and cash equivalents, $60.44 million of marketable securities, $38.00 million of inventory, and no debt. At current commodity prices, the Company’s product inventory has a value of $52.53 million;
During the three months ended March 31, 2023, the Company realized net income of $114.26 million, or $0.72 per share, primarily due to: (i) a net gain of $116.45 million on the sale of the Company’s Alta Mesa in situ recovery (“ISR“) project in Texas; (ii) a net gain of $10.76 million on the sale of 300,000 pounds of uranium (“U3O8“) to the U.S. Uranium program; (iii) a net gain of $0.32 million on the sale of 79,344 pounds of vanadium (“V2O5“); (iv) increased expenses associated with preparing four (4) of our uranium mines for production; (v) expenses associated with developing commercial rare earth element (“REE“) separation capabilities; and (vi) a non-cash mark-to-market loss on investments accounted for at fair value of $2.96 million.
The Company realized a total gross margin of 57% on its product sales during Q1-2023, including 58% on its uranium sale and 37% on its vanadium sales.
At March 31, 2023, the Company’s total assets and current assets increased by 37% and 10%, respectively, and total liabilities and current liabilities decreased by 44% and 72%, respectively, as compared to December 31, 2022.
As of March 31, 2023, the Company held 847,000 pounds of finished U3O8, 906,000 pounds of finished V2O5, and 250 metric tons (“MT“) of finished high-purity, partially separated mixed REE carbonate (“RE Carbonate“) in inventory.
The Company holds an additional 394,000 lbs. of U3O8 as raw materials and work-in-progress inventory, along with 1 – 3 million pounds of solubilized V2O5 in tailings solutions that could be recovered in the future.
Uranium Highlights:
During Q1-2023, the Company completed the sale of 300,000 pounds of U3O8 to the U.S. Uranium Reserve realizing total gross proceeds of $18.47 million, or $61.57 per pound of U3O8. This sale resulted in a gross margin of approximately $35.85 per pound of uranium, or a gross margin of 58%.
During 2023, the Company expects to sell an additional 200,000 to 260,000 pounds of U3O8 into its current portfolio of supply agreements with U.S. nuclear utilities at an expected sales price of approximately $54 – $58 per pound, resulting in an estimated 46% – 50% gross margin.
During Q1-2023, the Company purchased a total of 120,000 pounds of U.S.-origin U3O8 on the spot market for a weighted-average price of $50.25 per pound.
Over the past several months, the Company has made significant progress in preparing four (4) of our conventional uranium and uranium/vanadium mines to be ready to resume ore production, including significant workforce expansion and performing needed rehabilitation and development of surface and underground infrastructure.
On February 15, 2023, the Company announced it had completed its previously announced sale of its Alta Mesa ISR Project to enCore Energy Corp. (“enCore“) for total consideration of $120 million, comprised of $60 million in cash and $60 million in a secured convertible note bearing interest at a rate of eight percent (8%) per annum, convertible into common shares of enCore at a price of $2.9103 per share. This sale of a lower priority project provides Energy Fuels with significant additional cash and working capital, enabling the Company to ramp-up its US industry-leading uranium and REE production, while avoiding dilution to shareholders.
In connection with the Alta Mesa Transaction, on May 3, 2023, the Company completed the sale of its Prompt Fission Neutron assets, including the underlying contracts, technology, licenses and intellectual property (collectively, the “PFN Assets“), to enCore in exchange for cash consideration received at closing of $3.10 million. At closing, the PFN Assets, which the Company had purchased in 2020 for cash consideration of $0.5 million, had a net book value of $0.35 million. The PFN Assets were used exclusively at the Alta Mesa ISR Project and are not required for any of the Company’s other properties. Should the Company have the need for the use of a PFN tool in the future, the Company retained a 20-year usage right, subject to the availability of the PFN Assets, to purchase, lease and/or license at least one PFN tool and all related and/or required equipment, technology and licenses on commercially reasonable terms.
As of April 28, the spot price of U3O8 was $53.75 per pound according to data from TradeTech.
Rare Earth Element Highlights:
During the three months ended March 31, 2023, the Company produced approximately 250 MT of high-purity, partially separated mixed RE Carbonate from monazite, containing approximately 115 MT of total rare earth oxides (“TREO“), which is the most advanced REE material being produced commercially in the U.S. today.
The Company has in circuit an additional 65 to 115 MT of RE Carbonate, containing 35 to 55 MT of TREO, which it expects to package for sale during the second quarter of 2023.
In early 2023, the Company began modifying and enhancing its existing solvent extraction (“SX“) circuits at the Mill to be able to produce separated REE oxides (“Phase 1“). The Company has begun this development work in its SX building and ordered most of the major components for this project, which are expected to be delivered to the Mill in Q3-2023. “Phase 1” is expected to be completed and fully commissioned by late 2023 or early 2024 and have the capacity to produce roughly 800 to 1,000 MT of recoverable separated neodymium-praseodymium (“NdPr“) oxide per year, subject to securing sufficient monazite feed. “Phase 1” is expected to position Energy Fuels as one of the world’s leading producers of NdPr outside of China. “Phase 1” capital costs are expected to total approximately $25 million. 1,000 MT of NdPr in permanent magnets could power up to 1 million electric vehicles (“EVs“) per year.
The Company is engineering further enhancements at the Mill to increase NdPr production capacity to up to approximately 3,000 MT per year by 2026 (“Phase 2“), and to produce separated dysprosium (“Dy“), terbium (“Tb“) and potentially other advanced REE materials in the future from monazite and potentially other REE process streams by 2027 (“Phase 3”).
On February 13, 2023, the Company announced it had completed its previously announced acquisition of a large heavy mineral sands project in Brazil (the “Bahia Project“), which has the potential to supply the Company’s growing REE business with 3,000 – 10,000 MT of REE-bearing natural monazite sand per year for decades. The Bahia Project also contains significant quantities of high-value titanium (ilmenite and rutile) and zirconium (zircon) minerals.
During Q1-2023, the Company completed 2,266 meters of sonic drilling at the Bahia Project to confirm and further delineate the rare earth, titanium, and zirconium mineralization. The Company expects to commence further sonic drilling in Q3-2023, announce drilling results later this year, and commence preparation of an SK-1300 and NI 43-101 compliant mineral resource estimate.
The Company continues active discussions with several additional suppliers of natural monazite around the world to significantly increase the supply of feed for our growing REE initiative.
As of April 28, the spot price of NdPr oxide was $64 per kg, according to data from Asian Metal.
Vanadium Highlights:
During Q1-2023, the Company sold approximately 79,344 pounds of existing V2O5 inventory, for an average weighted sales price of $10.98 per pound of V2O5, for a total gross margin of 37%.
Due to the high-purity of the Company’s vanadium product, these sales occurred at a premium to V2O5 spot prices prevailing at the time of the sales.
As of April 28, the spot price of V2O5 was $9.75 per pound, according to data from Fastmarkets.
Medical Isotope Highlights:
The Company continued advancing its program to evaluate the potential to recover radioisotopes from its process streams for use in emerging targeted alpha therapy (“TAT“) cancer therapeutics.
Mark S. Chalmers, Energy Fuels’ President and CEO, stated:
“Energy Fuels had an exceptional 1st quarter on several metrics, including earnings of $114.26 million, achieving healthy margins on our product sales, increasing our working capital position to $143.61 million, increasing our total assets, and reducing our total liabilities. We also significantly enhanced our fixed asset portfolio by selling the non-core Alta Mesa uranium property for $120.00 million and closing on the purchase of the Bahia Project in Brazil, which has the potential to feed our REE separation circuits with low-cost raw materials for several decades.
“On uranium, we sold 300,000 pounds of U3O8 to the newly established U.S. Uranium Reserve for $18.47 million, or $61.57 per pound, representing a significant premium to the current spot price of uranium, resulting in a $10.76 million gross margin. We are also getting ready to sell up to another 260,000 pounds of U3O8 into our utility contract portfolio, also at healthy operating margins. We are closely tracking uranium prices, which have shown recent strength, for opportunities to sell additional uranium under long-term contracts to nuclear utilities at increasingly higher prices.
“Energy Fuels realized a significant gain of $116.45 million on the sale of our non-core Alta Mesa ISR project in Texas. Total consideration included $60 million of cash and a $60 million 2-year convertible note bearing 8% interest per year, fully secured by the property. This transaction also resulted in us receiving an additional $3.48 million cash for the return of collateral on the project’s reclamation bonds and a reduction in our standby costs of approximately $2 million per year.
“At the same time, we continue to perform significant work at four of our conventional uranium mines to get them ready to resume ore production. This includes the La Sal and Beaver mines at the La Sal Complex in Utah, the Whirlwind mine in Colorado and the Pinyon Plain mine in Arizona. Energy Fuels currently has sufficient uranium in inventory to fulfill our current utility contract requirements into 2025. However, we are seeking additional contracts and spot sale opportunities, along with a continuation of uranium purchasing by the U.S. government. Therefore, we could begin ore production at one or more of these projects by 2024.
“We continued to build our REE business as well. We began modifications and enhancements at the White Mesa Mill expected to produce up to 1,000 MT per year of NdPr oxide by late 2023 or early 2024, subject to receipt of sufficient monazite feed. We ordered the REE SX cells from a fabricator, with delivery to the Mill expected in Q3 or Q4-2023. Following delivery, we expect to install, commission, and optimize these cells, complete other modifications and enhancements to the existing circuits, and begin commercial production of NdPr oxide, along with uranium, soon thereafter. Upon completion, we believe Energy Fuels’ White Mesa Mill in Utah will house one of the largest NdPr production circuits in the world, excluding China. We also expect to begin piloting ‘heavy’ REE separation later this year, which will provide valuable knowledge for designing and building our Phase 3 Dy, Tb and potentially other REE separation circuits.
“Monazite supply is of course critical to Energy Fuels’ rare earth plans. We continue to advance discussions with several existing monazite suppliers around the world. And, we completed the acquisition of the Bahia Project in Brazil, which will allow us to control our own low-cost REE supply. The Bahia Project has the potential to produce between 3,000 to 10,000 MT of monazite, containing 300 to 1,000 MT of NdPr oxide, per year. We are currently in the midst of a sonic drilling program on the property to confirm and better define the REE (monazite), titanium (ilmenite, rutile, leucoxene) and zirconium (zircon) resources, which will inform our mine plan and permitting. We hope to commence production in late 2025 or early 2026, and ramp-up from there.
“Finally, we sold a small quantity of our vanadium inventory into recent market strength, which saw spot prices reach $10.80 per pound in February, according to Fastmarkets. Because we produce a high-purity V2O5 product that is attractive to specialty alloy and chemical markets, we were able to execute this sale at a premium to reported prices. Accordingly, our realized sales price was $10.98 per pound of V2O5 on these sales.”
Conference Call and Webcast at 4:00 pm ET on May 9, 2023:
Energy Fuels will be hosting a conference call and webcast on May 9, 2023 at 4:00 pm ET (2:00 pm MT) to discuss its Q1-2023 financial results, the outlook for 2023, and its uranium, rare earths, vanadium, and medical isotopes initiatives.
To instantly join the conference call by phone, please use the following link to easily register your name and phone number. After registering, you will receive a call immediately and be placed into the conference call: RAPIDCONNECT
Alternatively, you may dial in to the conference call by calling 1-888-664-6392, and you will be connected to the call by an Operator.
You may also access viewer-controlled Webcast slides and/or stream the call by following this link: WEBCAST
A replay of the call will be available until May 24, 2023 by calling (888) 390-0541 or (416) 764-8677 and entering the replay code, 680506#.
Selected Summary Financial Information:
Three Months Ended
March 31,
$000’s, except per share data
2023
2022
Results of Operations:
Uranium concentrates revenues
$ 18,470
$ —
Vanadium concentrates revenues
871
2,412
Total revenues
19,613
2,937
Gross margin
11,347
45
Operating loss
(405)
(10,213)
Net income (loss)
114,264
(14,730)
Basic and diluted net income (loss) per common share
0.72
(0.09)
As of
As of
$000’s
March 31, 2023
December 31, 2022
Financial Position:
Working capital
$ 143,611
$ 116,966
Property, plant and equipment, net
14,635
12,662
Mineral properties
113,834
83,539
Current assets
148,914
135,590
Total assets
375,451
273,947
Current liabilities
5,303
18,624
Total liabilities
16,438
29,538
ABOUT ENERGY FUELS
Energy Fuels is a leading US-based critical minerals company. The Company, as the leading producer of uranium in the United States, mines uranium and produces natural uranium concentrates that are sold to major nuclear utilities for the production of carbon-free nuclear energy. Energy Fuels recently began production of advanced rare earth element (“REE“) materials, including mixed REE carbonate, and plans to produce commercial quantities of separated REE oxides in the future. Energy Fuels also produces vanadium from certain of its projects, as market conditions warrant, and is evaluating the recovery of radionuclides needed for emerging cancer treatments. Its corporate offices are in Lakewood, Colorado, near Denver, and substantially all its assets and employees are in the United States. Energy Fuels holds two of America’s key uranium production centers: the White Mesa Mill in Utah and the Nichols Ranch in-situ recovery (“ISR“) Project in Wyoming. The White Mesa Mill is the only conventional uranium mill operating in the US today, has a licensed capacity of over 8 million pounds of U3O8 per year, has the ability to produce vanadium when market conditions warrant, as well as REE products, from various uranium-bearing ores. The Nichols Ranch ISR Project is on standby and has a licensed capacity of 2 million pounds of U3O8 per year. The Company recently acquired the Bahia Project in Brazil, which is believed to have significant quantities of titanium (ilmenite and rutile), zirconium (zircon) and REE (monazite) minerals. In addition to the above production facilities, Energy Fuels also has one of the largest NI 43-101 compliant uranium resource portfolios in the US and several uranium and uranium/vanadium mining projects on standby and in various stages of permitting and development. The primary trading market for Energy Fuels’ common shares is the NYSE American under the trading symbol “UUUU,” and the Company’s common shares are also listed on the Toronto Stock Exchange under the trading symbol “EFR.” Energy Fuels’ website is www.energyfuels.com.
Daniel Kapostasy, P.G., Director of Technical Services for Energy Fuels, is a Qualified Person as defined by Canadian National Instrument 43-101 and has reviewed and approved the technical disclosure contained in this news release, including sampling, analytical, and test data underlying such disclosure.
The data collected and provided in this disclosure related to the Bahia Project is derived entirely from the exploration reports for each of the seventeen mineral process areas. Mr. Kapostasy has reviewed these reports in detail and discussed the methods used with the project geologist in charge of field and laboratory activities for the previous owners who is also currently an employee of Energy Fuels Brazil, Ltda. Heavy mineral concentrations were derived for every meter drilled using heavy liquid separations, a standard method of heavy mineral determination.
To determine the concentration of the various heavy minerals in a sample, the heavy fraction was separated from the silica sand by using heavy liquid separation. The heavy fraction was then mounted in epoxy or dispersed on slide glass and viewed under a microscope. A geologist can then identify the various minerals and determine the concentration of each mineral through a process called point counting, whereby the geologist identifies each sand grain individually, tallies the number of each mineral and then divides by the total.
Verification of the heavy mineral concentration was started by the Company in September 2022, when it hired a contract driller to collect samples using a sonic rig. While no laboratory analyses have been received to date, visual estimation of the heavy mineral quantity indicates that the historical values seen at the various process areas are valid.
Cautionary Note Regarding Forward-Looking Statements: This news release contains certain “Forward Looking Information” and “Forward Looking Statements” within the meaning of applicable United States and Canadian securities legislation, which may include, but are not limited to, statements with respect to: production and sales forecasts; costs of production; any expectation that the Company will be awarded any future sales under the U.S. Uranium Reserve; scalability, and the Company’s ability and readiness to re-start, expand or deploy any of its existing projects or capacity to respond to any improvements in uranium market conditions or in response to the Uranium Reserve; any expectation as to future uranium, vanadium, RE Carbonate, REE oxide, or REE market fundamentals or sales; any expectation as to recommencement of production at any of the Company’s uranium mines or the timing thereof; any expectation regarding any remaining dissolved vanadium in the Mill’s tailings facility solutions or the ability of the Company to recover any such vanadium at acceptable costs or at all; any expectation as to longer term fundamentals in the market and price projections; any expectation that the Company will maintain its position as a leading U.S.-based critical minerals company or as the leading producer of uranium in the U.S.; any expectation with respect to timelines to production; any expectation that the sale of the Alta Mesa project and the use of the proceeds from that sale will not result in any dilution to shareholders; any expectation that the Mill will be successful in producing RE Carbonate on a full-scale commercial basis; any expectation that Energy Fuels will be successful in developing U.S. separation, or other value-added U.S. REE production capabilities at the Mill, or otherwise, including the timing of any such initiatives and the expected production capacity or capital and operating costs associated with any such production capabilities; any expectation with respect to the quantities of monazite to be acquired by Energy Fuels, the quantities of RE Carbonate or REE oxides to be produced by the Mill or the quantities of contained TREO in the Mill’s RE Carbonate; any expectation that the Company may sell its separated NdPr oxide to electric vehicle manufacturers; any expectation that the Bahia Project has the potential to feed the Mill with REE and uranium-bearing monazite sand for decades or at all; any expectation that the Company will complete comprehensive sonic drilling and geophysical mapping at the Bahia Project or complete an Initial Assessment under SK-1300 (U.S.) and a Technical Report Technical Report under NI 43-101 (Canada) during 2023, or otherwise; any expectation that the Company’s evaluation of radioisotope recovery at the Mill will be successful; any expectation that the potential recovery of medical isotopes from any radioisotopes recovered at the Mill will be feasible; any expectation that any radioisotopes can be recovered at the Mill will be sold on a commercial basis; any expectation as to the quantities to be delivered under existing uranium sales contracts; and any expectation that the Company will be successful in completing any additional contracts for the sale of uranium to U.S. utilities on commercially reasonable terms or at all. Generally, these forward-looking statements can be identified by the use of forward-looking terminology such as “plans,” “expects,” “does not expect,” “is expected,” “is likely,” “budgets,” “scheduled,” “estimates,” “forecasts,” “intends,” “anticipates,” “does not anticipate,” or “believes,” or variations of such words and phrases, or state that certain actions, events or results “may,” “could,” “would,” “might” or “will be taken,” “occur,” “be achieved” or “have the potential to.” All statements, other than statements of historical fact, herein are considered to be forward-looking statements. Forward-looking statements involve known and unknown risks, uncertainties and other factors which may cause the actual results, performance or achievements of the Company to be materially different from any future results, performance or achievements express or implied by the forward-looking statements. Factors that could cause actual results to differ materially from those anticipated in these forward-looking statements include risks associated with: commodity prices and price fluctuations; engineering, construction, processing and mining difficulties, upsets and delays; permitting and licensing requirements and delays; changes to regulatory requirements; legal challenges; the availability of sources of Alternate Feed Materials and other feed sources for the Mill; competition from other producers; public opinion; government and political actions; available supplies of monazite; the ability of the Mill to produce RE Carbonate, REE oxides or other REE products to meet commercial specifications on a commercial scale at acceptable costs or at all; market factors, including future demand for REEs; the ability of the Mill to be able to separate radium or other radioisotopes at reasonable costs or at all; market prices and demand for medical isotopes; and the other factors described under the caption “Risk Factors” in the Company’s most recently filed Annual Report on Form 10-K, which is available for review on EDGAR at www.sec.gov/edgar.shtml, on SEDAR at www.sedar.com, and on the Company’s website at www.energyfuels.com. Forward-looking statements contained herein are made as of the date of this news release, and the Company disclaims, other than as required by law, any obligation to update any forward-looking statements whether as a result of new information, results, future events, circumstances, or if management’s estimates or opinions should change, or otherwise. There can be no assurance that forward-looking statements will prove to be accurate, as actual results and future events could differ materially from those anticipated in such statements. Accordingly, the reader is cautioned not to place undue reliance on forward-looking statements. The Company assumes no obligation to update the information in this communication, except as otherwise required by law.
SOURCE Energy Fuels Inc.
For further information: Investor Inquiries: Energy Fuels Inc., Curtis Moore, SVP – Marketing and Corporate Development, (303) 974-2140 or Toll free: (888) 864-2125, investorinfo@energyfuels.com, www.energyfuels.com
CALGARY, AB, May 4, 2023 /CNW/ – Alvopetro Energy Ltd. (TSXV: ALV) (OTCQX: ALVOF) announces April 2023 average sales volumes and an operational update and timing for release of our Q1 2023 results and earnings call.
April 2023 Sales Volumes
April sales volumes averaged 1,972 boepd, including natural gas sales of 11.3 MMcfpd and associated natural gas liquids sales from condensate of 84 bopd, based on field estimates. Sales volumes in April declined from our average Q1 2023 of 2,767 boepd. April sales volumes were lower due to reduced demand during the month from Bahiagás as well as higher nominated volumes from our partner at the Caburé unit. We anticipate May sales volumes to continue at rates similar to average volumes in April. Future sales volumes will be dependent on available Caburé unit production, production additions from our Murucututu field with the development work planned this year and overall demand from Bahiagás.
Operational Update
In March, we commenced stimulation operations at our 197(1) well on our Murucututu natural gas field. While operations have progressed slower than initially scheduled, we have now successfully stimulated three of four planned intervals at the well, injecting a total of 89 tonnes of sand into the formation. Stimulation of the final interval is expected to be completed shortly and we expect the well to be on production this month. Following completion of stimulation operations, we plan to drill two Murucututu fit-for-purpose development wells in the second half of 2023.
On our Bom Lugar field, we spud our first development well (BL-06) on April 30th and drilling is underway. The BL-06 well is targeting the Caruaçu Formation with additional potential in the deeper Gomo and Agua Grande Formations. We expect drilling to be completed late in the second quarter.
Upcoming Q1 2023 Results and Live Webcast
Alvopetro anticipates announcing first quarter 2023 results on May 10, 2023, after markets close, and will host a live webcast to discuss the results at 8:00 am Mountain time, on May 11, 2023. Details for joining the event are as follows:
The webcast will include a question and answer period. Online participants will be able to ask questions through the Zoom portal. Dial-in participants can email questions directly to socialmedia@alvopetro.com.
Alvopetro Energy Ltd.’svision is to become a leading independent upstream and midstream operator in Brazil. Our strategy is to unlock the on-shore natural gas potential in the state of Bahia in Brazil, building off the development of our Caburé natural gas field and our strategic midstream infrastructure.
Neither the TSX Venture Exchange nor its Regulation Services Provider (as that term is defined in the policies of the TSX Venture Exchange) accepts responsibility for the adequacy or accuracy of this news release.
All amounts contained in this new release are in United States dollars, unless otherwise stated and all tabular amounts are in thousands of United States dollars, except as otherwise noted.
Abbreviations:
bbls
=
barrels
boepd
=
barrels of oil equivalent (“boe”) per day
bopd
=
barrels of oil and/or natural gas liquids (condensate) per day
MMcf
=
million cubic feet
MMcfpd
=
million cubic feet per day
Q1 2023
=
three months ended March 31, 2023
BOE Disclosure. The term barrels of oil equivalent (“boe”) may be misleading, particularly if used in isolation. A boe conversion ratio of six thousand cubic feet per barrel (6Mcf/bbl) of natural gas to barrels of oil equivalence is based on an energy equivalency conversion method primarily applicable at the burner tip and does not represent a value equivalency at the wellhead. All boe conversions in this news release are derived from converting gas to oil in the ratio mix of six thousand cubic feet of gas to one barrel of oil.
Forward-Looking Statements and Cautionary Language. This news release contains “forward-looking information” within the meaning of applicable securities laws. The use of any of the words “will”, “expect”, “intend” and other similar words or expressions are intended to identify forward-looking information. Forward–looking statements involve significant risks and uncertainties, should not be read as guarantees of future performance or results, and will not necessarily be accurate indications of whether or not such results will be achieved. A number of factors could cause actual results to vary significantly from the expectations discussed in the forward-looking statements. These forward-looking statements reflect current assumptions and expectations regarding future events. Accordingly, when relying on forward-looking statements to make decisions, Alvopetro cautions readers not to place undue reliance on these statements, as forward-looking statements involve significant risks and uncertainties. More particularly and without limitation, this news release contains forward-looking information concerning the anticipated timing of completion of the 197(1) stimulation and drilling of the BL-06 well, anticipated timing of production commencement from the 197(1) well, expected natural gas allocations from the Caburé unit, natural gas sales and gas deliveries under the Company’s long-term gas sales agreement, plans relating to the Company’s operational activities, proposed exploration development activities and the timing for such activities and exploration and development prospects of Alvopetro. The forward–looking statements are based on certain key expectations and assumptions made by Alvopetro, including but not limited to expectations and assumptions concerning the performance of producing wells and reservoirs, foreign exchange rates, well development and operating performance, the timing of regulatory licenses and approvals, equipment availability, the success of future drilling, completion, testing, recompletion and development activities, expectations regarding Alvopetro’s working interest and the outcome of any redeterminations, environmental regulation, including regulation relating to hydraulic fracturing and stimulation, the ability to monetize hydrocarbons discovered, the outlook for commodity markets and ability to access capital markets, general economic and business conditions, the impact of the COVID-19 pandemic, weather and access to drilling locations, the availability and cost of labour and services, the regulatory and legal environment and other risks associated with oil and gas operations. The reader is cautioned that assumptions used in the preparation of such information, although considered reasonable at the time of preparation, may prove to be incorrect. Actual results achieved during the forecast period will vary from the information provided herein as a result of numerous known and unknown risks and uncertainties and other factors. Although Alvopetro believes that the expectations and assumptions on which such forward-looking information is based are reasonable, undue reliance should not be placed on the forward-looking information because Alvopetro can give no assurance that it will prove to be correct. Readers are cautioned that the foregoing list of factors is not exhaustive. Additional information on factors that could affect the operations or financial results of Alvopetro are included in our annual information form which may be accessed on Alvopetro’s SEDAR profile at www.sedar.com. The forward-looking information contained in this news release is made as of the date hereof and Alvopetro undertakes no obligation to update publicly or revise any forward-looking information, whether as a result of new information, future events or otherwise, unless so required by applicable securities laws.
Largo has a long and successful history as one of the world’s preferred vanadium companies through the supply of its VPURE™ and VPURE+™ products, which are sourced from one of the world’s highest-grade vanadium deposits at the Company’s Maracás Menchen Mine in Brazil. Aiming to enhance value creation at Largo, the Company is in the process of implementing a titanium dioxide pigment plant using feedstock sourced from its existing operations in addition to advancing its U.S.-based clean energy division with its VCHARGE vanadium batteries. Largo’s VCHARGE vanadium batteries contain a variety of innovations, enabling an efficient, safe and ESG-aligned long duration solution that is fully recyclable at the end of its 25+ year lifespan. Producing some of the world’s highest quality vanadium, Largo’s strategic business plan is based on two pillars: 1.) leading vanadium supplier with an outlined growth plan and 2.) U.S.-based energy storage business support a low carbon future.
Michael Heim, Senior Vice President, Equity Research Analyst, Energy & Transportation, Noble Capital Markets, Inc.
Refer to the full report for the price target, fundamental analysis, and rating.
Largo, Inc. will release 2023-1Q financial results on May 10th and hold a conference call to discuss results on May 11th. The company has previously (4/18/23) disclosed quarterly V2O5 production of 2,111 tonnes and sales of 2,849 tonnes. Sales were significantly above previous guidance of 2,300-2,500 tonnes. Consequently, we expect result to show improvement over the first quarter of last year when Largo sold 2,232 tonnes. We would note that 2023-1Q sales include 245 tonnes of purchased material, which we assume was done at a higher cost than produced V2O5.
Management’s guidance for the second quarter shows a build back of inventory. Management projects 2023-2Q production of 3,000-3,200 tonnes and sales of 2,300-2,500 tonnes. The reduction in sales and increase in production versus the first quarter could mean second quarter results will be below that reported in the first quarter. Importantly, some cost incurred during any quarter’s production may carry over into the next quarter when sales are completed. This will partially offset the impact of rising production and falling sales.
Equity Research is available at no cost to Registered users of Channelchek. Not a Member? Click ‘Join’ to join the Channelchek Community. There is no cost to register, and we never collect credit card information.
This Company Sponsored Research is provided by Noble Capital Markets, Inc., a FINRA and S.E.C. registered broker-dealer (B/D).
*Analyst certification and important disclosures included in the full report. NOTE: investment decisions should not be based upon the content of this research summary. Proper due diligence is required before making any investment decision.


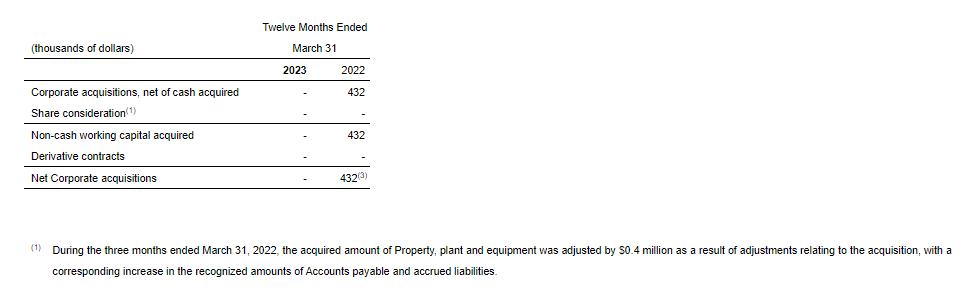

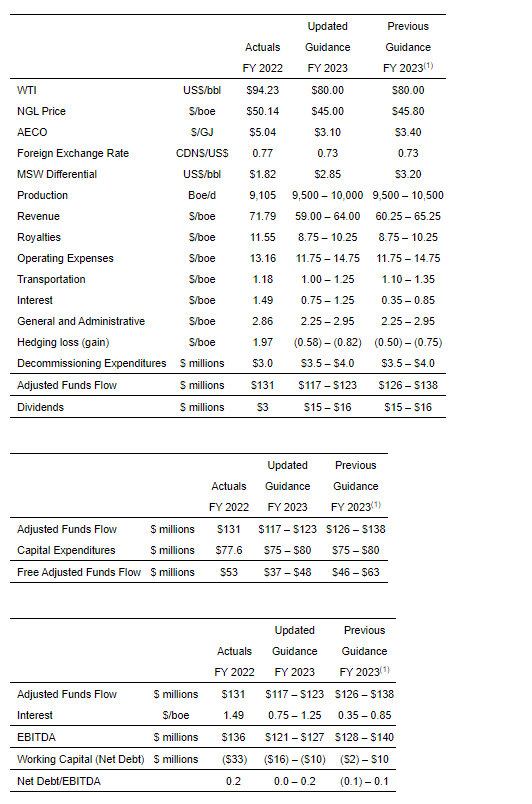
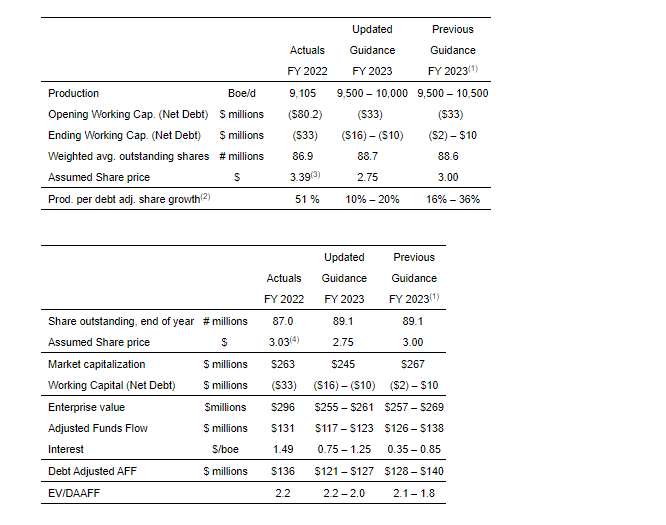
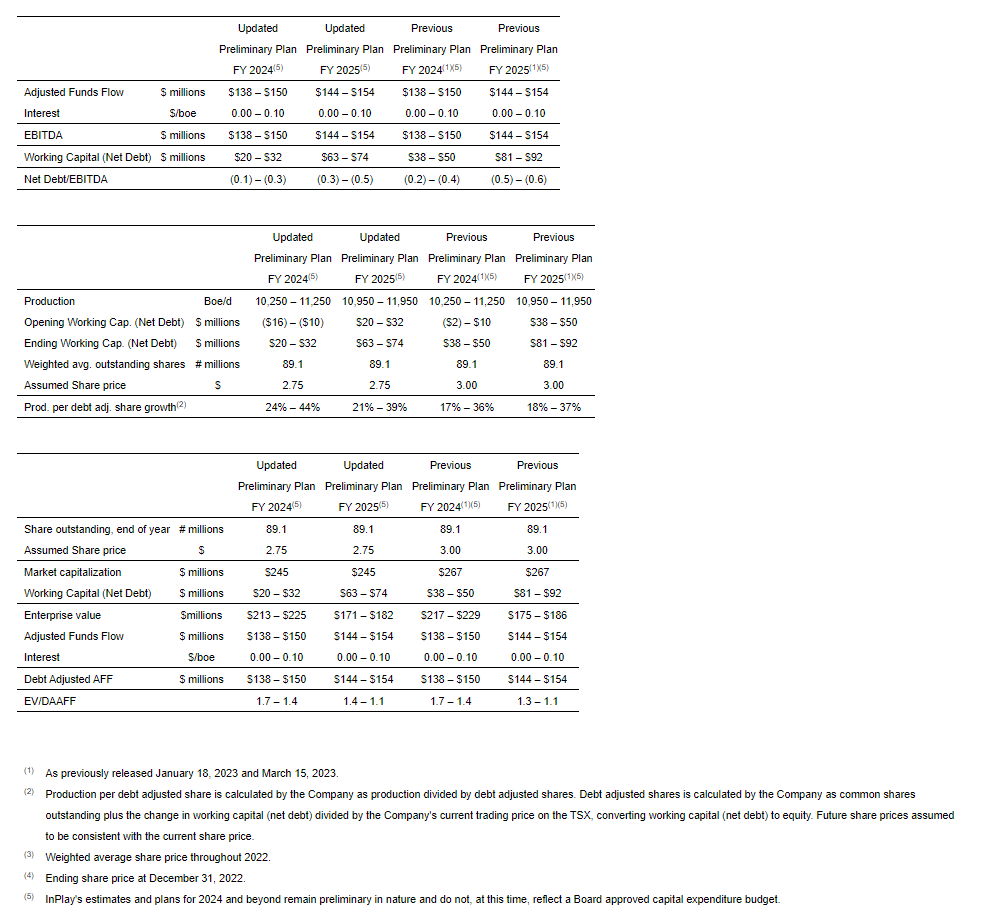
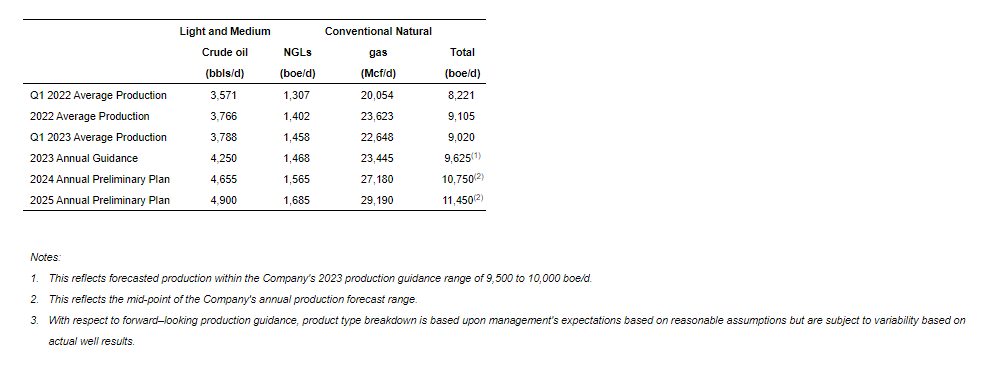


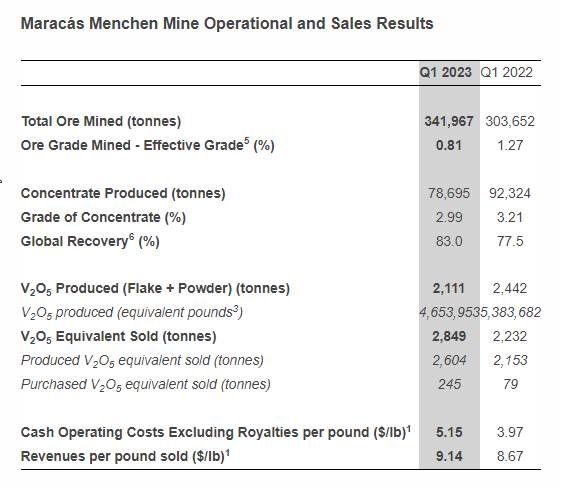
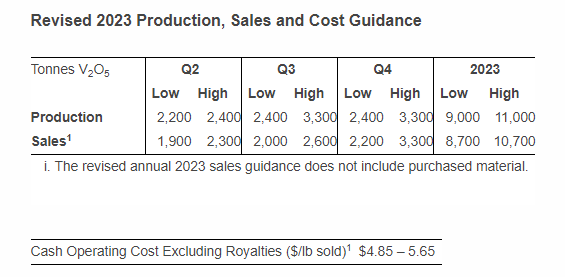


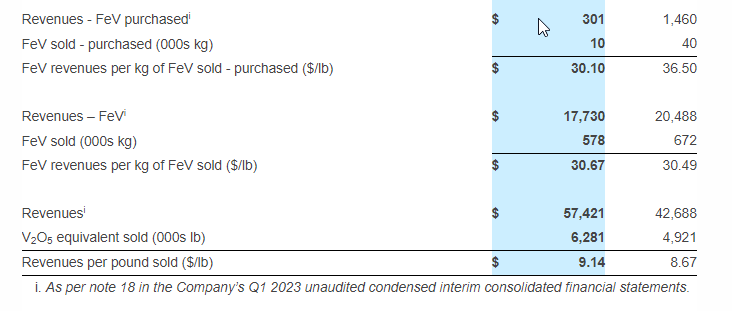


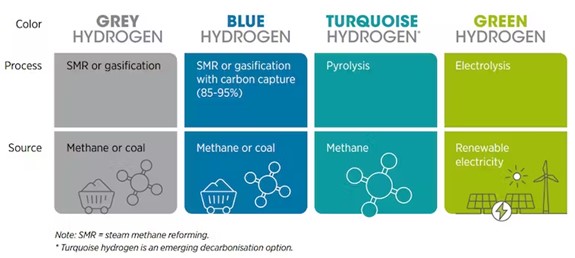
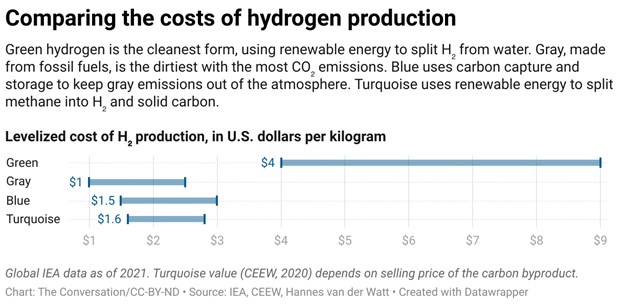

