If Cryptocurrency is not the Safe Haven it was Expected to Be, Will Assets Move Into Gold Investments?
In addition to any information discovered from Michael Burry’s 13F filing earlier this week, he’s been coming out in support of gold. He seems to expect that those that were seeking a “safe harbor investment” in various crypto-related investments are now having a change of mind. Despite his long positions held on September 30 and made public on November 14, he has teased that he could be extremely short the market; presumably, this could include any tradeable asset when you’re an investment analyst of this caliber.
Will Investors Rediscover Gold?
“Long thought that the time for gold would be when crypto scandals merge into contagion,” Burry wrote in a tweet this week.
@michaeljburry
The financial pressures spreading across the crypto industry that have helped destroy the crypto exchange FTX and exposed characters like Sam Bankman-Fried that may have been given too much trust, are causing reduced trust in digital assets.
Supporters and believers in the benefit of crypto had been using bitcoin and other tokens as a means of storage outside of securities. Their expectation has been that crypto is superior as a store of value during periods of inflation, currency depreciation, and economic turmoil.
Crypto prices have not offered much protection against plunging stock, bond, and real estate values. In fact, relative to the strong US dollar, crypto’s value has fallen off a cliff, offering no protection. The overall outstanding crypto worth has gone from $2.2 trillion to around $830 billion. Gold has not been rising during this period, but relative to US dollars, it is down only 3%.
Burry’s likely message is that the escalating cryptocurrency negatives will reduce demand for coins, yet demand for a safe haven asset would not be reduced. This could make gold again one of the only games in town for investors looking to protect against asset erosion.
Is Burry Short?
“You have no idea how short I am,” Burry said in a tweet this week.
@michaeljburry
He does not say he is short at all in this tweet. However, against the backdrop of many previous tweets warning against a market he believes will become more bearish, coupled with a holding report released that has five long holdings, the hedge fund manager of The Big Short fame is likely warning investors not to read too much positive into his fund’s holdings report. That report was released just before the tweet.
The value of long securities held in his roughly $292 million AUM was $41 million. As he demonstrated during the financial crisis, there are non-publicly reported ways to be short, even short beyond your AUM. Fund managers with assets over $100 million only have to disclose US-listed stocks in their 13F filings with the SEC each quarter. Excluded in the reporting are shares sold short, overseas-listed stocks, and other assets such as commodities.
In actuality, Burry’s increased positions in prison stocks and exposure to the company involved in making Artemis’ rocket boosters is more likely a sign that he likes the prospects of some companies while at the same time doesn’t like the broader market outlook.
Positive Tweets
In addition to his positive tweet on gold, Burry has suggested the Federal Reserve’s interest-rate hikes, which have weighed on market prices, could end in the spring. This was reflected in his October 24 tweet “Still think the Fed back off on QT early next year.”
Investing in Gold
Investors that look to gain exposure to gold, will typically buy gold bullion, gold funds, gold futures, and the stocks of gold mining companies. All have unique advantages. Investors looking to research junior miners of gold and other precious metals and natural resources, find Channelchek as an excellent resource to discover and research many different unique, actionable possibilities. Start here.
The health of the US Treasury market impacts almost all other markets. This is because the “risk-free” market (US Treasuries) and its relationship to the US dollar is the foundation from which other markets stand. If it is in trouble, all markets suffer. The “health” measure most associated with securities like treasuries is liquidity or whether money can be raised when needed. Other measures include market spread between the bid and the ask, trading activity levels, and price impact or how a large transaction impacts the price.
A just released report by New York Fed economists Michael Fleming and Claire Nelson discuss the current state of the U.S. Treasury markets from the unique point of view and access to information of the New York Fed.
The report follows:
How Liquid Has the Treasury Market Been in 2022?
Policymakers and market participants are closely watching liquidity conditions in the U.S. Treasury securities market. Such conditions matter because liquidity is crucial to the many important uses of Treasury securities in financial markets. But just how liquid has the market been and how unusual is the liquidity given the higher-than-usual volatility? In this post, we assess the recent evolution of Treasury market liquidity and its relationship with price volatility and find that while the market has been less liquid in 2022, it has not been unusually illiquid after accounting for the high level of volatility.
Why Liquidity Matters
The U.S. Treasury securities market is the largest and most liquid government securities market in the world. Treasury securities are used to finance the U.S. government, to manage interest rate risk, as a risk-free benchmark for pricing other financial instruments, and by the Federal Reserve in implementing monetary policy. Having a liquid market is important for all these purposes and thus of great interest to market participants and policymakers alike.
Measuring Liquidity
Liquidity typically refers to the cost of quickly converting an asset into cash (or vice versa) and is measured in a variety of ways. We consider three commonly used measures, calculated using high-frequency data from the interdealer market: bid-ask spreads, order book depth, and price impact. The measures are for the most recently auctioned
(on-the-run) two-, five-, and ten-year notes (the three most actively traded Treasury securities, as shown in this post) and are calculated for New York trading hours (defined as 7 a.m. to 5 p.m.). Our data source is BrokerTec, which is estimated to account for 80 percent of trading in the electronic interdealer broker market.
The Market Has Been Relatively Illiquid in 2022
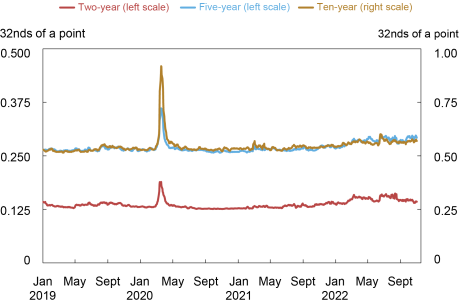
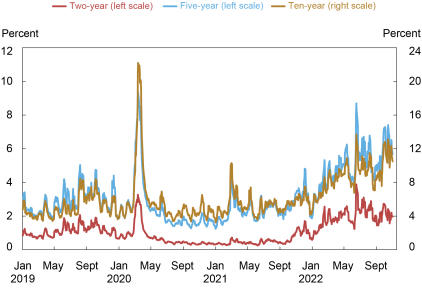
The bid-ask spread—the difference between the lowest ask price and the highest bid price for a security—is one of the most popular liquidity measures. As shown in the chart below, bid-ask spreads have widened out in 2022, but have remained well below the levels observed during the COVID-related disruptions of March 2020 (examined in this post). The widening has been somewhat greater for the two-year note relative to its average and relative to its level in March 2020.
Bid-Ask Spreads Have Widened Modestly
Liberty Street Economics chart plots the five-day moving averages of average daily bid-ask spreads for the two-, five-, and ten-year notes in the interdealer market from January 2, 2019, to October 31, 2022.
Source: Authors’ calculations, based on data from BrokerTec.
Notes: The chart plots five-day moving averages of average daily bid-ask spreads for the on-the-run two-, five-, and ten-year notes in the interdealer market from January 2, 2019, to October 31, 2022. Spreads are measured in 32nds of a point, where a point equals one percent of par.
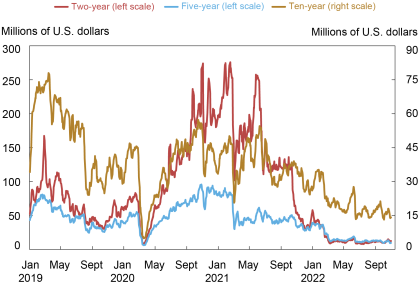
The next chart plots order book depth, measured as the average quantity of securities available for sale or purchase at the best bid and offer prices. Depth levels again point to relatively poor liquidity in 2022, but with the differences across securities more striking. Depth in the two-year note has been at levels commensurate with those of March 2020, whereas depth in the five-year note has remained somewhat higher—and depth in the ten-year note appreciably higher—than the levels of March 2020.
Order Book Depth Lowest since March 2020
Liberty Street Economics chart plots five-day moving averages of average daily depth for the two-, five-, and ten-year notes in the interdealer market from January 2, 2019, to October 31, 2022.
Source: Authors’ calculations, based on data from BrokerTec.
Notes: The chart plots five-day moving averages of average daily depth for the on-the-run two-, five-, and ten-year notes in the interdealer market from January 2, 2019, to October 31, 2022. Data are for order book depth at the inside tier, averaged across the bid and offer sides. Depth is measured in millions of U.S. dollars par.
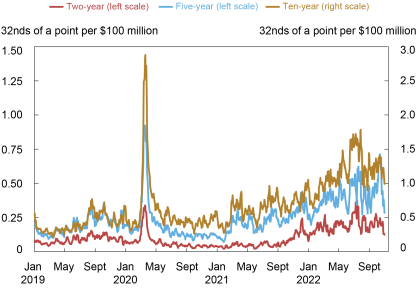
Measures of the price impact of trades also suggest a notable deterioration of liquidity. The next chart plots the estimated price impact per $100 million in net order flow (that is, buyer-initiated trading volume less seller-initiated trading volume). A higher price impact suggests reduced liquidity. Price impact has been high this year, and again more notably so for the two-year note relative to the March 2020 episode. That said, price impact looks to have peaked in late June and July, and to have declined most recently (in October).
Price Impact Highest since March 2020
Liberty Street Economics chart plots the estimated price impact per $100 million in net order flow for the two-, five-, and ten-year notes in the interdealer market from January 2, 2019, to October 31, 2022.Source: Authors’ calculations, based on data from BrokerTec.
Notes: The chart plots five-day moving averages of slope coefficients from daily regressions of one-minute price changes on one-minute net order flow (buyer-initiated trading volume less seller-initiated trading volume) for the on-the-run two-, five-, and ten-year notes in the interdealer market from January 2, 2019, to October 31, 2022. Price impact is measured in 32nds of a point per $100 million, where a point equals one percent of par.
Note that we start our analysis of liquidity in this post in 2019 and not earlier. One reason is to highlight the developments in 2022. Another reason is that the minimum price increment for the two-year note was halved in late 2018, creating a break in the note’s bid-ask spread and depth series. Longer time series of bid-ask spreads, order book depth, and price impact are plotted in this post and this paper. The longer history indicates that the price impact in the two-year note is currently at levels comparable to those seen during the 2007-09 global financial crisis, as well as in March 2020.
Volatility Has Also Been High
Pandemic-induced supply disruptions, high inflation, policy uncertainty, and geopolitical conflict have led to a sizable increase in uncertainty about the expected path of interest rates, resulting in high price volatility in 2022, as shown in the next chart. As with liquidity, volatility has been especially high lately for the two-year note relative to its history, likely reflecting the importance of near-term monetary policy uncertainty in explaining the current episode. Volatility has caused market makers to widen their bid-ask spreads and post less depth at any given price (to manage the increased risk of taking on positions), and for the price impact of trades to increase, illustrating the well-known negative relationship between volatility and liquidity.
Price Volatility Highest Since March 2020
Liberty Street Economics chart plots five-day moving averages of price volatility for the two-, five-, and ten-year notes in the interdealer market from January 2, 2019, to October 31, 2022.
Source: Authors’ calculations, based on data from BrokerTec.
Notes: The chart plots five-day moving averages of price volatility for the on-the-run two-, five-, and ten-year notes in the interdealer market from January 2, 2019, to October 31, 2022. Price volatility is calculated for each day by summing squared one-minute returns (log changes in midpoint prices) from 7 a.m. to 5 p.m., annualizing by multiplying by 252, and then taking the square root. It is reported in percent.
Liquidity Has Tracked Volatility
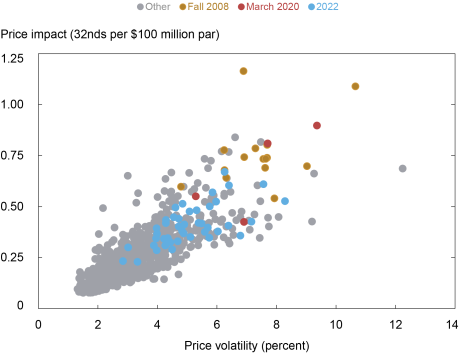
To assess whether liquidity has been unusual given the level of volatility, we provide a scatter plot of price impact against volatility for the five-year note in the chart below. The chart shows that the 2022 observations (in blue) fall in line with the historical relationship. That is, the current level of liquidity is consistent with the current level of volatility, as implied by the historical relationship between these two variables. This is true for the ten-year note as well, whereas for the two-year note the evidence points to somewhat higher-than-expected price impact given the volatility in 2022 (as also occurred in fall 2008 and March 2020).
Liquidity and Volatility in Line with Historical Relationship
Liberty Street Economics chart plots price impact against price volatility by week for the five-year note from January 2, 2005, to October 28, 2022.
Source: Authors’ calculations, based on data from BrokerTec.
Notes: The chart plots price impact against price volatility by week for the on-the-run five-year note from January 2, 2005, to October 28, 2022. The weekly measures for both series are averages of the daily measures plotted in the preceding two charts. Fall 2008 points are for September 21, 2008 – January 3, 2009, March 2020 points are for March 1, 2020 – March 28, 2020, and 2022 points are for January 2, 2022 – October 29, 2022.
The preceding analysis is based on realized price volatility—that is, on how much prices are actually changing. We repeated the analysis with implied (or expected) price volatility, as measured by the ICE BofAML MOVE Index, and found similar results for 2022. That is, liquidity for the five- and ten-year notes is in line with the historical relationship between liquidity and expected volatility, whereas liquidity is somewhat worse for the two-year note.
Note also that while liquidity may not be especially high relative to volatility, one might then ask whether volatility itself is unusually high. Answering this question is beyond our scope here, although we will note that there are good reasons for volatility to be high, as discussed above.
Trading Volume Has Been High
Despite the high volatility and illiquidity, trading volume has held up this year. High trading volume amid high illiquidity is common in the Treasury market, and was also observed during the market disruptions around the near-failure of Long-Term Capital Management (see this paper), during the 2007-09 financial crisis (see this paper), during the October 15, 2014, flash rally (see this post), and during the COVID-19-related disruptions of March 2020 (see this post). Periods of high uncertainty are associated with high volatility and illiquidity but also high trading demand.
Nothing to Be Concerned About?
Not exactly. While Treasury market liquidity has been in line with volatility, there are still reasons to be cautious. The market’s capacity to smoothly handle large flows has been of ongoing concern since March 2020, as discussed in this paper, as Treasury debt outstanding continues to grow. Moreover, lower-than-usual liquidity implies that a liquidity shock will have larger-than-usual effects on prices and perhaps be more likely to precipitate a negative feedback loop between security sales, volatility, and illiquidity. Close monitoring of Treasury market liquidity—and continued efforts to improve the market’s resilience—remain important.
Rising Unemployment: Economists Sometimes Say it’s Good for the Economy, But Are They Right?
interest rates are up, which means that projections for growth are down. Put simply, the proverbial something is close to hitting the fan.
Business closures and job losses are likely to become another hurdle for the global economy – and that points to rising unemployment. Yet, while most people would think of rising unemployment as a bad thing, some economists don’t entirely agree.
Economists have long pointed to a counterintuitive positive relationship between unemployment and entrepreneurship, born of the fact that people who lose their job often start businesses. This is often referred to within economic literature as necessity-based or push-factor entrepreneurship.
This article was republished with permission from The Conversation, a news site dedicated to sharing ideas from academic experts. It represents the research-based findings and thoughts ofDaragh O’Leary, PhD Researcher in Economics, University College Cork
Where it Gets Tricky
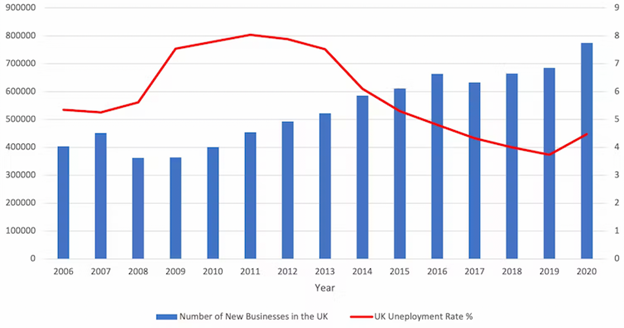
There is certainly good evidence for the existence of this contradictory relationship. The graph below shows the rates of UK business creation in blue and unemployment in red. As you can see, unemployment started to increase during the global financial crisis of 2007-09 and business creation followed not long after.
UK new business creation and unemployment, 2006-2020
This relationship between business creation and unemployment has previously been used by some as a justification for cold social policies towards the unemployed on the rationale that “the market fixes itself” in the long run. They see business closures and job losses not as human miseries that require government help, but necessary evils that are needed to reallocate the money, people and other resources back into the economy in more efficient ways .
But my latest research has found that rising unemployment is not quite the silver bullet for reigniting the economic engine that it’s cracked up to be. I looked at 148 regions across Europe from 2008 to 2017. Although I did find evidence that unemployment can stimulate business creation over time, this only seems to happen in higher performing regions within higher performing economies such as the Netherlands, Finland and Austria.
In lower performing regions within lower performing economies such as Bulgaria, Romania and Hungary, the relationship between unemployment and business creation actually appears to be negative. In other words, rather than inducing business creation, unemployment simply seems to lead to more unemployment.
The reason why higher performing regions in wealthier areas have a positive relationship between job losses and business creation is that they enjoy what are known as “urbanisation economies”. These are positive benefits derived from the scale and density of economic activity occurring within that area, including wider arrays of services, greater pools of customers and greater numbers of transactions relative to other areas of the economy.
For example, a firm located in a capital city like London will benefit from more abundant access to consumers, suppliers and lenders as well as larger labour pools. The higher population density in these areas also makes it more likely that firms and workers will learn faster as they observe the activities of their many neighbours. In more peripheral areas with fewer of these characteristics, the opposite is true. This is why unemployment affects different places differently.
What it Means
One consequence is that economists need to stop explaining how economies perform differently based solely on national factors. And it’s not just unemployment where this becomes apparent. For example, Ireland’s longstanding low rate of corporation tax (12.5%) has been cited as a reason for its high foreign direct investment, which accounts for roughly 20% of private sector employment.
Yet while just over 43% of all Irish enterprises in 2020 were located in either Dublin or Cork, counties like Leitrim in the north accounted for fewer than 1% of enterprises. So while national measures can help induce entrepreneurship and increase the overall size of the pie, the pie is shared very unequally. Just as rising unemployment can benefit some areas while hindering others, the same is true of government interventions.
Rural areas like County Leitrim have benefited far less from Ireland’s low corporation tax than more urbanised regions further south. Julia Gavin/Alamy
We therefore need to stop viewing the free market and government intervention as either wrong or right. In some contexts one is going to be more helpful, while in other contexts it will be the opposite. Recognizing this reality would improve on much of the polarized debate in politics and economics, in which those on the right can come across as cold and ignorant, while those on the left can seem self-righteous and sanctimonious, viewing capitalism and markets as dirty words.
How does this apply to today’s gathering downturn? It would make sense for governments to prioritize supporting businesses in more peripheral regions, while leaving those in wealthier urban areas to fend for themselves.
The famous economist John Kenneth Galbraith gave what I believe to be one of the best pieces of commentary on this topic, saying:
Where the market works, I’m for that. Where government is necessary, I’m for that … I’m in favor of whatever works in the particular case.
If we are to survive this upcoming recession and get things going again, we are going to need to acknowledge that centralized “one-size-fits-all” policies won’t be useful everywhere. The solutions to economic recovery are in some cases government intervention and in others the free market, but not always one or the other.
There is Potential for a Change in Sentiment Spurred by this Week’s Wholesale Inflation Report
One economic number doesn’t make a trend. The members of the Federal Open Market Committee know this, and certainly, the Chair, Jay Powell, understands. As it relates to last week’s CPI report, he may wish that one lower-than-expected inflation data point could prevent him from needing to do more, but it simply isn’t enough info from which the Fed can glean any actionable information.
As we head into the first trading session of a new week, it’s uncertain what the reaction of interest rates will be. They dropped substantially in response to last Thursday’s inflation data coming in better than expected. However, there was no chance of follow-through or reversal as Friday’s Veteran’s Day holiday left the bond markets closed.
With this, inflation numbers continue to be the most significant for both stock and bond investors. On this coming Tuesday, November 15, wholesale prices will be reported as the Producer Price Index (PPI). This release could have more weight in trade action than usual.
Thursday is another big day on the calendar as the markets will be grappling with a larger-than-normal volume of economic releases.
Monday 11/14
11:00 AM ET, The NY Federal Reserve Bank’s one and five-year inflation forecast. This is not an event that is usually paid much attention to by market participants. However, considering there are many parties interested in what members of the Federal Reserve System are now thinking, a dramatic shift from the previous forecast could inspire the financial markets to adjust accordingly.
Previously the one-year inflation expectation was 5.7%. The five-year inflation forecast was 2.2%.
Tuesday 10/15
8:30 AM ET, The Producer Price Index (PPI) from the Bureau of Labor Statistics (BLS) is an inflation gauge that measures the average change over time in the prices received by U.S. producers of goods and services. The prices are typically considered input costs for final products and can impact CPI, it may also impact company costs of production and, therefore, profits. The trend has been lower, YOY PPI has been running at 8.5%, and last month, it rose 0.4%, the expectation is for another 0.4% increase.
Michael Burry, and Warren Buffet’s holdings. The SEC requires investment funds to file a 13-f disclosing their publicly traded security positions. It is required every 45 days, making all of the information a minimum of 45 days old. Looking at a successful investor’s 13F filings can be revealing, especially when looking at industries they’ve been hot on or comparing one holding period to another.
Wednesday 10/16
11:00 AM ET, The Mortgage Bankers Association (MBA) creates a statistic from several mortgage loan indexes. The Mortgage Applications index measures applications at mortgage lenders. It’s considered a leading indicator and is especially important for single-family home sales and housing construction. Both are considered foundational in a strong economy. Last week the Purchase Index was 162.6.
11:00 AM ET, The Mortgage Bankers Association (MBA) also provides an average 30-year mortgage level which is consistently calculated so that it is an oranges-to-oranges comparison from previous periods. Last period the rate was 7.14%.
12:30 PM ET, Export Prices (MoM), this data set reflects changes in prices of goods and services that are produced in and exported from the United States in the given month compared to the previous one. Last reading, this came in at a negative 0.8%.
12:30 PM ET, Import Prices (MoM) The import price index m/m measures the price changes of the respective month compared to the previous month. Last month they fell 1.2% (not adjusted for fx), this month, expectations are for a decline of 0.5%.
12:30 PM ET, U.S. Retail Sales have been flat, neither rising nor falling. As we head toward Thanksgiving and Black Friday sales levels, the market will be taking more and more interest in how strong the consumer is. Expectations for October are for a rise of 0.8 percent overall, an increase from 0.0 percent. When excluding vehicles, the projection is for an increase of 0.4%, up from 0.1%. and up 0.4 when also excluding gasoline.
1:15 PM ET, Capacity Utilization is expected to remain unchanged at an 80.3% use of available manufacturing capacity. Reading well above, this may be considered inflationary as production could be using less efficient means.
1:15 PM ET, Industrial Production is expected to have been weaker at a 0.2% increase compared to a 0.4% increase.
2:00 PM ET, NAHB Housing Market Index this is expected to continue weakening, the October number was 38.
2:00 PM ET, Business inventories are expressed in dollar value held by manufacturers, wholesalers, and retailers. The level of inventories in relation to sales is an important indicator of the near-term direction of production activity. Rising inventories can be an indication of business optimism that sales will be growing in the coming months. However, if unintended inventory accumulation occurs, then production will probably have to slow while those inventories are worked off. Last month’s inventories increased by 0.8%.
Thursday 10/17
12:30 PM ET, Housing Starts, last month housing starts had declined for the seventh consecutive month by 8.7%.
Friday 10/18
2:00 PM ET, Leading Economic Indicators are expected to show a decline of 0.3% vs. a decline of 0.4% the prior month.
What Else
The focus on signs of economic weakness or receding inflation will be high, and reactions may be extra sensitive. The following week is shortened in terms of trading. The focus will be on how strong the consumer shows they will be for the holidays.
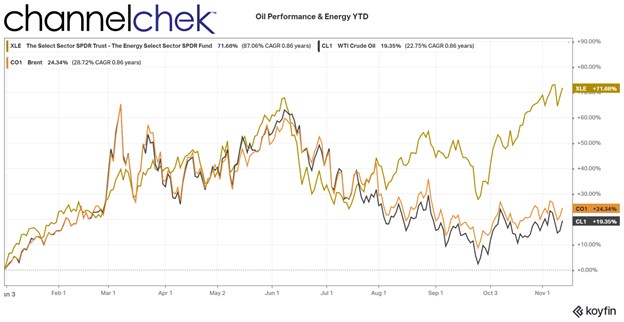
Factors Still Point to Higher Oil Prices and Sizeable Bets on Crude
There are many factors impacting why traditional energy prices and producers may have a hurricane-force tailwind heading into the holidays and next year.
A boost in demand for oil is expected as China just announced that it is lowering its quarantine requirements for visitors from outside the country. But Chinese Covid policies aren’t the only impetus pushing up oil demand – around the globe, there are supply challenges that are playing out. Oil hasn’t risen above $100 a barrel since early Summer, some traders are speculating it will rise above $200 in the coming months. Here’s why.
China
In addition to the announcement that the CPR was cutting the required quarantine period for the country (to five days from seven, with three days of home isolation), the required PCR test hurdle is being lowered as well. And airlines no longer run the risk of being suspended if the travelers they bring in that test positive is five or more.
Europe
The European Union has agreed to stop all oil imports from Russia on Dec. 5. The plan is to cap the prices at which EU nations would buy oil from Russia, that price is expected to be near $60 per barrel. Russia has reacted by increasing exports to Asia, but the price cap is expected to reduce its exports and lower total supply by up to one million barrels per day.
United States
Back in May, the U.S. took the drastic step of increasing available supply by selling oil from the U.S. Strategic Petroleum Reserve at a rate of nearly one million barrels per day starting in May. The increased supply has kept oil prices down. But the sales are unsustainable and expected to be reduced. Congress has allowed another sale of 26 million barrels that are expected to carry through to October 2023. This is a much slower pace of oil releases from the reserves. Plus, the reserves will need to be replenished.
After the Congressionally approved release, the reserve will be down to 348 million barrels, this is half the quantity compared to January of this year —the lowest since 1983. Congress has said that the reserve must stay above 252.4 million barrels, and the incoming Congress is expected to be more conservative when it comes to using these strategic assets to control prices.
Production growth overall in the U.S. has stalled after having increased through most of the year. Government data show that U.S. production dropped to 11.9 million barrels per day last week, this is tied for the lowest level in several months. Supplies of products such as diesel and heating oil in the U.S. are at multiyear lows. So there is not abundant supply should a weather-related or some other fuel-demanding crisis surface.
Oil is now trading between $92 and $93 a barrel. It had reached a high above $130 in March, shortly after the war began, and hasn’t seen the $100 a barrel level since late June.
Trading this week showed significant flows into an options contract that speculates that $200 per barrel may be in store. The most actively traded Brent crude options contract on Thursday was an option to buy Brent at $200 in March 2023. This was the most active oil contract of the day.
How significant is this bullish activity surrounding oil prices? The ratio of bullish to bearish bets in the options market is wider than at any time in recorded history, according to Bloomberg. Oil options traders are positioned more aggressively than ever before.
Take Away
Oil demand could rise soon in China as travel restrictions are lessened. Elsewhere in the world, oil demand is expected to increase as supplies remain the same or decrease. Demand remained elevated globally despite slower economies.
With supply likely to drop and demand ramping up, $200 by the third week in March is one price expectation for a record number of trades transacted at recently. More than doubling in a few months sounds unthinkable, but the massive trades were transacted by experienced institutional traders.
Federal Reserve President Speeches With Elections and CPI to Shape the Week’s Trading
Yes, the stock markets are open on Veterans Day (Friday). But bond trading, which the stock market has been more keenly focused on this year, will be taking the day off along with other U.S. government services. Equity traders can get a sense of interest rate sentiment on Friday by turning to the Chicago Board of Options and viewing tickers ZF=F (5 yr. USTN), ZN=F (10 yr. USTN), ZB=F (30 yr. USTB).
All markets are open on Election Day, and the outcome, as measured by House seats and Senate seats distributed among the major political parties, has the potential to be market-moving.
It’s a quiet week for economic numbers, except for Thursday, when the CPI report is released. This has the potential of changing those calling for a 50 bp hike at the next meeting to up their expectations or those still forecasting 75bp to lower their call. Certainly, the Fed governors will be watching this and all measures of inflation up to the December 14-15 meeting. There are a number of Fed governors speaking this week; this could alter the tone; however, the next meeting is far out into the future.
Election Day.
Monday 11/7
3:00 PM ET the amount of consumer installment credit for September, including credit cards, auto loan, and student loans outstanding, indicate current consumer spending and borrowing patterns. The markets tend to ignore this number as we are already in November and this report measures September
3:40 PM ET, the Federal Reserve Bank Presidents Mester (Cleveland) and Collins (Boston), will be speaking. Both are considered fairly hawkish.
6:00 PM ET, the Federal Reserve Bank President Harkey (Philadelphia) will be speaking.
Tuesday 11/8
Election Day.
Meet the Management; Noble Capital Markets hosts Management of Entravision Communications (EVC) in West Palm Beach, FL. This is a no-cost-to-attend, in-person breakfast meeting with investors. If interested, click here.
Meet the Management, Noble Capital Markets hosts Management of Entravision Communications (EVC) in Boca Raton, FL. This is a no-cost-to-attend, in-person lunch meeting with investors. If interested, click here.
Wednesday 11/9
It can be expected that the newswires will be filled with Election Day outcomes and market-moving conjecture.
7:00 AM ET Mortgage Applications. The Mortgage Bankers Association (MBA) creates a statistic from several mortgage loan indexes. The Mortgage Applications index measures applications at mortgage lenders. It’s considered a leading indicator and is especially important for single-family home sales and housing construction. Both are considered foundational in a strong economy.
10 Year Treasury Note Auction is held in the middle of each month and settles on or around the 15th (depending on weekends). The yield is a benchmark for 30-year mortgages and has recently been noted by investment markets because it has been trading at a yield lower than shorter maturities. This inversion of the yield curve has some market players suggesting a recession is expected in the future. Any surprises at the auction will reverberate through the stock market.
10:30 AM ET, EIA Petroleum Status Report.
11:00 AM ET, Federal Reserve President Barkin (Philadelphia) speaks.
Meet the Management; Noble Capital Markets hosts Management of Entravision Communications (EVC) in Winter Park, FL. This is a no-cost-to-attend, in-person breakfast meeting with investors. If interested, click here.
Meet the Management; Noble Capital Markets hosts Management of Entravision Communications (EVC) in Orlando, FL. This is a no-cost-to-attend, in-person lunch meeting with investors. If interested, click here.
Thursday 11/10
8:30 AM ET, U.S. Consumer Price Index (CPI) is the inflation indicator most widely broadcast. With inflation being a primary focus, this will be the big number coming out this week. The number represents a basket of goods considered typical for an urban consumer and is taken as the change in the cost of that basket of goods. A percentage is derived from the change. CPI is also reported with food and energy removed as it is considered that other non-economic factors influence these prices. The September report indicated CPI rose 0.4% for the month and 8.2% YOY. Expectations are for an increase to 0.7% for October and a YOY rate of 8.0%.
8:30 AM ET U.S. Jobless Claims which represent the prior week’s employment are expected to have increased to 221,000 from 217,000. From jobless claims, investors can gain a sense of how tight or how loose the job market is. If wage inflation takes hold, interest rates will likely rise, and bond and stock prices will fall. Remember, the lower the number of unemployment claims, the stronger the job market, and vice versa.
10:30 AM ET, EIA Natural Gas Status Report.
Friday 11/11
Veterans Day, the stock market is one, the futures markets are open, and the bond market and other U.S. government-related offices are closed.
10 AM ET Consumer Sentiment, November (preliminary). This barometer, reported by the University of Michigan, questions households each month on their assessment of current conditions and expectations of future conditions. This “preliminary” release is for the month of November and is expected to have fallen to 59.6 versus 59.9 last month.
What Else
It is a light week for economic releases and Fed governor addresses, but the election outcome and CPI have the potential to whip markets around.
We’re entering the holiday shopping season when there will be a number of measures that investors focus on that will give a hint as to how strong the consumer is in the current economy.
US Sailors, Coastal Riverine Group, Restoring Command Anchor with Gold Paint, Credit: US Pacific Fleet (Flickr)
Can the Dollar Once Again Be Anchored by Gold? One Congressman Believes It Can
On October 7, 2022, US congressman Alex Mooney (a Republican from West Virginia) introduced a bill (the Gold Standard Restoration Act, H.R. 9157) that stipulates that the US dollar must be backed by physical gold owned by the US Treasury. The initiative clearly indicates that the increasingly inflationary US dollar is triggering efforts to get better money.
It should be noted that there have already been many legislative changes to make precious metals more attractive as a means of payment in recent years: in many US states, the value-added and capital gains taxes on gold and silver, but also on platinum and palladium, have been abolished. Mr. Mooney’s proposal is divided into three sections.
The first section of the bill establishes the need for a return to a gold-backed US dollar. For example, it is said that the US dollar—or more precisely, the bill refers to “Federal Reserve Notes”—that is, banknotes issued by the US Federal Reserve (Fed)—has lost its purchasing power on a massive scale in the past: Since 2000, it has dropped by 30 percent, and since 1913 by 97 percent. The bill also argues that with an inflation target of 2 percent, the Fed will not preserve the purchasing power of the US dollar but will have it halved after just thirty-five years. Moreover, the bill points out that it is in the interest of US citizens and firms to have a “stable US dollar.” The bill highlights that the inflationary US dollar has been eroding the industrial base of the US economy, enriching the owners of financial assets, while endangering workers’ jobs, wages, and savings.
The second section of the bill describes in more detail the technical process for re-anchoring the US dollar to the US official gold stock. It states that (1) the US secretary of the Treasury must define the US dollar banknotes using a fixed fine gold weight thirty days after the law goes into effect, based on the closing price of the gold on that day. The Fed must (2) ensure that the US banknotes are redeemable for physical gold at the designated rate at the Fed. (3) If the banks of the Fed system fail to comply with peoples’ exchange requests, the exchange must be made by the US Treasury, and in return, the Treasury takes the Fed’s bank assets as collateral.
The third section specifies how a “fair” gold price in US dollar can develop in an orderly manner within thirty days after the bill has taken effect. To this end, (1) the US Treasury and the Fed must publish all of their gold holdings, disclosing all purchases, sales, swaps, leases, and all other gold transactions that have taken place since the “temporary” suspension of the redeemability of the US dollar into gold on August 15, 1971, under the Bretton Woods Agreement of 1944. In addition, (2) the US Treasury and the Fed must publicly disclose all gold redemptions and transfers in the 10 years preceding the “temporary” suspension of the US dollar’s gold redemption obligation on August 15, 1971.
What to Make of This?
The bill’s core is the idea of re-anchoring the US dollar to physical gold based on a fair gold price freely determined in the market. (By the way, this is an idea put forward by the economist Ludwig von Mises (1881–1973) in the early 1950s.) In this context, the bill refers to US banknotes. However, banknotes only comprise a (fractional) part of the total US dollar money supply. But since US bank deposits can be redeemed (at least in principle) in US banknotes, not only US dollar cash (coins and notes) could be exchanged for gold, but also the money supply M1 or M2 as fixed and savings deposits could be exchanged for sight deposits, and sight deposits, in turn, could be withdrawn in cash by customers, and the banknotes could then be exchanged for gold at the Fed.
As of August 2022, the stock of US cash (“currency in circulation”) amounted to $2,276.3 billion. Assuming that the official physical gold holdings of the US Treasury amount to 261.5 million troy ounces, and the market expected US cash to be backed by the official US gold stock, a gold price of about $8,700 per troy ounce would result. This would correspond to a 418 percent increase compared to the current gold price of $1,680. If, however, the market were to expect the entire US money supply M2 to be covered by the official US gold stock, then the price of gold would move toward $83,000 per troy ounce—an increase of 4.840 percent compared to the current gold price. Needless to say, such an appreciation of gold has far-reaching consequences.
All goods prices in US dollars can be expected to rise (perhaps to the extent that the price of gold has risen). After all, the purchasing power of the owners of gold has increased significantly. Therefore, they can be expected to use their increased purchasing power to buy other goods (such as consumer goods, but also stocks, houses, etc.). If this happens, the prices of these goods in US dollar terms will be pushed up—and thus, the initial purchasing power gain that the gold dollar holders have enjoyed by being tied to the increased gold price will melt away again. Moreover, if US banks were willing to accept additional gold from the public in exchange for issuing new US dollar, reanchoring the US dollar in gold would increase the upward price effect.
A re-anchoring of the US dollar in the US official gold stock will result in a far-reaching redistribution of income and wealth. In fact, it would be fatal for the outstanding US dollar debt: US dollar goods prices would rise, caused by a rise in the US dollar gold price at which the US dollar is redeemable for physical gold, thereby eroding the US dollar’s purchasing power. In the foreign exchange markets, the US dollar would probably appreciate drastically against those currencies that are not backed by gold and against currencies which are backed by gold, not as fine compared to the fineness of the gold backing of the US dollar. The purchasing power of the US dollar abroad would increase sharply, while the US export economy would suffer. US goods would become correspondingly expensive abroad, while foreign companies gain high price competitiveness in the US market.
Once the US dollar is re-anchored in gold, today’s chronic inflation will end; monetary policy–induced boom-and-bust cycles will come to an end; the world will become more peaceful because financing a war in a gold-backed monetary system will be very expensive, and the general public will most likely not want to bear its costs. However, there is still room for improvement. A “Gold Standard Restoration Act” will deserve unconditional support if and when it paves the way toward a truly “free market for money.” A free market in money means that you and I have the freedom to choose the kind of money we believe serves our purposes best; and that people are free to offer their fellow human beings a good that they voluntarily choose to use as money.
In a truly free market, people will choose the good they want to use as money. Most importantly, in a truly free market in money, the state (as we know it today) loses its influence on money and money production altogether. In fact, the state (and the special interest groups that exploit the state) no longer determine which kind of gold (coins and bars, cast or minted) can be used as money; the state is no longer active in the minting business and cannot monopolize it anymore; there is no longer a state-controlled central bank to intervene in the credit and money markets and influence market interest rates. That said, let us hope that the Gold Standard Restoration Act proposed by Mr. Mooney will pave the way to reforming the US dollar currency system—and that it will eventually move us toward a truly free market in money.
About the Author
Dr. Thorsten Polleit is the Chief Economist of Degussa and an Honorary Professor at the University of Bayreuth. He also acts as an investment advisor.
Philippe Petit walks Tightrope between buildings one and two of WTC, Manhattan, 1974 – Robert.Dearie (Flickr)
Analyst Team Point Out Asset Classes that Slingshotted in the 1970s
While the traditional fine print usually says, “past performance is no guarantee of future results,’ we all know trading decisions, whether the stocks are to be held for seconds, or decades, are based on probabilities. And market probabilities are rooted in past performance. What does past performance tell us about the chances that the markets can survive high inflation and low growth? Well, if the stagflation of the 70s repeats, there may be a small section of the markets to keep a solid footing.
Michael Hartnett is the chief investment strategist at Bank of America/Merrill Lynch. Hartnett sees in our current economy the ingredients in the macroeconomic picture that lead to the difficult economic combination of high inflation and low growth. His team, in their Flow Show note on Friday, wrote: “Inflation and stagnation was ‘unanticipated in 2022…hence $35 trillion collapse in asset valuations; but relative returns in 2022 have very much mirrored asset returns in 1973/74, and the 70s remain our asset allocation analog for 2020s.”
If the conditions of the 1970s are being mirrored and we are creating a foundation similar to 1973/74, Hartnett and team have a list of assets that could springboard off the stagflation cycle.
The assets with potential include taking long positions in small-caps, value, commodities, resources, volatility, and emerging markets. The group also highlights the short positions that worked well in the 1970s, the note indicates these are larger stocks, bonds, growth, and technology.
Why Small-Caps
As it applies to the smaller companies, the note points out that stagflation persisted through the late 1970s, but the inflation shock had ended by 1973/74, when the small-cap asset class “entered one of the great bull markets of all-time.” The Hartnett team sees small-caps set to keep outperforming in the “coming years of stagflation.”
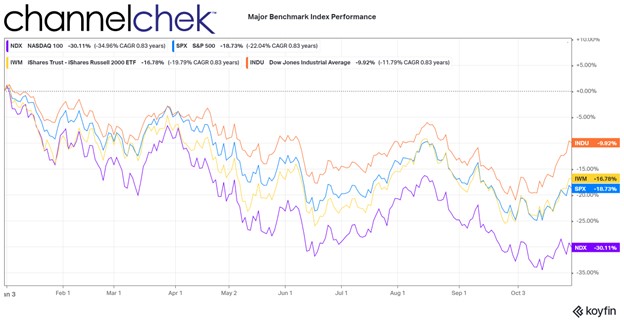
The current year-to-date status has the Russell 2000 small-cap stock market index (measured by iShares ETF) down 19.8% in 2022. At the same time, the Dow Industrials are down 11%, S&P 500 lost 21%, and the Nasdaq Composite gave back 33%.
The current state of the Fed and Chairman Powell is they continue to be adamant about tightening, Powell said he’d prefer to overdo withdrawing stimulus than do too little. He also knows that until the market believes this, his tightening efforts will have a lower impact.
The BofA team isn’t helping market expectations as they noted, despite Powell’s clear signal that the Fed isn’t ready to declare even a slight victory from its raising rates; the analyst team says, don’t give up on that pivot.
After tightening interest rates through 1973/74 amid inflation and oil shocks, the central bank first cut in July 1975 as growth turned negative, Hartnett points out. A sustained pivot began in December of that year, and importantly, the unemployment rate surged from 5.6% and 6.6% that same month.
The “following 12 months, the S&P 500 rose 31%. The note suggests the lesson learned is that job losses when they occur, will be the catalyst for a 2023 pivot,” said Hartnett and the team.
We’re not there yet. Today’s economic release on jobs showed the U.S. added a stronger-than-expected 261,000 jobs during October. This is a slower pace than the prior month’s 315,000 job gains but still shows the Fed can comfortably notch rates up more and continue reducing its balance sheet.
Take Away
The team of analysts at BofA/Merrill Lynch, reporting to Michael Hartnett, drew conclusions from the stagflation and financial markets’ performance of the 1970s. They shared their thoughts in a research note with investors. Looking at past performance, their expectation is that the Fed will pivot away from aggressively raising rates when it begins to negatively impact job creation. At this point, many markets will have already reacted to inflation expectations and would then react to a more accommodative monetary policy.
The asset sectors to avoid or short are larger stocks, bonds, growth, and technology. The preferred sectors that, in past situations, have done well are small-caps, value, commodities, resources, volatility, and emerging markets.
Be sure to sign-up at no cost for small and microcap company research sent to you each day by Channelchek.
The FOMC Votes to Raise Rates for Sixth Time (2022)
The Federal Open Market Committee (FOMC) voted to raise overnight interest rates from a target of 3.00%-3.25% to the new level of 3.75% – 4.00% at the conclusion of its November 2022 meeting. The monetary policy shift in bank lending rates was as expected by economists and the markets. The recent focus has been more on what the next move in December might look like. There were no clues given in the statement following the meeting. Many, including some members of Congress that recently wrote a letter to Chair Powell, have urged the Fed to be more dovish, while others suggest the central bank is still behind and hasn’t moved aggressively enough. A third contingent believes there may be more work to be done, but there should first be a pause to see what the impact has been of five aggressive moves.
The statement accompanying the policy shift also included a discussion on U.S. economic growth continuing to remain positive. There was little changed. Language from that statement can be found below:
Fed Release November 2, 2022
Recent indicators point to modest growth in spending and production. Job gains have been robust in recent months, and the unemployment rate has remained low. Inflation remains elevated, reflecting supply and demand imbalances related to the pandemic, higher food and energy prices, and broader price pressures.
Russia’s war against Ukraine is causing tremendous human and economic hardship. The war and related events are creating additional upward pressure on inflation and are weighing on global economic activity. The Committee is highly attentive to inflation risks.
The Committee seeks to achieve maximum employment and inflation at the rate of 2 percent over the longer run. In support of these goals, the Committee decided to raise the target range for the federal funds rate to 3-3/4 to 4 percent. The Committee anticipates that ongoing increases in the target range will be appropriate in order to attain a stance of monetary policy that is sufficiently restrictive to return inflation to 2 percent over time. In determining the pace of future increases in the target range, the Committee will take into account the cumulative tightening of monetary policy, the lags with which monetary policy affects economic activity and inflation, and economic and financial developments. In addition, the Committee will continue reducing its holdings of Treasury securities and agency debt and agency mortgage-backed securities, as described in the Plans for Reducing the Size of the Federal Reserve’s Balance Sheet that were issued in May. The Committee is strongly committed to returning inflation to its 2 percent objective.
In assessing the appropriate stance of monetary policy, the Committee will continue to monitor the implications of incoming information for the economic outlook. The Committee would be prepared to adjust the stance of monetary policy as appropriate if risks emerge that could impede the attainment of the Committee’s goals. The Committee’s assessments will take into account a wide range of information, including readings on public health, labor market conditions, inflation pressures and inflation expectations, and financial and international developments.
Take-Away
Higher interest rates can weigh on stocks as companies that rely on borrowing may find their cost of capital has increased. The risk of inflation also weighs on the markets. Additionally, investors find that alternative investments that pay a known yield may, at some point, be preferred to equities. For these reasons, higher interest rates are of concern to the stock market investor. However, an unhealthy, highly inflationary economy also comes at a cost to the economy, businesses, and households.
The next FOMC meeting is also a two-day meeting that takes place December 14-15. If the updates to GDP, the pace of employment, and overall economic activity is little changed, the Federal Reserve is expected to move again, perhaps not in as big of a step.
The Many Factors that Come Into a Fed Rate Decision are Mind Boggling
What do the FOMC members look at as they’re changing interest rates and whipping up new policy stances?
The Federal Open Market Committee, or FOMC, meets eight times a year. There are 12 members; seven are board members of the Federal Reserve System, and five are Reserve Bank presidents, including the president of the Federal Reserve Bank of New York, who serves as president of the committee. The group, as a whole, is arguably among the most powerful entities in the world. What is it that this group, that impacts all of us, focus on? And what specifically will they weigh into their decision at the current meeting?
Labor markets and prices are top on the Fed’s list and specifically part of their mandate. Also feeding into the mandate are contributing factors like housing, growth trends, and risks to monetary policy.
Prices (Inflation Rates)
Inflation remains elevated. In September, the Consumer Price Index (CPI) picked up to 0.4%. Energy prices declined in each month of the third quarter, dropping a cumulative 11.3% since June. The Fed will have to discern if this is sustainable or a function of oil reserve releases that will need replacing. Food prices continued high, although at a slower 0.8% increase during September.
Core CPI inflation (which strips out energy and food) started the third quarter at a somewhat slow pace—increasing just 0.3% in July. The trend went against the Fed as it rose by 0.6% in both August and September. Price growth for services was the largest contributor to an increase in core CPI in the third quarter.
One of the two mandates of the Federal Reserve is to keep inflation at bay. Chairman Powell has said they are targeting a 2% annual inflation level. While nothing that has been reported in price increases since the last meeting has approached that low of a target, the Fed also has to consider their tightening moves do not work to lower demand (especially in food and energy) rapidly.
The Federal Reserve’s preferred measure of inflation is the PCE price index; this is the measure they use with their 2% target. The PCE price index typically shows lower price growth than CPI because it uses a different methodology in its calculation, but the drivers of both measures remain similar. Over the year ending September, the headline PCE price index rose 6.2 percent, while the core PCE price index was up 5.1 percent.
Jobs (Employment and Wages)
Labor markets are still tight. The economy has added an additional 3.8 million jobs this year through September. This includes 1.1 million during the most recent quarter. During the third quarter, the U.S. economy exceeded pre-pandemic employment levels. The unemployment rate hasn’t budged much, and as of September, the rate held at a comfortable 3.5 percent rate.
The broadest measure of unemployment—the U-6 rate is a measure of labor underutilization that includes underemployment and discouraged workers, in addition to the unemployed. The U-6 rate has also remained behaved all year. It stood at 6.7 percent in September, the lowest rate in the history of the series (starting in January 1994).
When the Fed pushes on a lever for one of its mandates, in this case it is tightening to reign in inflation, it has to watch the impact on its other mandate, in this case, the job market. So far, there is nothing that has occurred on the employment side that should tell the Fed they have gone too far too fast.
.In fact, the labor numbers may suggest they should discuss whether they have moved nearly fast enough. Competition for employees continued as the economy added an additional 3.8 million through September 2022 (1.1 million during the third quarter). Notably, during the third quarter, the economy surpassed pre-pandemic employment levels as of August 2022.
Image: FOMC participants meet in Washington, D.C., for a two-day meeting on September 20-21, 2022, Federal Reserve (Flickr).
Housing Markets
Housing demand decreased in the third quarter as affordability (lending rates + prices), with economic uncertainty weighed on homebuyers. During September, 90% of all home sales were of existing homes. This pace declined 1.5 percent over the month (down 23.8 percent on a twelve-month basis). New single-family home sales dropped a large 10.9% in September; this was the seventh monthly decline.
Homes available for sale have now risen from all-time lows; this includes new and existing.
Over the past few years, home prices have increased dramatically; this was fueled by Fed policy. Prices still remain above longer-term trendlines. The Case-Shiller national house price index measures sales prices of existing homes; this was up 13% over the year ending August 2022. For reference, for the 12 months ended August 2021, prices rose 20%. The prior year they had only increased 5.8%.
Housing plays a huge role in economic health. The Fed is well aware of all the housing-related inputs to the 2008 financial crisis and the part easy money plays in market crashes. Orchestrating an orderly slowdown to the boom in housing is certainly critical to the Fed’s success.
Other Risks to Economy
Eight times a year, information related to each of the 12 Federal Reserve districts is gathered and bound in a publication known as theBeige Book. This summary of economic activity throughout the U.S. is provided approximately two weeks before each FOMC meeting, so members have a chance to evaluate economic activity over the diverse businesses the U.S. engages in.
U.S. Inflation can arise from conditions outside of the control of the U.S. For example Russia’s invasion of Ukraine has added upward pressure to inflation this year. This impact may have to be determined and netted out of calculations and policy as the Fed can’t fight this inflation pressure with monetary policy. An example would be the Fed can’t alter global food shortages brought on by war.
Dollar strength or weakness comes from many things. One of the most impactful is the difference in interest rates net of inflation between countries and their native currency. If the Fed raises rates when a competing currency has not, there is a chance there will be more demand for the alternative currency, which would weaken the dollar. Further complicating this for the Federal Resreve is a lower dollar is inflationary as it causes import prices to rise, a stronger dollar can reduce domestic economic activity as exports fall. The U.S. dollar has been rising and is now at its strongest in 20 years.
Commodity Prices were elevated in the first half of this year, mostly by energy. Although there was some relief from gas prices over the summer, energy is expected to rise into the colder months. They may rise further as the U.S. Strategic Petroleum Reserves are used less to control prices, this may be curtailed. The White House’s two goals of sharply reducing Russian revenue and avoiding further disruptions to global energy supplies while at the same time reducing oil use and production within the U.S. are a tanglement the Fed needs to consider. These can be very impactful to costs and economic activity, yet The Fed has no direct levers to impact these economic inputs.
World economies play a part in our own economic pace. If the Fed were to tighen aggressively while the global business is slowing, the impact of the tightening might be more pronounced than if the world economies are booming. Demand for goods and services impacts prices; the U.S. doesn’t live in a vacuum, and demand for our production and our demand for foreign production all must weigh on the Feds outlook for global economic health.
According to the IMF’s latest World Economic Outlook, global growth is expected to slow to 3.2 percent in 2022 and just 2.7 percent in 2023. At the same time, central banks around the world are tightening monetary policy to fight high global rates of inflation. In addition, there has been financial instability in some major world economies. These rising risks to the global growth outlook may feed back into the U.S. outlook by weakening international demand for U.S. goods and service exports. On the positive economic side, China is considering easing its Zero-COVID policy, which could eventually ease the supply chain impact to inflation.
Take Away
The original question was, “What do the FOMC members look at as they’re changing interest rates and whipping up new policy stances?” The answer is they have to look at everything. The recent mix of “everything” shows growth and employment in the U.S. have sustained at an even keel. Will previous rate hikes to calm inflation eventually take their toll? This is probably the big question the FOMC will be evaluating. Other domestic issues, including housing and the financial markets, are certainly to be weighed as well – a market crash of any magnitude could quickly slow economic activity.
The Fed has little control over what goes on overseas but must be aware of and hedge its policy to allow for.
All told, the Federal Reserve has a very difficult job. The report of the new monetary policy stance should hit the wire at 2 pm ET today (November 2).
Looking Back at October and Forward to Year-End 2022
The stock market for October was a home run for many industries. In fact, only a few market sectors were negative, each by less than one percent. After a losing first three quarters in most categories, investors are now asking, are we out of the losing slump? Did I already miss the best plays? There are still two months left in 2022, and there are a number of expected events that could cause high volatility (up/down). If you’ve been a market spectator, you want to know, should I get on the field and maybe take advantage of this streak? If you’ve been involved and are now at a recent high, you may instead consider taking a seat for the last two months.
Let’s look back and then forward as we enter the final two months of the year. Below we look at the month behind us in stocks, gold, and crypto. There is something that may be unfolding is stocks that is worth steering around.
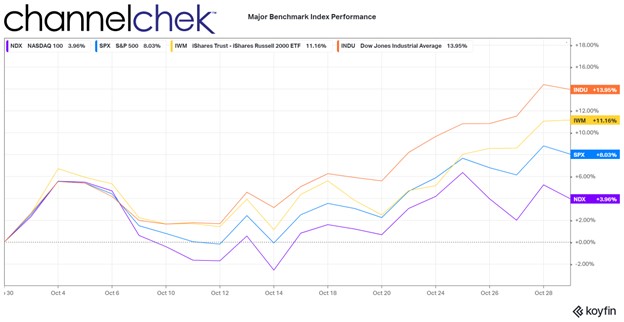
Large industrials, as measured by the Dow 30, had the best comparative performance in October. In fact, the Dow had its best month since 1976. Some investors have been rotating out of large high-tech and into more traditional businesses, like large industrial companies. Another reason it has gotten attention is of the 30 stocks in the Dow Industrials, at least 27 are expected to pay dividends; the lower stock prices from months of decline have raised the expected dividend yields to levels where investors are finding value and doing some reallocating. For example, Dow Chemicals (DOW)with a yield near 5% (plus any appreciations) or Verizon (VZ) at 7% can be appealing, especially for assets of retirees.
The small-cap stocks, as measured by the Russell 2000, weren’t far behind the Dow 30. This group has been lagging for some time and, by many measures, including price/earnings, offers value, while many larger stocks are still considered overpriced. Another thing working in favor of small U.S.-based companies is a likely customer universe that is not hurt by a strong dollar and international trade. In fact, there are small companies that can be shown to have benefitted from a strong native currency and have a competitive advantage with lower borrowing needs. Many analysts expect continued outperformance of the small-cap sector as it offers value and less global disruption.
The top 500 largest stocks, as measured by the S&P 500, had a very good month but are being dragged down by the large weighting of a few huge companies that the market feels have gotten way ahead of where they should be reasonably priced. The Nasdaq 100, shown above as returning only around 3.6%, has been hurt by this index weighting as well. These indexes had once benefitted from these few stocks flying high during the pandemic; the post-pandemic world, as well as global headwinds, are now working against them.
Investors have been taught that index funds and ETFs provide diversification, but that has never been true of Dow-indexed funds (30 stocks). And the S&P and Nasdaq 100, with heavy weightings in a few companies, only give the illusion of broad exposure. The S&P 500 and Nasdaq 100 relative performance during October may cause more investors to consider hand-selecting companies with lower P/Es, lower global exposure, and higher growth potential.
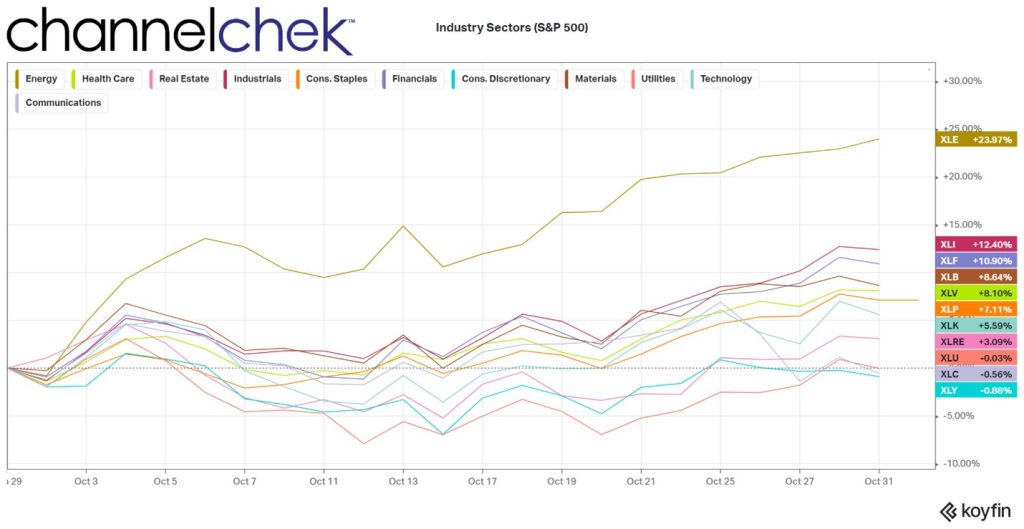
Oil companies regained their lead as they have been a sector detached from other stocks since late 2019. The industrial sector was second and followed by the only other industry above double digits, finance. Most (not all) financial companies benefit from higher interest rates, and those that take deposits (short-term) and lend money (long-term) do best with a steep yield curve.
On the bottom of the list are consumer discretionary companies, which are hurt by the strong dollar and a weakening economy; this sector is followed by communication. Communication is worth a deeper dive as it exemplifies how the weighting of stocks in popular indexes can hurt index returns – some say high-flying, highly weighted stocks are even in a bubble.
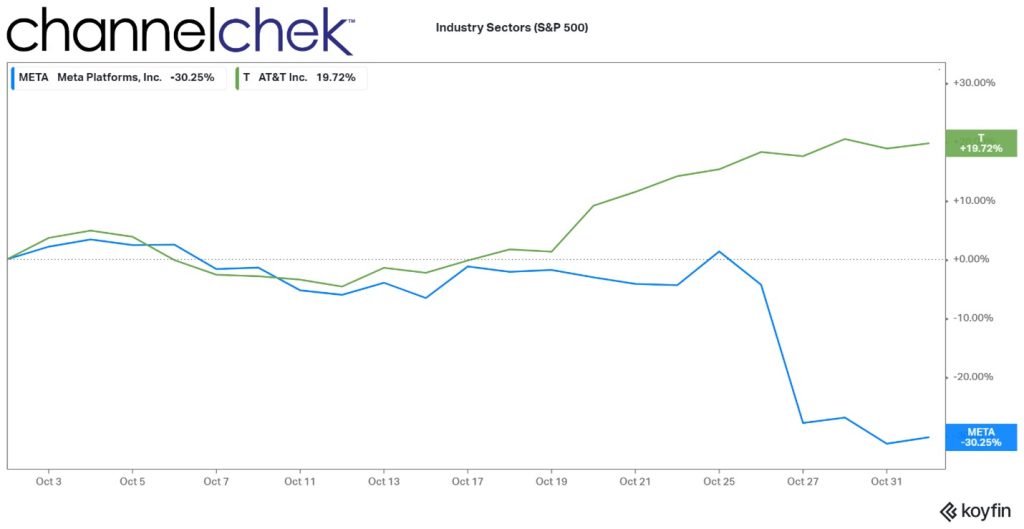
Below the chart compares two names in the S&P 500 that are also represented in the communications index. Meta (META) is 17.70% of the index and is down 30% in October. AT&T (T) is 4.70% of the communications index; it returned nearly 20% for the month. The funds weighting methodology that worked to the advantage of index investors, until it didn’t, has worked against some index investors.
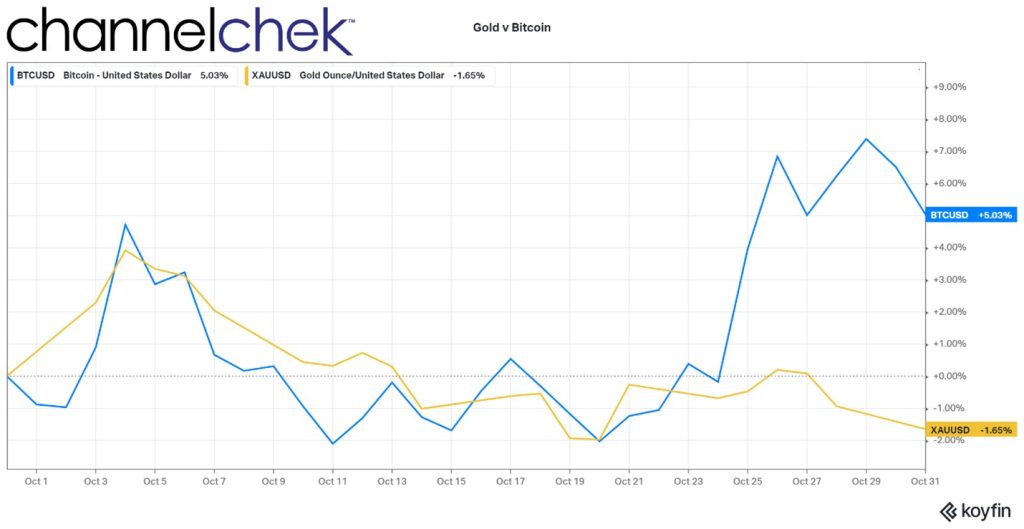
There is a rivalry of sorts between larger, more accepted cryptocurrencies and gold. Gold wants to regain its centuries-old place as the hard asset that best represents safety, even in the worst conditions, and Bitcoin or Ether, which is looking for respect, as the alternative asset that represents safety.
Crypto has been loosely moving in the same direction as stocks all year. October was no exception, as its price per dollar rose significantly during the month. Gold, despite much worry in the world, continued a slow downtrend.
Gold and Bitcoin Performance
Source: Koyfin
Take Away
Stock market participants that held on finally got a month where it was hard not to come out ahead. The question now is, do you take the gains and sit tight while the fed tightening, election, war, and global recession settle? Or do you look at the current dynamics and allocate where the highest probability of success lies? Maybe small-cap value stocks or oil and gas companies.
There is one thing investors have been warned about repeatedly over the years by well-respected investors, including Michael Burry. There is a risk inherent in indexes now that a few extremely “overpriced” stocks represent a large percentage of index funds.
Investors evaluating smaller, individual stocks have found the data and analysis on Channelchek to be indispensable. Be sure to sign-up for Channelchek at no cost to receive unbiased research on companies that are less talked about, but may have a place in your portfolio mix.
What Other Than a Large Rate Hike Can Investors Expect this Week?
Another 75 basis point hike is expected on Wednesday after the November 1-2 FOMC meeting. The discussion that is expected to immediately follow is will the Federal Reserve slow or pause its tightening from there. Those answers can’t be certain as even the Fed hasn’t seen the economic numbers unfold that will lead to the next meeting and play a part in the decision.
Since March, the FOMC has raised rates a cumulative 300 basis points. If they move .75 percent this week, the fed funds target range will be 3.75%-4.00%. This range was last experienced after the January 2008 meeting.
In September’s Summary of Economic Projections, the FOMC forecast for the fed funds rate was 1.25 percent above the current level or .50 percent above what most expect we will have by the end of the week. The statement and remarks following the next FOMC meeting by Chairman Powell may suggest that the FOMC is going to slow down the upward movement in rates while they see if previous rate hikes have begun to have a slowing impact on the economic pace.
The second scheduled event with the most potential to impact markets is the October Employment Situation on Thursday.
From there, all attention and talk may be on the elections next week, as they can have a powerful impact on market moves.
Monday 10/31
9:45 am US Chicago Purchasing Managers Report (PMI). The consensus is 47.3. For September, this survey of business conditions in the Chicago area showed a collapse to 45.7. A small improvement is expected from the October Survey
10:30 am Dallas Fed Manufacturing Survey is expected to come in at -18.0. This would be the sixth straight negative reading. This survey tracks manufacturing in Texas; for September, the results were -17.2.
3:00 pm US Farm Prices are expected to have come down during October by -1.8%, showing a year-over-year rate of 20% increase in farm prices. This is an important inflationary gauge as farm prices are a leading indicator of food price changes Consumer Price Index (CPI). There is a direct relationship between inflation and interest rates; markets can be influenced as interest rate expectations rise and fall.
Tuesday 11/1
The Federal Open Market Committee meets eight times a year in order to determine the near-term direction of monetary policy. The November meeting extends through November 2. After the meeting, typically at 2 pm, any change in monetary policy is announced.
10:00 am US Construction Spending is expected to have fallen by -.5%. Construction spending fell 0.7 percent in August, which was the seventh straight lower-than-expected result, showing lower activity in this important economic sector.
10:00 am JOLTS report consensus is 9.875 million. These reported job openings have been falling over several months; the previous month’s (August) openings reported were 10.05 million. The acronym JOLTS stands for Job Openings and Labor Turnover Survey.
Wednesday 11/2
Motor Vehicle Sales (US) are expected to have increased to 14.2 million from 13.5 million in September. The pattern of consumption is a direct influencer on company earnings and stock prices. Strong economic growth translates to healthy corporate profits and higher stock prices.
10:30 am EIA Petroleum Report shows crude inventory changes, as well as gasoline and other petroleum products. The Energy Information Administration provides this report weekly. During periods when inflation and fuel prices are a concern, the data in these reports can play a wider-than-normal role in influencing stock, bond, and of course, commodity price levels.
FOMC Announcement usually comes at 2:00 pm. The expectations had not changed since the last meeting when it became widely expected that the Federal Reserve would raise overnight lending rates at this meeting by 0.75%. A big focus will be on the policy statement following the meeting to sense at what pace removing accommodation will continue in the US.
Thursday 11/3
8:30 am US Jobless Clams are expected to be 222,000 for the week ending October 29. The prior week they had been 217,000. Employment is one of the Feds’ primary concerns as it fights inflation which also tops the list.
10:00 am US Factory orders are expected to have risen in September by 0.3%. The prior month this leading indicator of future economic activity was flat.
10:30 am EIA Natural Gas weekly report will update the current stocks and storage as well as production information from five regions within the US.
Friday 11/4
8:30 am, the Employment Situation report is released. It is expected to show an unemployment rate of 3.6%, or 210,000. The results of this survey have the potential to jar markets late in the week as one of the more important measures of a healthy economy (weak or overheated) is employment levels.
What Else
If the week brings more clarity from the Federal Reserve and likely next moves, investors may begin to focus on retail numbers as the calendar moves toward the shopping season.
The Mid-Term Elections are Just One of the SEC’s Concerns
The mid-term elections have the potential to alter the course of the markets. It’s easy to recognize how the possible outcomes can cause changes to the overall economy, including industry sectors, fuel prices, and perhaps even national debt levels. But, one area that is less obvious could also impact investors in a big way, regulation. As election day is now days away, many regulatory changes that have been in the works are quickly coming to a head, with the expectations there may be a change in priorities, power, and philosophy. The push to get things through in the coming days may still be undermined by the U.S. system. Here’s why.
The U.S. Government at Work
Federal regulators are in scramble-mode working to finalize proposed rules before what appears will be a change in the balance of power in the legislative branch. The possibility that there may be a Republican-controlled Congress or the expected idea that the democrats will lose control over one of the branches of Congress would soften their ability to institute their aggressive agendas. As the agencies refine their proposals, they also have to be mindful that it isn’t just the new Congress that will be evaluating new regulations. The Supreme Court has recently taken a heightened interest in agencies overstepping their charter, that interest is likely to continue.
It’s easy to see how Congress whose job it is to decide where money is spent, can dampen the agenda of the Department of Education (DOE), Internal Revenue Service (IRS), Food and Drug Administration (FDA), or Gary Gensler’s plans at the Securities and Exchange Commission (SEC). But, the Supreme Court is also more than a casual observer and has shown how willing it is to make sure everyone stays in their defined lanes.
Recent SEC Initiatives
The SEC has a three-part mission that includes protecting investors, maintaining fair, orderly, and efficient markets, and facilitating capital formation. Under Gary Gensler, it has been working overtime to impact the changing marketplaces. The initiatives are considered by some to be beyond the scope of the SEC’s lawful mission.
Gensler, who was appointed by President Biden, has been extremely active. The former Chairman of the U.S. Commodities Futures Trading Commission (CFTC) and MIT economics professor is proposing or finalizing dozens of regulations. Some are minor alterations to existing rules, but many are complete redesigns of how they are handled now. This redesign may make it past an unenthusiastic Congress, as they have more pressing priorities, but they may experience an aggressive halt from the country’s Judicial branch.
Recent Supreme Court Actions
In June of 2022, the Supreme Court decided W. Virginia v. EPA. The decision struck down an EPA regulation fighting climate change. The decision was made based on the grounds that the rule violated the “major questions doctrine.” The Court had never used that term before, but it seemed evident that the court might use the term and intent of the phrase should it be called on to review other federal agencies and commissions.
The Court has the authority and now recent precedent to unwind regulation that goes beyond the original intent of Congress when an agency was created or any subsequent legal grants of authority. The 6-3 ruling against the EPA explained the Clean Air Act, designed for new power plant emissions, did not extend to existing plants requiring them to shift to wind or solar. It’s a nod by the Court to keep bureaucracies from growing beyond the express original legal reason for being.
The ruling also is relevant in that it looked at Congress’s unwillingness to legislate and legitimize the way that the agency chose to regulate. One Justice in a concurring opinion wrote the decision was in part based on whether the agency was “intruding” in a traditional area of state law.
How it Could Impact Investors
Under the major questions doctrine, several SEC efforts may become far more difficult.
One high-profile SEC goal involves environmental initiatives. Climate change activists have supported the SEC’s proposal to require companies to increase their disclosure of anticipated climate risks. But it would be difficult for the SEC to weigh its mission against this initiative and easily demonstrate that anyone has a great impact on the other (orderly markets, investor protection, capital formation). If environmental initiatives are to be carried out, they will need to be enacted by the representatives elected to legislate on behalf of citizens.
It is easy to see how priorities focusing more on fiscal restraint rather than environmental awareness could alter the investors playing field with a power change in the Capital building.
The so-called greening of Wall Street is just one example of how the elections will impact the coming year’s winners and losers in the stock market. Consider the SEC’s proposed rules for swaps, which are financial instruments that some investors use to speculate on securities. The SEC’s suggested rule would require public disclosure within a day of these transactions to the public. The proposed rule can be considered an unprecedented intervention in this multi-trillion-dollar market. The argument is strengthened by the reality that Congress could have authorized disclosure in the 2010 Dodd-Frank Act, but did not. The Supreme Court would be expected to rule on behalf of the laws as written.
Another SEC initiative also at risk is the proposed rule on “beneficial” ownership. Such a definition is important for a host of reporting obligations. The SEC is considering expanding what counts as ownership. But questions of ownership have long been a matter of state concern. Gorsuch may have something to say about the SEC’s effort to expand the definition.
Another example is Kim Kardashian, who was ordered by the SEC to pay a fine for having touted a cryptocurrency on her Instagram account and the compensation she failed to disclose. The SEC has been in a battle with other financial overseers of the U.S. financial system to regulate and control digital currencies, which may or may not meet the definitions of a security or other language that legally created the commission.
Take Away
Regulatory agencies, including the SEC, are likely to have to contend with increased barriers with both the only branch of government that makes both laws and spends money and the branch that deciphers and enforces laws. Rather than argue if this is what should be, or if it slows down progress when wearing one’s investor hat,” investors may only want to consider what industries and what companies within those industries will be the winners and losers – then how does that fit into your overall portfolio strategy.
If you haven’t registered to receive equity research and thoughtful articles and videos from Channelchek, this is a good time to sign-up in preparation for the year-end and 2023. Click here for free registration.