US Debt Default Could Trigger Dollar’s Collapse – and Severely Erode America’s Political and Economic Might
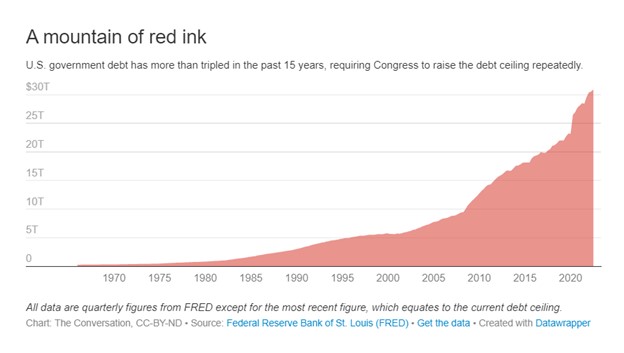
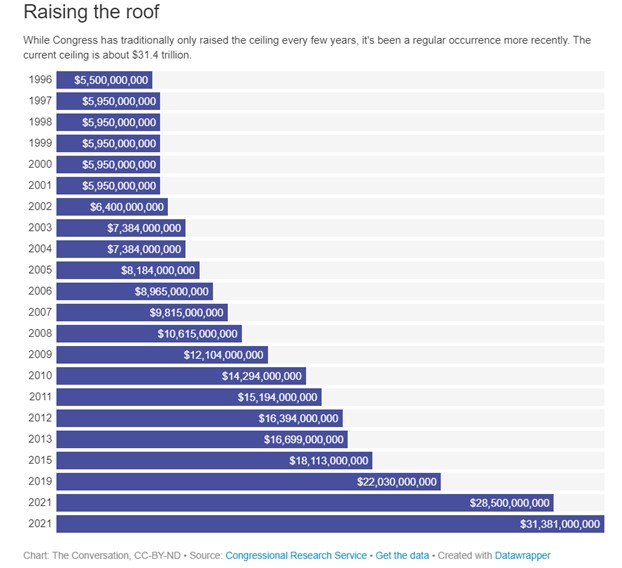
Republicans, who regained control of the House of Representatives in November 2022, are threatening to not allow an increase in the debt limit unless spending cuts are agreed to. In so doing, there is a risk of the U.S. government could move into default.
Brinkmanship over the debt ceiling has become a regular ritual – it happened under the Clinton administration in 1995, then again with Barack Obama as president in 2011, and more recently in 2021.
This article was republished with permission from The Conversation, a news site dedicated to sharing ideas from academic experts. It represents the research-based findings and thoughts of, Michael Humphries, Deputy Chair of Business Administration, Touro University
As an economist, I know that defaulting on the national debt would have real-life consequences. Even the threat of pushing the U.S. into default has an economic impact. In August 2021, the mere prospect of a potential default led to an unprecedented downgrade of the the nation’s credit rating, hurting America’s financial prestige as well as countless individuals, including retirees.
And that was caused by the mere specter of default. An actual default would be far more damaging.
Dollar’s Collapse
Possibly the most serious consequence would be the collapse of the U.S. dollar and its replacement as global trade’s “unit of account.” That essentially means that it is widely used in global finance and trade.
Day to day, most Americans are likely unaware of the economic and political power that goes with being the world’s unit of account. Currently, more than half of world trade – from oil and gold to cars and smartphones – is in U.S. dollars, with the euro accounting for around 30% and all other currencies making up the balance.
As a result of this dominance, the U.S. is the only country on the planet that can pay its foreign debt in its own currency. This gives both the U.S. government and American companies tremendous leeway in international trade and finance.
No matter how much debt the U.S. government owes foreign investors, it can simply print the money needed to pay them back – although for economic reasons, it may not be wise to do so. Other countries must buy either the dollar or the euro to pay their foreign debt. And the only way for them to do so is to either to export more than they import or borrow more dollars or euros on the international market.
The U.S. is free from such constraints and can run up large trade deficits – that is, import more than it exports – for decades without the same consequences.
For American companies, the dominance of the dollar means they’re not as subject to the exchange rate risk as are their foreign competitors. Exchange rate risk refers to how changes in the relative value of currencies may affect a company’s profitability.
Since international trade is generally denominated in dollars, U.S. businesses can buy and sell in their own currency, something their foreign competitors cannot do as easily. As simple as this sounds, it gives American companies a tremendous competitive advantage.
If Republicans push the U.S. into default, the dollar would likely lose its position as the international unit of account, forcing the government and companies to pay their international bills in another currency.
Loss of Political Power Too
Since most foreign trade is denominated in the dollar, trade must go through an American bank at some point. This is one important way dollar dominance gives the U.S. tremendous political power, especially to punish economic rivals and unfriendly governments.
For example, when former President Donald Trump imposed economic sanctions on Iran, he denied the country access to American banks and to the dollar. He also imposed secondary sanctions, which means that non-American companies trading with Iran were also sanctioned. Given a choice of access to the dollar or trading with Iran, most of the world economies chose access to the dollar and complied with the sanctions. As a result, Iran entered a deep recession, and its currency plummeted about 30%.
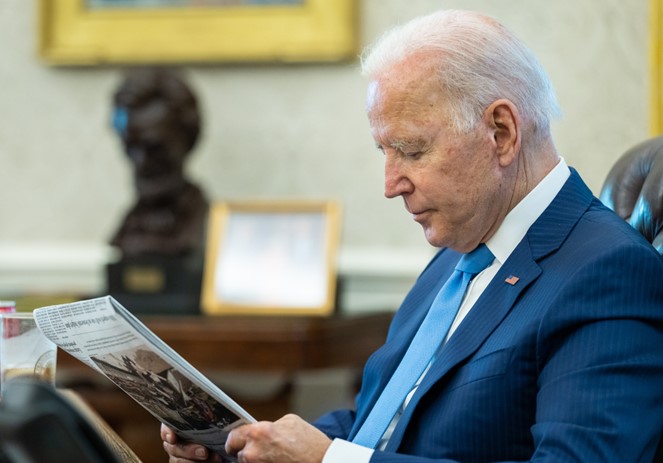
President Joe Biden did something similar against Russia in response to its invasion of Ukraine. Limiting Russia’s access to the dollar has helped push the country into a recession that’s bordering on a depression.
No other country today could unilaterally impose this level of economic pain on another country. And all an American president currently needs is a pen.
Rivals Rewarded
Another consequence of the dollar’s collapse would be enhancing the position of the U.S.‘s top rival for global influence: China.
While the euro would likely replace the dollar as the world’s primary unit of account, the Chinese yuan would move into second place.
If the yuan were to become a significant international unit of account, this would enhance China’s international position both economically and politically. As it is, China has been working with the other BRIC countries – Brazil, Russia and India – to accept the yuan as a unit of account. With the other three already resentful of U.S. economic and political dominance, a U.S. default would support that effort.
They may not be alone: Recently, Saudi Arabia suggested it was open to trading some of its oil in currencies other than the dollar – something that would change long-standing policy.
Severe Consequences
Beyond the impact on the dollar and the economic and political clout of the U.S., a default would be profoundly felt in many other ways and by countless people.
In the U.S., tens of millions of Americans and thousands of companies that depend on government support could suffer, and the economy would most likely sink into recession – or worse, given the U.S. is already expected to soon suffer a downturn. In addition, retirees could see the worth of their pensions dwindle.
The truth is, we really don’t know what will happen or how bad it will get. The scale of the damage caused by a U.S. default is hard to calculate in advance because it has never happened before.
But there’s one thing we can be certain of. If there is a default, the U.S. and Americans will suffer tremendously.