Upcoming PCE Data May Revise St. Louis Fed President’s Increasingly Hawkish Stance
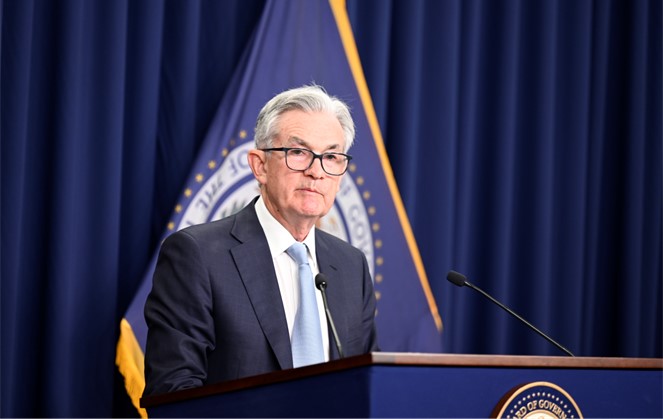
Federal Reserve Chair Jerome Powell testified before Congress in June of last year and said there is a risk the Fed could go too far raising rates. He didn’t believe overdoing it was a “top risk” to the economy. The greater risk, he thought, was that wage and price pressures could possibly keep inflation at a boiling point. He reiterated this position a few months later, saying it is easier to restart the economy if the FOMC is too heavy on the brake pedal rather than too unaggressive and left needing to do even more later. Today, FOMC members seem to agree, at least the St. Louis Fed President does, but he’s not alone. The non-voting member of the Committee says he wants to step up the pace of tightening.
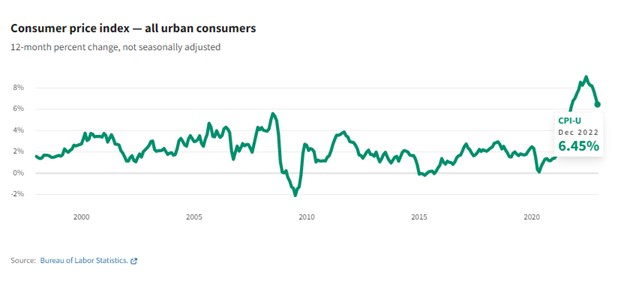
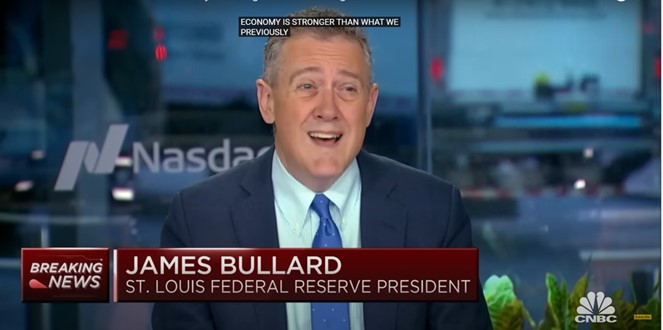
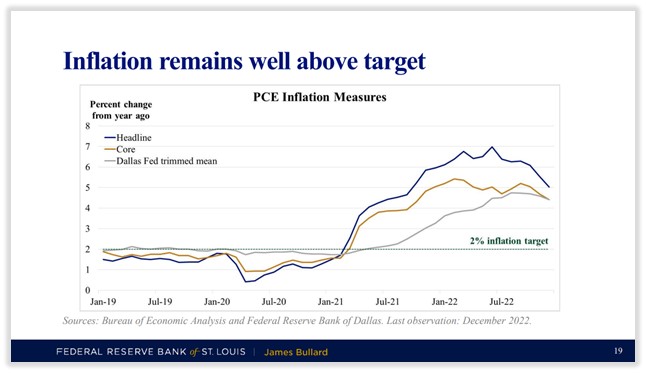
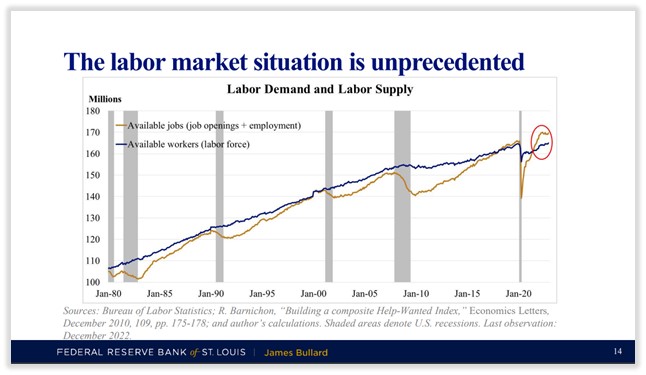
A full percentage point of tightening is needed, and sooner is better, according to James Bullard, who is the President of the St. Louis Federal Reserve. The hawkish comments were made on CNBC February 22nd, but they echo those he made the previous week during his slide presentation titled: Disinflation: Progress and Prospects, deliveredto businesses in Jackson Tennessee. The comments come as inflation is still well above the Fed’s target and not receding toward the 2% goal at a pace that is in line with achieving the target.
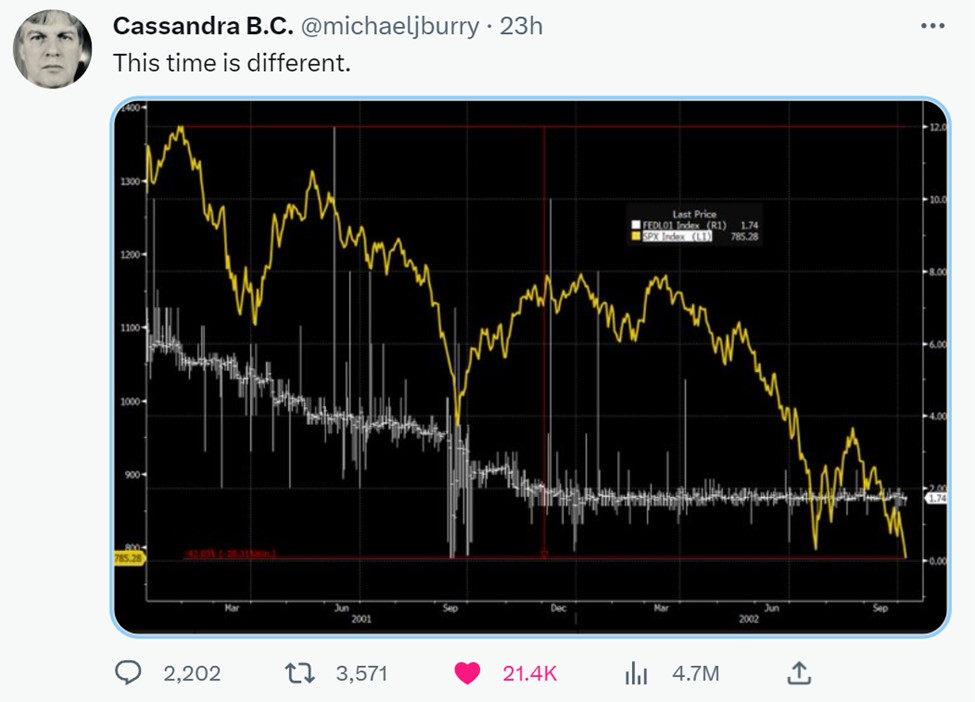
During the CNBC interview, Bullard said the “risk now is inflation doesn’t come down and reaccelerates.” He used the 1970’s entrenched inflation experience as an example. Explaining that when rising prices become the norm over a long period of time, they become the mindset, the expectation, and then self-fulfilling. Bullard expressed that this is undesirable.
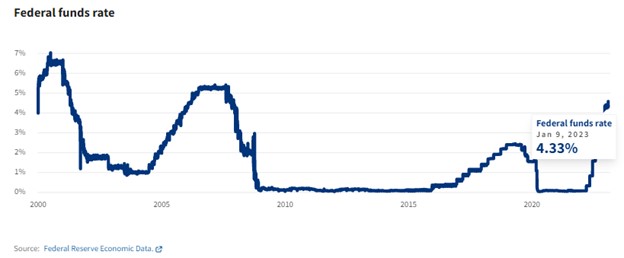
While speaking about where he expects the peak in Fed Funds should be this tightening cycle, he explained he supports a rate near 5.375%. Currently, the Fed targets 4.50% to 4.75%.
Another Fed president has also been vocal recently. Cleveland Fed President Loretta Mester, like Bullard, is a non-voting member this year. Last week she said she saw a “compelling economic case” for a 50 basis-point interest-rate hike at the Fed’s Jan 31- Feb 1 meeting. This conversation is expected to be reflected in the FOMC minutes being released this week. The markets may start reacting to comments of members that supported a more aggressive posture than the 25 basis points the Fed decided upon.
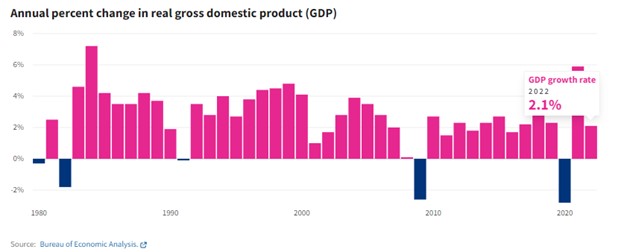
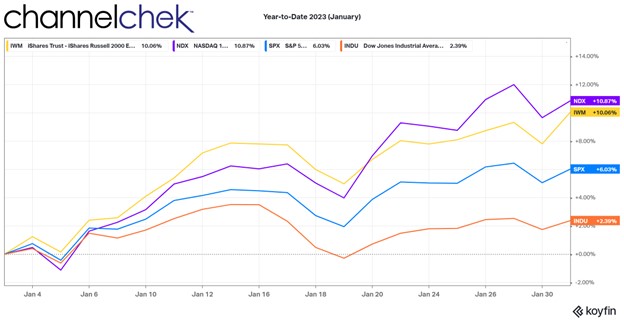
The next FOMC meeting is to be held March 21-22. Over the next month, there will be only one more look at the PCE index and several more employment reports. Overall the markets have recently begun to behave more in line with the data and Fed rhetoric. Bonds have begun trading off, although yields still price in much lower inflation, and the stock market, which traded up in January, appears to understand that if the economy wasn’t hot, there would be no reason for the Fed to throw cold water on it.
Expectations for a rate hike at the next meeting can change over the next month. Currently, according to the CME Fedwatch gauge, a 25 bp hike is where speculators have congregated. However, a 50 basis-point hike has gained popularity. The odds have moved up to 24% from 12.2% a week ago, according to the gauge.
Take Away
On the trading desk we label market moving news stories and interviews from influential policymakers, “tape bombs.” This is because as they come across news tapes (like Bloomberg), they could do damage to your positions.
The evenings before each trading week (usually Sunday), Channelchek emails to subscribers known events scheduled during the upcoming week that could become “tape bombs” to your holdings. Subscribe to Channelchek here to be sure you receive these potential risks before the action starts that week.
Managing Editor, Channelchek