Looking Back at the Markets in May and Forward to June
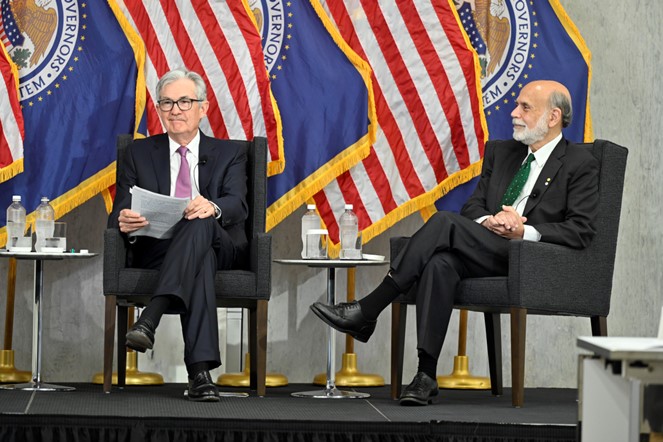
Conviction in the overall stock market was weak in May, while enthusiasm for specific sectors was strong. June investors may regain some clarity as markets may be relieved from the debt ceiling dark cloud that kept investors overly cautious. But a renewed fear that the Fed is losing ground to inflation may become the focal point until the coming FOMC meeting. In the meantime, any increase in the debt limit signed into law kicks the can down the road, ongoing increases in borrowing and spending may not haunt the overall market in June, but the path of escalating debt is unsustainable for a healthy U.S. economy.
The next scheduled FOMC meeting is June 13-14. We will have another look at consumer inflation numbers before the June 14 Fed monetary policy decision date CPI (June 13).
While the Fed is wrestling with stubborn inflation, it is keeping an eye on the strong labor markets, which provides leeway and perhaps even a strong reason fo it to continue riding the economic break pedal by being increasingly less accommodative. Although low unemployment is desirable, tight labor markets are helping to drive prices up. The Fed aims to find a better balance.
Look Back
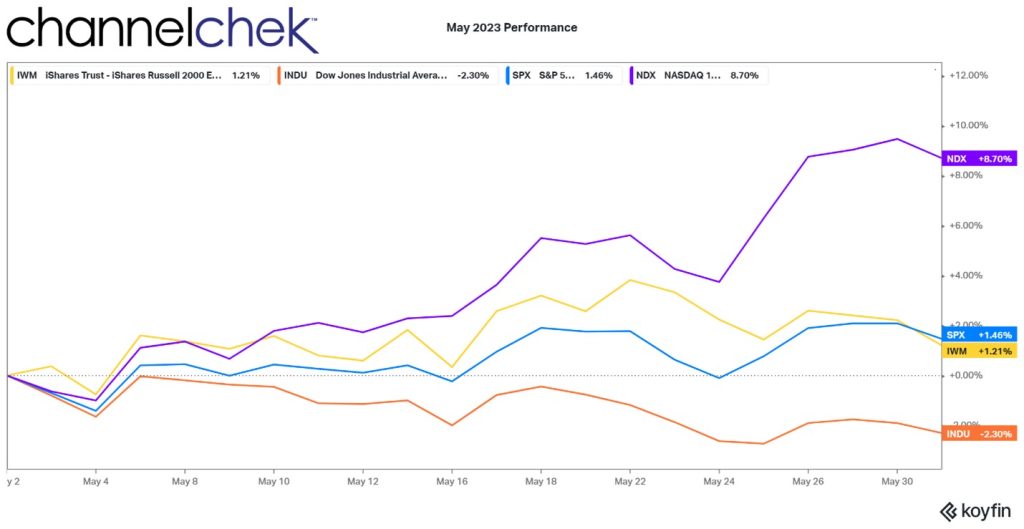
Three broad stock market indices (S&P 500, Nasdaq 100, and Russell 2000) are positive on the month of May. The Dow Industrials spent the entire month in negative territory. The Nasdaq 100 was the big winner (+8.7%) on the back of tech stocks as many have been inspired by the earnings performance and stock price performance of Nvidia (NVDA). The S&P 500 (+1.46%) and Russell 2000 (+1.21%) had a good showing putting the Russell 2000 back in positive territory for 2023. The Dow Industrials is negative (-2.30%), leaving this NYSE index down (-.72%) on the year.
During June, inflation showed signs that it was not decelerating but instead could be building strength. While the Fed raised rates by .25% and continued on pace with quantitative tightening, the impact has been seen as a sharp decrease in money supply (M2), but the central banks’ intended effect has not been realized.
Monetary policy is seen as having a lagging effect; that is to say, when the Fed pushes rates up today, it may take a year to work its way into the system to cause slowing and less demand to reduce price increases. Whether the Fed has done enough can only be seen in the rearview mirror months from now.
Market Sector Lookback
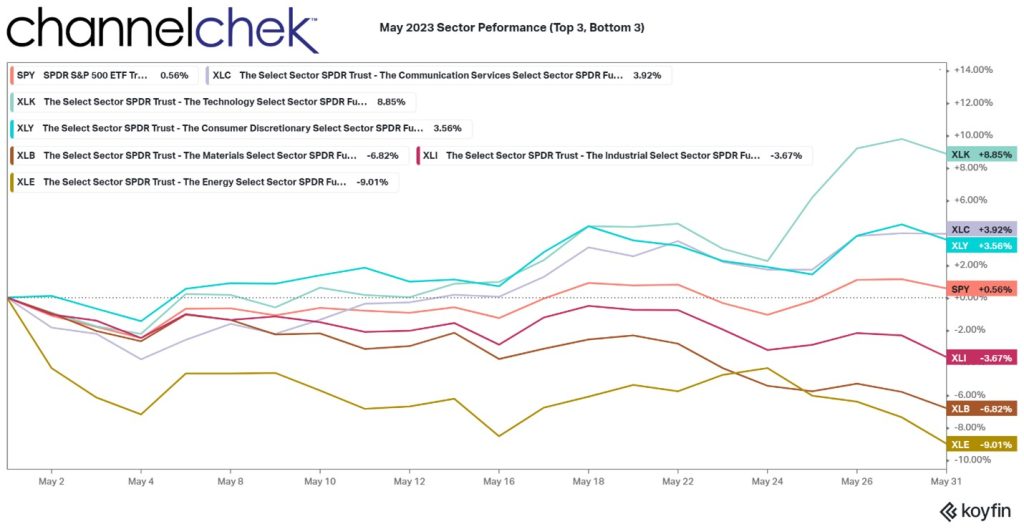
Of the 11 S&P market sectors (SPDRs), three were in positive territory as May came to a close. Technology, ticker XLK (+8.85%), was the only sector that showed an increase the previous month as well (.08%). That is followed by Communications Services, ticker XLC (3.92%), and Consumer Discretionary, ticker XLY, (+3.56%).
The S&P 500, which is comprised of the 11 market sectors, was barely positive during the month of May (+56%).
Of the three worst performers are Industrials, ticker XLI (-3.67%), it faired the best as the industrial sector has been relatively flat on the year. The Materials, ticker XLB, (-6.87%) took a larger hit as commodities prices dropped during the month; this sector was positive on the year going into May. Energy, ticker XLE, (-11.73%) has been volatile during 2023. It is just off its low (-12%) that it reached in mid-March.
Looking Forward
The job market is strong, and inflation, at best, isn’t declining; this makes it more comfortable for the Fed to raise rates. Another way to look at it is it creates a need for them to continue to hammer away to reverse the inflationary trend – and the economic latitude in which to do it.
While the energy sector was the worst performer among S&P 500 sectors, there are factors suggesting the trend could hold until OPEC and Russia begin to work in synch again. Oil prices are near their lowest levels all year, reflecting a drop in global demand, on the output side, since October, OPEC+ was supposed to be reducing production by 3.5 million barrels a day. There are signs that a key country in the alliance isn’t adhering to the announced production cuts. Whether this causes additional “cheating”, or causes the cartel to force members to fall in line remains to be seen.
Technology stocks, particularly those that could possibly benefit from the artificial intelligence revolution, are likely to be among the focus for a while. The sudden broad awareness of what the technology can do has sent investors scrambling for exposure. Whether the potential (AI) is unleashed quickly or the promise of AI now takes a slower road remains to be seen.
The Russell Reconstitution will be complete as of the first Monday in June. The index will have its new components and the portfolio managers of indexed funds ought to own the stocks that were added to the indexes in their funds and sell out of those that are no longer in the funds index. This creates a lot of activity around June 24. When the market opens on June 27, the index with its new makeup will be set.
Take-Away
The market was full of uncertainty in May. Yet three of the four major market indexes were higher. The signing into law of an increased debt ceiling will make one of the most worrisome objections to being involved disappear. This may unleash buyers that were sidelined.
Technology, caused by high expectations of AI was the focus during May; often, hype causes investors to shoot first and aim later. There will be winners and losers in this technology segment, as with any investment; remove yourself from the hype, carefully evaluate the opportunity, and read the professional research, positive and negative, of those you trust.
By the end of the month we will have two quarters of 2023 behind us, and there are no signs of a recession and little on the horizon to cause U.S. growth to falter quickly enough for there to be a recession this year. It is unlikely the Fed will ease in 2023. It is, however, likely a pause will eventually happen. There are reasons to believe that the pause won’t happen in June.
The axiom, sell in May and walk away is in question. Three of the four major indexes were up in May, so the jury is still out as to whether selling made sense for 2023.
Managing Editor, Channelchek
Sources
https://www.clevelandfed.org/indicators-and-data/inflation-nowcasting
Koyfin | Advanced graphing and analytical tools for investors