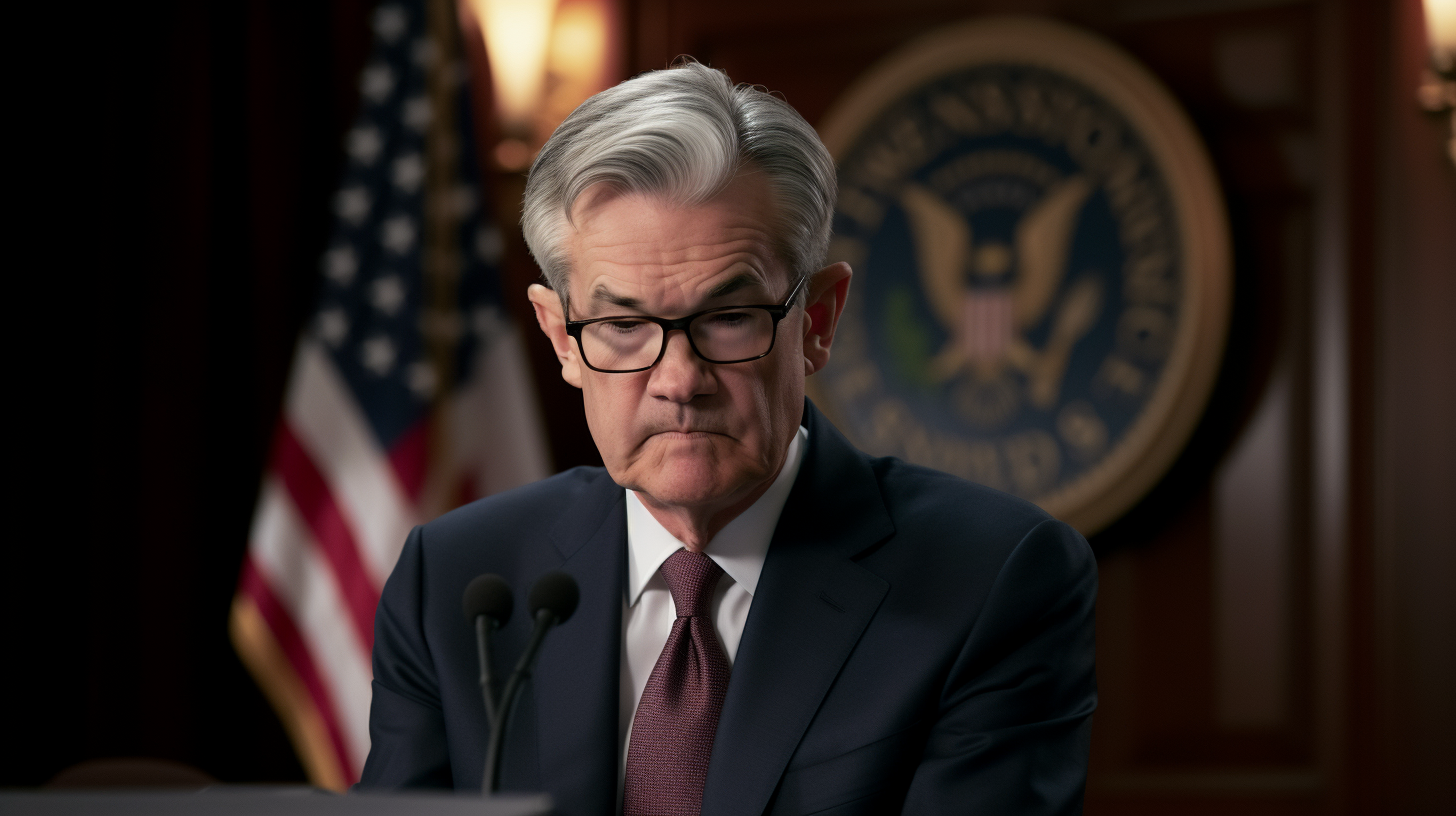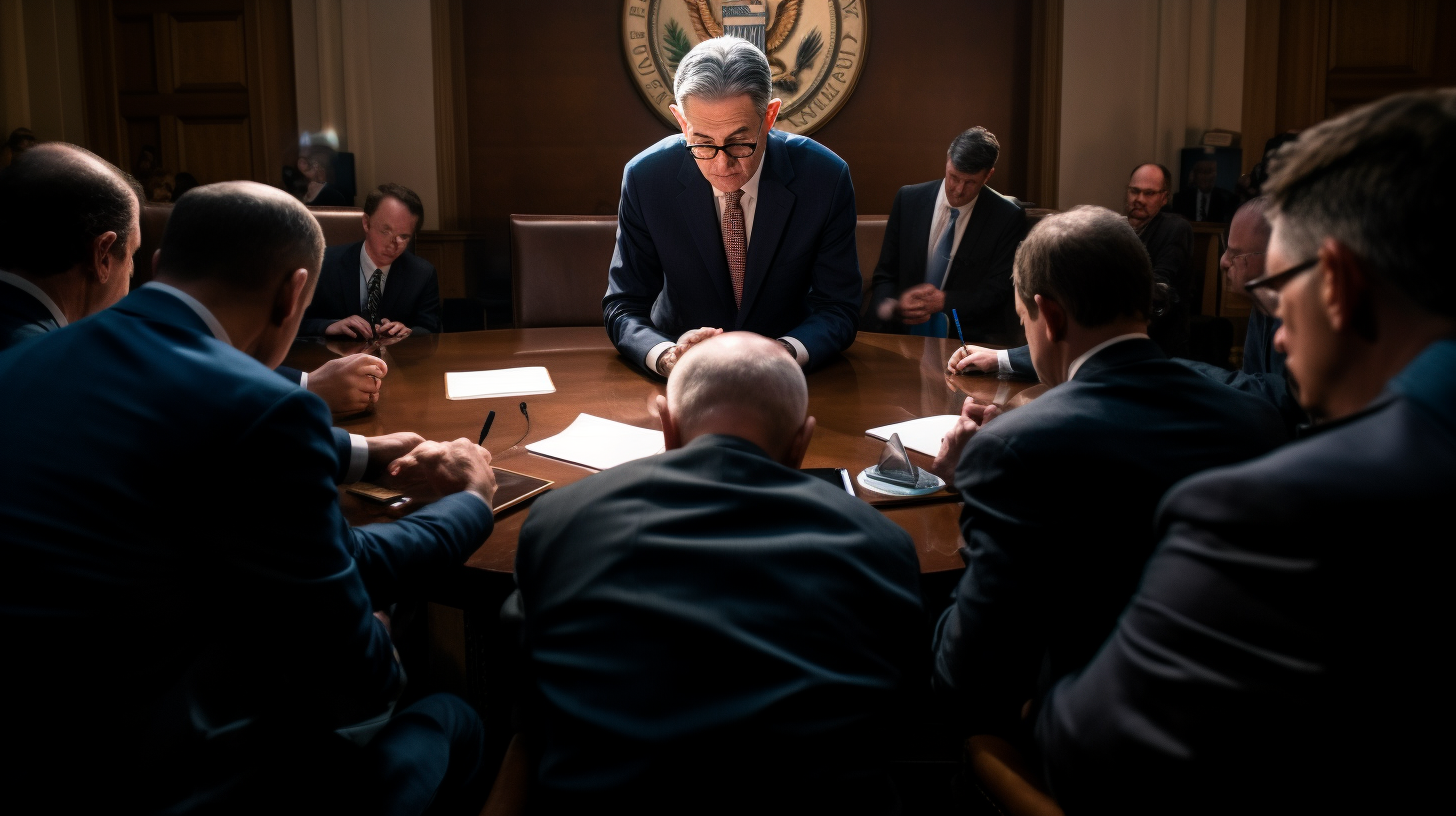
Federal Reserve Chair Jerome Powell doused investor hopes of a near-term pause in interest rate hikes, stating “we are not confident that we have achieved such a stance” that would allow inflation to drift down towards the Fed’s 2% target.
In remarks at an International Monetary Fund event, Powell said bringing inflation sustainably down to 2% still has “a long way to go”. His tone cast serious doubt on market expectations that the Fed is almost done raising rates in this cycle.
Traders have priced in a greater than 90% chance of just a 25 basis point December hike, followed by rate cuts commencing in mid-2023. But Powell stressed the Fed stands ready to tighten policy further if economic conditions warrant.
Powell acknowledged recent positive developments, including moderating inflation readings, strong GDP growth, and improvements in supply chains. However, he noted it is unclear how much more progress supply-side factors can drive.
That puts the onus on the Fed to ensure slowing demand prevents inflation from reaccelerating. Powell made clear the Fed will stay the course, even if that means defying market hopes for a dovish pivot.
How High Could Rates Go?
Markets are currently priced for Fed Funds to peak under 5% after a quarter point December increase. But Powell’s insistence on not letting up prematurely raises the specter of a higher terminal rate.
If strong economic reports continue showing robust consumer spending and tight labor markets, the Fed may opt for 50 basis points in December. That would leave rates squarely in the 5-5.25% range, with more hikes possible in early 2023 if inflation persists.
Powell was adamant the Fed cannot be swayed by a few months of data, given the fickle nature of inflation. Premature rate cuts could allow inflation to become re-entrenched, requiring even more aggressive hikes down the road.
With Powell determined to avoid that scenario, investors may need to brace for interest rates cresting above current expectations before the Fed finally stops tightening.
Growth and Jobs Still Too Hot?
Behind Powell’s hawkish messaging is a still-hot economy that could be fueling inflation pressures beneath the surface. The U.S. unemployment rate remains near 50-year lows at 3.7%, with job openings still far exceeding available workers.
Meanwhile, GDP growth rebounded to a strong 2.6% rate in the third quarter, defying recession predictions. Consumer spending has remained remarkably resilient as well.
Powell recognizes the Fed may need to cool economic activity more meaningfully to align demand with constrained supply. That explains his lack of confidence on inflation without further rate increases.
Markets move lower after Powell cools pivot hopes
Stock indexes immediately turned lower following Powell’s remarks, with the Dow shedding around 200 points. Treasury yields also spiked as expectations for longer-term Fed hikes intensified.
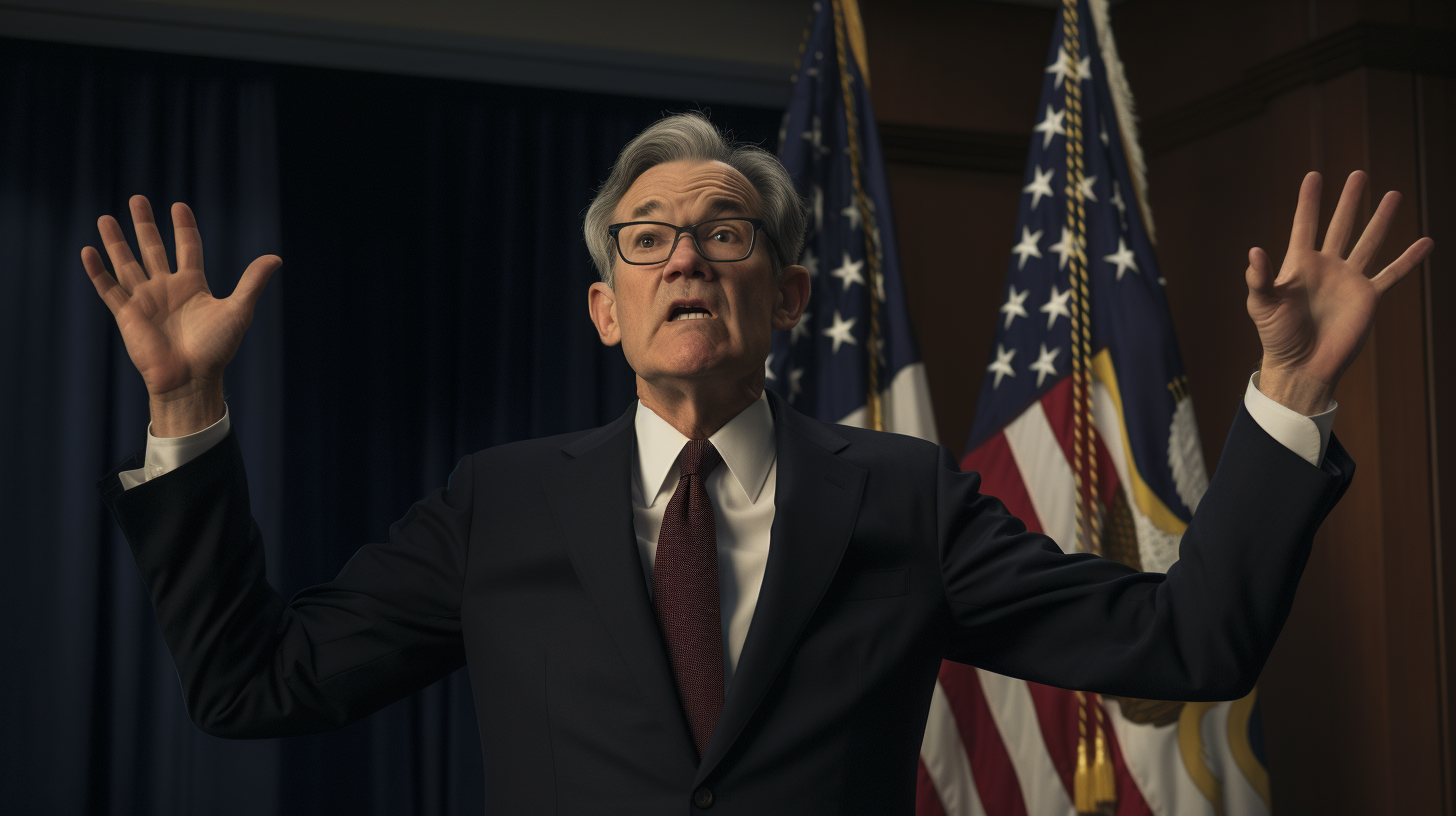
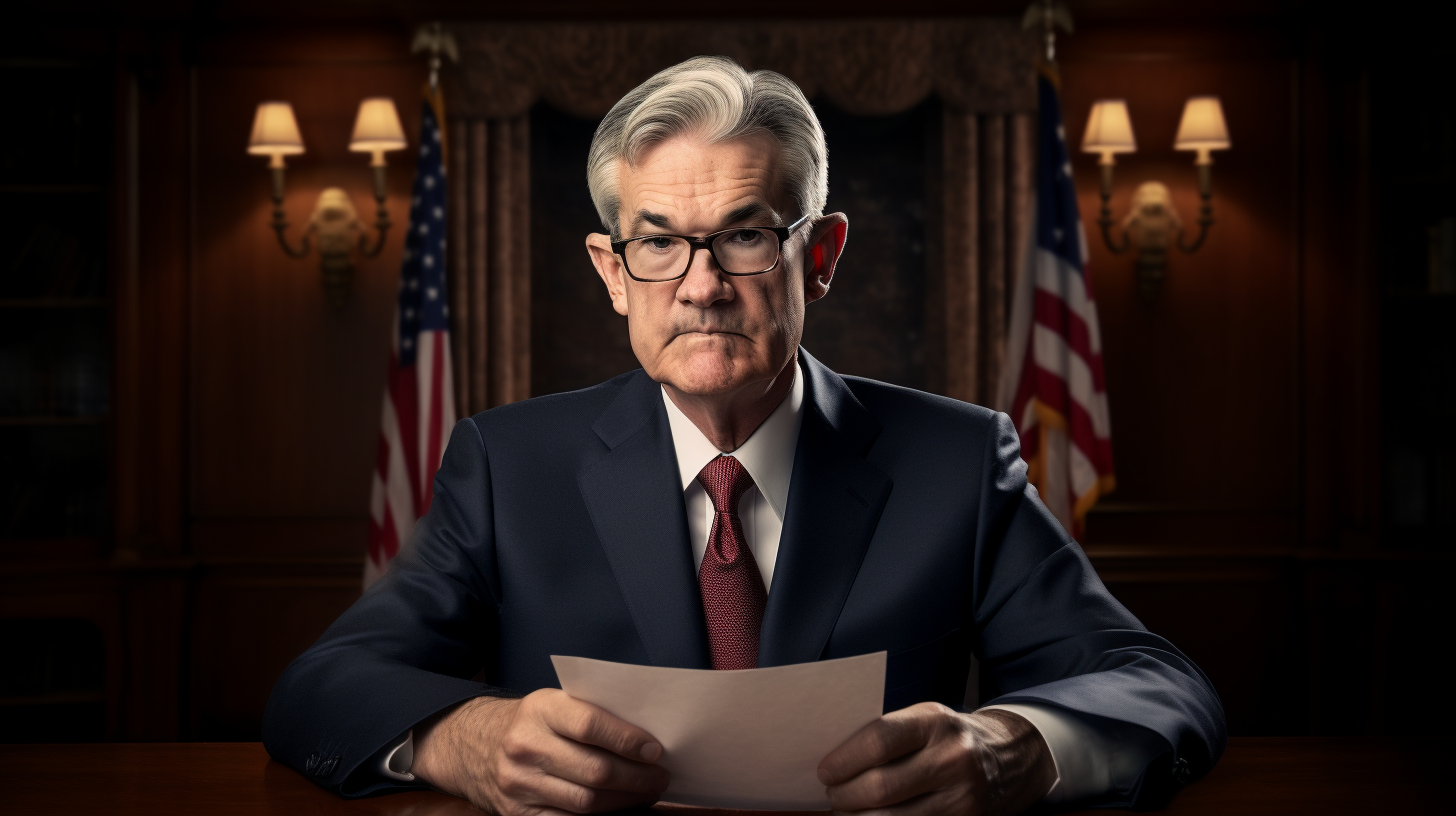
Powell succeeded in resetting market assumptions, making clear the Fed has no intentions of reversing course anytime soon just because inflation has shown initial signs of improvement.
Until policymakers have high confidence lasting 2% inflation is in sight, Powell indicated the Fed’s tightening campaign will continue. That may disappoint stock and bond investors banking on rate cuts next year, but fighting inflation remains Powell’s top priority.
With the Fed Chair throwing cold water on pivot hopes, markets will likely undergo a reassessment of just how high the Fed may yet raise rates. Powell’s tone hints investors should brace for more tightening ahead, even if that delays the desired easing cycle.