BOCA RATON, Fla.–(BUSINESS WIRE)–Dec. 14, 2023– The GEO Group (NYSE: GEO) (“GEO” or the “Company”) announced today the closing of a Refinancing Revolving Credit Commitments Amendment (“Amendment”) to its Credit Agreement dated as of August 19, 2022, providing for the refinancing of all of GEO’s outstanding revolving credit facility commitments. The Amendment provides for approximately $265 million in refinancing revolving credit commitments maturing on March 23, 2027. Prior to the Amendment, a portion of the Company’s revolving credit commitments matured on May 17, 2024, and the balance of the Company’s revolving credit commitments matured on March 23, 2027. The Amendment further provides that interest will accrue on outstanding revolving credit loans at a rate determined with reference to the Company’s total leverage ratio. As of today, revolving credit loans accruing interest at a SOFR based rate would accrue interest at the term SOFR reference rate for the applicable interest period plus 3.00% per annum. All other terms governing the refinancing revolving credit commitments remain substantially consistent with those governing the revolving credit commitments being refinanced. GEO currently has no outstanding borrowings under its revolving credit facility, as amended.
George C. Zoley, Executive Chairman of GEO, said, “We are pleased with this recent refinancing transaction and the support for our Company’s future capital needs. This is an important step to continue achieving our long-term strategy to reduce debt and refinance our credit arrangements.”
About The GEO Group
The GEO Group, Inc. (NYSE: GEO) is a leading diversified government service provider, specializing in design, financing, development, and support services for secure facilities, processing centers, and community reentry centers in the United States, Australia, South Africa, and the United Kingdom. GEO’s diversified services include enhanced in-custody rehabilitation and post-release support through the award-winning GEO Continuum of Care®, secure transportation, electronic monitoring, community-based programs, and correctional health and mental health care. GEO’s worldwide operations include the ownership and/or delivery of support services for 100 facilities totaling approximately 81,000 beds, including idle facilities and projects under development, with a workforce of up to approximately 18,000 employees.
Use of forward-looking statements
This news release may contain “forward-looking statements” within the meaning of Section 21E of the Securities Exchange Act of 1934, as amended, and the U.S. Private Securities Litigation Reform Act of 1995. Readers are cautioned not to place undue reliance on these forward-looking statements and any such forward-looking statements are qualified in their entirety by reference to the cautionary statements and risk factors contained in GEO’s filings with the U.S. Securities and Exchange Commission, including its Form 10-K for the year ended December 31, 2022, its Form 10-Qs for the quarters ended March 31, 2023, June 30, 2023 and September 30, 2023, and its Form 8-K reports. All forward-looking statements speak only as of the date of this news release and are based on current expectations and involve a number of assumptions, risks and uncertainties that could cause the actual results to differ materially from such forward-looking statements. Readers are strongly encouraged to read the full cautionary statements and risk factors contained in GEO’s filings with the U.S. Securities and Exchange Commission, including those referenced above. GEO disclaims any obligation to update or revise any forward-looking statements, except as required by law.
If you didn’t make it to the LIVE event, or even if you did and want to revisit this memorable conference, here’s your opportunity exclusively on Channelchek.
Panels, Special Presentations, and Analyst Takeaways
Dry bulk shipping company Eagle Bulk Shipping (EGLE) announced Sunday night that it has agreed to an all-stock merger with sector peer Star Bulk Carriers Corp. (SBLK). The deal will create one of the world’s premiere owners of dry bulk vessels with a combined fleet of 169 ships worth over $2 billion.
Under the terms of the agreement, Eagle shareholders will receive 2.6211 shares of Star Bulk for each Eagle share they currently hold. With Star Bulk shares closing at $19.95 on Monday, December 11, this values Eagle stock at $52.29 per share. Compared to Eagle’s actual close of $46.19 on Monday, this deal premium comes out to 13%.
Powerhouse in Making
The merger brings together two already sizable dry bulk fleets under one umbrella to better compete on costs and provide customers integrated solutions. For example, the combined entity can offer both Capesize vessels ideal for long haul bulk transport as well as Supramax ships designed for flexibility.
With over 150 million deadweight tonnage (DWT), the new entity will rank among the top five largest publicly-traded dry bulk owners globally. Management estimates at least $50 million per year in cost savings through operational synergies, consolidated corporate overhead, and improved purchasing leverage with suppliers.
And the company will maintain an industry-leading balance sheet with net debt of $1.4 billion equaling a reasonable 37% of its $2.1 billion capitalization. The merger therefore sets up the new Star Bulk as a dominant player in dry bulk shipping both in scale and efficiency. Noble Capital Markets Senior Research Analyst Michael Heim states in his latest research report that “the combined market capitalization of $2.1 billion and fleet of 159 ships makes it one of the largest in the world.”
Modern, Eco-Friendly Fleet
Critically, Star Bulk inherits an even more modern and environmentally-friendly fleet from Eagle. The average vessel age will drop to 11 years versus 14 years currently. Eagle’s ships were built at top-tier Asian shipyards known for quality and efficiency.
Just as important, Eagle has been an early and enthusiastic adopter of exhaust gas scrubbers which reduce harmful emissions. In fact, 97% of the combined fleet will now have these scrubbers installed well positioning the company for impending environmental regulations.
Maintaining a modern, eco-friendly fleet is increasingly important to winning business from customers like commodities giants Glencore and Trafigura who value corporate responsibility. So the transaction gives Star Bulk key competitive advantages on this front.
Market Perform on Limited Remaining Upside
With significant strategic rationale behind the merger, the analyst still downgraded Eagle stock to a Market Perform with limited additional upside. Specifically, they dropped their price target to $52 simply reflecting the implicit deal price.
So while the merger appears to make industrial sense and places fair long-term value on Eagle, investors shouldn’t expect much added price appreciation from current levels. Of course, there is a small chance the merger fails to close as anticipated allowing shares to diverge back downward.
But assuming smooth sailing through the expected close in 1H 2024, Eagle shareholders can take comfort in the 13% premium and exciting combined company outlook. This sets up Eagle owners to become owners in the industry’s next dry bulk titan.
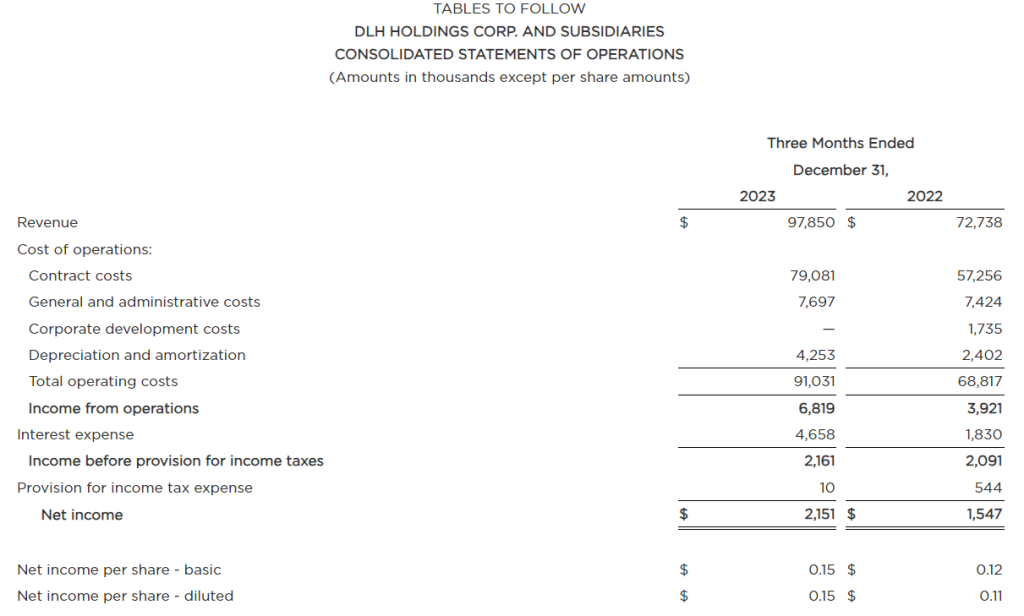
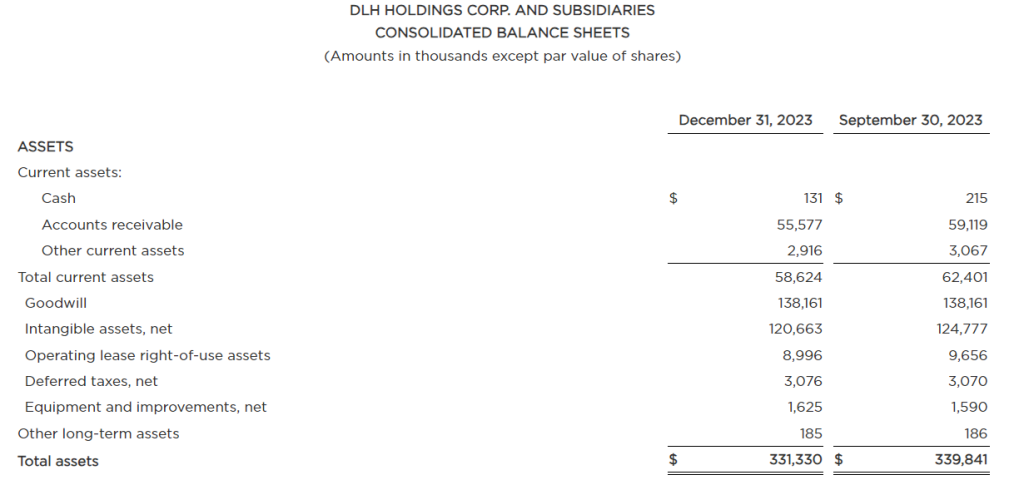
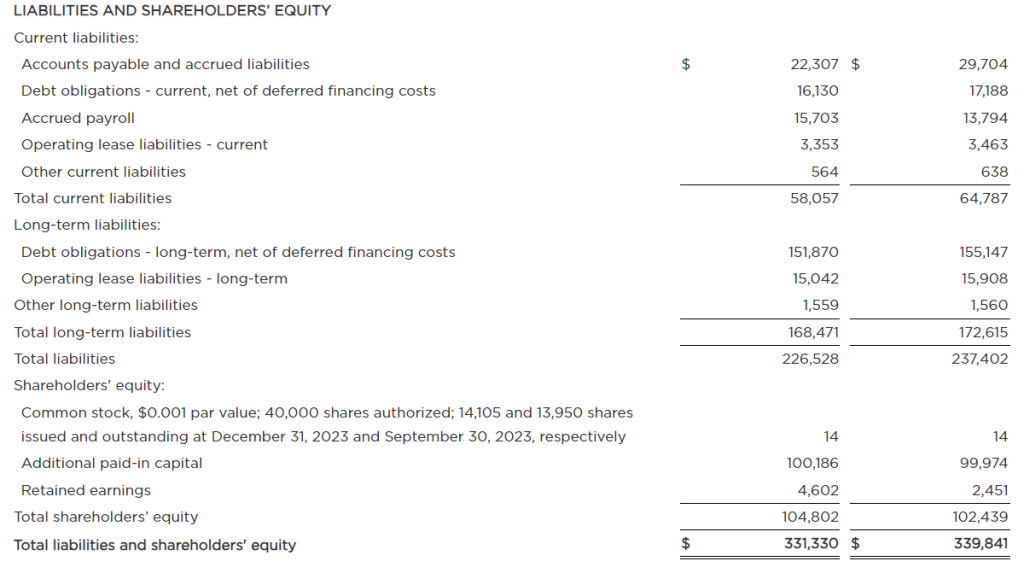
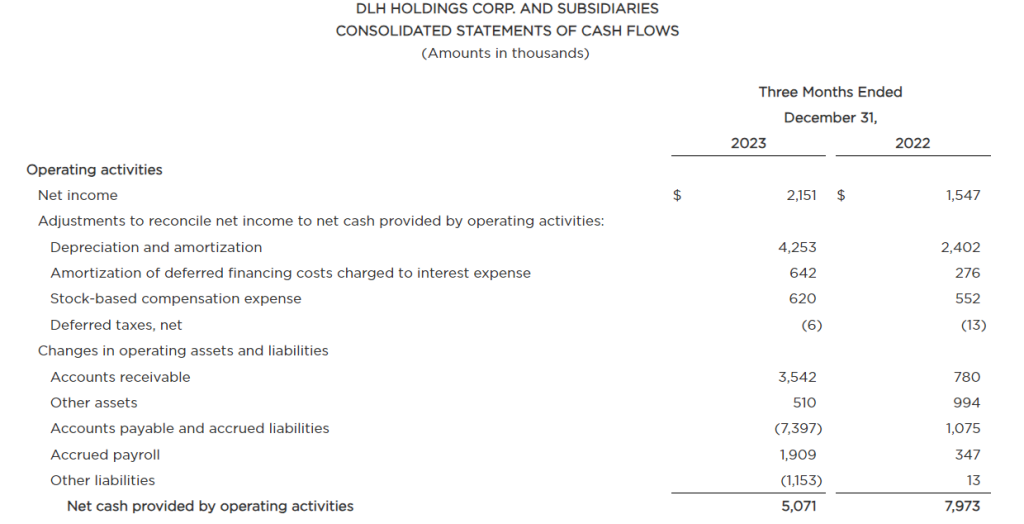
DLH delivers improved health and readiness solutions for federal programs through research, development, and innovative care processes. The Company’s experts in public health, performance evaluation, and health operations solve the complex problems faced by civilian and military customers alike, leveraging digital transformation, artificial intelligence, advanced analytics, cloud-based applications, telehealth systems, and more. With over 2,300 employees dedicated to the idea that “Your Mission is Our Passion,” DLH brings a unique combination of government sector experience, proven methodology, and unwavering commitment to public health to improve the lives of millions. For more information, visit www.DLHcorp.com.
Joe Gomes, Managing Director, Equity Research Analyst, Generalist , Noble Capital Markets, Inc.
Joshua Zoepfel, Research Associate, Noble Capital Markets, Inc.
Refer to the full report for the price target, fundamental analysis, and rating.
4Q Results. Revenue of $101.5 million was slightly above management’s revised guidance of $100 million, and up from $67.2 million in 4Q22. While the majority of the revenue increase was due to GRSi, which contributed $33.1 million, the Company did see organic growth. Due to the expected $7.7 million non-cash impairment charge, DLH reported a net loss of $2.6 million, or $0.18/sh compared to net income of $3.4 million, or EPS of $0.24/sh in 4Q22.
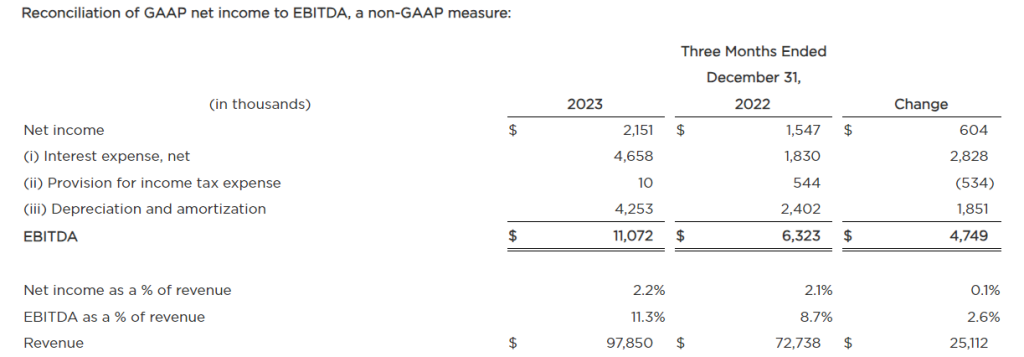
Non-GAAP. On a non-GAAP basis, DLH reported adjusted operating income of $7.8 million, adjusted EBITDA of $12.1 million, and adjusted net income of $2.3 million, or $0.16/sh in 4Q23, compared to $5.1 million, $7.0 million, and $3.7 million, or EPS of $0.26/sh, respectively, last year.
Equity Research is available at no cost to Registered users of Channelchek. Not a Member? Click ‘Join’ to join the Channelchek Community. There is no cost to register, and we never collect credit card information.
This Company Sponsored Research is provided by Noble Capital Markets, Inc., a FINRA and S.E.C. registered broker-dealer (B/D).
*Analyst certification and important disclosures included in the full report. NOTE: investment decisions should not be based upon the content of this research summary. Proper due diligence is required before making any investment decision.
BOCA RATON, Fla.–(BUSINESS WIRE)–Nov. 30, 2023– The GEO Group, Inc. (NYSE: GEO) (“GEO” or the “Company”) announced today that following discussions between GEO and its Chief Executive Officer, Jose Gordo, the parties have agreed that Mr. Gordo will be departing as Chief Executive Officer and as a Board member on mutually agreeable terms and transitioning to the role of an advisor, effective December 31, 2023. Under the agreed terms of his departure, Mr. Gordo will enter into a fixed, 18-month advisory services agreement upon payment terms agreed to by the parties, pursuant to which Mr. Gordo will advise the Company with respect to litigation, client relations, operational issues, growth opportunities, financial management, and debt restructuring. The Company is seeking to continue Mr. Gordo’s services in these specific areas to benefit from his many years of experience in the industry, the deep relationships he has forged inside the Company and with its industry partners, his global operating perspectives, and his specific expertise in a specialized industry.
Brian Evans, who has been with the Company for 23 years and has served as the Company’s Chief Financial Officer for 14 years, has been appointed Chief Executive Officer, effective January 1, 2024. Shayn March, Executive Vice President, Finance and Treasurer, has been appointed Acting Chief Financial Officer, effective January 1, 2024. The Company and its Board of Directors will work with an external search firm to identify a permanent Chief Financial Officer.
Also effective January 1, 2024, Wayne Calabrese has been appointed President and Chief Operating Officer. Mr. Calabrese joined the Company in 1989, retiring as its President and Chief Operating Officer at the end of 2010. Following his service as a Company advisor, Mr. Calabrese rejoined the Company on a full-time basis in 2021 as head of the Legal Department. In 2022, Mr. Calabrese was appointed to his current position as Senior Vice President and Chief Operating Officer.
In addition, the Company confirmed that Dr. George Zoley, the Company’s Founder and Executive Chairman, will step down as Executive Chairman on June 30, 2026, at the end of his current employment term under his Executive Chairman Employment Agreement. Beginning on July 1, 2026, Dr. Zoley will continue his unparalleled 40-plus year industry leadership role as an Advisor to the Company while continuing to serve as the Company’s non-Executive Chairman of the Board of Directors, subject to shareholder approval.
About The GEO Group
The GEO Group, Inc. (NYSE: GEO) is a leading diversified government service provider, specializing in design, financing, development, and support services for secure facilities, processing centers, and community reentry centers in the United States, Australia, South Africa, and the United Kingdom. GEO’s diversified services include enhanced in-custody rehabilitation and post-release support through the award-winning GEO Continuum of Care®, secure transportation, electronic monitoring, community-based programs, and correctional health and mental health care. GEO’s worldwide operations include the ownership and/or delivery of support services for 100 facilities totaling approximately 81,000 beds, including idle facilities and projects under development, with a workforce of up to approximately 18,000 employees.
Use of forward-looking statements
This news release may contain “forward-looking statements” within the meaning of Section 21E of the Securities Exchange Act of 1934, as amended, and the U.S. Private Securities Litigation Reform Act of 1995. Readers are cautioned not to place undue reliance on these forward-looking statements and any such forward-looking statements are qualified in their entirety by reference to the cautionary statements and risk factors contained in GEO’s filings with the U.S. Securities and Exchange Commission, including its Form 10-K for the year ended December 31, 2022, its Form 10-Qs for the quarters ended March 31, 2023, June 30, 2023 and September 30, 2023, and its Form 8-K reports. All forward-looking statements speak only as of the date of this news release and are based on current expectations and involve a number of assumptions, risks and uncertainties that could cause the actual results to differ materially from such forward-looking statements. Readers are strongly encouraged to read the full cautionary statements and risk factors contained in GEO’s filings with the U.S. Securities and Exchange Commission, including those referenced above. GEO disclaims any obligation to update or revise any forward-looking statements, except as required by law.
TROY, Mich., Nov. 29, 2023 /PRNewswire/ — Kelly (Nasdaq: KELYA, KELYB), a leading global specialty talent solutions provider, today announced it will participate in the 19th Annual Noble Capital Markets Emerging Growth Equity Conference at Florida Atlantic University in Boca Raton, Florida, on Monday, December 4, 2023, and Tuesday, December 5, 2023.
Peter Quigley, president and chief executive officer, Olivier Thirot, executive vice president and chief financial officer, Nicola Soares, president of Kelly Education, and Scott Thomas, investor relations, will participate in one-on-one meetings. Kelly’s investor presentation is available on the company’s website.
About Kelly®
Kelly Services, Inc. (Nasdaq: KELYA, KELYB) helps companies recruit and manage skilled workers and helps job seekers find great work. Since inventing the staffing industry in 1946, we have become experts in the many industries and local and global markets we serve. With a network of suppliers and partners around the world, we connect more than 450,000 people with work every year. Our suite of outsourcing and consulting services ensures companies have the people they need, when and where they are needed most. Headquartered in Troy, Michigan, we empower businesses and individuals to access limitless opportunities in industries such as science, engineering, technology, education, manufacturing, retail, finance, and energy. Revenue in 2022 was $5.0 billion. Learn more at kellyservices.com.
Facing mounting criticism after production setbacks and labor unrest rattled investor confidence this year, automaker General Motors (GM) is opening the corporate coffers to initiate a massive $10 billion share repurchase program. The move aims to regain Wall Street’s trust by returning billions to shareholders.
Accelerating Buybacks to Prop Up GM Stock
GM shares have sputtered in 2023, down 14% year-to-date heading into Wednesday’s announcement. The stock dove nearly 5% in October when contract negotiations with the United Auto Workers (UAW) broke down into nationwide strikes, forcing GM to suspend guidance. With electric vehicle launches also lagging internal targets, GM hopes to stop the bleeding and inject positive sentiment through shareholder payouts.
The accelerated buyback comes after GM already spent $3.3 billion repurchasing shares so far this year. By expanding repurchases to $10 billion, GM moves aggressively to reduce outstanding shares and boost key per-share metrics like earnings-per-share.
How The $10 Billion GM Buyback Will Work
Rather than spacing out buybacks over several years, GM is frontloading the program to have maximum near-term impact. The company will immediately receive $6.8 billion worth of its shares from the banks underwriting the plan – Bank of America, Goldman Sachs, Barclays and Citibank.
These banks will then repurchase GM shares on the open market over the next six months. The final tally of shares bought back depends on GM’s average share price during that period. If shares remain around current levels in the $37 range, the full $10 billion could retire nearly 270 million shares – almost 20% of GM’s float.
Such large buybacks often drive share prices higher by soaking up excess supply. It also means per-share financial metrics like earnings, cash flow and dividends appear larger with fewer shares outstanding. For GM to hit the upper end of its newly reinstated earnings-per-share guidance range this year, solid buyback execution will be key.
GM Shareholders Get More Cash Too
In tandem with turbocharging buybacks, GM also announced a 33% dividend hike from 9 cents to 12 cents per share annually. Together, these moves signal a shareholder-friendly turn for the automaker after delays in its electric and autonomous programs led to executive departures.
Rather than flashy visionary promises, GM looks to deliver tangible returns now in the form of cold hard cash. These initiatives could take center stage heading into 2024 as leadership emphasizes financial consistency through a period of technological transition.
For income-focused investors and funds, juicier dividends make GM appear more attractive relative to other automakers and electric vehicle pure plays. Combined with reduced shares outstanding, GM’s 4.2% dividend yield will rise even higher, bringing in more potential shareholders.
Outlook Still Uncertain Beyond 2023
An open question is whether GM can sustain enhanced shareholder returns in the years ahead while simultaneously investing billions in next-generation manufacturing and technology. Many bears argue spreading cash so liberally now leaves GM vulnerable to economic shocks down the road.
But with UAW deals running into 2028 and strains from this year mostly wiped clean, GM can campaign on hitting its earnings guidance in 2024 and rewarding loyal shareholders along the way. Where GM goes from there, however, remains clouded in uncertainty.
Chinese fast fashion juggernaut Shein has filed confidentially for an initial public offering in the U.S., positioning itself to become one of the most highly-anticipated public debuts. As Shein aims to expand its global empire and enormous valuation, the company will need to convince investors it can overcome mounting controversies.
Currently privately held with an estimated $66 billion valuation, Shein is seeking to capitalize on surging investor appetite for ecommerce platforms. By targeting Gen Z and millennial shoppers with on-trend fast fashion at rock-bottom prices, Shein has experienced explosive growth. The company could start trading publicly in the U.S. as early as 2024 if it gains regulatory approval.
Shein Hopes to Captivate Ecommerce Investors
As a digital-only retailer with minimal storefronts, Shein epitomizes many of today’s leading ecommerce firms. With targeted influencer marketing and constantly updated inventory, Shein has won over young consumers across the globe. Revenues reached nearly $16 billion in 2021, making Shein one of the largest fashion retailers based on sales.
This rapid ascent has drawn comparisons to platforms like Pinduoduo and Meituan in China. Shein hopes investors will value it similarly and overlook the controversies it has battled along the way. Skeptics, however, point to lingering risks that could limit Shein’s appeal.
Mounting Concerns Create Obstacles for Shein’s IPO
While Shein has taken steps to revamp public perception, the company faces no shortage of detractors. Lawmakers across the political spectrum have raised alarms over Shein’s supply chain and environmental harms.
Accused of using labor from China’s Xinjiang region linked to human rights abuses, Shein must convince regulators it complies with ethical sourcing standards. The shadowy leadership of founder and CEO Sky Xu also clashes with typical corporate governance. As other Chinese firms face heightened scrutiny and even delisting threats in the U.S., Shein’s close China ties could hamper its reception.
Alongside these issues, fast fashion business models face growing backlash for fueling waste and pollution. Though unlikely to vanish overnight, changing consumer preferences add uncertainty to the sector’s outlook.
Betting on Shein’s Growth Trajectory While risks abound, Shein’s blockbuster financials may simply be too impressive for investors to ignore. Early in its life as a public firm, revenue expansion and user growth will remain the key metrics to watch.
As a veteran of the ultra-fast fashion space, Shein has proven adept at riding waves of consumer demand. The recent downturn for stocks like Farfetch and Revolve point to lingering appetite for digital fashion platforms. Though controversies cast a shadow, for risk-tolerant investors, getting in early with Shein could bring substantial rewards.
ATLANTA, Nov. 27, 2023 (GLOBE NEWSWIRE) — DLH Holdings Corp. (NASDAQ: DLHC) (“DLH” or the “Company”), a leading healthcare and human services provider to the federal government, will release financial results for its fiscal fourth quarter ended September 30, 2023 on December 6, 2023 after the market closes. DLH will then host a conference call for the investment community at 10:00 a.m. Eastern Time the following day, December 7, 2023, during which members of senior management will make a brief presentation focused on the financial results and operating trends. A question-and-answer session will follow.
Interested parties may listen to the conference call by dialing 888-347-5290 or 412-317-5256. Presentation materials will also be posted on the Investor Relations section of the DLH website prior to the commencement of the conference call. A digital recording of the conference call will be available for replay two hours after the completion of the call and can be accessed on the DLH Investor Relations website or by dialing 877-344-7529 and entering the conference ID 4720443.
About DLH DLH (NASDAQ:DLHC) delivers improved health and readiness solutions for federal programs through research, development, and innovative care processes. The Company’s experts in public health, performance evaluation, and health operations solve the complex problems faced by civilian and military customers alike, leveraging digital transformation, artificial intelligence, advanced analytics, cloud-based applications, telehealth systems, and more. With over 3,200 employees dedicated to the idea that “Your Mission is Our Passion,” DLH brings a unique combination of government sector experience, proven methodology, and unwavering commitment to public health to improve the lives of millions. For more information, visit http://www.DLHcorp.com.
INVESTOR RELATIONS Contact: Chris Witty Phone: 646-438-9385 Email: cwitty@darrowir.com
BRENTWOOD, Tenn., Nov. 16, 2023 (GLOBE NEWSWIRE) — CoreCivic, Inc. (NYSE: CXW) (“CoreCivic”) announced today it signed a new management contract with the state of Wyoming for the housing of up to 240 male inmates at the Company’s 2,672-bed Tallahatchie County Correctional Facility in Tutwiler, Mississippi. We previously housed inmates for Wyoming under a management contract that had not been utilized since 2019. The term of the new contract runs through June 30, 2026.
Additionally, CoreCivic signed a new management contract with Harris County, Texas, to house up to 360 male inmates at the Tallahatchie County Correctional Facility. Upon mutual agreement, the County may access an additional 360 beds at the Tallahatchie facility. The initial contract term begins on December 1, 2023, and ends November 30, 2024. The contract may be extended at the County’s option for four additional one-year terms.
Since September 2023, CoreCivic has added contracts with the State of Montana at the Saguaro Correctional Facility as well as with Hinds County (MS), Harris County (TX), and the State of Wyoming at the Tallahatchie County Correctional Facility. CoreCivic anticipates the combined annual revenue of these four contacts to be approximately $25 million.
Damon T. Hininger, President and Chief Executive Officer commented, “We are honored to once again assist the Wyoming Department of Corrections with their correctional needs, and believe this contract demonstrates the essential solutions that we provide to federal, state, and local government agencies. Harris County is a new partnership for CoreCivic, and we look forward to providing the County with a flexible capacity solution.”
Hininger continued, “These new contracts further reinforce the versatility of our real estate assets. Utilizing existing bed inventory is key to driving margin improvement at CoreCivic. These recent contract wins demonstrate both strong contracting progress and the high levels of interest in our services and assets from existing and new governmental partners.”
About CoreCivic
CoreCivic is a diversified, government-solutions company with the scale and experience needed to solve tough government challenges in flexible, cost-effective ways. We provide a broad range of solutions to government partners that serve the public good through high-quality corrections and detention management, a network of residential and non-residential alternatives to incarceration to help address America’s recidivism crisis, and government real estate solutions. We are the nation’s largest owner of partnership correctional, detention and residential reentry facilities, and one of the largest prison operators in the United States. We have been a flexible and dependable partner for government for 40 years. Our employees are driven by a deep sense of service, high standards of professionalism and a responsibility to help government better the public good. Learn more at www.corecivic.com.
Forward-Looking Statements
This press release contains statements as to our beliefs and expectations of the outcome of future events that are “forward-looking” statements within the meaning of Section 21E of the Securities Exchange Act of 1934, as amended, and the Private Securities Litigation Reform Act of 1995, as amended. These forward-looking statements are subject to risks and uncertainties that could cause actual results to differ materially from the statements made. These include, but are not limited to, the risks and uncertainties associated with: (i) changes in government policy, legislation and regulations that affect utilization of the private sector for corrections, detention, and residential reentry services, in general, or our business, in particular, including, but not limited to, the continued utilization of our correctional and detention facilities by the federal government, including as a consequence of the United States Department of Justice, or DOJ, not renewing contracts as a result of President Biden’s Executive Order on Reforming Our Incarceration System to Eliminate the Use of Privately Operated Criminal Detention Facilities, impacting utilization primarily by the Federal Bureau of Prisons and the United States Marshals Service, and the impact of any changes to immigration reform and sentencing laws (we do not, under longstanding policy, lobby for or against policies or legislation that would determine the basis for, or duration of, an individual’s incarceration or detention); (ii) our ability to obtain and maintain correctional, detention, and residential reentry facility management contracts because of reasons including, but not limited to, sufficient governmental appropriations, contract compliance, negative publicity and effects of inmate disturbances; (iii) changes in the privatization of the corrections and detention industry, the acceptance of our services, the timing of the opening of new facilities and the commencement of new management contracts (including the extent and pace at which new contracts are utilized), as well as our ability to utilize available beds; (iv) general economic and market conditions, including, but not limited to, the impact governmental budgets can have on our contract renewals and renegotiations, per diem rates, and occupancy; (v) fluctuations in our operating results because of, among other things, changes in occupancy levels; competition; contract renegotiations or terminations; inflation and other increases in costs of operations, including a continuing rise in labor costs; fluctuations in interest rates and risks of operations; (vi) the impact resulting from the termination of Title 42, the federal government’s policy to deny entry at the United States southern border to asylum-seekers and anyone crossing the southern border without proper documentation or authority in an effort to contain the spread of the coronavirus and related variants, or COVID-19; (vii) government budget uncertainty, the impact of the debt ceiling and the potential for government shutdowns and changing funding priorities; (viii) our ability to successfully identify and consummate future development and acquisition opportunities and realize projected returns resulting therefrom; (ix) our ability to have met and maintained qualification for taxation as a real estate investment trust, or REIT, for the years we elected REIT status; and (x) the availability of debt and equity financing on terms that are favorable to us, or at all. Other factors that could cause operating and financial results to differ are described in the filings we make from time to time with the Securities and Exchange Commission.
We take no responsibility for updating the information contained in this press release following the date hereof to reflect events or circumstances occurring after the date hereof or the occurrence of unanticipated events or for any changes or modifications made to this press release or the information contained herein by any third-parties, including, but not limited to, any wire or internet services.
Contact:
Investors: Michael Grant – Managing Director, Investor Relations – (615) 263-6957 Financial Media: David Gutierrez, Dresner Corporate Services – (312) 780-7204
New Contract and Contract Renewal Momentum Continues
BRENTWOOD, Tenn., Nov. 14, 2023 (GLOBE NEWSWIRE) — CoreCivic, Inc. (NYSE: CXW) (“CoreCivic”) announced today it signed a new management contract with the state of Montana for the housing of up to 120 inmates at the Company’s 1,896-bed Saguaro Correctional Facility in Eloy, Arizona.
The new management contract commences immediately and ends October 31, 2025. The contract may be extended by mutual agreement. The total term, including renewals, may not exceed seven years. We anticipate completing the receipt of the inmates from Montana at the Saguaro facility by December 31, 2023.
Damon T. Hininger, President and Chief Executive Officer commented, “We are grateful for our longstanding partnership with the Montana Department of Corrections and honored by the opportunity to meet their evolving needs at both our Crossroads Correctional Facility in Shelby, Montana as well as at our Saguaro Correctional Facility in Eloy, Arizona. Our modern Saguaro facility, built in 2007, will now care for incarcerated individuals for three different state partners.”
Hininger continued, “This new contract further reflects the attractiveness of our available bed capacity as well as the high level of service and trust for which CoreCivic is recognized. We continue to anticipate heightened need for our modern and flexible capacity from states and local agencies, as well as from Federal partners.”
About CoreCivic
CoreCivic is a diversified, government-solutions company with the scale and experience needed to solve tough government challenges in flexible, cost-effective ways. We provide a broad range of solutions to government partners that serve the public good through high-quality corrections and detention management, a network of residential and non-residential alternatives to incarceration to help address America’s recidivism crisis, and government real estate solutions. We are the nation’s largest owner of partnership correctional, detention and residential reentry facilities, and one of the largest prison operators in the United States. We have been a flexible and dependable partner for government for 40 years. Our employees are driven by a deep sense of service, high standards of professionalism and a responsibility to help government better the public good. Learn more at www.corecivic.com.
Forward-Looking Statements
This press release contains statements as to our beliefs and expectations of the outcome of future events that are “forward-looking” statements within the meaning of Section 21E of the Securities Exchange Act of 1934, as amended, and the Private Securities Litigation Reform Act of 1995, as amended. These forward-looking statements are subject to risks and uncertainties that could cause actual results to differ materially from the statements made. These include, but are not limited to, the risks and uncertainties associated with: (i) changes in government policy, legislation and regulations that affect utilization of the private sector for corrections, detention, and residential reentry services, in general, or our business, in particular, including, but not limited to, the continued utilization of our correctional and detention facilities by the federal government, including as a consequence of the United States Department of Justice, or DOJ, not renewing contracts as a result of President Biden’s Executive Order on Reforming Our Incarceration System to Eliminate the Use of Privately Operated Criminal Detention Facilities, impacting utilization primarily by the Federal Bureau of Prisons and the United States Marshals Service, and the impact of any changes to immigration reform and sentencing laws (we do not, under longstanding policy, lobby for or against policies or legislation that would determine the basis for, or duration of, an individual’s incarceration or detention); (ii) our ability to obtain and maintain correctional, detention, and residential reentry facility management contracts because of reasons including, but not limited to, sufficient governmental appropriations, contract compliance, negative publicity and effects of inmate disturbances; (iii) changes in the privatization of the corrections and detention industry, the acceptance of our services, the timing of the opening of new facilities and the commencement of new management contracts (including the extent and pace at which new contracts are utilized), as well as our ability to utilize available beds; (iv) general economic and market conditions, including, but not limited to, the impact governmental budgets can have on our contract renewals and renegotiations, per diem rates, and occupancy; (v) fluctuations in our operating results because of, among other things, changes in occupancy levels; competition; contract renegotiations or terminations; inflation and other increases in costs of operations, including a continuing rise in labor costs; fluctuations in interest rates and risks of operations; (vi) the impact resulting from the termination of Title 42, the federal government’s policy to deny entry at the United States southern border to asylum-seekers and anyone crossing the southern border without proper documentation or authority in an effort to contain the spread of the coronavirus and related variants, or COVID-19; (vii) government budget uncertainty, the impact of the debt ceiling and the potential for government shutdowns and changing funding priorities; (viii) our ability to successfully identify and consummate future development and acquisition opportunities and realize projected returns resulting therefrom; (ix) our ability to have met and maintained qualification for taxation as a real estate investment trust, or REIT, for the years we elected REIT status; and (x) the availability of debt and equity financing on terms that are favorable to us, or at all. Other factors that could cause operating and financial results to differ are described in the filings we make from time to time with the Securities and Exchange Commission.
We take no responsibility for updating the information contained in this press release following the date hereof to reflect events or circumstances occurring after the date hereof or the occurrence of unanticipated events or for any changes or modifications made to this press release or the information contained herein by any third-parties, including, but not limited to, any wire or internet services.
Contact:
Investors: Michael Grant – Managing Director, Investor Relations – (615) 263-6957
Financial Media: David Gutierrez, Dresner Corporate Services – (312) 780-7204

BOCA RATON, Fla., Nov. 09, 2023 (GLOBE NEWSWIRE) — via InvestorWire — Noble Capital Markets, Inc. (“Noble”) today announces that Seeking Alpha (https://seekingalpha.com/), the world’s leading investing community, will be a prominent sponsor at NobleCon19 (NobleCon19.com), Noble’s 19th Annual Emerging Growth Equity Conference, to be held at Florida Atlantic University, College of Business, Executive Education, Dec. 3-5, 2023, in Boca Raton, Florida. NobleCon19 will feature 200 public company executives, corporate presentations, breakouts, 1×1 meetings with qualified attendees, provocative panels, and a keynote fireside chat featuring the 43rd President of the United States, George W. Bush, moderated by Noble’s Director of Research, Michael Kupinski.
As a sponsor, Seeking Alpha will play a significant role in enhancing the conference experience for attendees. Participants can look forward to engaging discussions, expert insights, and valuable networking opportunities facilitated by Seeking Alpha’s presence. The company’s participation underscores its dedication to empowering investors with high-quality, actionable research and analysis. As part of the sponsorship, Steven Cress, Seeking Alpha’s Head of Quantitative Strategies, will dive deeper into Seeking Alpha’s Quant System and its top picks for 2024, in a presentation preceding the George W. Bush keynote.
“We are thrilled to have Seeking Alpha on board as a sponsor for NobleCon19,” said Nico P. Pronk, CEO of Noble Capital Markets, the host of NobleCon19. “Their research and analysis tools and resources for the investment community align perfectly with the objectives of our conference. We believe their involvement will enhance the overall event, providing attendees with valuable perspectives and knowledge.”
During the conference, Seeking Alpha representatives will be available at their booth, which will also be the official NobleCon19 coffee station, to interact with attendees, demonstrate their platform’s capabilities, and discuss the latest trends in investment research. Attendees are encouraged to visit the Seeking Alpha booth to learn more about their innovative solutions and how they can benefit individual investors, financial professionals and institutions alike.
“We are excited to sponsor NobleCon19 and engage with industry experts, investors and thought leaders,” said Mayer Reich, Vice President of Marketing at Seeking Alpha. “This conference represents an excellent opportunity for us to connect with our community and share insights. We look forward to productive discussions and meaningful interactions throughout the event.”
To register to attend NobleCon19: NobleCon19.com. To receive NobleCon agenda updates and registration opportunities, join Channelchek.com, Noble’s online investment community, listing more than 6,000 public emerging growth companies. This is an open-access site with no cost (ever) to join. Companies with market capitalization of $3 billion or less wishing to learn more about presenting at NobleCon19 can Inquire Here.
About Seeking Alpha: Seeking Alpha is the world’s leading investing community, where investors connect daily to discover and share new investing ideas, discuss the latest news, debate the merits of stocks, and make informed investment decisions. Seeking Alpha’s content has unparalleled breadth and depth: from stocks, ETFs and mutual funds to commodities and cryptocurrency. Seeking Alpha gives investors access to professional-caliber research tools – including factor grades and quant ratings that summarize each stock’s characteristics. Seeking Alpha empowers investors to make the absolute best investing decisions by leveraging independent and balanced stock research, fundamental analysis tools, crowdsourced debate, news and actionable market data. Seeking Alpha is not a licensed securities dealer, broker or U.S. investment adviser or investment bank.
About Noble Capital Markets: Noble Capital Markets, Inc. was incorporated in 1984 as a full-service SEC / FINRA registered broker-dealer, dedicated exclusively to serving underfollowed emerging growth companies through investment banking, wealth management, trading & execution, and equity research activities. Over the past 39 years, Noble has raised billions of dollars for companies and published more than 45,000 equity research reports. www.noblecapitalmarkets.com contact@noblecapitalmarkets.com.
Q3 operating earnings were break-even, or up 60% to $15.5 million on an adjusted basis
Q3 revenue down 4.3%; down 5.8% in constant currency
Q3 adjusted EBITDA margin increased to 2.3% compared to 1.6% in the prior year driven by meaningful reduction in operating expenses resulting from business transformation initiative
Company expects sale of European staffing operations and near-term outcome from growth initiatives to drive further expansion of adjusted EBITDA margin
TROY, Mich., Nov. 9, 2023 /PRNewswire/ — Kelly (Nasdaq: KELYA, KELYB), a leading global specialty talent solutions provider, today announced results for the third quarter of 2023.
Peter Quigley, president and chief executive officer, announced revenue for the third quarter of 2023 totaled $1.1 billion, a 4.3% decrease, or 5.8% decrease in constant currency, compared to the corresponding quarter of 2022. Year-over-year revenue trends were impacted by customers’ more guarded approach to hiring and initiating new projects or capital spending, partially offset by favorable currency impacts.
“In the third quarter, persistent macroeconomic uncertainty continued to temper demand for temporary and permanent staffing services,” said Quigley. “As expected, results in SET and P&I reflected these challenges, while our Education segment and more resilient outcome-based solutions in P&I once again delivered year-over-year growth. We continued to focus on what we can control in this challenging operating environment, driving significant progress in the execution of our transformation initiatives – the benefits of which are evident in our operating results.”
Kelly reported break-even operating earnings in the third quarter of 2023 compared to a loss of $21.4 million reported in the third quarter of 2022. Earnings in the third quarter of 2023 include $15.4 million of transformation-related charges. Excluding the transformation-related charges, adjusted earnings from operations were $15.5 million. Loss from operations in the third quarter of 2022 included a $30.7 million goodwill impairment charge and adjusted earnings were $9.5 million. Adjusted earnings improved 60% year-over-year primarily as a result of lower operating expenses due to our ongoing transformation initiatives.
Earnings per share in the third quarter of 2023 were $0.18 compared to a loss per share of $0.43 in the third quarter of 2022. Included in the earnings per share in the third quarter of 2023 is a $0.32 loss per share related to transformation-related charges, net of tax. Included in the third quarter of 2022 was a $0.67 loss per share, net of tax, from a goodwill impairment charge. On an adjusted basis, earnings per share were $0.50 in the third quarter of 2023, double the $0.25 earnings per share in the corresponding quarter of 2022.
Quigley went on to provide an update on the company’s business transformation initiative.
“Following the implementation of strategic restructuring activities at the outset of the third quarter, we remained focused on sustaining these structural improvements across the enterprise. We also made progress on several initiatives that are positioning Kelly to accelerate profitable growth over the long term. With the efficiency phase of our transformation on-track, our growth initiatives delivering encouraging early results, and the sale of our European staffing business poised to benefit both of these efforts, we remain committed to driving continued improvement of our adjusted EBITDA margin and maximizing value creation.”
In the fourth quarter of 2023, Kelly expects to achieve an adjusted EBITDA margin in the range of 2.8% to 3.0%, reflecting the impact of market conditions that are more challenging than anticipated. Assuming the benefit of a full year of its transformation-related savings, the sale of its European staffing business and current top-line trends, the company would expect to reach a normalized, adjusted EBITDA margin in the range of 3.3 to 3.5%.
Kelly also reported that on November 7, its board of directors declared a dividend of $0.075 per share. The dividend is payable on December 6, 2023, to shareholders of record as of the close of business on November 22, 2023.
In conjunction with its third-quarter earnings release, Kelly has published a financial presentation on the Investor Relations page of its public website and will host a conference call at 9 a.m. ET on November 9 to review the results and answer questions. The call may be accessed in one of the following ways:
Via the Telephone (877) 692-8955 (toll free) or (234) 720-6979 (caller paid) Enter access code 5728672 After the prompt, please enter ”#”
A recording of the conference call will be available after 2:30 p.m. ET on November 9, 2023, at (866) 207-1041 (toll-free) and (402) 970-0847 (caller-paid). The access code is 7027637#. The recording will also be available at kellyservices.com during this period.
This release contains statements that are forward looking in nature and, accordingly, are subject to risks and uncertainties. These statements are made under the “safe harbor” provisions of the U.S. Private Securities Litigation Reform Act of 1995. Statements that are not historical facts, including statements about Kelly’s financial expectations, are forward-looking statements. Factors that could cause actual results to differ materially from those contained in this release include, but are not limited to, (i) changing market and economic conditions, (ii) disruption in the labor market and weakened demand for human capital resulting from technological advances, loss of large corporate customers and government contractor requirements, (iii) the impact of laws and regulations (including federal, state and international tax laws), (iv) unexpected changes in claim trends on workers’ compensation, unemployment, disability and medical benefit plans, (v) litigation and other legal liabilities (including tax liabilities) in excess of our estimates, (vi) our ability to achieve our business’s anticipated growth strategies, (vii) our future business development, results of operations and financial condition, (viii) damage to our brands, (ix) dependency on third parties for the execution of critical functions, (x) conducting business in foreign countries, including foreign currency fluctuations, (xi) availability of temporary workers with appropriate skills required by customers, (xii) cyberattacks or other breaches of network or information technology security, and (xiii) other risks, uncertainties and factors discussed in this release and in the Company’s filings with the Securities and Exchange Commission. In some cases, forward-looking statements can be identified by words or phrases such as “may,” “will,” “expect,” “anticipate,” “target,” “aim,” “estimate,” “intend,” “plan,” “believe,” “potential,” “continue,” “is/are likely to” or other similar expressions. All information provided in this press release is as of the date of this press release and we undertake no duty to update any forward-looking statement to conform the statement to actual results or changes in the Company’s expectations.
About Kelly®
Kelly Services, Inc. (Nasdaq: KELYA, KELYB) helps companies recruit and manage skilled workers and helps job seekers find great work. Since inventing the staffing industry in 1946, we have become experts in the many industries and local and global markets we serve. With a network of suppliers and partners around the world, we connect more than 450,000 people with work every year. Our suite of outsourcing and consulting services ensures companies have the people they need, when and where they are needed most. Headquartered in Troy, Michigan, we empower businesses and individuals to access limitless opportunities in industries such as science, engineering, technology, education, manufacturing, retail, finance, and energy. Revenue in 2022 was $5.0 billion. Learn more at kellyservices.com.
FOR THE 13 WEEKS ENDED OCTOBER 1, 2023 AND OCTOBER 2, 2022
(UNAUDITED)
(In millions of dollars except per share data)
%
CC %
2023
2022
Change
Change
Change
Revenue from services
$
1,118.0
$
1,167.9
$
(49.9)
(4.3)
%
(5.8)
%
Cost of services
889.5
927.3
(37.8)
(4.1)
Gross profit
228.5
240.6
(12.1)
(5.1)
(6.3)
Selling, general and administrative expenses
228.4
231.1
(2.7)
(1.2)
(2.4)
Goodwill impairment charge
—
30.7
(30.7)
NM
Loss on disposal
—
0.2
(0.2)
NM
Earnings (loss) from operations
0.1
(21.4)
21.5
NM
Other income (expense), net
1.6
0.2
1.4
NM
Earnings (loss) before taxes
1.7
(21.2)
22.9
NM
Income tax expense (benefit)
(4.9)
(5.0)
0.1
0.1
Net earnings (loss)
$
6.6
$
(16.2)
$
22.8
NM
Basic earnings (loss) per share
$
0.18
$
(0.43)
$
0.61
NM
Diluted earnings (loss) per share
$
0.18
$
(0.43)
$
0.61
NM
STATISTICS:
Permanent placement revenue (included in revenue from services)
$
14.6
$
19.8
$
(5.2)
(26.3)
%
(28.5)
%
Gross profit rate
20.4
%
20.6
%
(0.2)
pts.
Conversion rate
0.0
%
(8.9)
%
8.9
pts.
Adjusted EBITDA
$
25.5
$
19.1
$
6.4
Adjusted EBITDA margin
2.3
%
1.6
%
0.7
pts.
Effective income tax rate
(299.3)
%
23.4
%
(322.7)
pts.
Average number of shares outstanding (millions):
Basic
35.4
37.9
Diluted
35.8
37.9
KELLY SERVICES, INC. AND SUBSIDIARIES
CONSOLIDATED STATEMENTS OF EARNINGS
FOR THE 39 WEEKS ENDED OCTOBER 1, 2023 AND OCTOBER 2, 2022
(UNAUDITED)
(In millions of dollars except per share data)
%
CC %
2023
2022
Change
Change
Change
Revenue from services
$
3,603.5
$
3,731.6
$
(128.1)
(3.4)
%
(3.8)
%
Cost of services
2,880.3
2,970.0
(89.7)
(3.0)
Gross profit
723.2
761.6
(38.4)
(5.0)
(5.2)
Selling, general and administrative expenses
703.8
707.3
(3.5)
(0.5)
(0.8)
Asset impairment charge
2.4
—
2.4
NM
Goodwill impairment charge
—
30.7
(30.7)
NM
Loss on disposal
—
18.7
(18.7)
NM
Gain on sale of assets
—
(5.3)
5.3
NM
Earnings from operations
17.0
10.2
6.8
67.0
Loss on investment in Persol Holdings
—
(67.2)
67.2
NM
Loss on currency translation from liquidation of subsidiary(1)
—
(20.4)
20.4
NM
Other income (expense), net
3.0
1.9
1.1
55.9
Earnings (loss) before taxes and equity in net earnings of affiliate
20.0
(75.5)
95.5
NM
Income tax expense (benefit)
(5.0)
(13.1)
8.1
61.8
Net earnings (loss) before equity in net earnings of affiliate
25.0
(62.4)
87.4
NM
Equity in net earnings of affiliate
—
0.8
(0.8)
NM
Net earnings (loss)
$
25.0
$
(61.6)
$
86.6
NM
Basic earnings (loss) per share
$
0.68
$
(1.62)
$
2.30
NM
Diluted earnings (loss) per share
$
0.67
$
(1.62)
$
2.29
NM
STATISTICS:
Permanent placement revenue (included in revenue from services)
$
47.8
$
71.2
$
(23.4)
(32.9)
%
(33.3)
%
Gross profit rate
20.1
%
20.4
%
(0.3)
pts.
Conversion rate
2.4
%
1.3
%
1.1
pts.
Adjusted EBITDA
$
76.9
$
81.5
$
(4.6)
Adjusted EBITDA margin
2.1
%
2.2
%
(0.1)
pts.
Effective income tax rate
(25.1)
%
17.4
%
(42.5)
pts.
Average number of shares outstanding (millions):
Basic
36.2
38.2
Diluted
36.5
38.2
(1) Subsequent to the sale of the Persol Holdings investment, the Company commenced the dissolution process of the Kelly Services Japan subsidiary, which was considered substantially liquidated as of the first quarter-end 2022, resulting in the recognition of the $20.4 million loss on currency translation from liquidation of this subsidiary in the first quarter of 2022.
KELLY SERVICES, INC. AND SUBSIDIARIES
RESULTS OF OPERATIONS BY SEGMENT
(UNAUDITED)
(In millions of dollars)
Third Quarter
%
CC %
2023
2022
Change
Change
Professional & Industrial
Revenue from services
$
364.5
$
408.6
(10.8)
%
(10.5)
%
Gross profit
65.5
70.3
(6.9)
(6.5)
SG&A expenses excluding restructuring charges
53.7
65.3
(17.7)
(17.6)
Restructuring charges
4.0
—
NM
NM
Total SG&A expenses
57.7
65.3
(11.6)
(11.4)
Earnings from operations
7.8
5.0
54.2
Earnings from operations excluding restructuring charges
11.8
5.0
133.7
Gross profit rate
17.9
%
17.2
%
0.7
pts.
Science, Engineering & Technology
Revenue from services
$
295.7
$
321.3
(8.0)
%
(8.0)
%
Gross profit
68.0
76.3
(10.8)
(10.9)
Total SG&A expenses
47.8
53.4
(10.4)
(10.5)
Earnings from operations
20.2
22.9
(11.7)
Gross profit rate
23.0
%
23.7
%
(0.7)
pts.
Education
Revenue from services
$
128.1
$
104.3
22.9
%
22.9
%
Gross profit
19.8
16.6
19.2
19.2
Total SG&A expenses
22.4
21.4
5.0
5.0
Earnings (loss) from operations
(2.6)
(4.8)
44.8
Gross profit rate
15.5
%
15.9
%
(0.4)
pts.
Outsourcing & Consulting
Revenue from services
$
114.1
$
118.5
(3.8)
%
(4.0)
%
Gross profit
41.5
44.1
(6.0)
(6.7)
SG&A expenses excluding restructuring charges
37.2
37.7
(1.5)
(2.4)
Restructuring charges
1.8
—
NM
NM
Total SG&A expenses
39.0
37.7
3.3
2.2
Goodwill impairment charge
—
30.7
NM
Earnings (loss) from operations
2.5
(24.3)
NM
Earnings (loss) from operations excluding restructuring charges
4.3
(24.3)
NM
Gross profit rate
36.4
%
37.2
%
(0.8)
pts.
International
Revenue from services
$
220.6
$
215.5
2.4
%
(6.2)
%
Gross profit
33.7
33.3
1.0
(7.6)
Total SG&A expenses
31.2
31.4
(0.7)
(8.7)
Earnings from operations
2.5
1.9
27.5
Gross profit rate
15.3
%
15.5
%
(0.2)
pts.
KELLY SERVICES, INC. AND SUBSIDIARIES
RESULTS OF OPERATIONS BY SEGMENT
(UNAUDITED)
(In millions of dollars)
September Year to Date
%
CC %
2023
2022
Change
Change
Professional & Industrial
Revenue from services
$
1,131.3
$
1,268.7
(10.8)
%
(10.4)
%
Gross profit
200.4
231.2
(13.3)
(12.8)
SG&A expenses excluding restructuring charges
176.5
203.8
(13.4)
(13.1)
Restructuring charges
7.3
0.3
NM
NM
Total SG&A expenses
183.8
204.1
(9.9)
(9.6)
Asset impairment charge
0.3
—
NM
Earnings from operations
16.3
27.1
(40.4)
Earnings from operations excluding restructuring charges
23.6
27.4
(14.4)
Gross profit rate
17.7
%
18.2
%
(0.5)
pts.
Science, Engineering & Technology
Revenue from services
$
903.5
$
962.7
(6.2)
%
(6.1)
%
Gross profit
207.4
225.3
(7.9)
(7.9)
Total SG&A expenses
150.6
161.4
(6.7)
(6.7)
Asset impairment charge
0.1
—
NM
Earnings from operations
56.7
63.9
(11.2)
Gross profit rate
23.0
%
23.4
%
(0.4)
pts.
Education
Revenue from services
$
583.9
$
433.2
34.8
%
34.8
%
Gross profit
91.6
69.2
32.4
32.4
Total SG&A expenses
69.3
60.4
14.8
14.8
Earnings from operations
22.3
8.8
152.7
Gross profit rate
15.7
%
16.0
%
(0.3)
pts.
Outsourcing & Consulting
Revenue from services
$
342.4
$
352.0
(2.7)
%
(2.3)
%
Gross profit
124.4
127.6
(2.5)
(2.0)
SG&A expenses excluding restructuring charges
114.9
111.7
2.8
2.7
Restructuring charges
2.3
0.1
NM
NM
Total SG&A expenses
117.2
111.8
4.7
4.6
Asset impairment charge
2.0
—
NM
Goodwill impairment charge
—
30.7
NM
Earnings from operations
5.2
(14.9)
NM
Earnings from operations excluding restructuring charges
7.5
(14.8)
NM
Gross profit rate
36.3
%
36.3
%
—
pts.
International
Revenue from services
$
657.5
$
715.9
(8.2)
%
(11.2)
%
Gross profit
99.4
108.3
(8.2)
(11.1)
Total SG&A expenses
96.2
99.2
(3.0)
(5.8)
Earnings from operations
3.2
9.1
(64.9)
Gross profit rate
15.1
%
15.1
%
—
pts.
KELLY SERVICES, INC. AND SUBSIDIARIES
CONSOLIDATED BALANCE SHEETS
(UNAUDITED)
(In millions of dollars)
October 1, 2023
January 1, 2023
October 2, 2022
Current Assets
Cash and equivalents
$
117.2
$
153.7
$
122.4
Trade accounts receivable, less allowances of
$11.1, $11.2, and $12.1, respectively
1,388.2
1,491.6
1,519.9
Prepaid expenses and other current assets
86.1
69.9
83.1
Assets held for sale
—
—
4.7
Total current assets
1,591.5
1,715.2
1,730.1
Noncurrent Assets
Property and equipment, net
28.8
27.8
24.9
Operating lease right-of-use assets
59.9
66.8
67.3
Deferred taxes
315.3
299.7
300.7
Goodwill, net
151.1
151.1
161.4
Other assets
403.4
403.2
397.5
Total noncurrent assets
958.5
948.6
951.8
Total Assets
$
2,550.0
$
2,663.8
$
2,681.9
Current Liabilities
Short-term borrowings
$
—
$
0.7
$
0.1
Accounts payable and accrued liabilities
647.5
723.3
735.2
Operating lease liabilities
13.2
14.7
14.4
Accrued payroll and related taxes
287.8
315.8
321.4
Accrued workers’ compensation and other claims
22.8
22.9
24.4
Income and other taxes
54.0
51.4
47.5
Total current liabilities
1,025.3
1,128.8
1,143.0
Noncurrent Liabilities
Operating lease liabilities
51.5
55.0
55.6
Accrued workers’ compensation and other claims
40.5
40.7
43.4
Accrued retirement benefits
185.6
174.1
172.7
Other long-term liabilities
11.4
11.0
14.5
Total noncurrent liabilities
289.0
280.8
286.2
Stockholders’ Equity
Common stock
38.5
38.5
38.5
Treasury stock
(57.4)
(20.1)
(12.4)
Paid-in capital
29.3
28.0
26.6
Earnings invested in the business
1,233.0
1,216.3
1,220.1
Accumulated other comprehensive income (loss)
(7.7)
(8.5)
(20.1)
Total stockholders’ equity
1,235.7
1,254.2
1,252.7
Total Liabilities and Stockholders’ Equity
$
2,550.0
$
2,663.8
$
2,681.9
STATISTICS:
Working Capital
$
566.2
$
586.4
$
587.1
Current Ratio
1.6
1.5
1.5
Debt-to-capital %
0.0
%
0.1
%
0.0
%
Global Days Sales Outstanding
63
61
64
Year-to-Date Free Cash Flow
$
21.0
$
(88.3)
$
(117.3)
KELLY SERVICES, INC. AND SUBSIDIARIES
CONSOLIDATED STATEMENTS OF CASH FLOWS
FOR THE 39 WEEKS ENDED OCTOBER 1, 2023 AND OCTOBER 2, 2022
(UNAUDITED)
(In millions of dollars)
2023
2022
Cash flows from operating activities:
Net earnings (loss)
$
25.0
$
(61.6)
Adjustments to reconcile net earnings (loss) to net cash from operating activities:
Asset impairment charge
2.4
—
Goodwill impairment charge
—
30.7
Deferred income taxes on goodwill impairment charge
—
(5.3)
Loss on disposal
—
18.7
Depreciation and amortization
25.6
24.7
Operating lease asset amortization
12.4
14.2
Provision for credit losses and sales allowances
1.4
1.7
Stock-based compensation
7.9
5.9
Gain on sale of equity securities
(2.0)
—
Loss on investment in Persol Holdings
—
67.2
Loss on currency translation from liquidation of subsidiary
—
20.4
Gain on foreign currency remeasurement
—
(5.5)
Gain on sale of assets
—
(5.3)
Equity in net earnings of PersolKelly Asia Pacific
—
(0.8)
Other, net
0.5
3.5
Changes in operating assets and liabilities, net of acquisition
(39.8)
(220.2)
Net cash from (used in) operating activities
33.4
(111.7)
Cash flows from investing activities:
Capital expenditures
(12.4)
(5.6)
Proceeds from sale of assets
—
4.5
Acquisition of company, net of cash received
—
(143.1)
Cash disposed from sale of Russia, net of proceeds
—
(6.0)
Proceeds from company-owned life insurance
—
1.5
Proceeds from sale of Persol Holdings investment
—
196.9
Proceeds from sale of equity method investment
—
119.5
Proceeds from equity securities
2.0
—
Other investing activities
(0.4)
—
Net cash (used in) from investing activities
(10.8)
167.7
Cash flows from financing activities:
Net change in short-term borrowings
(0.7)
0.2
Financing lease payments
(1.0)
(1.2)
Dividend payments
(8.3)
(7.7)
Payments of tax withholding for stock awards
(1.7)
(0.9)
Buyback of common shares
(42.2)
(27.2)
Contingent consideration payments
(2.5)
(0.7)
Other financing activities
(0.2)
0.1
Net cash used in financing activities
(56.6)
(37.4)
Effect of exchange rates on cash, cash equivalents and restricted cash
(1.9)
(7.4)
Net change in cash, cash equivalents and restricted cash
(35.9)
11.2
Cash, cash equivalents and restricted cash at beginning of period
162.4
119.5
Cash, cash equivalents and restricted cash at end of period
$
126.5
$
130.7
KELLY SERVICES, INC. AND SUBSIDIARIES
REVENUE FROM SERVICES BY GEOGRAPHY
(UNAUDITED)
(In millions of dollars)
Third Quarter
%
CC %
2023
2022
Change
Change
Americas
United States
$
795.5
$
861.0
(7.6)
%
(7.6)
%
Canada
50.9
43.3
17.5
20.7
Puerto Rico
26.5
28.3
(6.2)
(6.2)
Mexico
18.4
10.9
68.4
41.9
Total Americas Region
891.3
943.5
(5.5)
(5.7)
Europe
Switzerland
57.0
55.2
3.3
(5.6)
Portugal
48.6
41.9
15.9
7.2
France
47.0
45.8
2.8
(5.0)
Italy
16.1
16.4
(2.3)
(9.6)
Russia
—
5.0
(100.0)
(100.0)
Other
47.1
49.8
(5.5)
(12.3)
Total Europe Region
215.8
214.1
0.8
(7.0)
Total Asia-Pacific Region
10.9
10.3
5.8
9.7
Total Kelly Services, Inc.
$
1,118.0
$
1,167.9
(4.3)
%
(5.8)
%
KELLY SERVICES, INC. AND SUBSIDIARIES
REVENUE FROM SERVICES BY GEOGRAPHY
(UNAUDITED)
(In millions of dollars)
September Year to Date
%
CC %
2023
2022
Change
Change
Americas
United States
$
2,647.1
$
2,746.5
(3.6)
%
(3.6)
%
Canada
142.2
122.7
15.9
21.4
Puerto Rico
81.1
84.8
(4.3)
(4.3)
Mexico
55.1
32.4
70.0
49.1
Total Americas Region
2,925.5
2,986.4
(2.0)
(2.0)
Europe
Switzerland
165.9
165.5
0.3
(5.0)
France
145.0
150.8
(3.8)
(5.5)
Portugal
142.3
125.8
13.2
10.9
Italy
49.5
54.3
(8.8)
(10.4)
Russia
—
63.4
(100.0)
(100.0)
Other
142.4
152.8
(6.8)
(7.2)
Total Europe Region
645.1
712.6
(9.5)
(11.6)
Total Asia-Pacific Region
32.9
32.6
1.0
5.8
Total Kelly Services, Inc.
$
3,603.5
$
3,731.6
(3.4)
%
(3.8)
%
KELLY SERVICES, INC. AND SUBSIDIARIES
RECONCILIATION OF NON-GAAP MEASURES
THIRD QUARTER
(UNAUDITED)
(In millions of dollars)
2023
2022
SG&A Expenses:
As Reported
Restructuring(7)
Adjusted
As Reported
Professional & Industrial
$ 57.7
$ (4.0)
$ 53.7
$ 65.3
Science, Engineering & Technology
47.8
(0.7)
47.1
53.4
Education
22.4
(0.6)
21.8
21.4
Outsourcing & Consulting
39.0
(1.8)
37.2
37.7
International
31.2
—
31.2
31.4
Corporate
30.3
(8.3)
22.0
21.9
Total Company
$ 228.4
$ (15.4)
$ 213.0
$ 231.1
2023
2022
Earnings from Operations:
As Reported
Restructuring(7)
Adjusted
Adjusted
Professional & Industrial
$ 7.8
$ 4.0
$ 11.8
$ 5.0
Science, Engineering & Technology
20.2
0.7
20.9
22.9
Education
(2.6)
0.6
(2.0)
(4.8)
Outsourcing & Consulting
2.5
1.8
4.3
6.4
International
2.5
—
2.5
1.9
Corporate
(30.3)
8.3
(22.0)
(21.9)
Total Company
$ 0.1
$ 15.4
$ 15.5
$ 9.5
KELLY SERVICES, INC. AND SUBSIDIARIESRECONCILIATION OF NON-GAAP MEASURESTHIRD QUARTER(UNAUDITED)(In millions of dollars)
2022
Earnings from Operations:
As Reported
Loss on disposal(4)
Goodwill impairment charge(6)
Adjusted
Professional & Industrial
$ 5.0
$ —
$ —
$ 5.0
Science, Engineering & Technology
22.9
—
—
22.9
Education
(4.8)
—
—
(4.8)
Outsourcing & Consulting
(24.3)
—
30.7
6.4
International
1.9
—
—
1.9
Corporate
(21.9)
—
—
(21.9)
Loss on disposal
(0.2)
0.2
—
—
Total Company
$ (21.4)
$ 0.2
$ 30.7
$ 9.5
KELLY SERVICES, INC. AND SUBSIDIARIES
RECONCILIATION OF NON-GAAP MEASURES
SEPTEMBER YEAR TO DATE
(UNAUDITED)
(In millions of dollars)
2023
2022
SG&A Expenses:
As Reported
Restructuring(7)
Adjusted
As Reported
Professional & Industrial
$ 183.8
$ (7.3)
$ 176.5
$ 204.1
Science, Engineering & Technology
150.6
(1.2)
149.4
161.4
Education
69.3
(1.0)
68.3
60.4
Outsourcing & Consulting
117.2
(2.3)
114.9
111.8
International
96.2
(0.6)
95.6
99.2
Corporate
86.7
(15.2)
71.5
70.4
Total Company
$ 703.8
$ (27.6)
$ 676.2
$ 707.3
2023
2022
Earnings from Operations:
As Reported
Asset impairment(5)
Restructuring(7)
Adjusted
Adjusted
Professional & Industrial
$ 16.3
$ 0.3
$ 7.3
$ 23.9
$ 27.1
Science, Engineering & Technology
56.7
0.1
1.2
58.0
63.9
Education
22.3
—
1.0
23.3
8.8
Outsourcing & Consulting
5.2
2.0
2.3
9.5
15.8
International
3.2
—
0.6
3.8
9.1
Corporate
(86.7)
—
15.2
(71.5)
(70.4)
Total Company
$ 17.0
$ 2.4
$ 27.6
$ 47.0
$ 54.3
KELLY SERVICES, INC. AND SUBSIDIARIESRECONCILIATION OF NON-GAAP MEASURESSEPTEMBER YEAR TO DATE(UNAUDITED)(In millions of dollars)
2022
Earnings from Operations:
As Reported
Gain on sale of assets(3)
Loss on disposal(4)
Goodwill impairment charge(6)
Adjusted
Professional & Industrial
$ 27.1
$ —
$ —
$ —
$ 27.1
Science, Engineering & Technology
63.9
—
—
—
63.9
Education
8.8
—
—
—
8.8
Outsourcing & Consulting
(14.9)
—
—
30.7
15.8
International
9.1
—
—
—
9.1
Corporate
(70.4)
—
—
—
(70.4)
Loss on disposal
(18.7)
18.7
—
—
Gain on sale of assets
5.3
(5.3)
—
—
—
Total Company
$ 10.2
$ (5.3)
$ 18.7
$ 30.7
$ 54.3
KELLY SERVICES, INC. AND SUBSIDIARIES
RECONCILIATION OF NON-GAAP MEASURES
(UNAUDITED)
(In millions of dollars except per share data)
Third Quarter
September Year to Date
2023
2022
2023
2022
Income tax expense (benefit)
$ (4.9)
$ (5.0)
$ (5.0)
$ (13.1)
Taxes on investment in Persol Holdings(1)
—
—
—
18.4
Taxes on foreign currency matters(2)
—
—
—
(1.5)
Taxes on gain on sale of assets(3)
—
—
—
(1.3)
Taxes on loss on disposal(4)
—
—
—
—
Taxes on asset impairment charge(5)
—
—
0.6
—
Taxes on goodwill impairment charge(6)
—
5.3
—
5.3
Taxes on restructuring charges(7)
3.9
—
6.9
—
Adjusted income tax expense
$ (1.0)
$ 0.3
$ 2.5
$ 7.8
Third Quarter
September Year to Date
2023
2022
2023
2022
Net earnings (loss)
$ 6.6
$ (16.2)
$ 25.0
$ (61.6)
Loss on investment in Persol Holdings, net of taxes(1)
—
—
—
48.8
Loss on foreign currency matters, net of taxes(2)
—
—
—
16.4
Gain on sale of assets, net of taxes(3)
—
—
—
(4.0)
Loss on disposal, net of taxes(4)
—
0.2
—
18.7
Asset impairment charge, net of taxes(5)
—
—
1.8
—
Goodwill impairment charge, net of taxes(6)
—
25.4
—
25.4
Restructuring charges, net of taxes(7)
11.5
—
20.7
—
Adjusted net earnings
$ 18.1
$ 9.4
$ 47.5
$ 43.7
Third Quarter
September Year to Date
2023
2022
2023
2022
Per Share
Per Share
Net earnings (loss)
$ 0.18
$ (0.43)
$ 0.67
$ (1.62)
Loss on investment in Persol Holdings, net of taxes(1)
—
—
—
1.28
Loss on foreign currency matters, net of taxes(2)
—
—
—
0.43
Gain on sale of assets, net of taxes(3)
—
—
—
(0.10)
Loss on disposal, net of taxes(4)
—
0.01
—
0.49
Asset impairment charge, net of taxes(5)
—
—
0.05
—
Goodwill impairment charge, net of taxes(6)
—
0.67
—
0.67
Restructuring charges, net of taxes(7)
0.32
—
0.56
—
Adjusted net earnings
$ 0.50
$ 0.25
$ 1.28
$ 1.15
Note: Earnings per share amounts for each quarter are required to be computed independently and may not equal the amounts computed for the total year.
KELLY SERVICES, INC. AND SUBSIDIARIES
RECONCILIATION OF NON-GAAP MEASURES
(UNAUDITED)
(In millions of dollars)
Third Quarter
September Year to Date
2023
2022
2023
2022
Net earnings (loss)
$ 6.6
$ (16.2)
$ 25.0
$ (61.6)
Other (income) expense, net(2)
(1.6)
(0.2)
(3.0)
(1.9)
Income tax expense (benefit)
(4.9)
(5.0)
(5.0)
(13.1)
Depreciation and amortization
8.4
8.6
25.6
24.7
EBITDA
8.5
(12.8)
42.6
(51.9)
Equity in net earnings of affiliate
—
—
—
(0.8)
Loss on investment in Persol Holdings(1)
—
—
—
67.2
Loss on foreign currency matters(2)
—
—
—
20.4
Gain on sale of assets(3)
—
—
—
(5.3)
Loss on disposal(4)
—
0.2
—
18.7
Asset impairment charge(5)
—
—
2.4
—
Goodwill impairment charge(6)
—
30.7
—
30.7
Restructuring(7)
15.4
—
27.6
—
Other, net(8)
1.6
1.0
4.3
2.5
Adjusted EBITDA
$ 25.5
$ 19.1
$ 76.9
$ 81.5
Adjusted EBITDA margin
2.3 %
1.6 %
2.1 %
2.2 %
KELLY SERVICES, INC. AND SUBSIDIARIES RECONCILIATION OF NON-GAAP MEASURES (UNAUDITED)
Management believes that the non-GAAP (Generally Accepted Accounting Principles) information excluding the 2023 restructuring charges, the 2023 impairment charge, the 2022 sale of the Persol Holdings investment, the 2022 losses on the fair value changes of the investment in Persol Holdings, the 2022 losses on foreign currency matters, the 2022 gain on sale of assets, the 2022 loss on disposal, and the 2022 goodwill impairment charge, are useful to understand the Company’s fiscal 2023 financial performance and increases comparability. Specifically, Management believes that removing the impact of these items allows for a meaningful comparison of current period operating performance with the operating results of prior periods. Management also believes that such measures are used by those analyzing performance of companies in the staffing industry to compare current performance to prior periods and to assess future performance.
Management uses Adjusted EBITDA (adjusted earnings before interest, taxes, depreciation and amortization) and Adjusted EBITDA Margin (percent of total GAAP revenue) which Management believes is useful to compare operating performance compared to prior periods and uses it in conjunction with GAAP measures to assess performance. Our calculation of Adjusted EBITDA may not be consistent with similarly titled measures of other companies and should be used in conjunction with GAAP measurements. Management also uses year-to-date free cash flow (operating cash flows less capital expenditures) to indicate the change in cash balances arising from operating activities, net of working capital needs and expenditures on fixed assets.
These non-GAAP measures may have limitations as analytical tools because they exclude items which can have a material impact on cash flow and earnings per share. As a result, Management considers these measures, along with reported results, when it reviews and evaluates the Company’s financial performance. Management believes that these measures provide greater transparency to investors and provide insight into how Management is evaluating the Company’s financial performance. Non-GAAP measures should not be considered a substitute for, or superior to, measures of financial performance prepared in accordance with GAAP.
(1) In 2022, the loss on the investment in Persol Holdings represents the change in fair value up until the date of the sale of the investment on February 15, 2022 as well as the loss on the sale of the investment during the period presented and the related tax benefit.
(2) In 2022, the loss on foreign currency matters includes a $20.4 million loss on currency translation resulting from the substantially complete liquidation of the Company’s Japan entity, partially offset by a $5.5 million foreign exchange gain on the Japan entity’s USD-denominated cash balance. The foreign exchange gain is included in other (income) expense, net in the EBITDA calculation.
(3) Gain on sale of assets in 2022 is related to the sale of under-utilized real property in the second quarter of 2022 and other real property sold in the first quarter of 2022.
(4) Loss on disposal in 2022 represents the write-off of the net assets of our Russian operations that were sold in the third quarter of 2022.
(5) Asset impairment charge in the second quarter of 2023 represents the impairment of right-of-use assets related to an unoccupied existing office space lease.
(6) Goodwill impairment charge in 2022 is the result of an interim impairment test the Company performed related to RocketPower due to a triggering event caused by changes in market conditions.
(7) Restructuring charges in the second and third quarters of 2023 relate to a comprehensive transformation initiative that includes actions that will further streamline the Company’s operating model to enhance organizational efficiency and effectiveness. These restructuring charges include $10.4 million of severance, $4.5 million of costs to execute the transformation, and $0.5 million of lease termination expenses in the third quarter of 2023 and $4.5 million of costs to execute the transformation and $1.1 million of severance in the second quarter of 2023. Restructuring charges in the first quarter of 2023 represent severance costs and lease and other terminations as a result of management undertaking actions to further our cost management efforts in response to the current demand levels and reflects a repositioning of our P&I staffing business to better capitalize on opportunities in local markets.
(8) Other, net primarily represents amortization of capitalized hosted software implementation costs.