Release – Kratos Defense, Minn-Dak Farmers Cooperative Partner to Deploy Self-Driving Trucks to Address Workforce Challenges and Improve the Supply Chain


Kratos Defense, Minn-Dak Farmers Cooperative Partner to Deploy Self-Driving Trucks to Address Workforce Challenges and Improve the Supply Chain

Research, News, and Market Data on Kratos Defense & Security Solutions

SAN DIEGO, 
May 19, 2022 (GLOBE NEWSWIRE) — 
Kratos Defense & Security Solutions, Inc. (Nasdaq: KTOS), a leading National Security Solutions provider, announced today that it has teamed with the 
Minn-Dak Farmers Cooperative (MDFC) to launch self-driving trucks, easing the truck driver shortage burden using Kratos Autonomous Systems to ensure integrity of the agriculture supply chain as a critical national security concern.

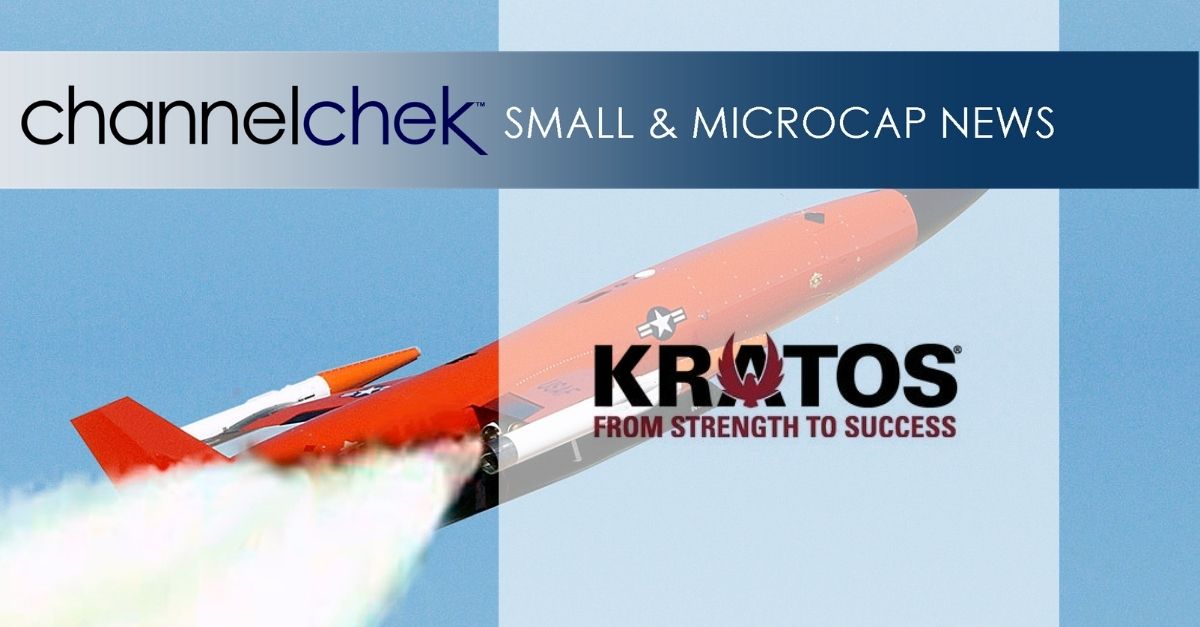
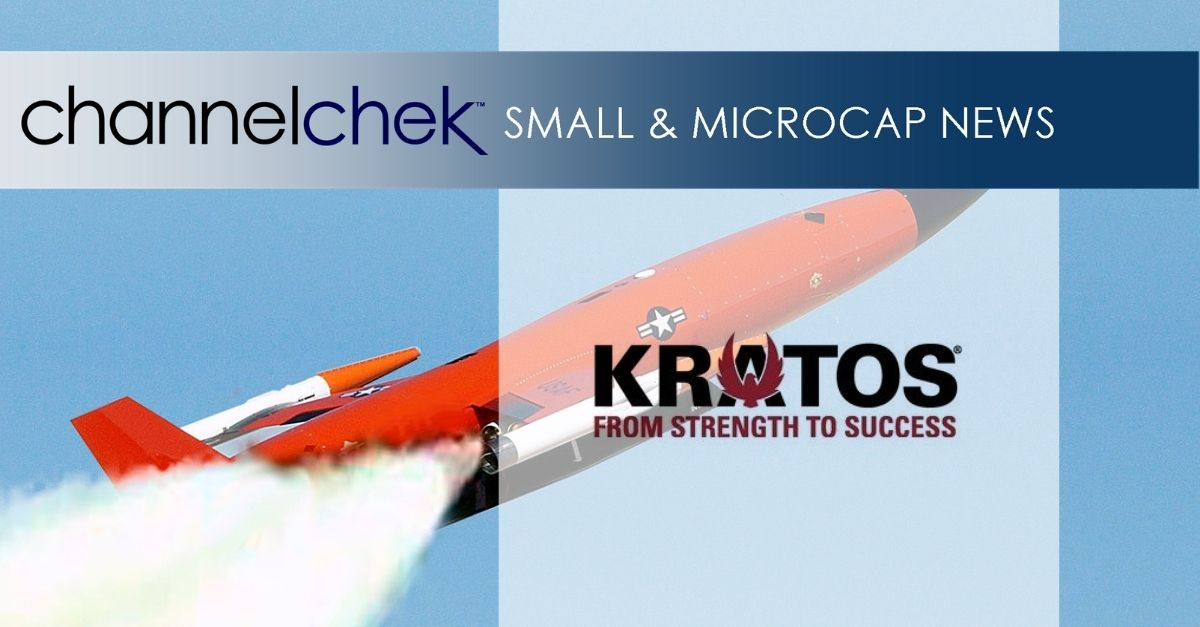
Kratos Unmanned Systems’ core competency is affordable, disruptive, unmanned systems-related technology and products for aerial drones, surface vessels, ground-based vehicles, and related command, control, autonomy, and artificial intelligence.

The collaboration between Kratos and MDFC, one of America’s largest sugarbeet shareholder/grower cooperatives, was fostered by 
Grand Farm
, a non-profit group focused on facilitating agriculture technology innovation headquartered in 
North Dakota
 and combines Kratos’ innovative unmanned system technologies, with Minn-Dak’s agriculture and transportation expertise. The retrofitted solution adapts “Leader/Follower” truck platooning for hauling harvested sugarbeets between piling stations and the granulated sugar processing plant in 
Wahpeton, North Dakota.

A photo accompanying this announcement is available at https://www.globenewswire.com/NewsRoom/AttachmentNg/61a93c9f-9c56-41bc-a8b1-96df7f26c5c2

Maynard Factor,
VP of Business Development for the Kratos Unmanned Systems Division,
 said, “We are excited to collaborate with 
Minn-Dak to deploy driverless trucks within their sugarbeet harvest operations. Kratos develops and fields transformative, affordable systems, platforms, and products for national security, and ensuring the agriculture supply chain using driverless technology directly aligns with our core company objectives. Our focus here is on the niche, short-haul trucking routes where Kratos’ technology is available today that can solve driver shortage issues impacting agriculture hauling capacity and, therefore, the supply chain. Sugarbeet growers have been early adopters of emerging agriculture technologies, implementing now-commonplace innovations such as transitioning from rail to trucks and using GPS-guided farm equipment. We see driverless technology as a similar innovation for enhancing critical farm-related operations. Additionally, as the world advances and unmanned vehicle systems continue to solve a multitude of workforce, cost, and safety challenges, we are committed to being a significant solution provider across the spectrum of this large and growing market area.”

Self-driving truck deployments can augment the existing workforce as a tool for either increasing haul capacity to keep up with growing demand or maintaining existing haul capacity when qualified drivers are unavailable. Significant effort, cost, and planning is required to ensure haul capacity meets national harvest quotas. Over 50,000 trucks a day can be deployed during peak sugarbeet harvesting season, and the Kratos Leader/Follower platoon is an enabling technology that the agriculture industry can now use for optimizing allocation of available labor to bolster the supply chain.

Mike Metzger,
Minn-Dak Farmers Co-Op VP of Agriculture, 
said, “Minn-Dak is beyond excited to be partnering with Kratos Defense as we both take the next step towards implementing Kratos’ Leader/Follower technology. Our Cooperative’s goal is to take this technology to the next level by incorporating it into our commercial truck fleet that brings the sugarbeets from receiving stations to our factory for processing. It’s no secret that there is a gross shortage of commercially licensed truck drivers, especially in rural areas like ours. The deployment of driverless vehicle technology will undoubtedly help alleviate these labor shortages and improve the overall safety and efficiency of our fleet.”

Retrofitting driverless technology is an ideal solution for organizations like 
Minn-Dak that already have an existing fleet and logistics operations. It enables them to use their harvest trucks without having to invest in brand new “purpose-built” robotic vehicles. Additionally, the Kratos Leader/Follower platoon offers several advantages to logistics managers who can now pair available truck drivers with driverless trucks to enhance hauling productivity. The paired trucks offer greater efficiency and fuel savings while reducing recruitment costs and overall stress on the drivers, recruiters, and farmers by solving the driver shortage challenge. Additionally, the integration of the technology into the agriculture supply chain offers strategic workforce development opportunities.

About Kratos
Defense & Security Solutions

Kratos Defense & Security Solutions, Inc. (NASDAQ:KTOS) develops and fields transformative, affordable technology, platforms and systems for United States National Security related customers, allies and commercial enterprises. Kratos is changing the way breakthrough technology for these industries are rapidly brought to market through proven commercial and venture capital backed approaches, including proactive research and streamlined development processes. At Kratos, affordability is a technology, and we specialize in unmanned systems, satellite communications, cyber security/warfare, microwave electronics, missile defense, hypersonic systems, training, combat systems and next generation turbo jet and turbo fan engine development. For more information, please visit www.KratosDefense.com.

About Minn-Dak
Farmers Cooperative

Minn-Dak Farmers Cooperative (MDFC or 
Minn-Dak) was the nation’s first farmer-owned sugarbeet cooperative and is headquartered in 
Wahpeton, a city in the southeast corner of North Dakota, in the heart of the 
Red River Valley. The Cooperative is owned by approximately 500 Shareholders/Growers who collectively grow just over 100,000 acres of sugarbeets and is part of the domestic sweetener industry. 
Minn-Dak has proudly been in business since 1972 and processes its sugarbeets into sugar as well as products the likes of molasses and beet pulp pellets (used in animal feed). 
Minn-Dak’s products are then marketed through agents worldwide. Major customers include industrial users, including confectioners, breakfast-cereal manufacturers, and bakeries. For more information, please visit www.mdf.coop.

Notice Regarding Forward-Looking Statements
Certain statements in this press release may constitute “forward-looking statements” within the meaning of the Private Securities Litigation Reform Act of 1995. These forward-looking statements are made on the basis of the current beliefs, expectations and assumptions of the management of Kratos and are subject to significant risks and uncertainty. Investors are cautioned not to place undue reliance on any such forward-looking statements. All such forward-looking statements speak only as of the date they are made, and Kratos undertakes no obligation to update or revise these statements, whether as a result of new information, future events or otherwise. Although Kratos believes that the expectations reflected in these forward-looking statements are reasonable, these statements involve many risks and uncertainties that may cause actual results to differ materially from what may be expressed or implied in these forward-looking statements. For a further discussion of risks and uncertainties that could cause actual results to differ from those expressed in these forward-looking statements, as well as risks relating to the business of Kratos in general, see the risk disclosures in the Annual Report on Form 10-K of Kratos for the year ended 
December 26, 2021, and in subsequent reports on Forms 10-Q and 8-K and other filings made with the 
SEC by Kratos.

Press Contact: Yolanda White 858-812-7302 Direct

Investor Information:
877-934-4687

investor@kratosdefense.com


CoreCivic, Inc. (CXW) – The New Day Has Begun; Announces $150 Million Share Repurchase Authorization

Tuesday, May 17, 2022

CoreCivic, Inc. (CXW)
The New Day Has Begun; Announces $150 Million Share Repurchase Authorization

CoreCivic is a diversified, government-solutions company with the scale and experience needed to solve tough government challenges in flexible, cost-effective ways. We provide a broad range of solutions to government partners that serve the public good through high-quality corrections and detention management, a network of residential and non-residential alternatives to incarceration to help address America’s recidivism crisis, and government real estate solutions. We are the nation’s largest owner of partnership correctional, detention and residential reentry facilities, and believe we are the largest private owner of real estate used by government agencies in the United States. We have been a flexible and dependable partner for government for nearly 40 years. Our employees are driven by a deep sense of service, high standards of professionalism and a responsibility to help government better the public good. Learn more at www.corecivic.com.

Joe Gomes, Senior Research Analyst, Noble Capital Markets, Inc.

Joshua Zoepfel, Research Associate, Noble Capital Markets, Inc.

Refer to the full report for the price target, fundamental analysis, and rating.

Repurchase Authorization. According to an 8-K filed yesterday, on May 12, 2022, the Board of Directors of CoreCivic Inc. approved a share repurchase program authorizing the Company to repurchase up to $150 million of the Company’s common stock. The authorization is above our projected $100 million plan and represents approximately 11% of Monday’s closing market capitalization.

Program Details. Repurchases of the Company’s outstanding common stock may be made at management’s discretion from time to time in the open market, through privately negotiated transactions, or otherwise. The share repurchase program has no time limit and does not obligate the Company to purchase any particular amount of its common stock….

This Company Sponsored Research is provided by Noble Capital Markets, Inc., a FINRA and S.E.C. registered broker-dealer (B/D).

*Analyst certification and important disclosures included in the full report. NOTE: investment decisions should not be based upon the content of this research summary. Proper due diligence is required before making any investment decision. 

CoreCivic, Inc. (CXW) – Time Has Come Today

Monday, May 16, 2022

CoreCivic, Inc. (CXW)
Time Has Come Today

CoreCivic is a diversified, government-solutions company with the scale and experience needed to solve tough government challenges in flexible, cost-effective ways. We provide a broad range of solutions to government partners that serve the public good through high-quality corrections and detention management, a network of residential and non-residential alternatives to incarceration to help address America’s recidivism crisis, and government real estate solutions. We are the nation’s largest owner of partnership correctional, detention and residential reentry facilities, and believe we are the largest private owner of real estate used by government agencies in the United States. We have been a flexible and dependable partner for government for nearly 40 years. Our employees are driven by a deep sense of service, high standards of professionalism and a responsibility to help government better the public good. Learn more at www.corecivic.com.

Joe Gomes, Senior Research Analyst, Noble Capital Markets, Inc.

Joshua Zoepfel, Research Associate, Noble Capital Markets, Inc.

Refer to the full report for the price target, fundamental analysis, and rating.

A New Credit Facility….Friday, CoreCivic reported it had entered into a New Credit Agreement effectively replacing the Company’s existing senior secured credit facilities. As of March 31st, CoreCivic had $167.5 million due April 2023 under its Term Loan A and $124 million due December 2024 under its Term Loan B outstanding under the old facility. Management indicated the possibility of repaying the Term Loan A out of existing cash once a new facility was in place.

…Equals Time for a Stock Buyback. Management has stated on numerous occasions that once a new credit facility was in place, authorization for a stock buyback program would be submitted to the Board. Given where the stock is currently trading and the strong, stable cash flow generation of the business, we believe the Board will grant such request. We believe a program in the $100 million range, or about 7.5% of the current market cap, would send a strong signal to the market….

This Company Sponsored Research is provided by Noble Capital Markets, Inc., a FINRA and S.E.C. registered broker-dealer (B/D).

*Analyst certification and important disclosures included in the full report. NOTE: investment decisions should not be based upon the content of this research summary. Proper due diligence is required before making any investment decision. 

Vectrus (VEC) – Solid First Quarter Results Set the Table for 2022

Thursday, May 12, 2022

Vectrus (VEC)
Solid First Quarter Results Set the Table for 2022

For more than 70 years, Vectrus has provided critical mission support for our customers’ toughest operational challenges. As a high-performing organization with exceptional talent, deep domain knowledge, a history of long-term customer relationships, and groundbreaking technical expertise, we deliver innovative, mission-matched solutions for our military and government customers worldwide. Whether it’s base operations support, supply chain and logistics, IT mission support, engineering and digital integration, security, or maintenance, repair and overhaul, our customers count on us for on-target solutions that increase efficiency, reduce costs, improve readiness, and strengthen national security. Vectrus is headquartered in Colorado Springs, Colo., and includes about 8,100 employees spanning 205 locations in 28 countries. In 2021, Vectrus generated sales of $1.8 billion. For more information, visit the company’s website at www.vectrus.com or connect with Vectrus on Facebook, Twitter, and LinkedIn.

Joe Gomes, Senior Research Analyst, Noble Capital Markets, Inc.

Joshua Zoepfel, Research Associate, Noble Capital Markets, Inc.

Refer to the full report for the price target, fundamental analysis, and rating.

1Q22 Results. Revenue of $456.5 million was up 5.2% y-o-y and above our $427 million estimate, with the revenue beat due to the pull forward of some business. Adjusted EBITDA margin of 4% continued to be impacted by the phase-in of new awards and pass through content. Adjusted EPS in the quarter was $1.01 versus $1.20. We had estimated $0.77.

Kwajalein. Vectrus was able to transition to full operational control of Kwajalein a full six weeks from original expectations. Not only did this add to first quarter results, but several of the functions being provided are additive to the Company’s core O&M offerings and will provide a path to pursue adjacent and expanded opportunities with clients in the future.

This Company Sponsored Research is provided by Noble Capital Markets, Inc., a FINRA and S.E.C. registered broker-dealer (B/D).

*Analyst certification and important disclosures included in the full report. NOTE: investment decisions should not be based upon the content of this research summary. Proper due diligence is required before making any investment decision. 

Release – Comtech Promotes Timothy Jenkins to President of its Safety & Security Technologies Product Group


Comtech Promotes Timothy Jenkins to President of its Safety & Security Technologies Product Group

Research, News, and Market Data on Comtech Telecommunications

Jenkins to succeed Kent Hellebust, who is retiring end of
May

MELVILLE, N.Y.–(BUSINESS WIRE)–May 12, 2022– May 12, 2022– Comtech Telecommunications Corp. (NASDAQ: CMTL), a leading global provider of next-generation 911 emergency systems and secure wireless communications technologies, today announced that Timothy Jenkins will become President of its Safety and Security Technologies product group, effective as of June 1, 2022.

Jenkins has been with Comtech for over three years, joining the company through its 2019 acquisition of the state and local government next-generation 911 business from General Dynamics Information Technology, Inc. Most recently, he has served as Group Vice President and General Manager within the Safety and Security Technologies organization, leading the implementation of next-generation 911 capabilities for customers across the United States. Jenkins has been involved in the public safety and 911 industry for over 28 years, serving in leadership positions at Ameritech and SBC Communications (subsequently acquired by AT&T) and Intrado.

Kent Hellebust, the current President of Comtech’s Safety and Security Technologies product group, will be retiring as of May 31, 2022, after serving in the role since April 2018. This culminates Hellebust’s decade of service at Comtech after joining in January 2012 and holding a variety of leadership roles related to the 911 business.

Mike Porcelain, Comtech President and CEO, commented, “Tim has played a key role in the growth and development of our next-generation 911 product line. He has been an invaluable contributor to the organization, leading customer operations and support. I look forward to Tim’s continued leadership and contributions to Comtech as he assumes the role of President.”

“We want to thank Kent for his outstanding leadership, significant contributions and dedicated commitment to Comtech throughout his distinguished career. Kent has worked diligently to lead, support and grow our next-generation 911 product line throughout his time at Comtech. We wish Kent the very best as he retires and moves into the next chapter.”

About Comtech

Comtech Telecommunications Corp. is a leading global provider of next-generation 911 emergency systems and secure wireless communications technologies to commercial and government customers around the world. Headquartered in Melville, New York and with a passion for customer success, Comtech designs, produces and markets advanced and secure wireless solutions. For more information, please visit www.comtechtel.com (and preview its new website at www.comtech.com).

Forward-Looking
Statements

Certain information in this press release contains statements that are forward-looking in nature and involve certain significant risks and uncertainties. Actual results could differ materially from such forward-looking information. The Company’s Securities and Exchange Commission filings identify many such risks and uncertainties. Any forward-looking information in this press release is qualified in its entirety by the risks and uncertainties described in such Securities and Exchange Commission filings.

PCMTL

View source version on businesswire.comhttps://www.businesswire.com/news/home/20220511006088/en/

Investor
Relations

Robert Samuels
631-962-7102

robert.samuels@comtech.com

Source: Comtech Telecommunications Corp.


Release – Comtech Appoints Ken Peterman to Board of Directors


Comtech Appoints Ken Peterman to Board of Directors

Research, News, and Market Data on Comtech Telecommunications

Defense Industry Veteran Peterman Adds Deep Satellite and US
Government Experience

MELVILLE, N.Y.–(BUSINESS WIRE)–May 10, 2022– May 10, 2022–Comtech Telecommunications Corp. (NASDAQ: CMTL), a leading global provider of next-generation 911 emergency systems and secure wireless communications technologies, announced today that it had appointed seasoned satellite executive Ken Peterman to Comtech’s Board of Directors. Ken will join the Board’s Science and Technology Committee.

“This is a significant and pivotal time for Comtech, as we strive to be the global leader in Failsafe Communications. Ken’s expertise in satellite technology and decades of experience with U.S. government contracting speaks for itself, providing an impeccable foundation from a strategic, executive leadership and governance perspective. He is a remarkable individual with a unique skillset, and I am delighted to welcome him to our Board,” said Michael Porcelain, President and CEO of Comtech.

An award-winning global executive leader, Peterman’s accomplished career spans over forty years in the defense segment, accumulating credentials across a wide array of markets and both commercial and government satellite systems. He has augmented a strategic landscape in tactical and satellite communications, cybersecurity, and C4 defense technology sectors through tenures at the President/CEO and VP/GM level of top defense companies including Viasat, ITT/Exelis, Collins Aerospace, Raytheon and SpyGlass Group. Most recently, as President at Viasat Government Systems, Peterman led a world-class satellite communications, mobile networking and cybersecurity portfolio. At Raytheon, he developed a $1B/year Tactical Defense Electronics Systems Division with market-leading performance. While at ITT/Exelis, he led major restructuring actions across twelve states plus the U.K. (with sales of ~$1.3B/yr), improving resource utilization and reducing infrastructure to align with emerging market and budget realities while creating double-digit growth.

“This is a key time for Comtech, and I am deeply focused on helping the Company grow and compete in the global marketplace. I am thrilled to join the Board and help steer Comtech into a new era of commercial success and shareholder value,” commented Ken Peterman.

About Comtech
Comtech Telecommunications Corp. is a leading global provider of next-generation 911 emergency systems and secure wireless communications technologies to commercial and government customers around the world. Headquartered in Melville, New York and with a passion for customer success, Comtech designs, produces and markets advanced and secure wireless solutions. For more information, please visit www.comtechtel.com (and preview its new website at www.comtech.com).

Forward-Looking
Statements

Certain information in this press release contains statements that are forward-looking in nature and involve certain significant risks and uncertainties. Actual results could differ materially from such forward-looking information. The Company’s Securities and Exchange Commission filings identify many such risks and uncertainties. Any forward-looking information in this press release is qualified in its entirety by the risks and uncertainties described in such Securities and Exchange Commission filings.

PCMTL

View source version on businesswire.comhttps://www.businesswire.com/news/home/20220509006118/en/

Comtech
Investor Relations
Robert Samuels
robert.samuels@comtech.com
(631) 962-7102

Source: Comtech Telecommunications Corp.

Release – Vectrus Announces Solid First Quarter Results


Vectrus Announces Solid First Quarter Results

Research, News, and Market Data on Vectrus

Company Release – 5/10/2022

  • Q1 revenue +5.2% Y/Y to $456.5 million
  • Operating income of $5.2 million; Adjusted EBITDA margin1 of 4.0%
  • Q1 fully diluted EPS of $0.24; Adjusted diluted EPS1 of $1.01
  • Several key wins expand and solidify work with Army, Navy, and National Security clients
  • Reiterating revenue and adjusted diluted EPS1 guidance

COLORADO SPRINGS, Colo., May 10, 2022 /PRNewswire/ — Vectrus, Inc. (NYSE:VEC) announced first quarter 2022 financial results.

“Vectrus reported solid first quarter results driven by the continued expansion into LOGCAP V and our focus on diversification to new clients and markets,” said Chuck Prow, Chief Executive Officer of Vectrus.

“During the quarter, revenue grew 5% year-over-year and 9% sequentially to $456 million. Revenue growth was driven by the continued phase-in of LOGCAP V, high op-tempo in the regions we operate in support of ongoing world affairs, as well as the progress made in executing growth in our core programs,” said Prow.  “With a continued focus on the needs of our clients, the Vectrus team supported several important missions during the quarter, including assisting the DoD with the establishment of a water supply system and water remediation efforts in Hawaii.  In addition, we demonstrated our ability to transition quickly and recently became fully operational on LOGCAP V Kwajalein, approximately a month and a half ahead of schedule. We also leveraged our process-oriented phase in system and in a short period of time, achieved full operations at Ft. Benning following our December 2021 $250 million award.  We are proud of this achievement and look forward to providing world class maintenance, transportation, and supply services for the US Army’s Maneuver Training Center over the next five years.”

“Notably, late in the first quarter Vectrus was awarded a strategically important task order to provide support for the U.S. Air Force in Europe as part of the European Deterrence Initiative,” said Prow. “While currently small in value, this contingency task is providing mission critical services to our Air Force client in Europe. This effort exemplifies our global positioning and rapid response capabilities supporting our clients’ most challenging and important missions.”

Prow continued, “Adjusted EBITDA for the quarter was $18.2 million or 4.0% margin as we work through program efficiencies in the early phases of LOGCAP V implementation. Additionally, LOGCAP V is generating higher revenue volume with a greater amount of material and pass-through content that has a different margin complexion.”

“We are continuing our positive momentum working with the Navy and during the first quarter were selected to complete the final phases of application development for the 5G Naval Base Coronado Smart Warehouse, which is demonstrative of our ability to provide converged solutions and operational technologies to clients,” said Prow. “We were also recently awarded the follow-on contract for Spectrum Management with the Navy valued at $60 million. This award continues more than 30 years of support to the Navy in solving afloat electromagnetic interference and compatibility challenges for the fleet.  Furthermore, Vectrus won a position on a $250 million five-year IDIQ vehicle that provides rapid development, prototyping, and systems integration to the Navy, Joint, and coalition forces worldwide utilizing numerous platforms and integrated capabilities. Vectrus will focus on embarkable systems that include cyber hardening, new technology insertion and retrofit of existing systems. In addition, we won an effort as subcontractor performing electromagnetic test and evaluation engineering. These are key wins that demonstrate our capabilities in engineering and operational technology, and our commitment to delivering a more integrated and comprehensive suite of solutions in support of the converged environment,” Prow elaborated.

Prow continued, “Vectrus has worked diligently over the past several years to expand its presence with national security clients and, during the first quarter our teams were successful in securing several wins that enhance our footprint in the intelligence community.”  

Prow concluded, “Our first quarter results demonstrate Vectrus’ realization and execution of our strategy to strengthen and grow the business through outstanding program execution, capability expansion, and diversification of our geographic and client footprint.”

First Quarter 2022 Results

First quarter 2022 revenue of $456.5 million was up $22.5 million year-on-year.  “Revenue grew 5.2% year over year boosted by our transition to full operational capability on LOGCAP V programs in Iraq and Kuwait late last year, and Kwajalein this year. In addition, revenue benefitted from transitioning Ft Benning and volume associated with rapid response and contingency efforts,” said Susan Lynch, Senior Vice President and Chief Financial Officer. “This revenue growth was impressive given the headwinds associated with the withdrawal of the US military from Afghanistan,” added Lynch.  Operating income was $5.2 million or 1.1% margin.  This includes M&A and integration related expenses of $9.1 million and amortization of acquired intangible assets of $2.3 million which were incurred in the quarter.

Adjusted operating income1 was $16.6 million or 3.6% margin.  Adjusted EBITDA1 was $18.2 million or 4.0% margin as compared to $20.7 million or 4.8% in the prior year.  “The year-on-year margin change was influenced by the significant amount of revenue and contracts that are in the early stages of their lifecycle.  We believe margin on these contracts will improve over time as we apply our process improvement and Enterprise Vectrus initiatives. In addition, as we continue to support our LOGCAP V clients’ supply chain needs, we are experiencing an increase in material and pass-through content which carries a lower margin. In aggregate, on average and over time we expect to see improvement in the margin profile as we drive operational efficiencies and diversify into higher margin scopes of work,” said Lynch.

Fully diluted EPS for the first quarter of 2022 was $0.24 as compared to $1.02 in the prior year.  Fully diluted EPS in the quarter included the aforementioned M&A and integration related costs.  Adjusted diluted EPS1 was $1.01 in the quarter as compared to $1.20 in the prior year. The change in adjusted diluted EPS
1 was primarily due to the above-mentioned change in Adjusted EBITDA1.

Cash used in operating activities through April 1, 2022, was $26.4 million, compared to net cash used in operating activities of $21.7 million through the first quarter of 2021. Cash used in operating activities was negatively impacted in the current quarter by an approximately $8.0 million repayment of CARES Act tax deferrals and $2 million of merger related payments.

Net debt on April 1, 2022, was $96.8 million, down $41.9 million from April 2, 2021.  Total debt on April 1, 2022, was $119.8 million, down $57.2 million from $177.0 million on April 2, 2021. Cash at quarter-end was $23.0 million.  Total consolidated indebtedness to consolidated EBITDA1 (total leverage ratio) was 1.4x compared to 2.0x at the same time last year.

Total backlog as of April 1, 2022, was $4.5 billion representing almost 2.5x the company’s estimated 2022 revenue mid-point.  Funded backlog was $0.8 billion.  The trailing twelve-month book-to-bill was 1.0x as of April 1, 2022.

2022 Guidance

Lynch continued, “In light of our solid first quarter performance, we are reiterating our full-year 2022 guidance ranges for revenue and adjusted EBITDA, adjusted diluted EPS, and net cash provided by operating activities, excluding M&A related activities.”

Due to the merger activities with Vertex, the company is not providing GAAP guidance or a reconciliation of forward-looking measures including adjusted diluted EPS to GAAP diluted EPS or adjusted EBITDA margin to GAAP net income due to the difficulty in forecasting the transaction timing and quantifying certain amounts that are necessary for such reconciliation.  Reconciliations to the closest corresponding U.S. GAAP measures are not available without unreasonable efforts on a forward-looking basis due to the high variability, complexity and low visibility with respect to the charges excluded from these non-GAAP measures. The variability of such charges could potentially have a significant impact on our future U.S. GAAP financial results.


$ millions, except for EBITDA margins
and per share amounts

2021
Actual

2022 Guidance

2022 Mid-Point

2022 Mid-Point vs
2021

Revenue

$1,784

$1,820

to

$1,860

$1,840

3.1 %

Adjusted EBITDA Margin

4.7 %

4.5 %

to

4.7%

4.6 %

(10) bps

Adjusted Diluted Earnings Per Share

$4.77

$4.57

to

$4.93

$4.74

(0.6) %

Net Cash Provided by Operating Activities

$61.3

$50.00

to

$53.50

$51.75

(15.6) %


Forward-looking statements are based upon current expectations and are subject to factors that could cause actual results to differ materially from those suggested here, including those factors set forth in the Safe Harbor Statement below. 

First Quarter 2022 Conference Call

Management will conduct a conference call with analysts and investors at 4:30 p.m. ET on Tuesday, May 10, 2022. U.S.-based participants may dial in to the conference call at 844-825-9789, while international participants may dial 412-317-5180. A live webcast of the conference call as well as an accompanying slide presentation will be available on the Vectrus Investor Relations website at https://app.webinar.net/b4KdmrqJ7En.

A replay of the conference call will be posted on the Vectrus website shortly after completion of the call and will be available for one year. A telephonic replay will also be available through May 24, 2022, at 844-512-2921 (domestic) or 412-317-6671 (international) with passcode 10166668.    

Footnotes:

1 See “Key Performance Indicators and Non-GAAP Financial Measures” for reconciliation.

About Vectrus

For more than 70 years, Vectrus has provided critical mission support for our customers’ toughest operational challenges. As a high-performing organization with exceptional talent, deep domain knowledge, a history of long-term customer relationships, and groundbreaking technical expertise, we deliver innovative, mission-matched solutions for our military and government customers worldwide. Whether it’s base operations support, supply chain and logistics, IT mission support, engineering and digital integration, security, or maintenance, repair and overhaul, our customers count on us for on-target solutions that increase efficiency, reduce costs, improve readiness, and strengthen national security. Vectrus is headquartered in Colorado Springs, Colo., and includes about 8,100 employees spanning 205 locations in 28 countries. In 2021, Vectrus generated sales of $1.8 billion. For more information, visit the company’s website at www.vectrus.com or connect with Vectrus on Facebook, Twitter, and LinkedIn.

Safe Harbor Statement

Safe Harbor Statement under the Private Securities Litigation Reform Act of 1995 (the “Act”): Certain material presented herein includes forward-looking statements intended to qualify for the safe harbor from liability established by the Act. These forward-looking statements include, but are not limited to, all the statements and items listed in the table in “2022 Guidance” above and other assumptions contained therein for purposes of such guidance, other statements about our 2021 performance outlook, five-year growth plan, revenue, DSO, contract opportunities, the potential impact of COVID-19, and any discussion of future operating or financial performance.

Whenever used, words such as “may,” “are considering,” “will,” “likely,” “anticipate,” “estimate,” “expect,” “project,” “intend,” “plan,” “believe,” “target,” “could,” “potential,” “continue,” “goal” or similar terminology are forward-looking statements. These statements are based on the beliefs and assumptions of our management based on information currently available to management.

These forward-looking statements are not guarantees of future performance, conditions, or results, and involve a number of known and unknown risks, uncertainties, assumptions, and other important factors, many of which are outside our management’s control, that could cause actual results to differ materially from the results discussed in the forward-looking statements. For a discussion of some of the risks and important factors that could cause actual results to differ from such forward-looking statements, see the risks and other factors detailed from time to time our Annual Report on Form 10-K, Quarterly Reports on Form 10-Q, and other filings with the U.S. Securities and Exchange Commission.

We undertake no obligation to update any forward-looking statements, whether as a result of new information, future events or otherwise, except as required by law.


VECTRUS, INC.
CONDENSED CONSOLIDATED STATEMENTS OF INCOME (UNAUDITED)

Three Months Ended

April 1,

April 2,

(In thousands, except per share data)

2022

2021

Revenue

$      456,471

$      434,004

Cost of revenue

419,275

393,648

Selling, general, and administrative expenses

31,959

23,823

Operating income

5,237

16,533

Interest expense, net

(1,681)

(1,932)

Income from operations before income taxes

3,556

14,601

Income tax expense

701

2,553

Net income

$          2,855

$        12,048

Earnings per share

     Basic

$            0.24

$            1.03

     Diluted

$            0.24

$            1.02

Weighted average common shares outstanding – basic

11,759

11,648

Weighted average common shares outstanding – diluted

11,902

11,827


VECTRUS, INC. 
CONDENSED CONSOLIDATED BALANCE SHEETS (UNAUDITED)

April 1,

December 31,

(In thousands, except per share information)

2022

2021

Assets

  Current assets

     Cash and cash equivalents

$                   22,999

$                   38,513

     Receivables

377,571

348,605

     Prepaid expenses

25,923

21,160

     Other current assets

11,083

15,062

  Total current assets

437,576

423,340

     Property, plant, and equipment, net

24,049

23,758

     Goodwill

321,734

321,734

     Intangible assets, net

64,281

66,582

     Right-of-use assets

42,074

43,651

     Other non-current assets

9,876

10,394

  Total non-current assets

462,014

466,119

Total Assets

$                 899,590

$                 889,459

Liabilities and Shareholders’ Equity

  Current liabilities

     Accounts payable

$                 234,713

$                 212,533

     Compensation and other employee benefits

59,059

80,284

     Short-term debt

10,400

10,400

     Other accrued liabilities

55,421

55,031

  Total current liabilities

359,593

358,248

     Long-term debt, net

108,392

94,246

       Deferred tax liability

32,620

32,214

       Operating lease liability

33,167

34,536

       Other non-current liabilities

11,643

20,128

Total non-current liabilities

185,822

181,124

Total liabilities

545,415

539,372

     Commitments and contingencies (Note 10)

     Shareholders’ Equity

     Preferred stock; $0.01 par value; 10,000,000 shares authorized; No shares issued and outstanding

     Common stock; $0.01 par value; 100,000 shares authorized; 11,805 and 11,738 shares issued and outstanding
     as of April 1, 2022 and December 31, 2021, respectively                                      

118

117

     Additional paid in capital

89,590

88,116

     Retained earnings

270,609

267,754

    Accumulated other comprehensive loss

(6,142)

(5,900)

Total shareholders’ equity

354,175

350,087

Total Liabilities and Shareholders’ Equity

$                 899,590

$                 889,459


VECTRUS, INC.
CONDENSED CONSOLIDATED STATEMENTS OF CASH FLOWS (UNAUDITED)

Three Months Ended

April 1,

April 2,

(In thousands)

2022

2021

Operating activities

     Net income

$                2,855

$              12,048

Adjustments to reconcile net income to net cash provided by operating activities:

     Depreciation expense

1,591

1,548

     Amortization of intangible assets

2,301

2,450

     (Gain) Loss on disposal of property, plant, and equipment

(16)

43

     Stock-based compensation

2,558

2,622

     Amortization of debt issuance costs

204

232

Changes in assets and liabilities:

     Receivables

(29,898)

(46,544)

     Prepaid expenses

(4,849)

(3,137)

     Other assets

4,520

(648)

     Accounts payable

22,693

42,054

     Deferred taxes

2,716

     Compensation and other employee benefits

(21,138)

(22,818)

     Other liabilities

(7,202)

(12,295)

     Net cash used in operating activities

(26,381)

(21,729)

  Investing activities

  Purchases of capital assets and intangibles

(2,195)

(2,611)

  Proceeds from the disposition of assets

17

  Net cash used in investing activities

(2,178)

(2,611)

  Financing activities

  Repayments of long-term debt

(2,600)

(2,000)

  Proceeds from revolver

217,000

110,000

  Repayments of revolver

(200,000)

(110,000)

  Proceeds from exercise of stock options

113

  Payment of debt issuance costs

(458)

Payments of employee withholding taxes on share-based compensation

(1,626)

(2,184)

Net cash provided by (used in) financing activities

12,316

(4,071)

Exchange rate effect on cash

729

(191)

Net change in cash, cash equivalents and restricted cash

(15,514)

(28,602)

Cash, cash equivalents and restricted cash-beginning of year

38,513

68,727

Cash, cash equivalents and restricted cash-end of period

$              22,999

$              40,125

Supplemental disclosure of cash flow information:

Interest paid

$                1,513

$                1,371

Income taxes paid

$                     66

$                    (97)

Purchase of capital assets on account

$                       5

$                  (132)


Key Performance Indicators and Non-GAAP Measures

The primary financial performance measures we use to manage our business and monitor results of operations are revenue trends and operating income trends. Management believes that these financial performance measures are the primary drivers for our earnings and net cash from operating activities. Management evaluates its contracts and business performance by focusing on revenue, operating income, and operating margin. Operating income represents revenue less both cost of revenue and selling, general and administrative (SG&A) expenses. Cost of revenue consists of labor, subcontracting costs, materials, and an allocation of indirect costs, which includes service center transaction costs. SG&A expenses consist of indirect labor costs (including wages and salaries for executives and administrative personnel), bid and proposal expenses and other general and administrative expenses not allocated to cost of revenue. We define operating margin as operating income divided by revenue.

We manage the nature and amount of costs at the program level, which forms the basis for estimating our total costs and profitability. This is consistent with our approach for managing our business, which begins with management’s assessing the bidding opportunity for each contract and then managing contract profitability throughout the performance period.

In addition to the key performance measures discussed above, we consider adjusted operating income, adjusted operating margin, adjusted net income, adjusted diluted earnings per share, EBITDA, adjusted EBITDA, EBITDA margin, adjusted EBITDA margin, and organic revenue to be useful to management and investors in evaluating our operating performance, and to provide a tool for evaluating our ongoing operations. This information can assist investors in assessing our financial performance and measures our ability to generate capital for deployment among competing strategic alternatives and initiatives. We provide this information to our investors in our earnings releases, presentations, and other disclosures.

Adjusted operating income, adjusted operating margin, adjusted net income, adjusted diluted earnings per share, EBITDA, adjusted EBITDA, EBITDA margin, adjusted EBITDA margin, and organic revenue, however, are not measures of financial performance under GAAP and should not be considered a substitute for operating income, operating margin, net income, and diluted earnings per share as determined in accordance with GAAP.  Definitions and reconciliations of these items are provided below.

  • Adjusted operating income is defined as operating income, adjusted to exclude items that may include, but are not limited to significant charges or credits, and unusual and infrequent non-operating items, such as M&A, integration and related costs, LOGCAP V pre-operational legal costs, and amortization of acquired intangible assets that impact current results but are not related to our ongoing operations.
  • Adjusted operating margin is defined as adjusted operating income divided by revenue.
  • Adjusted net income is defined as net income, adjusted to exclude items that may include, but are not limited to, significant charges or credits, and unusual and infrequent non-operating items, such as M&A, integration and related costs, LOGCAP V pre-operational legal costs, and amortization of acquired intangible assets that impact current results but are not related to our ongoing operations.
  • Adjusted diluted earnings per share is defined as adjusted net income divided by the weighted average diluted common shares outstanding.
  • EBITDA is defined as operating income, adjusted to exclude depreciation and amortization.
  • Adjusted EBITDA is defined as EBITDA, adjusted to exclude items that may include, but are not limited to, significant charges or credits and unusual and infrequent non-operating items, such as M&A, integration and related costs, LOGCAP V pre-operational legal costs that impact current results but are not related to our ongoing operations.
  • EBITDA margin is defined as EBITDA divided by revenue.
  • Adjusted EBITDA margin is defined as Adjusted EBITDA divided by revenue.
  • Organic revenue is defined as revenue, adjusted to exclude revenue from acquired companies.


Adjusted Net Income, Adjusted Diluted Earnings Per
Share (Non-GAAP Measures)

($K, except per share data)

Three Months
Ended April 1,
2022, As
Reported

M&A,
Integration

and Related
Costs

LOGCAP V
Pre-Operational

Legal Costs

Amortization
of Acquired
Intangible

Assets

Three Months
Ended April 1,
2022 –
Adjusted

Revenue

$         456,471

$                       —

$                     —

$                     —

$        456,471

Growth

5.2 %

5.2    %

Operating income

$             5,237

$                  9,068

$                     —

$               2,301

$          16,606

Operating margin

1.1 %

3.6 %

Interest expense, net

$            (1,681)

$                       —

$                     —

$                     —

$           (1,681)

Income from operations before income taxes

$             3,556

$                  9,068

$                     —

$               2,301

$          14,925

Income tax expense

$                701

$                  1,787

$                     —

$                  453

$            2,941

Income tax rate

19.7 %

19.7 %

Net income

$             2,855

$                  7,281

$                     —

$               1,848

$          11,984

Weighted average common shares outstanding, diluted

11,902

11,902

Diluted earnings per share

$               0.24

$                    0.61

$                     —

$                 0.16

$              1.01

EBITDA (Non-GAAP Measures)

($K)

Three Months
Ended April 1,
2022, As
Reported

M&A,
Integration

and Related
Costs

LOGCAP V
Pre-Operational

Legal Costs

Amortization
of Acquired
Intangible

Assets

Three Months
Ended April 1,
2022 –
Adjusted

Operating Income

$            5,237

$                  9,068

$                     —

$               2,301

$         16,606

Add:

Depreciation and amortization

$            3,892

$                       —

$                     —

$              (2,301)

$           1,591

EBITDA

$            9,129

$                  9,068

$                     —

$                     —

$         18,197

EBITDA Margin

2.0 %

4.0 %


Adjusted Net Income, Adjusted Diluted Earnings Per
Share (Non-GAAP Measures)

($K, except per share data)

Three Months
Ended April 2,
2021

As Reported

M&A,
Integration and
Related

Costs

LOGCAP V
Pre-Operational

Legal Costs

Amortization
of Acquired
Intangible

Assets

Three Months
Ended April 2,
2021 –
Adjusted

Revenue

$        434,004

$                     —

$                     —

$                     —

$       434,004

Operating income

$          16,533

$                     —

$                   157

$                2,450

$         19,140

Operating margin

3.8 %

4.4 %

Interest expense, net

$           (1,932)

$                     —

$                     —

$                      —

$          (1,932)

Income from operations before income taxes

$          14,601

$                     —

$                   157

$                2,450

$         17,208

Income tax expense

$            2,553

$                     —

$                     27

$                   428

$           3,008

Income tax rate

17.5 %

17.5 %

Net income

$          12,048

$                     —

$                   130

$                2,022

$         14,200

Weighted average common shares outstanding, diluted

11,827

11,827

Diluted earnings per share

$              1.02

$                     —

$                 0.01

$                  0.17

$             1.20

EBITDA (Non-GAAP Measures)

($K)

Three Months
Ended April 2,
2021

As Reported

M&A,
Integration and
Related

Costs

LOGCAP V
Pre-Operational

Legal Costs

Amortization
of Acquired
Intangible

Assets

Three Months
Ended April 2, 2021 –
Adjusted

Operating Income

$          16,533

$                     —

$                   157

$                2,450

$         19,140

Add:

Depreciation and amortization

$            3,998

$                     —

$                      —

$               (2,450)

$           1,548

EBITDA

$          20,531

$                     —

$                   157

$                      —

$         20,688

EBITDA Margin

4.7 %

4.8 %


SUPPLEMENTAL INFORMATION

Revenue by client branch, contract type, contract relationship, and geographic region for the periods presented below was as follows: 

Three Months Ended

April 1,

April 2,

(In thousands)

2022

%

2021

%

Army

$    280,113

61 %

$    257,349

59 %

Air Force

61,474

13 %

78,170

18 %

Navy

75,217

17 %

56,427

13 % %

Other

39,667

9 %

42,058

10 %

Total revenue

$    456,471

$    434,004

Revenue by Contract Type

Three Months Ended

April 1,

April 2,

(In thousands)

2022

%

2021

%

Cost-plus and cost-reimbursable

$    311,094

68 %

$    290,230

67 %

Firm-fixed-price

128,004

28 %

128,757

30 %

Time and material

17,373

4 %

15,017

3 %

Total revenue

$    456,471

$    434,004

Revenue by Contract Relationship

Three Months Ended

April 1,

April 2,

(In thousands)

2022

%

2021

%

Prime contractor

$    427,093

94 %

$    403,262

93 %

Subcontractor

29,378

6 %

30,742

7 %

Total revenue

$    456,471

$    434,004

Revenue by Geographic Region

Three Months Ended

April 1,

April 2,

(In thousands)

2022

%

2021

%

Middle East

$    235,754

52 %

$    240,013

55 %

United States

167,980

37 %

149,811

35 %

Europe

36,531

7 %

40,623

9 %

Asia

16,206

4 %

3,557

1 %

Total revenue

$    456,471

$    434,004


CONTACT:

Vectrus
Mike Smith, CFA
719-637-5773

michael.smith@vectrus.com


CisionView original content to download multimedia:https://www.prnewswire.com/news-releases/vectrus-announces-solid-first-quarter-results-301544306.html

SOURCE Vectrus, Inc.

CoreCivic, Inc. (CXW) – Headwinds Lead to Miss but Still See Upside

Monday, May 09, 2022

CoreCivic, Inc. (CXW)
Headwinds Lead to Miss but Still See Upside

CoreCivic is a diversified, government-solutions company with the scale and experience needed to solve tough government challenges in flexible, cost-effective ways. We provide a broad range of solutions to government partners that serve the public good through high-quality corrections and detention management, a network of residential and non-residential alternatives to incarceration to help address America’s recidivism crisis, and government real estate solutions. We are the nation’s largest owner of partnership correctional, detention and residential reentry facilities, and believe we are the largest private owner of real estate used by government agencies in the United States. We have been a flexible and dependable partner for government for nearly 40 years. Our employees are driven by a deep sense of service, high standards of professionalism and a responsibility to help government better the public good. Learn more at www.corecivic.com.

Joe Gomes, Senior Research Analyst, Noble Capital Markets, Inc.

Joshua Zoepfel, Research Associate, Noble Capital Markets, Inc.

Refer to the full report for the price target, fundamental analysis, and rating.

Behind the Miss. There were a number of items with the most significant being the La Palma transition, both the cost of implementing the transition as well as a faster drawn down of the existing ICE population than was anticipated, and a challenging labor market where CoreCivic has implemented above average wage increases.

But Significant Upside Potential. Due to the COVID regulations, CoreCivic’s occupancy levels remain well below historical norms. A return to pre-COVID occupancy levels, or about an additional 8,000 detainees, could add some $40-$50 million to EBITDA. Given the expectations for a border surge once Title 42 is lifted, we do not think this is a stretch….

This Company Sponsored Research is provided by Noble Capital Markets, Inc., a FINRA and S.E.C. registered broker-dealer (B/D).

*Analyst certification and important disclosures included in the full report. NOTE: investment decisions should not be based upon the content of this research summary. Proper due diligence is required before making any investment decision. 

Kratos Defense & Security (KTOS) – A CR Impacted Quarter, but Future is Brighter

Monday, May 09, 2022

Kratos Defense & Security (KTOS)
A CR Impacted Quarter, but Future is Brighter

Kratos Defense & Security Solutions, Inc. (NASDAQ:KTOS) develops and fields transformative, affordable technology, platforms, and systems for United States National Security related customers, allies, and commercial enterprises. Kratos is changing the way breakthrough technologies for these industries are rapidly brought to market through proven commercial and venture capital backed approaches, including proactive research, and streamlined development processes. At Kratos, affordability is a technology, and we specialize in unmanned systems, satellite communications, cyber security/warfare, microwave electronics, missile defense, hypersonic systems, training and combat systems and next generation turbo jet and turbo fan engine development. For more information go to www.kratosdefense.com.

Joe Gomes, Senior Research Analyst, Noble Capital Markets, Inc.

Joshua Zoepfel, Research Associate, Noble Capital Markets, Inc.

Refer to the full report for the price target, fundamental analysis, and rating.

1Q22 Results. Revenue of $196.2 million, up 1.0% y-o-y, and came in at the mid-point of the $190-$200 million guidance. Revenue from acquisitions offset CR related impacts and the decline in the Training business. Adjusted EBITDA came in at $13.8 million, above guidance, versus $18.1 million a year ago. GAAP EPS loss was $0.12, adjusted EPS net income was $0.04.

Brighter Days? With the Continuing Resolution behind us, it appears there is a high potential for new awards. On the call, CEO DeMarco stated “We have now received or have been informed that we will receive several large new contracts in our unmanned systems and our satellite business, including our new software based OpenSpace products.”…

This Research is provided by Noble Capital Markets, Inc., a FINRA and S.E.C. registered broker-dealer (B/D).

*Analyst certification and important disclosures included in the full report. NOTE: investment decisions should not be based upon the content of this research summary. Proper due diligence is required before making any investment decision. 

DLH Holdings (DLHC) – Solid Core Operating Results

Friday, May 06, 2022

DLH Holdings (DLHC)
Solid Core Operating Results

Joe Gomes, Senior Research Analyst, Noble Capital Markets, Inc.

Joshua Zoepfel, Research Associate, Noble Capital Markets, Inc.

Refer to the full report for the price target, fundamental analysis, and rating.

2QFY22 Results. Revenue totaled $108.7 million, up from $61.5 million in 2Q21. The short-term FEMA awards accounted for $39.8 million of the increase. Earnings were $7.2 million, or $0.50 per diluted share, compared to $2.6 million, or $0.19 per diluted share last year. Ex FEMA, DLH would have reported net income of $3.1 million, or $0.22 per share. We had projected revenue of $95.2 million and EPS of $0.33.

Nice Underlying Growth. Ex FEMA, the underlying business grew 12.1%, in excess of the overall market growth rate. DLH experienced continued growth in its VA-related contracts, as well as HHS programs, with Head Start revenue jumping $2 million sequentially and $1.5 million y-o-y. Demand for DLH’s services continues to increase across the board….

This Company Sponsored Research is provided by Noble Capital Markets, Inc., a FINRA and S.E.C. registered broker-dealer (B/D).

*Analyst certification and important disclosures included in the full report. NOTE: investment decisions should not be based upon the content of this research summary. Proper due diligence is required before making any investment decision. 

CoreCivic, Inc. (CXW) – First Look at 1Q22

Thursday, May 05, 2022

CoreCivic, Inc. (CXW)
First Look at 1Q22

CoreCivic is a diversified, government-solutions company with the scale and experience needed to solve tough government challenges in flexible, cost-effective ways. We provide a broad range of solutions to government partners that serve the public good through high-quality corrections and detention management, a network of residential and non-residential alternatives to incarceration to help address America’s recidivism crisis, and government real estate solutions. We are the nation’s largest owner of partnership correctional, detention and residential reentry facilities, and believe we are the largest private owner of real estate used by government agencies in the United States. We have been a flexible and dependable partner for government for nearly 40 years. Our employees are driven by a deep sense of service, high standards of professionalism and a responsibility to help government better the public good. Learn more at www.corecivic.com.

Joe Gomes, Senior Research Analyst, Noble Capital Markets, Inc.

Joshua Zoepfel, Research Associate, Noble Capital Markets, Inc.

Refer to the full report for the price target, fundamental analysis, and rating.

A Miss. CoreCivic reported first quarter results after the market closed yesterday. Revenue came in at $453 million, compared to $454.7 million in the same period last year. Consensus was $465 million. The Company reported adjusted net income of $17.4 million, or $0.14 per share, compared to $29.3 million, or $0.24 per share last year. Consensus EPS net income was $23.1 million, or $0.19 per share. We had projected revenue of $473 million and EPS of $0.18.

What Drove the Miss? Headwinds include a challenging labor market, especially for nurses, disruption from the commencement of the La Palma contract in Arizona, and a drop in federal detainees, partially offset by higher populations at the state level….

This Company Sponsored Research is provided by Noble Capital Markets, Inc., a FINRA and S.E.C. registered broker-dealer (B/D).

*Analyst certification and important disclosures included in the full report. NOTE: investment decisions should not be based upon the content of this research summary. Proper due diligence is required before making any investment decision. 

Release – Kratos Reports First Quarter 2022 Financial Results


Kratos Reports First Quarter 2022 Financial Results

Research, News, and Market Data on Kratos Defense & Security Solutions

Affirms
Full Year 2022 Financial Guidance

SAN DIEGO, May 05, 2022 (GLOBE NEWSWIRE) — Kratos Defense & Security Solutions, Inc. (Nasdaq:KTOS), a leading National Security Solutions provider, today reported its first quarter 2022 financial results. For the first quarter of 2022, Kratos reported Revenues of $196.2 million, Operating Loss of $1.2 million, Net Loss of $15.9 million and Adjusted EBITDA of $13.8 million.   Included in Net Loss is a $13.0 million loss for a debt extinguishment charge reflecting the premium paid to redeem the Company’s 6.5% Senior Notes and the write-off of related deferred financing costs.

First quarter 2022 Operating Loss includes non-cash stock compensation expense of $7.0 million, which increased $0.8 million from the first quarter of 2021, and Company-funded Research and Development expense of $9.2 million, reflecting significant ongoing development efforts being made, including in our space and satellite business to develop our virtual, software based OpenSpace ground station solution.

Kratos reported a first quarter 2022 GAAP loss per share of $0.12, which included the $13.0 million loss for debt extinguishment charge noted above, compared to Net Income of $1.9 million and GAAP EPS income of $0.01 for the first quarter of 2021. Adjusted EPS was $0.04 for the first quarter of 2022, compared to $0.06 for the first quarter of 2021. Kratos has approximately $235 million of net operating loss carryforwards, which are expected to substantially shield the Company from paying future cash income taxes.   

First quarter 2022 Revenues of $196.2 million, increased $2.0 million, or 1.0 percent, from first quarter 2021 Revenues of $194.2 million, were adversely impacted by the extended 6 month Continuing Resolution Authorization (CRA), which was not resolved until the end of March 2022. First quarter 2022 revenues were also adversely impacted by continuing and increased supply chain disruptions, and COVID-related employee absenteeism, which resulted in approximately $15.3 million of first quarter 2022 revenues being deferred into future periods. First quarter 2022 revenues include a contribution of $14.7 million from the recent acquisitions of Cosmic Advanced Engineered Solutions, Inc. (Cosmic AES) and CTT, Inc., (CTT) offset by the previously reported loss of an international training services contract of approximately $8.3 million.

First quarter 2022 Cash Flow Used in Operations was $7.9 million, including a use for the increase of inventory balances of $15.3 million during the quarter primarily in our satellite and microwave electronic businesses, in anticipation of the ramps in production in the second half of the year and, in part, to advance inventory levels, in an attempt to mitigate the impact of supply chain disruptions. Free Cash Flow Used in Operations was $18.7 million, after funding $10.8 million of capital expenditures, including in our high growth Unmanned Systems, Space, Satellite and Cyber and Turbine Technologies business areas.

For the first quarter of 2022, Kratos’ Unmanned Systems Segment (KUS) generated Revenues of $52.6 million, as compared to $55.9 million in the first quarter of 2021. KUS Operating Income was $0.5 million in the first quarter of 2022, compared to $4.2 million in the first quarter of 2021, reflecting a less favorable mix of revenues, including an increase in development programs which typically generate lower margins, an increase in SG&A costs of approximately $1.1 million, an increase of R&D expenses of approximately $1.2 million and increases in supply chain and employee related costs.

First quarter 2022 KUS Adjusted EBITDA was $3.0 million, compared to first quarter 2021 Adjusted EBITDA of $6.4 million, reflecting increases in certain development programs which typically generate lower margins and increases in SG&A, R&D, supply chain related and headcount costs.
        

KUS’s book-to-bill ratio for the first quarter of 2022 was 0.3 to 1.0 and 1.0 to 1.0 for the last twelve months ended March 27, 2022, with bookings of $236.7 million for the twelve months ended March 27, 2022.   Total backlog for KUS at the end of the first quarter of 2022 was $230.5 million compared to $269.6 million at the end of the fourth quarter of 2021.

For the first quarter of 2022, Kratos’ Government Solutions Segment (KGS) reported Revenues of $143.6 million, compared to Revenues of $138.3 million in the first quarter of 2021. The increased revenues include the contribution of approximately $14.7 million from the recently acquired Cosmic AES and CTT, offset by a reduction of $8.3 million in our Training Solutions business, resulting primarily from the loss of an international training contract, and continued and increased supply chain disruptions, which resulted in first quarter 2022 KGS revenues of approximately $14.6 million being deferred into future periods. KGS reported operating income of $5.6 million in the first quarter of 2022, compared to $7.1 million in the first quarter of 2021, primarily reflecting a less favorable revenue mix and increased costs related to the supply chain and employee base.  

Kratos’ Space, Satellite and Cyber business generated Revenues of $72.5 million in the first quarter of 2022, compared to $58.5 million in the first quarter of 2021. Included in the first quarter 2022 revenues is $12.7 million from the recent Cosmic AES acquisition, offset partially by approximately $7.1 million of supply chain related and other delays, including in the Company’s commercial and international satellite communications business.  

First quarter 2022 KGS Adjusted EBITDA was $10.8 million, compared to first quarter 2021 KGS Adjusted EBITDA of $11.7 million, reflecting a less favorable mix of revenues, the continued and increased impact of supply chain disruptions and increases in supply chain and employee related costs.

For the first quarter of 2022, KGS reported a book-to-bill ratio of 1.3 to 1.0, and a book to bill ratio of 1.1 to 1 for the twelve months ended March 27, 2022.   Included in KGS is Kratos’ Space, Satellite and Cyber business, which reported a book to bill ratio of 1.3 to 1.0 for the first quarter of 2022, and a book to bill ratio of 1.1 to 1.0 for the twelve months ended March 27, 2022. Bookings for the Space, Satellite and Cyber business for the last twelve months ended March 27, 2022 was $313.8 million. KGS’s total backlog at the end of the first quarter of 2022 was $751.6 million, as compared to $684.3 million at the end of the fourth quarter of 2021.

For the first quarter of 2022, Kratos reported consolidated bookings of $198.2 million and a book-to-bill ratio of 1.0 to 1.0, with consolidated bookings of $873.3 million and a book-to-bill ratio of 1.1 to 1.0 for the last twelve months ended March 27, 2022. Backlog on March 27, 2022 was $982.1 million, as compared to $953.9 million at December 26, 2021, and Kratos’ bid and proposal pipeline was $9.4 billion at March 27, 2022, as compared to $9.4 billion at December 26, 2021.   Backlog at March 27, 2022 was comprised of funded backlog of $685.7 million and unfunded backlog of $296.4 million.

Eric DeMarco, Kratos’ President and CEO, said, “Since our last report, the Fiscal 2022 Budget has been approved, including significant funding in space, satellite, cyber, unmanned systems, hypersonics, missile defense, strategic deterrence and microwave electronics, all core Kratos business areas.   The Fiscal 2023 budget request has also been released, also continuing these as priority national security funding areas. We have now received or have been informed that we will receive several large new contracts in our unmanned systems and our satellite business, including our new software based OpenSpace products. The awards will provide us additional visibility into our Q3 and Q4 forecasted revenue, with a significant increase in our forecasted profitability as we expect to achieve operating leverage on our cost infrastructure.”

Mr. DeMarco, continued, “Over the last few months, the Pentagon has continued to clarify its vision for low cost, force multiplying and loyal wingman unmanned aerial drone systems. We continue to be confident that Kratos’ affordable, made in America, high performance jet drones, which are flying today and not power-points, and which are designed to enable fielding of mass, large quantities and runway independence, providing challenges to adversaries and survivability to our forces, are critical differentiators.   We are currently producing approximately 150 jet drone aircraft of various types annually and are ready and able to immediately step up when the customer requires”.

Mr. DeMarco concluded, “We are focused internally, including continuing to win contract awards, expanding our market share, and on program execution and working with our customers contracting offices so that we receive funding as quickly as possible now that the 2022 budget is in place. We are also focused on managing industry wide challenges, including supply chain issues, inflation and increasing costs, COVID related impacts to our customers and employees and obtaining and retaining qualified personnel, all of which are expected to continue for the foreseeable future.”

Financial Guidance

We are providing our initial second quarter guidance and affirming our full year 2022 guidance as follows:


$M

Q222

FY22


Revenues

$205 – $215

$880 – $920


R&D

$9 – $10

$35 – $38


Operating Income (loss)

$(3) – $0

$26 – $30


Depreciation

$5 – $6

$24 – $25


Amortization

$2 – $3

$8 – $9


Stock Based Compensation

$6 – $7

$25 – $26


Adjusted EBITDA

$11 – $14

$85 – $89


Operating Cash Flow


$20 – $30


Capital Expenditures


$50 – $60


Free Cash Flow Use


($30 – $40)


Our second quarter and Fiscal Year 2022 financial guidance we are providing today includes our current forecasted business mix, and our assumptions related to the expected impact of continued employee absenteeism and retention, manufacturing, production and supply chain disruptions, parts shortages and related price increases in materials and components, travel restrictions and other COVID-19 related items that have and continue to impact the industry and Kratos.  

Throughout the first quarter of 2022, we experienced a significant increase in the intensity and effects of COVID–19, including the new Omicron variant, on our employees, consultants, vendors, suppliers, customers, etc. We have assumed that these COVID–19 related impacts to our business, which significantly impacted our fiscal first quarter 2022 and continue to impact our second quarter, will begin to subside by the third fiscal quarter, and continue to improve throughout the second half of our fiscal year 2022. Our assumption of an improving COVID-19 and supply chain related environment in the second half of the year, combined with we now have a Fiscal 2022 DoD budget and that the FY 2023 DoD budget request has been submitted, are directly related to our 2022 financial forecast and potential investment decisions. Additionally, we have recently received or been informed that we will receive certain large program awards, including in our Unmanned Systems and Satellite business, which directly relates to our forecasted 2022 quarter over quarter financial forecast improvement, including Kratos’ expectation that its financial performance in the second half of 2022 will be substantially greater than the first half.
  

We currently estimate that COVID-related issues, including the availability and increased costs of certain raw materials and related components and materials, a lack of capacity at mills supporting Kratos’ hardware programs, and the availability of an experienced skilled workforce to impact our second quarter 2022 Revenues and Adjusted EBITDA by approximately $15 to $17 million and $2 to $4 million, respectively, similar to the impact that we experienced on our first quarter 2022 Revenues and Adjusted EBITDA. We also currently estimate these issues to impact our fiscal year 2022 Revenues and Adjusted EBITDA by approximately $34 to $38 million and $7 to $10 million, respectively. We will provide future updates as appropriate. Also included in our fiscal year 2022 estimated Adjusted EBITDA are additional incremental merit increases of approximately $5 million above our historical merit increase levels. These increases were recently implemented to retain our highly skilled workforce amidst a very tight and competitive labor market.

The forecasted financial trajectory in the second half of 2022 reflects the expected mix of revenues, including the expected timing of software product deliveries in our Space, Satellite and Cyber business, based upon the forecasted order flow and roll out of our new OpenSpace solution, and contract awards we have recently received or that we have been informed we will receive.  

Forecasted second quarter 2022 and fiscal year 2022 Operating Income and Adjusted EBITDA, also reflect the expected mix of development-type contracts and expected investments, including in our Space, Satellite and Cyber, Unmanned Systems, C5ISR, Turbine Technologies and Rocket System businesses, where we have received, informed that we will receive, or are pursuing or expect to receive a number of new contract awards.   Kratos’ fiscal year 2022 forecasted revenues also include the final impact of the 2021 loss of a large international training contract, which contributed approximately $13.0 million to the Company’s fiscal year 2021 first and second quarter revenues and include the estimated contribution from the recently closed CTT and Cosmic AES acquisitions.

Management will discuss the Company’s first quarter 2022 financial results, as well as its second quarter and full year 2022 guidance on a conference call beginning at 2:00 p.m. Pacific (5:00 p.m. Eastern) today. The conference call can be accessed by dialing (866) 374-5140, and referencing the call by ID number 69056240. The conference call will be broadcast live in listen-only mode on the company’s investor relations website at https://ir.kratosdefense.com/events-presentations. A replay of the webcast will be available on the Kratos web site approximately two hours after the conclusion of the conference call.

About Kratos
Defense & Security Solutions

Kratos Defense & Security Solutions, Inc. (NASDAQ:KTOS) develops and fields transformative, affordable technology, platforms, and systems for United States National Security related customers, allies, and commercial enterprises.  Kratos is changing the way breakthrough technologies for these industries are rapidly brought to market through proven commercial and venture capital backed approaches, including proactive research, and streamlined development processes.  At Kratos, affordability is a technology, and we specialize in unmanned systems, satellite communications, cyber security/warfare, microwave electronics, missile defense, hypersonic systems, training and combat systems and next generation turbo jet and turbo fan engine development. For more information go to www.kratosdefense.com.

Notice Regarding Forward-Looking Statements
This news release contains certain forward-looking statements that involve risks and uncertainties, including, without limitation, express or implied statements concerning the Company’s expectations regarding its future financial performance, including the Company’s expectations for its second quarter and full year 2022 revenues, R&D, operating income, depreciation, amortization, stock based compensation expense, and Adjusted EBITDA, and full year 2022 operating cash flow, capital expenditures and other investments, and free cash flow use, the Company’s future growth trajectory and ability to achieve improved revenue mix and profit in certain of its business segments and the expected timing of such improved revenue mix and profit, the Company’s expectation of ramp on projects and that investments in its business will result in an increase in the Company’s market share and total addressable market and position the Company for significant future organic growth, profitability, cash flow and an increase in shareholder value, the Company’s bid and proposal pipeline, demand for its products and services, including the Company’s alignment with today’s National Security requirements, ability to successfully compete in the tactical unmanned aerial system area and expected new customer awards, including the magnitude and timing of funding and the future opportunity associated with such awards, and expected contract awards related to the Company’s Skyborg Vanguard program and other new tactical unmanned programs, performance of key contracts and programs, including the timing of production and demonstration related to certain of the Company’s contracts and product offerings, the impact of the Company’s restructuring efforts and cost reduction measures, including its ability to improve profitability and cash flow in certain business units as a result of these actions and to achieve financial leverage on fixed administrative costs, benefits to be realized from the Company’s net operating loss carry forwards, the availability and timing of government funding for the Company’s offerings, including the strength of the future funding environment, the short-term delays that may occur as a result of Continuing Resolutions or delays in DoD budget approvals, timing of LRIP and full rate production related to the Company’s unmanned aerial target system offerings, as well as the level of recurring revenues expected to be generated by these programs once they achieve full rate production, market and industry developments, and the current estimated impact of COVID-19 and employee absenteeism, supply chain disruptions, availability of an experienced skilled workforce, inflation and increased costs, and delays on our financial projections, industry, business and operations, including projected growth. Such statements are only predictions, and the Company’s actual results may differ materially from the results expressed or implied by these statements. Investors are cautioned not to place undue reliance on any such forward-looking statements. All such forward-looking statements speak only as of the date they are made, and the Company undertakes no obligation to update or revise these statements, whether as a result of new information, future events or otherwise. Factors that may cause the Company’s results to differ include, but are not limited to: risks to our business and financial results related to the reductions and other spending constraints imposed on the U.S. Government and our other customers, including as a result of sequestration and extended continuing resolutions, the Federal budget deficit and Federal government shut-downs; risks of adverse regulatory action or litigation; risks associated with debt leverage and cost savings and cash flow improvements expected as a result of the refinancing of our Senior Notes; risks that our cost-cutting initiatives will not provide the anticipated benefits; risks that changes, cutbacks or delays in spending by the U.S. DoD may occur, which could cause delays or cancellations of key government contracts; risks of delays to or the cancellation of our projects as a result of protest actions submitted by our competitors; risks that changes may occur in Federal government (or other applicable) procurement laws, regulations, policies and budgets; risks of the availability of government funding for the Company’s products and services due to performance, cost growth, or other factors, changes in government and customer priorities and requirements (including cost-cutting initiatives, the potential deferral of awards, terminations or reduction of expenditures to respond to the priorities of Congress and the Administration, or budgetary cuts resulting from Congressional committee recommendations or automatic sequestration under the Budget Control Act of 2011, as amended); risks that the UAS and UGS markets do not experience significant growth; risks that products we have developed or will develop will become programs of record; risks that we cannot expand our customer base or that our products do not achieve broad acceptance which could impact our ability to achieve our anticipated level of growth; risks of increases in the Federal government initiatives related to in-sourcing; risks related to security breaches, including cyber security attacks and threats or other significant disruptions of our information systems, facilities and infrastructures; risks related to our compliance with applicable contracting and procurement laws, regulations and standards; risks related to the new DoD Cybersecurity Maturity Model Certification (CMMC); risks related to contract performance; risks related to failure of our products or services; risks associated with our subcontractors’ or suppliers’ failure to perform their contractual obligations, including the appearance of counterfeit or corrupt parts in our products; changes in the competitive environment (including as a result of bid protests); failure to successfully integrate acquired operations and competition in the marketplace, which could reduce revenues and profit margins; risks that potential future goodwill impairments will adversely affect our operating results; risks that anticipated tax benefits will not be realized in accordance with our expectations; risks that a change in ownership of our stock could cause further limitation to the future utilization of our net operating losses; risks that we may be required to record valuation allowances on our net operating losses which could adversely impact our profitability and financial condition; risks that the current economic environment will adversely impact our business; currently unforeseen risks associated with COVID-19 and risks related to natural disasters or severe weather. These and other risk factors are more fully discussed in the Company’s Annual Report on Form 10-K for the period ended December 26, 2021, and in our other filings made with the Securities and Exchange Commission.

Note
Regarding Use of Non-GAAP Financial Measures and Other Performance Metrics

This news release contains non-GAAP financial measures, including Adjusted earnings per share (computed using income from continuing operations before income taxes, excluding income (loss) from discontinued operations, excluding income (loss) attributable to non-controlling interest, excluding depreciation, amortization of intangible assets, amortization of capitalized contract and development costs, stock-based compensation expense, acquisition and restructuring related items and other, which includes, but is not limited to, legal related items and foreign transaction gains and losses, less the estimated impact to income taxes) and including Adjusted EBITDA (which includes net income (loss) attributable to noncontrolling interest and excludes, among other things, losses and gains from discontinued operations, acquisition and restructuring related items, stock compensation expense, foreign transaction gains and losses, and the associated margin rates). Additional non-GAAP financial measures include Free Cash Flow from Operations computed as Cash Flow from Operations less Capital Expenditures and Adjusted EBITDA related to our KUS and KGS businesses. Kratos believes this information is useful to investors because it provides a basis for measuring the Company’s available capital resources, the actual and forecasted operating performance of the Company’s business and the Company’s cash flow, excluding non-recurring items and non-cash items that would normally be included in the most directly comparable measures calculated and presented in accordance with GAAP. The Company’s management uses these non-GAAP financial measures, along with the most directly comparable GAAP financial measures, in evaluating the Company’s actual and forecasted operating performance, capital resources and cash flow. Non-GAAP financial measures should not be considered in isolation from, or as a substitute for, financial information presented in compliance with GAAP, and investors should carefully evaluate the Company’s financial results calculated in accordance with GAAP and reconciliations to those financial results. In addition, non-GAAP financial measures as reported by the Company may not be comparable to similarly titled amounts reported by other companies. As appropriate, the most directly comparable GAAP financial measures and information reconciling these non-GAAP financial measures to the Company’s financial results prepared in accordance with GAAP are included in this news release.

Another Performance Metric the Company believes is a key performance indicator in our industry is our Book to Bill Ratio as it provides investors with a measure of the amount of bookings or contract awards as compared to the amount of revenues that have been recorded during the period, and provides an indicator of how much of the Company’s backlog is being burned or utilized in a certain period. The Book to Bill Ratio is computed as the number of bookings or contract awards in the period divided by the revenues recorded for the same period. The Company believes that the rolling or last twelve months’ Book to Bill Ratio is meaningful since the timing of quarter-to-quarter bookings can vary.

Press
Contact:

Yolanda White
858-812-7302 Direct

Investor
Information:

877-934-4687

investor@kratosdefense.com 

Kratos Defense & Security Solutions, Inc.


Unaudited Condensed Consolidated Statements of Operations


(in millions, except per share data)


Three Months Ended


March 27,


March 28,


2022


2021


Service revenues


$

67.9


$

57.3


Product sales


128.3


136.9


Total revenues


196.2


194.2


Cost of service revenues


49.9


42.5


Cost of product sales


94.4


100.7


Total costs


144.3


143.2


Gross profit – service revenues


18.0


14.8


Gross profit – product sales


33.9


36.2


     Total gross profit


51.9


51.0


Selling, general and administrative expenses


40.3


35.3


Acquisition and restructuring related items


0.6


0.2


Research and development expenses


9.2


8.0


Depreciation


1.3


1.2


Amortization of intangible assets


1.7


1.4


     Operating income (loss)


(1.2

)


4.9


Interest expense, net


(5.9

)


(5.9

)


Loss on extinguishment of debt


(13.0

)


Other income, net


0.1


0.2


Loss from continuing operations before income taxes


(20.0

)


(0.8

)


Benefit for income taxes from continuing operations


(4.3

)


(2.7

)


Income (loss) from continuing operations


(15.7

)


1.9


Loss from discontinued operations, net of income taxes


(0.2

)


     Net income (loss)


(15.9

)


1.9


     Less: Net income (loss) attributable to noncontrolling interest


     Net income (loss) attributable to Kratos


$

(15.9

)


$

1.9


Basic income (loss) per common share attributable to Kratos:


     Income (loss) from continuing operations


$

(0.12

)


$

0.02


     Loss from discontinued operations


     Net income (loss)


$

(0.12

)


$

0.02


Diluted income (loss) per common share attributable to Kratos:


     Income (loss) from continuing operations


$

(0.12

)


$

0.01


     Loss from discontinued operations


     Net income (loss)


$

(0.12

)


$

0.01


Weighted average common shares outstanding:


     Basic weighted average common shares outstanding


125.9


124.1


     Diluted weighted average common shares outstanding


125.9


127.7


Adjusted EBITDA (1)


$

13.8


$

18.1


Unaudited Reconciliation of GAAP
to Non-GAAP Measures


Note: (1) Adjusted EBITDA is a non-GAAP measure defined as GAAP net income (loss) attributable to Kratos adjusted for net income (loss) attributable to noncontrolling interest, income (loss) from discontinued operations, net interest expense, provision for income taxes, depreciation and amortization expense of intangible assets, amortization of capitalized contract and development costs, stock-based compensation, acquisition and restructuring related items and other, and foreign transaction gain (loss).    


Adjusted EBITDA as calculated by us may be calculated differently than Adjusted EBITDA for other companies. We have provided Adjusted EBITDA because we believe it is a commonly used measure of financial performance in comparable companies and is provided to help investors evaluate companies on a consistent basis, as well as to enhance understanding of our operating results. Adjusted EBITDA should not be construed as either an alternative to net income or as an indicator of our operating performance or an alternative to cash flows as a measure of liquidity. The adjustments to calculate this non-GAAP financial measure and the basis for such adjustments are outlined below. Please refer to the following table below that reconciles GAAP net income (loss) to Adjusted EBITDA.       


The adjustments to calculate this non-GAAP financial measure, and the basis for such adjustments, are outlined below:


Interest income and interest
expense, net. 
The Company receives interest income on investments and incurs interest expense on loans, capital leases and other financing arrangements, including the amortization of issue discounts and deferred financing costs. These amounts may vary from period to period due to changes in cash and debt balances.           


Income taxes. The Company’s tax expense can fluctuate materially from period to period due to tax adjustments that may not be directly related to underlying operating performance or to the current period of operations and may not necessarily reflect the impact of utilization of our NOLs.


Depreciation. The Company incurs depreciation expense (recorded in cost of revenues and in operating expenses) related to capital assets purchased, leased or constructed to support the ongoing operations of the business. The assets are recorded at cost or fair value and are depreciated over the estimated useful lives of individual assets.           


Amortization of intangible
assets. 
The Company incurs amortization of intangible expense related to acquisitions it has made. These intangible assets are valued at the time of acquisition and are amortized over the estimated useful lives.


Amortization of capitalized
contract and development costs. 
The Company incurs amortization of previously capitalized software development and non-recurring engineering costs related to certain targets in its Unmanned Systems and ballistic missile target businesses as these units are sold.


Stock-based compensation
expense. 
The Company incurs expense related to stock-based compensation included in its GAAP presentation of selling, general and administrative expense. Although stock-based compensation is an expense of the Company and viewed as a form of compensation, these expenses vary in amount from period to period, and are affected by market forces that are difficult to predict and are not within the control of management, such as the market price and volatility of the Company’s shares, risk-free interest rates and the expected term and forfeiture rates of the awards. Management believes that exclusion of these expenses allows comparison of operating results to those of other companies that disclose non-GAAP financial measures that exclude stock-based compensation.     


Foreign transaction (gain)
loss. 
The Company incurs transaction gains and losses related to transactions with foreign customers in currencies other than the U.S. dollar. In addition, certain intercompany transactions can give rise to realized and unrealized foreign currency gains and losses.


Acquisition and transaction
related items. 
The Company incurs transaction related costs, such as legal and accounting fees and other expenses, related to acquisitions and divestiture activities. Management believes these items are outside the normal operations of the Company’s business and are not indicative of ongoing operating results.


Restructuring costs. The Company incurs restructuring costs for cost reduction actions which include employee termination costs, facility shut-down related costs and remaining lease commitment costs for excess or exited facilities. Management believes that these costs are not indicative of ongoing operating results as they are either non-recurring and/or not expected when full capacity and volumes are achieved.


Legal related items. The Company incurs costs related to pending legal settlements and other legal related matters. Management believes these items are outside the normal operations of the Company’s business and are not indicative of ongoing operating results.


Adjusted EBITDA is a non-GAAP financial measure and should not be considered in isolation or as a substitute for financial information provided in accordance with GAAP. This non-GAAP financial measure may not be computed in the same manner as similarly titled measures used by other companies. The Company expects to continue to incur expenses similar to the Adjusted EBITDA financial adjustments described above, and investors should not infer from the Company’s presentation of this non-GAAP financial measure that these costs are unusual, infrequent, or non-recurring.


Reconciliation of Net income (loss) attributable to Kratos to Adjusted EBITDA is as follows:


Three Months Ended


March 27,


March 28,


2022


2021


Net income (loss) attributable to Kratos


$

(15.9

)


$

1.9


Loss from discontinued operations, net of income taxes


0.2


Interest expense, net


5.9


5.9


Loss on extinguishment of debt


13.0


Benefit for income taxes from continuing operations


(4.3

)


(2.7

)


Depreciation (including cost of service revenues and product sales)


5.3


4.9


Stock-based compensation


7.0


6.2


Foreign transaction loss


0.1


Amortization of intangible assets


1.7


1.4


Amortization of capitalized contract and development costs


0.3


0.2


Acquisition and restructuring related items and other


0.6


0.2


Plus: Net income (loss) attributable to noncontrolling interest


Adjusted EBITDA


$

13.8


$

18.1


Reconciliation of acquisition and restructuring related items and other included in Adjusted EBITDA:


Three Months Ended


March 27,


March 28,


2022


2021


Acquisition and transaction related items


$

0.3


$

0.2


Restructuring costs


0.1


Legal related items


0.2


$

0.6


$

0.2


Kratos Defense & Security Solutions, Inc.


Unaudited Segment Data


(in millions)


Three Months Ended


March 27,


March 28,


2022


2021


Revenues:


Unmanned Systems


$

52.6


$

55.9


Kratos Government Solutions


143.6


138.3


Total revenues


$

196.2


$

194.2


Operating income (loss)


Unmanned Systems


$

0.5


$

4.2


Kratos Government Solutions


5.6


7.1


Unallocated corporate expense, net


(7.3

)


(6.4

)


Total operating income (loss)


$

(1.2

)


$

4.9


Note: Unallocated corporate expense, net includes costs for certain stock-based compensation programs (including stock-based compensation costs for stock options, employee stock purchase plan and restricted stock units), the effects of items not considered part of management’s evaluation of segment operating performance, and acquisition and restructuring related items, corporate costs not allocated to the segments, legal related items, and other miscellaneous corporate activities.


Reconciliation of Segment Operating Income to Adjusted EBITDA is as follows:


Three Months Ended


March 27,


March 28,


2022


2021


Unmanned Systems


Operating income


$

0.5


$

4.2


Other income


0.1


0.1


Depreciation


1.6


1.6


Amortization of intangible assets


0.3


0.3


Amortization of capitalized contract and development costs


0.3


0.2


Acquisition and restructuring related items and other


0.2


Adjusted EBITDA


$

3.0


$

6.4


% of revenue


5.7

%


11.4

%


Kratos Government Solutions


Operating income


$

5.6


$

7.1


Other income


0.2


Depreciation


3.7


3.3


Amortization of intangible assets


1.4


1.1


Acquisition and restructuring related items and other


0.1


Adjusted EBITDA


$

10.8


$

11.7


% of revenue


7.5

%


8.5

%


Total Adjusted EBITDA


$

13.8


$

18.1


% of revenue


7.0

%


9.3

%


Kratos Defense & Security Solutions, Inc.


Unaudited Condensed Consolidated Balance Sheets


(in millions)


March 27,


December 26,


2022


2021


Assets


Current assets:


Cash and cash equivalents


$

254.4


$

349.4


Accounts receivable, net


280.7


284.7


Inventoried costs


107.1


91.7


Prepaid expenses


11.1


9.8


Other current assets


34.6


22.5


Total current assets


687.9


758.1


Property, plant and equipment, net


173.5


168.3


Operating lease right-of-use assets


39.6


38.5


Goodwill


522.9


493.9


Intangible assets, net


51.5


43.2


Other assets


90.1


87.5


Total assets


$

1,565.5


$

1,589.5


Liabilities and Stockholders’
Equity


Current liabilities:


Accounts payable


$

51.7


$

50.4


Accrued expenses


34.2


27.2


Accrued compensation


56.7


47.3


Accrued interest


0.2


1.5


Billings in excess of costs and earnings on uncompleted contracts


49.7


58.1


Current portion of operating lease liabilities


10.5


10.1


Other current liabilities


9.2


25.7


Other current liabilities of discontinued operations


1.1


0.8


Total current liabilities


213.3


221.1


Long-term debt


295.0


296.7


Operating lease liabilities, net of current portion


33.3


32.7


Other long-term liabilities


73.9


76.2


Other long-term liabilities of discontinued operations


2.5


2.5


Total liabilities


618.0


629.2


Commitments and contingencies


Redeemable noncontrolling interest


15.2


15.2


Stockholders’ equity:


Additional paid-in capital


1,582.0


1,578.9


Accumulated other comprehensive loss


0.6


0.6


Accumulated deficit


(650.3

)


(634.4

)


Total Kratos stockholders’ equity


932.3


945.1


Total liabilities and stockholders’ equity


$

1,565.5


$

1,589.5


Kratos Defense & Security Solutions, Inc.


Unaudited Condensed Consolidated Statements of Cash Flows


(in millions)


Three Months Ended


March 27,


March 28,


2022


2021


Operating activities:


Net income (loss)


$

(15.9

)


$

1.9


Less: loss from discontinued operations


(0.2

)


Income (loss) from continuing operations


(15.7

)


1.9


Adjustments to reconcile income (loss) from continuing operations to net cash provided by (used in) operating activities from continuing operations:


Depreciation and amortization


7.0


6.3


Amortization of lease right-of-use assets


2.6


2.2


Deferred income taxes


0.1


Stock-based compensation


7.0


6.2


Amortization of deferred financing costs


0.3


0.2


Loss on extinguishment of debt


13.0


Provision for (recovery of) doubtful accounts


(0.1

)


Changes in assets and liabilities, net of acquisitions:


Accounts receivable


31.9


9.8


Unbilled receivables


(19.8

)


(1.8

)


Inventoried costs


(15.3

)


(4.2

)


Prepaid expenses and other assets


(9.5

)


(2.0

)


Operating lease liabilities


(2.7

)


(2.2

)


Accounts payable


1.3


(2.0

)


Accrued compensation


5.6


6.2


Accrued expenses


6.1


(2.7

)


Accrued interest


(1.3

)


4.9


Billings in excess of costs and earnings on uncompleted contracts


(8.3

)


7.1


Income tax receivable and payable


(4.9

)


(2.2

)


Other liabilities


(5.2

)


(5.0

)


Net cash provided by (used in) operating activities from continuing operations


(7.9

)


22.7


Investing activities:


Cash paid for acquisitions, net of cash acquired


(58.5

)


(5.1

)


Capital expenditures


(10.8

)


(9.6

)


Net cash used in investing activities from continuing operations


(69.3

)


(14.7

)


Financing activities:


Proceeds from the issuance of long-term debt


200.0


Repayment of debt


(309.8

)


Debt issuance costs


(3.2

)


Credit agreement borrowings


100.0


Payment under finance leases


(0.3

)


(0.2

)


Payments of employee taxes withheld from share-based awards


(6.8

)


(7.1

)


Proceeds from shares issued under equity plans


2.9


2.5


Net cash used in financing activities from continuing operations


(17.2

)


(4.8

)


Net cash flows from continuing operations


(94.4

)


3.2


   Net operating cash flows of discontinued operations


0.1


(0.5

)


Effect of exchange rate changes on cash and cash equivalents


(0.7

)


(0.6

)


Net increase (decrease) in cash, cash equivalents and restricted cash


(95.0

)


2.1


Cash, cash equivalents and restricted cash at beginning of period


349.4


381.5


Cash, cash equivalents and restricted cash at end of period


$

254.4


$

383.6


Kratos Defense & Security Solutions, Inc.


Unaudited Non-GAAP Measures


Computation of Adjusted Earnings Per Share


(in millions, except per share data)


Adjusted income from continuing operations and adjusted income from continuing operations per diluted common share (Adjusted EPS) are non-GAAP measures for reporting financial performance and exclude the impact of certain items and, therefore, have not been calculated in accordance with GAAP. Management believes that exclusion of these items assists in providing a more complete understanding of the Company’s underlying continuing operations results and trends and allows for comparability with our peer company index and industry. The Company uses these measures along with the corresponding GAAP financial measures to manage the Company’s business and to evaluate its performance compared to prior periods and the marketplace. The Company defines adjusted income from continuing operations before amortization of intangible assets, depreciation, stock-based compensation, foreign transaction gain/loss, and acquisition and restructuring related items and other. The estimated impact to income taxes includes the impact to the effective tax rate, current tax provision and deferred tax provision, and excludes the impact of discrete items, including transaction related expenses and release of valuation allowance, or benefit related to the add-backs.* Adjusted EPS reflects adjusted income on a per share basis using weighted average diluted shares outstanding.          


The following table reconciles the most directly comparable GAAP financial measures to the non-GAAP financial measures.


Three Months Ended


March 27,


March 28,


2022


2021


Net income (loss) attributable to
Kratos


$

(15.9

)


$

1.9


Less: GAAP benefit for income taxes


(4.3

)


(2.7

)


Less: Net income (loss) attributable to noncontrolling interest


Less: Loss from discontinued operations, net of income taxes


0.2


Loss from continuing operations
before taxes


(20.0

)


(0.8

)


Add: Amortization of intangible assets


1.7


1.4


Add: Amortization of capitalized contract and development costs


0.3


0.2


Add: Depreciation


5.3


4.9


Add: Stock-based compensation


7.0


6.2


Add: Loss on extinguishment of debt


13.0


Add: Foreign transaction loss


0.1


Add: Acquisition and restructuring related items and other


0.6


0.2


   Non-GAAP
Adjusted income from continuing operations before income taxes


7.9


12.2


Income taxes on Non-GAAP measure Adjusted income from continuing operations*


2.8


4.5


   Non-GAAP
Adjusted net income


$

5.1


$

7.7


Diluted earnings per common share


$

(0.12

)


$

0.01


Less: GAAP benefit for income taxes


(0.03

)


(0.02

)


Less: Net income (loss) attributable to noncontrolling interest


Less: Loss from discontinued operations, net of income taxes


Add: Amortization of intangible assets


0.01


0.01


Add: Amortization of capitalized contract and development costs


Add: Depreciation


0.04


0.04


Add: Stock-based compensation


0.06


0.05


Add: Loss on extinguishment of debt


0.10


Add: Foreign transaction loss


Add: Acquisition and restructuring related items and other


Income taxes on Non-GAAP measure Adjusted income from continuing operations*


(0.02

)


(0.03

)


Adjusted income from continuing
operations per diluted common share


$

0.04


$

0.06


Weighted average diluted common
shares outstanding


125.9


127.7


*The impact to income taxes is calculated by recasting income before income taxes to include the add-backs involved in determining Adjusted income from continuing operations before income taxes and recalculating the income tax provision (benefit), including current and deferred income taxes, using the Adjusted income from continuing operations before income taxes. The recalculation also adjusts for any discrete tax expense, including transaction related expenses and the release of valuation allowance, or benefit related to the add-backs.        


Source: Kratos Defense & Security Solutions, Inc.

The GEO Group (GEO) – 1Q22 Results Above Expectations

Wednesday, May 04, 2022

The GEO Group (GEO)
1Q22 Results Above Expectations

The GEO Group, Inc. (NYSE: GEO) is a leading diversified government service provider, specializing in design, financing, development, and support services for secure facilities, processing centers, and community reentry centers in the United States, Australia, South Africa, and the United Kingdom. GEO’s diversified services include enhanced in-custody rehabilitation and post-release support through the award-winning GEO Continuum of Care®, secure transportation, electronic monitoring, community-based programs, and correctional health and mental health care. GEO’s worldwide operations include the ownership and/or delivery of support services for 103 facilities totaling approximately 83,000 beds, including idle facilities and projects under development, with a workforce of up to approximately 18,000 employees.

Joe Gomes, Senior Research Analyst, Noble Capital Markets, Inc.

Joshua Zoepfel, Research Associate, Noble Capital Markets, Inc.

Refer to the full report for the price target, fundamental analysis, and rating.

1Q22 Results. The GEO Group’s 1Q22 results were above expectations, with revenue for the quarter of $551.2 million, adjusted EBITDA of $125.2 million, AFFO of $0.64 per diluted share, EPS of $0.26, and adjusted net income of $0.31 per share. We had forecast $550 million, $98.5 million, $0.50, $0.20, and $0.21, respectively. GEO’s results highlight the resiliency of the business model, in our opinion.

BI Building. GEO’s BI monitoring subsidiary remains strong. BI now monitors over 200,000 people under the ISAP program, up from about 90,000 18 months ago. As we mentioned in a previous report, ICE is preparing for up to 600,000 enrollees in its ATD programs by year-end, up from 215,000 enrolled today. As the largest purveyor of ATD solutions to the government, such a surge should benefit GEO, in our view….

This Company Sponsored Research is provided by Noble Capital Markets, Inc., a FINRA and S.E.C. registered broker-dealer (B/D).

*Analyst certification and important disclosures included in the full report. NOTE: investment decisions should not be based upon the content of this research summary. Proper due diligence is required before making any investment decision.