Cryptocurrency exchange Coinbase is increasingly confident that a bitcoin exchange-traded fund (ETF) will soon be approved by the US Securities and Exchange Commission (SEC), following the regulator’s recent court loss blocking Grayscale’s bitcoin fund from becoming an ETF.
Paul Grewal, Coinbase’s chief legal officer, told CNBC that the company is “quite hopeful” that pending bitcoin ETF applications will now be approved by the SEC. He highlighted that they should be granted under the law, referring to the Appeals Court ruling that the SEC had no basis to deny Grayscale’s bid to convert its Grayscale Bitcoin Trust (GBTC) into an ETF.
The SEC decided last week not to appeal that court decision, likely clearing the path for a bitcoin ETF to be greenlit in the coming months. While Grewal did not give a timeline, he expressed confidence the SEC will now approve a bitcoin ETF application soon since it cannot arbitrarily reject them following its court loss.
A bitcoin ETF would allow mainstream investors to gain exposure to the cryptocurrency through investing in the fund, without having to directly purchase and hold bitcoin. This could benefit crypto exchanges like Coinbase which are commonly held assets in portfolios aiming to give investors crypto exposure.
However, Grayscale still faces some challenges converting its popular GBTC fund into an ETF. Its parent company Digital Currency Group (DCG), along with Genesis Trading and Gemini crypto exchange, were recently accused in a lawsuit by New York’s attorney general of defrauding investors to the tune of over $1 billion.
Nevertheless, Grewal sounded positive that additional bitcoin ETF products will be coming online soon as the SEC complies with court rulings requiring it to evaluate ETF applications neutrally, solely based on their merits.
Bitcoin has stealthily risen around 72% so far this year, recovering strongly after huge declines in 2022. Driving this comeback is renewed investor interest thanks to expectations of fewer Fed interest rate hikes, and hype building ahead of bitcoin’s next “halving” event in 2024 which will reduce bitcoin mining rewards by 50%, constricting supply.
However, crypto trading volumes have declined recently, as retail investors remain gun-shy after massive crashes of large players like FTX, BlockFi and Three Arrows Capital. The collapses have bred distrust of centralized crypto intermediaries.
Grewal expressed encouragement that “bad actors” in crypto like FTX are being held criminally accountable for alleged multibillion dollar fraud. He believes this will renew consumer interest in cryptocurrency investments.
FTX filed for bankruptcy last year amid a liquidity crunch after investors fled the platform over concerns on its financial stability. Its founder Sam Bankman-Fried was criminally charged by US prosecutors over allegations he defrauded FTX customers and investors out of billions. Bankman-Fried has pleaded not guilty and is currently facing trial.
While the crypto winter persists, Grewal foresees developments on the horizon that will entice investors back into digital assets. The expected approval of a bitcoin ETF could be one catalyst. With blue chip financial giants like Fidelity Investments, CME Group and others applying for bitcoin ETFs, credibility could be lent to crypto as an asset class.
As bitcoin and the broader crypto industry aim to rebuild trust, regulators are focused on rooting out bad actors and holding companies to account for violating securities laws. This could pave the way for institutional investors to gain comfort with crypto, with an ETF providing easy exposure.
If the SEC delivers on expectations and approves a bitcoin ETF application in 2023, it would cap a multi-year effort by the industry and represent a major milestone in mainstream acceptance of cryptocurrencies. For exchanges like Coinbase seeking to broaden their client bases, it could provide a crucial on-ramp for the next generation of crypto investors.
As we progress through earnings season, a concerning trend is becoming more apparent – the widening valuation gap between small and large cap companies. Across sectors like biotech, construction, media and more, large cap stocks are trading at significantly higher valuation multiples compared to their small and mid cap peers. For long-term investors, this divergence could signal an opportunity to start positioning in overlooked parts of the market.
Valuation refers to the process of determining the current worth of an asset or company. The most common valuation metric used by investors is the price-to-earnings (P/E) ratio. This compares a company’s current stock price to its earnings per share, giving a sense of how much investors are willing to pay for each dollar of earnings.
Typically, investors are willing to pay higher multiples for larger companies perceived as higher quality investments. However, the gap in P/E ratios between large caps and small caps has expanded dramatically over the past year. The sizable disparity between the two classes is the largest it has been in over 20 years.
For example, Pfizer trades around 13x forward earnings expectations. But the average forward P/E for biotech stocks with market caps under $500 million is only 5x. This means investors are valuing each dollar of Pfizer’s earnings twice as highly as the average small cap biotech peer.
What explains this growing divergence in how the market is pricing future earnings potential?
For one, large cap companies often have broader business diversification that allows them to navigate volatile economic conditions. Pfizer’s COVID vaccine gave revenues a shot in the arm during the pandemic. Meanwhile, smaller biotechs with narrower clinical pipelines carry more binary risk around drug development outcomes.
Bigger balance sheets also provide an advantage. Large caps can leverage financial strength to pursue acquisitions, ramp up buybacks and maintain dividends during downturns. With higher cash reserves and access to capital, they are better equipped to weather tightening financial conditions.
Many large caps also benefit from durable competitive advantages like strong branding, pricing power, high barriers to entry and economies of scale. This allows them to consistently deliver high returns on invested capital and cash flows sought by investors.
Smaller companies tend to deliver more volatile financial results. They lack established competitive positions and have less excess cash. Weaker balance sheets increase vulnerability to supply chain disruptions, rising input costs and tight financing conditions.
While these factors help explain higher valuations for large caps, the magnitude of the gap suggests investors may be overlooking the long-term potential of small and micro cap stocks.
Though more volatile, smaller companies offer greater growth potential. They can deliver exponential returns if new innovations gain traction or they carve out niche industry positions. With valuations already compressed, their risk/reward profiles appear skewed to the upside.
Noble Capital Markets’ Director of Research, Michael Kupinski states in his Q3 2023 Media Sector Review, “We believe that there is higher risk in the small cap stocks, especially given that some companies may not be cash flow positive, have capital needs, or have limited share float. But investors seem to have thrown the baby out with the bathwater. While those small cap stocks are on the more speculative end of the scale, many small cap stocks are growing revenues and cash flow, have capable balance sheets, and/or are cash flow positive. For attractive emerging growth companies, the trading activity will resolve itself over time. Some market strategists suggest that small cap stocks trade at the most undervalued in the market, as much as a 30% to 40% discount to fair value.”
Astute investors know that future unicorns often hide among today’s small and micro caps. Many current large cap leaders like Apple, Amazon and Tesla began as small companies trading at single digit earnings multiples. Yet these stocks generated huge returns for early investors.
Just because a company is small does not necessarily mean it is distressed. Many smaller firms boast solid fundamentals and growth drivers that are simply not apparent to short-term traders. Their lower valuations present a compelling entry point for long-term investors.
While large caps will remain a core portfolio holding for many, today’s environment presents a unique opportunity. The extreme valuation divergence has created asymmetric upside potential in overlooked small cap names. As legendary investor Warren Buffett said, “Be fearful when others are greedy and greedy when others are fearful.”
Digging Deeper into Valuation Metrics
When assessing valuation gaps between small and large caps, it helps to look beyond simple price-to-earnings ratios. Other useful metrics can provide additional context on relative value.
For example, the price-to-sales (P/S) ratio compares a company’s market capitalization to total revenue. High growth companies with minimal earnings often trade at elevated P/S multiples. However, small caps today trade at an average P/S ratio of just 0.7x versus 2.3x for large caps. Again, a sizable gap that favors small companies.
Enterprise value to EBITDA (EV/EBITDA) is another meaningful valuation yardstick. By incorporating debt levels and focusing on cash profits, EV/EBITDA provides a more holistic view of a company’s valuation. Currently, small caps trade at an average forward EV/EBITDA of 6x – roughly half that of large cap peers.
Across an array of valuation metrics, small and mid caps trade at substantial discounts relative to large caps. This suggests underlying fundamentals and growth prospects may not be fully reflected in their beaten-down share prices.
Small Cap Opportunities Across Industries
While small caps appear broadly undervalued, some industries stand out as particularly compelling hunting grounds.
For example, junior mining stocks have been ravaged during the recent crypto/tech selloff. But with inflation soaring and geopolitical tensions rising, demand for precious metals should strengthen. Many miners are generating robust cash flows at today’s elevated commodity prices. Yet their shares trade at deep discounts to book value.
Biotech is another area laden with small cap opportunities. Developing novel drugs carries substantial risk, so setbacks in clinical trials can decimate share prices. However, the sector remains ripe for M&A. Larger pharmas need to replenish pipelines, providing takeout potential. Investors can balance risks via diversification across promising development stage companies.
Oil and gas producers offer further value among small energy firms. Strong demand and restricted supply has sent oil prices surging. Many smaller E&Ps focused on prolific shale basins sport attractive cash flows and reserves value. Yet their shares lag larger counterparts, despite superior growth outlooks.
The bottom line is that while risks are higher with small caps, their depressed valuations provide a margin of safety. Reward far exceeds risk for selective investors focused on fundamentals.
Mitigating Volatility
Small caps carry well-known risks, including elevated volatility. Information flow and analyst coverage is more sparse for smaller companies. Major drawdowns can rattle investor nerves and sink long-term performance if not adequately prepared for. Resources like Channelchek is a great tool to help provide data to investors in the small cap space.
Based on your age, time horizon, and risk tolerance, here are some tips to mitigate volatility while still capturing small cap upside:
Maintain reasonable portfolio allocation – small and microcaps should represent a smaller portion of your equity holdings
Diversify across sectors, industries and market caps to smooth volatility
Maintain a long-term mindset – don’t panic sell on temporary declines
With prudent risk controls, small caps can boost portfolio returns while diversifying away from large cap shares. Their more attractive valuations provide a compelling opportunity during these volatile times.
“In the equity markets history tends to repeat itself. At some point the smart money will start allocating more portfolio weight into these undervalued equities, which will narrow this historic valuation gap, offering potential for above average returns for small and microcaps,” said Nico Pronk, CEO of Noble Capital Markets.
The US housing market continues to show signs of a significant downturn, with existing home sales in September dropping to the slowest pace since October 2010. This marks a 15.4% decline compared to September 2022, according to new data from the National Association of Realtors (NAR).
The sharp drop in home sales highlights how rising mortgage rates and declining affordability are severely impacting the housing market. The average 30-year fixed mortgage rate now sits around 8%, more than double what it was just a year ago. This rapid surge in borrowing costs has priced many buyers out of the market, especially first-time homebuyers.
Only 27% of September home sales went to first-time buyers, well below the historical norm of 40%. Many simply cannot afford today’s high home prices and mortgage payments. As a result, sales activity has fallen dramatically. The current sales pace of 3.96 million units annualized is down markedly from over 6 million just two years ago, when rates were around 3%.
At the same time, inventory remains extremely tight. There were just 1.13 million existing homes available for sale at the end of September, an over 8% decline from last year. This persistent shortage of homes for sale continues to put upward pressure on prices. The median sales price in September hit $394,300, up 2.8% from a year ago.
While higher prices are squeezing buyers, they are not denting demand enough to significantly expand inventory. Many current homeowners are reluctant to sell and give up their ultra-low mortgage rates. This dynamic is keeping the market undersupplied, even as sales cool.
Not all buyers are impacted equally by higher rates. Sales have held up better on the upper end of the market, while declining sharply for mid-priced and affordable homes. This divergence reflects that high-end buyers often have more financial flexibility, including the ability to purchase in cash.
All-cash sales represented 29% of transactions in September, up notably from 22% a year earlier. Wealthier buyers with financial assets can better absorb higher borrowing costs. In contrast, first-time buyers and middle-income Americans are being squeezed the most by rate hikes.
Looking ahead, the housing slowdown is likely to persist and potentially worsen. Mortgage applications are now at their lowest level since 1995, signaling very weak demand ahead. And while inflation has eased slightly, the Federal Reserve is still expected to continue raising interest rates further to combat it.
Higher rates mean reduced affordability and housing activity, especially if home prices remain elevated due to limited inventory. This perfect storm in the housing market points to significant headwinds for the broader economy going forward.
The housing sector has historically been a key driver of economic growth in the US. But with sales and construction activity slowing substantially, it may act as a drag on GDP growth in coming quarters. Combined with declining affordability, fewer homes being purchased also means less spending on furniture, renovations, and other housing-related items.
Some analysts believe the Fed’s aggressive rate hikes will ultimately tip the economy into a recession. The depth of the housing market downturn so far this year does not bode well from a macroeconomic perspective. It signals households are pulling back materially on major purchases, which could contribute to a broader economic contraction.
While no significant recovery is expected in the near-term, lower demand could eventually help rebalance the market. As sales moderate, competitive bidding may ease, taking some pressure off prices. And if economic conditions worsen substantially, the Fed may again reverse course on interest rates. But for now, the housing sector appears poised for more weakness ahead. Homebuyers and investors should brace for ongoing volatility and uncertainty.
Federal Reserve Chair Jerome Powell reiterated the central bank’s determination to bring down inflation in a speech today, even as he acknowledged potential economic risks from sustained high interest rates. His remarks underline the Fed’s unwavering focus on price stability despite emerging signs of an economic slowdown.
While noting welcome data showing inflation may be starting to cool, Powell stressed it was too early to determine a downward trend. He stated forcefully that inflation remains “too high”, requiring ongoing policy resolve from the Fed to return it to the 2% target.
Powell hinted the path to lower inflation likely entails a period of below-trend economic growth and softening labor market conditions. With jobless claims recently hitting a three-month low, the robust job market could exert persistent upward pressure on prices. Powell indicated weaker growth may be necessary to rebalance supply and demand and quell wage-driven inflation.
His remarks mirror other Fed officials who have suggested a growth sacrifice may be required to decisively curb inflation. The comments reflect Powell’s primary focus on price stability amid the worst outbreak of inflation in over 40 years. He admitted the path to lower inflation will likely prove bumpy and take time.
Powell stated the Fed will base policy moves on incoming data, risks, and the evolving outlook. But he stressed officials are united in their commitment to the inflation mandate. Additional evidence of strong economic growth or persistent labor market tightness could necessitate further rate hikes.
Markets widely expect the Fed to pause rate increases for now, after aggressively raising the federal funds rate this year from near zero to a current target range of 3.75%-4%. But Powell avoided any definitive signal on the future policy path. His remarks leave the door open to additional tightening if high inflation persists.
The speech underscores the Fed’s data-dependent approach while maintaining flexibility in either direction. Powell emphasized officials will proceed carefully in evaluating when to halt rate hikes and eventually ease monetary policy. The Fed faces heightened risks now of overtightening into a potential recession or undertightening if inflation remains stubbornly high.
After being accused of misreading rapidly rising inflation last year, Powell stressed the importance of policy consistency and avoiding premature pivots. A sustainable return to the 2% goal will require ongoing tight monetary policy for some time, even as economic headwinds strengthen.
Still, Powell acknowledged the uncertainties in the outlook given myriad economic crosscurrents. While rate hikes will continue slowing growth, easing supply chain strains and improving global trade could help counter those drags next year. And robust household savings could cushion consumer spending despite higher rates.
But Powell made clear the Fed will not declare victory prematurely given the persistence of inflation. Officials remain firmly committed to policy firming until convincing evidence demonstrates inflation moving down sustainably toward the target. Only then can the Fed safely conclude its aggressive tightening cycle.
For investors, Powell’s speech signals monetary policy will likely remain restrictive for some time, though the ultimate peak in rates remains uncertain. Markets should prepare for extended volatility as the Fed responds to evolving economic data. With risks tilted toward policy tightness, interest-sensitive assets could face ongoing pressure.
U.S. drivers have seen welcome relief in recent weeks as gas prices steadily drift lower, even while oil continues to trade near $90 per barrel. The national average gasoline price now sits at $3.58 per gallon, down 30 cents over the last month.
What’s behind this divergence between oil and gas prices? And what does it mean for the average American’s wallet?
Seasonal Shifts Push Gas Prices Lower
The primary drivers pulling gas prices downward are seasonal factors. In the fall, refineries begin switching to cheaper winter-blend gasoline formulations. At the same time, cooler weather means lower fuel demand. Both these trends allow gas prices to detach from oil markets.
Rebecca Babin, an energy trader at CIBC Private Wealth, explained that “gas prices seasonally fall every autumn. 2022 is no exception.” Gas prices often decline 20 to 25 cents per gallon or more between September and December.
Supply Growth Eases Market Tightness
This year’s price declines also come as fuel inventories have rebounded nearly 10% from 2021 levels. Whereas last year saw tight fuel supplies amid recovering demand, expanded refinery runs have improved market balance in 2022.
“Anything that adds product to the market is going to help bring down refinery margins,” said Jeff Barron of the U.S. Energy Information Administration. These inventory and supply differences make today’s environment markedly different from a year ago.
On the crude side, OPEC+ production cuts and global disruptions have kept oil prices elevated. Prices spiked last week on Middle East escalation fears before retreating again.
According to Babin, oil markets remain well-supported in the low $80s per barrel due to the supply-demand balance. Further gains into the $90s could threaten demand, however. The key uncertainty is whether OPEC+ extends output curbs into 2023.
Gas Demand Slackens Amid High Prices
Sky-high prices have also dampened U.S. retail fuel demand, which recently slipped below 2020 levels. Brenda Shaffer, an energy specialist at Georgetown University, notes demand may decline “as Americans cut back on unnecessary car trips to save money.”
With households pinched by inflation, discretionary driving becomes a prime target for budget cuts. But lower fuel consumption then puts further downward pressure on prices.
The Consumer Impact
Falling pump prices come as welcome relief, especially heading into the busy holiday travel season. The 40-cent drop from the September peak has saved U.S. households nearly $10 billion, by some estimates.
“It’s like getting a little raise, without having to ask your boss,” says Patrick De Haan, head of petroleum analysis at GasBuddy.
Lower fuel costs help curb inflationary pressures and provide savings that can be redirected to other household needs. But prices remain elevated historically. Americans are still paying nearly $400 more per year to fill up than just two years ago.
While the gas price outlook remains murky, any further declines over the next few months would aid consumers through winter. Yet many will likely remain wary of rising fuel bills cutting into tight budgets.
PCTEL, a leading global provider of wireless technology solutions, announced last week that it has reached a definitive agreement to be acquired by Amphenol Corporation in an all-cash transaction valued at approximately $139.7 million.
Under the terms of the agreement, Amphenol will acquire all outstanding shares of PCTEL common stock for $7.00 per share. This offer price represents a premium of over 50% compared to PCTEL’s closing share price of $4.62 on October 13, 2023, the last full trading day before the deal was announced.
The acquisition will allow PCTEL to leverage Amphenol’s global presence, dedicated customer base, and scale to accelerate the growth of PCTEL’s business. Amphenol is one of the world’s largest providers of high-technology interconnect, sensor and antenna solutions.
PCTEL is seen as a clear innovation leader in wireless technology solutions, making it an excellent strategic fit within Amphenol’s portfolio. PCTEL’s capabilities in antennas and test and measurement will complement Amphenol’s strengths in interconnect and sensor technologies.
The deal has been approved by PCTEL’s Board of Directors and is expected to close either in Q4 2023 or early 2024, subject to shareholder approval and customary closing conditions. Once the acquisition is completed, PCTEL will no longer be a publicly traded company on the Nasdaq.
PCTEL provides purpose-built Industrial IoT devices, antenna systems, and test and measurement products to customers worldwide. The company has built trusted relationships through nearly 30 years of experience solving complex wireless challenges and helping organizations stay connected, transform and grow.
Amphenol has a diversified presence across high-growth segments including automotive, broadband communications, commercial aerospace, industrial, information technology, military, mobile devices and mobile networks. Amphenol’s sustained financial strength and entrepreneurial culture will support taking PCTEL’s business to new heights.
The transaction follows a nearly year-long strategic review process overseen by PCTEL’s Board of Directors. In their announcement, PCTEL highlighted that Amphenol’s culture is well-aligned and will provide a valuable home for PCTEL’s global employees after the acquisition.
For investors, the all-cash deal provides certainty of value at an attractive premium to PCTEL’s recent trading prices. The $7.00 per share price is over 50% higher than the 30-day volume weighted average share price prior to the deal announcement.
PCTEL’s CEO David Neumann noted that the company’s team has done an excellent job growing the business and meeting strong customer demand globally, especially for high reliability applications. This established market position made PCTEL an appealing target for Amphenol.
The deal marks an exciting milestone for PCTEL, allowing the company to join forces with an industry leader in Amphenol. Investors can expect an accelerated growth trajectory as the combined companies leverage their technical strengths and customer relationships.
After 29 years as an independent public company, PCTEL is set to start an exciting new chapter as part of Amphenol. This transaction highlights the ongoing demand for antennas, sensors and other wireless connectivity technology solutions.
Federal Reserve Chair Jerome Powell is set to deliver a closely watched speech on Thursday before the Economic Club of New York that could offer critical guidance on the future path of monetary policy.
Markets are looking for clarity from Powell on how the Fed plans to balance improving inflation data against surging Treasury yields and risks of recession. His remarks come at a precarious time – inflation shows early signs of easing but remains well above the Fed’s 2% target, while rapidly rising interest rates threaten to slow economic growth.
Powell faces the tricky task of conveying that the Fed remains vigilant in combating inflation while avoiding cementing expectations for further aggressive rate hikes that could hammer markets.
“Powell has to present himself to investors as the dispassionate neutral leader and allow others to be more aggressive,” said Jeffrey Roach, chief economist at LPL Financial. “They’re not going to declare victory, and that is one reason why Powell is going to continue to talk somewhat hawkish.”
Cues from within the Fed have been mixed recently. Several officials, including Philadelphia Fed President Patrick Harker, have advocated holding fire on rate hikes temporarily to evaluate incoming data. This “wait and see” approach comes after a torrent of large rate increases this year, with the Fed Funds rate now sitting at a 15-year high of 3.75%-4%.
But hawkish voices like New York Fed President John Williams insist the Fed must keep policy restrictive for some time to combat inflation. Markets hope Powell will provide definitive guidance on the prevailing consensus within the central bank.
Policymakers are navigating a complex environment. Inflation data has been gradually improving from 40-year highs earlier this year. But inflation expectations remain uncomfortably high, pointing to the need for further tightening.
“Powell has to present the recent inflation data as welcome news, but not evidence that the job is done,” said Ryan Sweet, chief U.S. economist at Oxford Economics. “The Fed still has more work to do.”
At the same time, the rapid rise in Treasury yields in recent weeks has already tightened financial conditions substantially. Another massive rate hike could be unnecessary overkill.
According to Krishna Guha of Evercore ISI, Powell will likely underscore “that the data has been coming in stronger than expected, but there has also been a big move in yields, which has tightened financial conditions, so no urgency for a policy response in November.”
Markets are currently pricing in a 65% chance that rates remain on hold at next month’s policy meeting. But there is still roughly a one-in-three chance of another 0.75 percentage point hike.
All eyes will be parsing Powell’s speech for any clues or direct guidance on the Fed’s next steps. While he is expected to avoid concrete commitments, his language choices will be dissected for shifts in tone or any hints at changes in thinking around the policy trajectory.
Powell’s remarks will also be scrutinized for takeaways on how long the Fed may need to keep rates elevated before ultimately cutting. Luke Tilley of Wilmington Trust expects Powell “to keep talking about staying vigilant” and the need for rates to remain higher for longer to ensure inflation comes down sustainably.
With growing recession fears on Main Street and Wall Street, Powell faces a defining moment to communicate a clear roadmap of where monetary policy is headed, while retaining flexibility. Walking this tightrope will be critical to shoring up the Fed’s credibility and avoiding unnecessary market turmoil.
All eyes are on the Fed chair tomorrow as investors and economists eagerly await guidance from the man himself holding the levers over the world’s most influential interest rate.
Shares of Nvidia and other semiconductor firms tumbled Tuesday morning after the U.S. announced stringent new curbs on exports of artificial intelligence chips to China. The restrictions spooked investors already on edge about the economic fallout from deteriorating U.S.-China relations.
Advanced AI chips like Nvidia’s flagship A100 and H100 models are now barred from shipment to China, even in downgraded versions permitted under prior rules. Nvidia stock plunged nearly 7% on the news, while chip stocks like Marvell, AMD and Intel sank 3-4%. The Philadelphia Semiconductor Index lost over 5%.
The export crackdown aims to hamper China’s progress in developing cutting-edge AI, which relies on massive computing power from state-of-the-art chips. U.S. officials warned China could use next-generation AI to threaten national security.
“We have specific concern with respect to how China could use semiconductor technologies to further its military modernization efforts,” said Alan Estevez, an under secretary at the Commerce Department.
But hampering China’s AI industry could substantially dent revenues for Nvidia, the dominant player in advanced AI chips. China is estimated to account for billions in annual sales.
While Nvidia said the financial impact is not immediate, it warned of reduced revenues over the long-term from tighter China controls. Investors are concerned these export curbs could be just the beginning if tensions continue to escalate between the global superpowers.
The escalating trade barriers also threaten to disrupt global semiconductor supply chains. Many chips contain components sourced from the U.S., Japan, Taiwan and other countries before final manufacturing and assembly occurs in China. The complex web of cross-border production could quickly seize up if trade restrictions proliferate.
Nvidia and its peers sank Tuesday amid fears of being caught in the crossfire of a technology cold war between the U.S. and China. Investors dumped chip stocks on worries that shrinking access to the massive Chinese market will severely depress earnings.
AI chips are essential to powering everything from data centers, autonomous vehicles, and smart devices to facial recognition, language processing, and machine learning. As AI spreads across the economy, demand for specialized semiconductors is surging.
But rivalries between the U.S. and China now threaten to put a ceiling on that growth. Both nations are aggressively competing to dominate AI research and set the global standards for integrating these transformative technologies. Access to the most powerful AI chips is crucial to these efforts.
By curbing China’s chip supply, the U.S. administration aims to safeguard America’s edge in AI development. But tech companies may pay the price through lost revenues if China restricts access to its own market in retaliation.
For the broader stock market already on edge about resurgent inflation, wars in Ukraine and the Middle East, and rising interest rates, the intensifying technology cold war represents yet another worrying threat to global economic growth. While a severe downturn may ultimately be avoided, the rising risk level underscores why investors are growing more anxious.
U.S. retail sales rose an unexpectedly robust 0.7% in September, surpassing economist forecasts of a flat or negative number. The solid spending data provides a dose of optimism that the economy can achieve a soft landing amidst high inflation and aggressive Fed rate hikes.
September’s gains were broad-based across categories like autos, gasoline, furniture, clothing, hobbies, and food services. The growth comes even as inflation persists at elevated levels, with the September Consumer Price Index report showing prices climbed 8.2% year-over-year.
However, the 0.4% monthly CPI increase was smaller than anticipated. This potentially indicates inflationary pressures are beginning to gradually ease.
Markets rallied on the retail sales beat, interpreting it as a sign of consumer resilience despite inflation chipping away at budgets. Stocks rose on hopes a soft landing—where the Fed engineers an economic cooldown without triggering a recession—appears more plausible.
Retail spending has seesawed in recent months, decreasing 0.4% in August as high prices at the pump drained consumer budgets. But gas prices have since moderated, alleviating some of this pressure. This freed up disposable income in September, evidenced by solid auto sales and increases in discretionary categories.
The better-than-expected data implies consumers still have some power to prop up the economy, though inflation remains a challenge. Prices dipped from the previous month’s 8.3% annual increase but continue running severely above the Fed’s 2% target. This explains why the central bank is almost certain to enact another large interest rate hike in early November.
Firms are bracing for a potential downturn, with many announcing hiring freezes and cost cuts. However, the job market has yet to take a significant hit, which would severely impair consumer spending power. As long as individuals keep spending reasonably well, it makes a soft landing more feasible.
Looking ahead, the path for retail sales and inflation remains highly uncertain. More data will be required to determine if September’s retail boost was an anomaly or the start of more sustainable momentum. Inflation similarly needs to keep dropping before proclaiming victory.
But for now, September’s numbers provide a dose of positivity that the economy is not yet on the brink of cratering into recession. Consumers are weathering the inflation storm better than feared, aided by falling gas prices and healthy job gains.
This means the Fed can continue ratcheting up interest rates with less risk of immediately crashing growth. However, policymakers are unlikely to declare mission accomplished and halt hikes anytime soon.
For the soft landing narrative to play out, retail strength and inflation moderation will need to persist over coming months. September offered promising signs, but more evidence is required to confidently say a harsh recession is avoidable. The Fed will be monitoring data closely to ensure its forceful actions steer the economy in the right direction.
Clinical-stage biotech Assembly Biosciences gained a powerful ally in developing next-generation antivirals through a new collaboration with pharma giant Gilead Sciences. The deal provides Gilead access to Assembly Bio’s portfolio of early-stage assets while giving Assembly funding and expertise to advance its programs.
Under the 12-year partnership announced Monday, Gilead will provide $100 million upfront, including an equity investment at a premium. Assembly Bio gains potential milestone payments, royalties, and profit-sharing as programs progress.
For investors, the collaboration validates Assembly Bio’s antiviral pipeline and represents significant long-term revenue potential. The deal also propels Assembly closer to becoming a fully integrated biotech firm.
Assembly’s current clinical assets target major viral diseases like hepatitis B virus (HBV) and herpes simplex virus (HSV). Its preclinical pipeline holds promise against hepatitis D virus (HDV), human cytomegalovirus, and more.
Gilead brings extensive experience developing and commercializing leading antiviral drugs in HIV and hepatitis C. The pharma giant now doubles down on virology via Assembly’s early-stage assets.
Opting into a program after proof-of-concept could cost Gilead at least $45 million, signaling confidence in Assembly’s science. The biotech leads R&D initially, with Gilead taking over once assets transition to late-stage trials and commercialization.
For Assembly investors, this deal structure provides valuable de-risking of the pipeline. The company secures funding to advance programs while sharing in the upside if Gilead opts in to lucrative late-stage development and sales.
Assembly is eligible for up to $330 million per program in milestones post opt-in. Royalties range from high single digits to high teens. The biotech can also opt into U.S. profit-sharing.
These economics help offset the risk of clinical failure for Assembly’s shareholders. Meanwhile, Gilead pays for the privilege of accessing Assembly’s innovating antiviral pipelines.
The partnership enhances Assembly’s financial position and extends its operating runway. This enables advancing other preclinical programs beyond the leads Gilead can opt into.
For example, Assembly recently unveiled a promising pan-herpesvirus asset that could treat multiple herpes infections from one oral pill. Such follow-on compounds ensure future revenue potential.
Meanwhile, major progress by Gilead with Assembly’s lead assets could generate substantial royalties and profit-sharing income. Upside from the deal should become clearer as Gilead opts to license drugs entering late-stage testing over the 12-year term.
With a strengthened balance sheet and veteran partner at its side, Assembly Bio seems poised for a breakthrough as a developmental biotech focused on next-gen antivirals.
The Gilead deal provides third-party validation of Assembly’s science and a critical launchpad toward integrated status combining R&D, late-stage trials, and commercialization.
For Assembly investors, these benefits significantly de-risk the journey to having approved antiviral products on the market. If clinical programs pan out as hoped, the payoff from this partnership could be huge.
For many individuals, investing in the stock market is a pathway to financial growth and security. And while familiar large-cap names like Amazon, Apple and Microsoft may first come to mind when building a portfolio, small-cap stocks represent another promising segment of the market.
Today, we’ll take an in-depth look at the world of small-cap stocks and examine whether they can make a wise addition to your investment strategy. Whether you’re a seasoned investor looking to broaden your portfolio or someone new to stock market investing, this article will answer all your questions about what a small-cap stock is and much more.
Defining Small-Cap Stocks
First, let’s start with a quick definition – what exactly are small-cap stocks?
Small-cap stocks refer to companies that have a relatively small market capitalization, generally between $300 million and $2 billion. Market capitalization (or market cap) is calculated by multiplying the total number of company shares outstanding by the current market price per share.
So a company with 10 million shares trading at $20 per share would have a market cap of $200 million, landing it in the small-cap category.
In contrast, large-cap stocks like Apple, Microsoft, and Amazon are valued in the hundreds of billions. Small-cap stocks represent companies in earlier developmental stages with significant room for expansion ahead of them before reaching the scale of the market leaders. Some well-known examples of small-cap companies across different sectors are The ODP Corporation, Bassett Furniture, The Geo Group and Maple Gold Mines.
Small-cap stocks sit in the middle between micro-cap stocks (under $300 million market cap) and mid-cap stocks ($2 billion to $10 billion market cap). At the higher end are large-cap stocks (over $10 billion) and mega-cap stocks like Apple that exceed $200 billion in market value.
For many growth-oriented investors, small-cap stocks represent an opportunity to invest early in a company with potential for rapid expansion before they become household names. The early-stage status means small-cap companies have ample runway to grow their market share and establish themselves as industry leaders over time. With the right investments, small-cap stocks can deliver exponential returns compared to slow and steady large-cap stocks that have less growth potential ahead.
However, the smaller size and scale of these companies also leads to higher volatility and risk compared to large-caps with firmly entrenched market positions. We’ll explore these trade-offs more in the sections ahead.
Key Characteristics of Small-Cap Stocks
Now that we’ve defined what a small-cap stock is, let’s dive deeper into some of the typical characteristics of these types of companies:
Greater Growth Potential
With small-cap companies still in relatively early phases of their lifecycle, their products and services often have significant room for wider adoption and expansion. Small-cap stocks are laser focused on growing their market share rapidly during the critical early innings before competitors emerge. They pour capital into product development, sales and marketing, and geographic expansion while large-caps aim to protect and defend their existing turf.
Higher Volatility
With smaller financial resources and operational scale, small-cap stocks tend to be more vulnerable to market swings and changing economic conditions. As a result, their share prices can fluctuate wildly in short periods of time as sentiment shifts. On the other hand, large-cap stocks boast stability and steady, predictable growth.
Less Analyst Coverage
Wall Street banks and financial media outlets tend to devote the bulk of their research and coverage to large, established companies that dominate their industries. Meanwhile, small-cap stocks fly under the radar in comparison. This lack of attention results in opportunities for diligent individual investors to uncover small companies poised for growth before they gain widespread analyst and investor attention. This is where Channelchek comes in. Our market research is specific to small cap stocks and completely free as long as you join our community
Potential for Undervaluation
The limited analyst coverage and lack of institutional investor interest in small-cap stocks can at times lead to mispricing opportunities where the stocks trade at valuations that do not fully reflect their growth prospects and upside potential. Savvy investors can find hidden gems trading at deep discounts relative to their future earnings power. Of course, finding these diamonds in the rough requires rolling up your sleeves and digging into financial statements.
Liquidity Challenges
The total number of outstanding shares is far lower for small-cap companies versus large-caps, which leads to lighter trading volumes and thinner liquidity. This results in wider bid-ask spreads, premiums and heightened volatility when entering and exiting positions. Large-cap stocks benefit from abundant liquidity and tight spreads, allowing large trades to be executed seamlessly.
In summary, while small-cap stocks carry additional risk factors, their lower valuations, lack of analyst coverage and undiscovered status provide significant upside potential for enterprising investors willing to conduct their own due diligence.
The Pros and Cons of Small-Cap Stocks
Now that we understand the typical traits of small-caps relative to large-caps, let’s examine the key potential benefits and drawbacks of adding these types of companies to your investment portfolio:
Potential Benefits of Small-Cap Stocks
– Outsized Growth Potential – With the right stock picks, small-cap companies can deliver exponential returns over a relatively short timeframe that mature large-cap stocks simply cannot match. Just look at Amazon’s meteoric rise over the past decade when it was still a small-cap.
– Undervaluation Opportunities – Due to the lack of widespread analyst coverage, small-cap stocks can become underpriced or neglected relative to their growth prospects. Dedicated investors can find hidden gems trading at compelling valuations before market awareness builds.
– Portfolio Diversification – Because small-cap stocks behave differently than large-caps with lower correlation, adding small-cap exposure can improve the overall risk-adjusted return profile of a portfolio heavy in stable large-cap names.
– Inflation Hedge – During periods of rising inflation, small-cap stocks have historically outperformed as they are more nimble in passing on price increases to customers. Large-cap names are slower to react.
Potential Drawbacks of Small-Cap Stocks
– Higher Volatility – The amplified swings in small-cap share prices require mental fortitude during periods of market stress. Their risk profile means small-caps are better suited for those with higher risk tolerance.
– Liquidity Risk – The lower trading volumes inherent with small-caps necessitates close monitoring of bid-ask spreads and liquidity when entering or exiting a position. Sudden moves can lead to dislocation.
– Fewer Resources – Compared to the robust balance sheets of large-caps, small-cap companies have less financial flexibility and capital reserves which can leave them vulnerable during recessions.
– Lack of Institutional Coverage – Minimal Wall Street research coverage means individual investors must conduct their own due diligence. Those relying purely on analyst reports will be late to the party.
All in all, while small-cap stocks carry some additional risks and challenges, their return potential merits inclusion for at least a portion of growth-oriented investors’ portfolios.
Researching and Investing in Small-Caps
Here are some key factors for investors to weigh before adding small-cap exposure:
– Assess your personal risk tolerance – The inherent volatility of small-cap stocks means they are better suited for those investors with higher risk appetites and ability to withstand routine price swings. Make sure your temperament aligns.
– Consider investment timeframe – The long-term growth trajectories of small-caps make them ideal picks for investors with longer time horizons of at least 5-10 years rather than short-term trading mentality. Have patience.
– Conduct extensive due diligence – There’s far less third-party Wall Street research available on small-caps compared to large-caps. You’ll need to thoroughly comb through financial filings, growth prospects, competitive dynamics and management track records.
– Diversify across multiple small-caps – Build a basket of small-cap stocks across different sectors to smooth volatility and avoid concentration risk. Layer in large-cap and mid-cap holdings.
– Monitor liquidity trends – Keep an eye on trading volumes and bid-ask spreads of small-caps you own to ensure ample liquidity exists when entering and exiting positions. Liquidity shrinks rapidly during downturns.
Taking these elements into account allows you to make informed decisions before venturing into small-caps.
Investing Strategies for Small-Cap Stocks
If small-cap stocks fit your risk tolerance, goals and research diligence, here are some effective approaches:
– Seek out promising sectors – Target high-growth sectors like technology, healthcare and consumer discretionary where disruption potential is highest rather than diversified small-cap funds.
– Identify company-specific catalysts – Look for upcoming product launches, partnerships, FDA approvals or expansion plans that could serve as catalysts for a sharp rise in sales, earnings and sentiment.
– Take a long-term perspective – Tune out the noise and stick to your original investment thesis during temporary price swings. Have conviction in your small-cap picks.
– Utilize stop-loss orders – Use stop-loss orders to automatically sell positions if prices breach certain thresholds as a risk management tactic. Re-enter when volatility subsides.
– Reinvest dividends for compounding – Many small-caps pay dividends despite early-stage status. Reinvesting dividends turbocharges long-term total returns.
– Consider small-cap index funds – For diversification, consider cost-effective small-cap index funds from leading providers like Vanguard, Schwab and iShares.
– Limit overall allocation – Given the amplified risk, small-caps should likely account for no more than 10% of your total portfolio assets. Size positions accordingly.
With rigorous research and prudent strategy, small-cap stocks can boost returns for enterprising investors willing to accept the higher volatility profile.
The Bottom Line on Small-Cap Stocks
In the high-growth small-cap arena, there will inevitably be huge winners and unfortunate flameouts. But for risk-tolerant investors, the profit potential justifies the bumpy ride. By taking a selective approach, diversifying across multiple small-caps, and holding for long time horizons, much of the volatility smoothes outs while allowing winners time to fully capture market share.
While individual small-cap stocks require diligence, broad exposure can be gained cost-effectively through small-cap index funds and ETFs. Overall, small-cap stocks fill an important niche in balanced portfolios, providing a return boost that slow-changing large-caps cannot match. For investors willing to accept fluctuations in the pursuit of superior long-term returns, small-cap stocks warrant consideration.
Join the Channelchek community to keep up with the latest small-cap insights and start making informed investment decisions!
Internet & Digital Media Stocks Outperform – But Don’t Get Too Excited
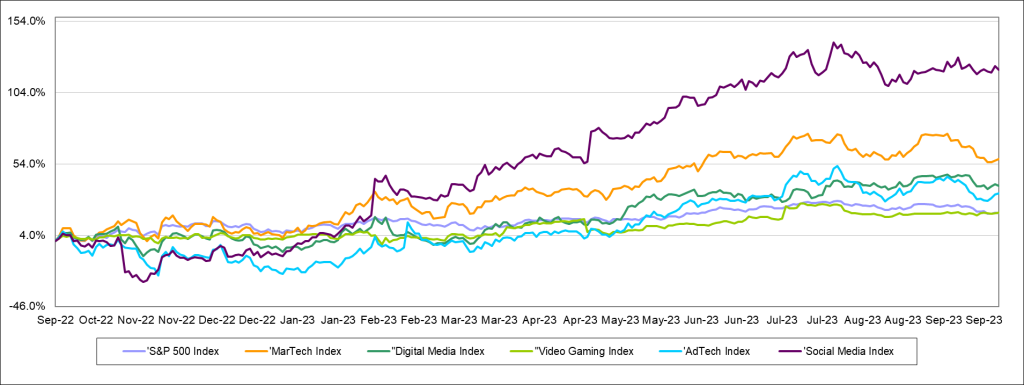
After increasing by 8% in the second quarter of 2023, the S&P 500 was unable to hold onto those gains in the third quarter. The S&P index decreased by 4% in the third quarter, a decline which we attribute to the market revising its interest rate expectations to one in which rates would remain “higher for longer”. Large cap stocks that weighed on the broad market index included tech stocks such as Apple (AAPL: -12%), Microsoft (MSFT: -7%) and Tesla (TSLA: -4%). Despite this small step backwards, the S&P 500 Index increased by 20% through the first nine months of the year.
Each of Noble’s Internet and Digital Media Indices, which are market cap weighted, outperformed the S&P 500 in the third quarter, but the double-digit gains from the previous quarter (2Q 2023) moderated significantly. Sectors that outperformed the S&P 500’s 4% increase include Noble’s Digital Media Index (+6%), Social Media Index (+4%), Gaming Index (+3%), Ad Tech Index (+1%) and MarTech Index (-3%). Despite these relatively positive results, the prevailing theme within each sector was that the largest cap stocks performed the best while smaller cap stocks across a variety of sectors struggled.
STOCK MARKET PERFORMANCE: INTERNET AND DIGITAL MEDIA
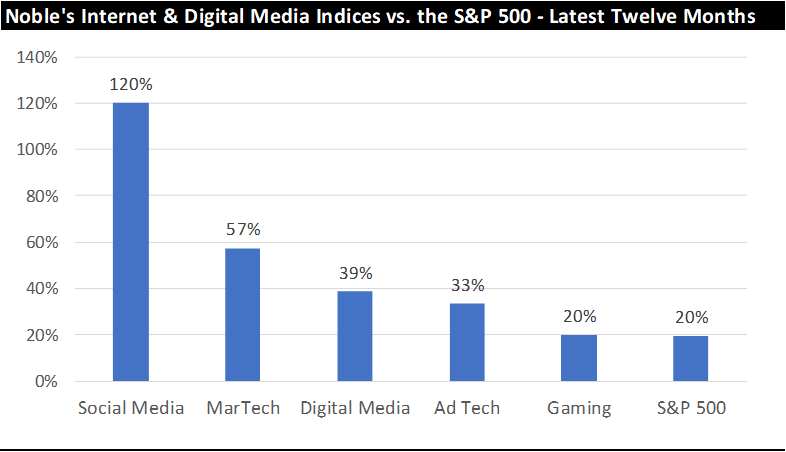
Perhaps more importantly, each of Noble’s Internet and Digital Media Indices have outperformed the S&P 500 over the latest twelve months. The S&P 500 Index has increased by 20% over the last year (through 9/30/2023), which trailed the performance of the each of Noble’s Internet and Digital Media Indices, as shown below:
Alphabet Powers Digital Media Index Higher Despite Broader-Based Sector Weakness
The best performing index during the quarter was the Noble’s Digital Media Index, but the sector’s “strong” performance is deceiving. Shares of Alphabet (a.k.a. Google: GOOGL) increased by 9% during the quarter, and the company size relative to its peers helps explain the vast majority of the sector’s performance. Google’s market cap is 8x larger than its next largest “peer” in Netflix, and it is 160 times that of the average market cap of its Digital Media peers. Google beat expectations across all metrics (revenue, EBITDA, free cash flow) and guided to improved profitability as it streamlines workflows. The company is also increasingly perceived as a beneficiary of AI. While Alphabet shares performed well, they mask the fact that shares of only 2 of the sector’s 12 stocks were up during the third quarter. The other Digital Media stock that performed well in the quarter was FUBO (FUBO), whose shares increased by 29% in 3Q 2023. Of the 10 other digital content providers in the sector, 7 of them posted double-digit stock price declines in the third quarter.
Large Cap Meta Powers the Social Media Index Higher
Shares in Meta Platforms (formerly Facebook) rose for the third straight quarter. Shares increased by 5% and were up 150% through the first nine months of the year. Meta shares increased by 8% at the start of the third quarter due to excitement around the launch of Threads, Meta’s answer to Twitter. Over 100 million people signed up for Threads within the first five days of its rollout and positions the company well for continued revenue growth once it begins to monetize this new opportunity.
As with the Digital Media Index, the in the Social Media Index masked underlying weakness across several smaller cap stocks. Of the 6 stocks in the Social Media Index, only Meta shares increased during the quarter. Several social media companies performed poorly during the quarter including Spark Networks (LOVL.Y: -59%), which filed to delist its shares, Nextdoor Holdings (KIND: -44%), which has struggled to reach profitability, and Snap (SNAP: -25%), which guided to revenue declines in 3Q 2023.
Video Gaming, Ad Tech and MarTech Indices Continue the Trend: “No Love” For Small Cap Stocks
As was the case in the Digital Media and Social Media sectors, the same trends held true in the other sectors: in general, large cap stocks outperformed small cap stocks. For example, Noble’s Video Gaming Index increased by 3% in the third quarter, driven by Activision Blizzard (ATVI: +11%), and to a lesser extent SciPlay Corp (SCP: +16%). However, 7 other stocks in the video gaming sector posted stock price declines in the third quarter. Larger cap names such as EA Sports (EA: -7%) and Take-Two Interactive (TTWO: -5%) posted mid-single digit stock price declines while every small cap video gaming stock posted double digit declines.
Noble’s Ad Tech Index increased by 1% during the quarter driven by shares of AppLovin (APP: +55%), and Taboola (TBLA: +22%). However, just 7 of the sector’s 20 stocks were up for the quarter, and 10 stocks in the sector posted double digit declines.
Finally, Noble’s MarTech Index decreased by 3% (the only index that declined during the quarter), with the sector’s largest companies, Adobe (ADBE: +4%) and Shopify (SHOP: -16%) posting mixed results. Outside of these mega-cap stocks, the theme of underlying weakness prevailed: only 5 of the 20 stocks in the sector posted stock price increases, while one was flat and the other 14 were down. Eleven of the 20 stocks in the MarTech sector posted double digit stock price declines.
3Q 2023 Internet and Digital Media M&A – A Significant Slowdown
According to Dealogic, which tracks global M&A, deal activity in North America decreased by 37% to 8,600 deals in the third quarter, however, the value of deals in North America increased by 34% to $375 billion. Dealogic noted that there was an increase in the number of scaled transactions (those with deal values in the $1 billion to $2 billion range), which increased to the highest level in 7 quarters. We did not see this phenomenon in Noble’s Internet & Digital Media sectors.
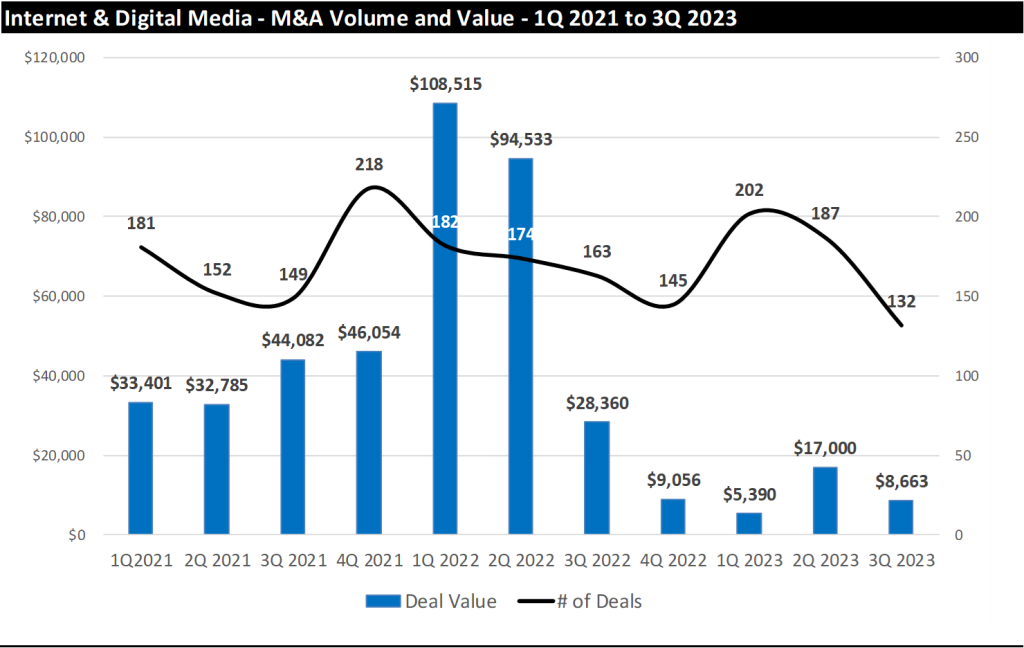
Based on our analysis, deal making in the Internet & Digital Media sectors in the third quarter of 2023 slowed rather dramatically. The total number of Internet & Digital Media deals we tracked in the quarter decreased by 29% sequentially to 132 deals in 3Q 2023 down from 169 deals in 2Q 2023. On a year-over-year basis, the total number of deals decreased by 22% to 132 deals in 3Q 2023 from 187 deals in the third 3Q 2022.
The decline in the number of deals was exceeded only by the decline in the dollar value of M&A deals. Announced M&A deal value fell sequentially by 50% to $8.7 billion in 3Q 2023 compared to $17.2 billion in announced deals in 2Q 2023. While total deal value of announced deals decreased significantly on a quarter-over-quarter basis, the decrease was even more pronounced on a year-over-year basis, as deal values decreased by 71% to $8.7 billion in deal value from $29.4 billion in 3Q 2022, as shown in the chart on the next page.
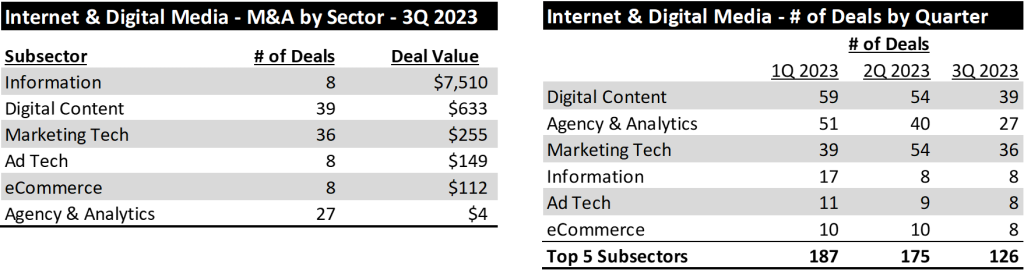
From a deal activity perspective, the most active sectors we tracked were Digital Content (39 deals), MarTech (36 deals) and Agency & Analytics (27 deals). From a dollar value perspective, Information Services led with $7.5 billion, followed by Digital Content with $633 million and MarTech with $255 million, as shown below (left).
As shown above (right), the number of transactions has fallen in each of the last two quarters. Across the top 5 subsectors of Internet and Digital Media, the number of transactions has fallen from 187 transactions in the first quarter to 126 transactions in the third quarter.
We attribute this decline to a variety of factors. First, an increase in interest rates has resulted in far fewer transactions in excess of $10 billion. With rates 300 basis points higher than at the start of the year, an incremental $10 billion in debt implies a $30 million per year increase in interest expense. These higher rates result in lower returns for acquirers. Second, we believe traditional lenders have become more cautious in providing the necessary capital to fund acquisitions. Some have pointed to commercial banks and their large exposure to commercial real estate as a reason for this more cautious view. Finally, for advertising-based businesses, there are some indications that brands are waiting longer before committing to or booking ad campaigns, which has reduced visibility and made financial forecasting more difficult.
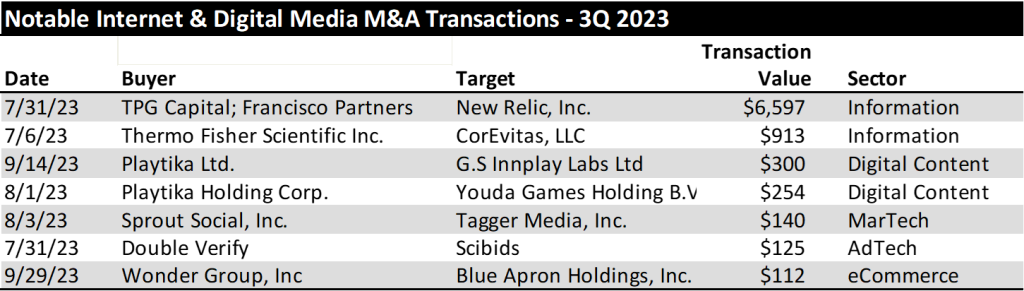
Information and Video Gaming Deals Drive the Largest Transactions in 3Q 2023
There were far fewer $100M+ transactions 3Q 2023. In the second quarter of 2023 there were 16 transactions in the Internet & Digital Media sector with transaction values greater than $100 million. In the third quarter, that amount slowed to less than half: just 7 transactions exceeded $100 million in purchase price. The Information Services sector accounted for the two largest transactions in the quarter, followed by Digital Content deals, in particular gaming deals. The list of M&A transactions that exceeded $100 million are shown in the chart below.
We believe the M&A market has slowed as corporations get accustomed to the prospect of higher rates for longer. One key driver of future M&A could come from distressed M&A dealmaking. Finally, another area of increased activity could come from U.S. corporations acquiring European companies where relatively weaker European currencies are making the valuations of European companies look more attractive.
TRADITIONAL MEDIA COMMENTARY
The following is an excerpt from a recent note by Noble’s Media Equity Research Analyst Michael Kupinski
Overview – The Case for Small Caps
Small cap investors have gone through a rough period. For the past several years, investors have anticipated an economic downturn. With these concerns, investors turned toward “safe haven,” large cap stocks, which typically have the ability to weather the economic headwinds and have enough trading volume should investors need to exit the position. Since 2018, small cap stocks have underperformed the general stock market, with annualized returns of just 3.7% as measured by the S&P 600 Small Cap Index versus the general market of 10.2% as measured by the S&P 500 Index. Another small cap index, the Russell 2000, increased a more modest 2.9% annually over the comparable period. The S&P 500 is larger cap, with the minimum market cap of $14.6 billion. The S&P 600 is smaller cap, a range of $850 million to $3.7 billion, with the Russell 2000 median market cap $950 million. Some of the even smaller cap stocks, those between $100 million to $850 million, have significantly underperformed the S&P 600. This is the first time that small caps underperformed a bullish period for all stocks since the 1940s. Notably, there is a sizable valuation disparity between the two classes, large and small cap, one of the largest in over 20 years.
Some of the small cap stocks we follow trade at a modest 2x Enterprise Value to EBITDA, compared with large cap valuations as high as 13x to 15x. By another measure, small cap stocks may be the only class trading below historic 25 year average to the median Enterprise Value to EBIT. Why the large valuation disparity? We believe that there is higher risk in the small cap stocks, especially given that some companies may not be cash flow positive, have capital needs, or have limited share float. But investors seem to have thrown the baby out with the bathwater. While those small cap stocks are on the more speculative end of the scale, many small cap stocks are growing revenues and cash flow, have capable balance sheets, and/or are cash flow positive. For attractive emerging growth companies, the trading activity will resolve itself over time. Some market strategists suggest that small cap stocks trade at the most undervalued in the market, as much as a 30% to 40% discount to fair value.
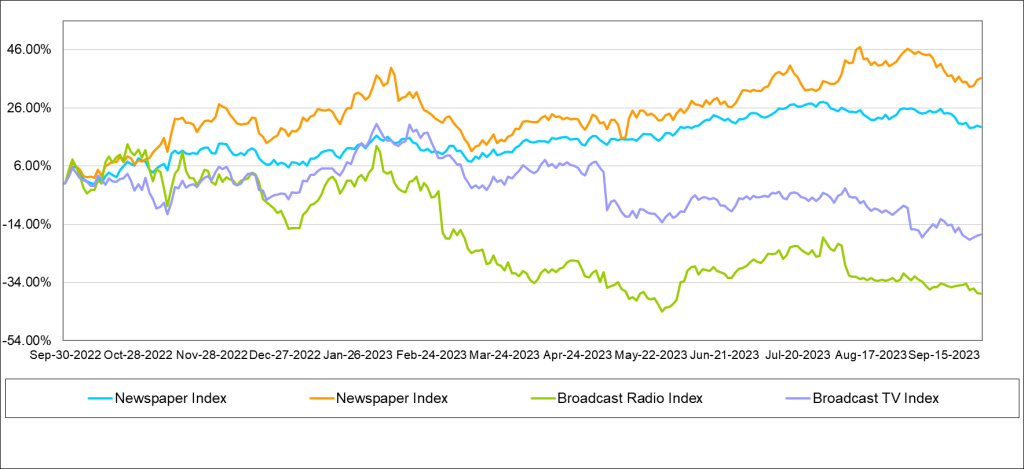
STOCK MARKET PERFORMANCE: TRADITIONAL MEDIA
Are we on the cusp of a small cap cycle? Some fund managers think so. Such a cycle could last 10 years or longer. In this report, we highlight a few of our small cap favorites in the Media sector, those include companies that have attractive growth characteristics, some with or without an improving economy, capable balance sheets, and limited capital needs. Our current favorites based on growth opportunity and stock valuation include: Direct Digital (DRCT), Entravision (EVC), E.W. Scripps (SSP), Gray Television (GTN), and Townsquare Media (TSQ).
Traditional Media Stock Price Performance
Virtually all traditional media stocks underperformed the general market in the past quarter and trailing 12 months, except for the Publishing group, as shown in the chart at the bottom of the previous page. In the latest quarter, Publishing stocks outperformed the general market, up 3% versus down 4% for the general market as measured by the S&P 500 Index. The average Publishing stock is up 7% over the past 12 months, with some of the larger cap publishing stocks up significantly more, over 20%. More details on the Publishing performance is in the Publishing section of this report. In the last quarter, the Radio stocks were the worst performing group, down on average 10%. In addition, the Radio stocks were the worst performing group in the third quarter as well, down an average of 13% for the quarter.
Broadcast Television
Have TV Stocks Been Discounted Too Much?
We believe that the economic headwinds of rising interest rates and inflation have begun to hit local advertising. Local advertising had been relatively stable, favorably influenced by a resurgence of auto advertising. Notably, local advertising fared much better than national advertising, which was down in the absence of political advertising. As we look toward the third quarter, local advertising appears to be weakening, but notably, national advertising appears to be doing much better, driven by an early influx of political advertising. While it was assumed that political would increase in the fourth quarter due to the run-off of the Republican presidential candidates, especially in early primary States, we believe that President Biden has recently stepped-up advertising, particularly to the Hispanic community. We have noticed Biden advertising even in Florida! So, what does this mean for media fundamentals?
It is difficult to predict where political dollars will be spent and not all political dollars will be spent evenly, geographically or by stations in a particular market. Furthermore, political dollars may be pulled back in a market should a particular candidate pull ahead in the polls. Political dollars were anticipated to be spent in early primary States, specifically for the Republican candidates. But the Biden money is a surprise. Biden appears to be spending early and in areas to solidify a key voting block, Hispanics. Of course, the Biden campaign may broaden its spending to other voting blocks as well. In our view, 2024 will be a banner year for political advertising given the large amount of political fundraising by the candidates and by Political Action Committees.
The prospect of weak local advertising, however, may cast a pall over the current expected strong revenue growth in 2024. Many analysts, including myself, expected that economic prospects would improve in 2024, which would have provided a favorable tailwind for a significant improvement in total TV advertising in 2024. Certainly, it is likely that the Fed may lower interest rates in 2024, potentially providing a boost to local advertising prospects, but that improvement may come late in the year. Overall, in spite of the weakening Local advertising environment, given the improving National advertising trends, overall TV advertising appears to have stabilized.
For now, we are cautiously optimistic about 2024, with the caveat that revenue growth may be somewhat tempered given the current weak local advertising trends. Nonetheless, we believe that we are nearing the trough for this economic cycle. Some companies, like E.W. Scripps, are in a favorable cycle for retransmission renewals. Retransmission revenues now account for a hefty 50% of Scripps’ total broadcast revenue. In Scripps’ case, 75% of its subscribers are under renewal, which it recently announced was completed. As such, the company reaffirmed guidance that retransmission revenue will increase 15% in 2024 and lead to a substantial increase in net retransmission revenue. We remain constructive on TV stocks, as high margin political advertising should boost balance sheets and improve stock valuations.
In the latest quarter, TV stocks underperformed the general market. The Noble TV Index decreased 13%, underperforming the 4% decline in the general market as measured by the S&P 500. The poor performance of the latest quarter adversely affected the trailing 12 month performance, bringing the Noble TV Index to a 18% decline for the trailing 12 months. Individual stocks performed more poorly, with only the shares of Fox Corporation registering a modest gain for the trailing 12 months of 3%. The Noble TV Index is market cap weighted, and, as such, Fox with a $15 billion market cap, carried the index. Outside of the relatively strong performance of this large cap stock, all of the TV stocks were down and down big, between 18% to 59% over the past 12 months.
We believe that investors have shied away from cyclicals, smaller cap stocks, and from companies with higher debt levels. This accounts for the poor performance of Gray Television (GTN) and E.W. Scripps (SSP), both of which have elevated debt leverage given recent acquisitions. Both were among the poorest performers for the latest quarter and for the trailing 12 months. GTN shares were down 12% in the third quarter and 38% for the last 12 months; the SSP shares down 40% and 58%, respectively.
We believe that the sell-off has been overdone, especially as the industry is expected to cycle toward an improved fundamental environment in 2024. As shown in the comp sheet on page 20, Broadcast TV stocks trade at a modest 5.3x Enterprise Value to our 2024 adj. EBITDA estimates, well below historic 20-year average trading multiples of 8x to 12x. We believe that the depressed valuations largely discount the prospect of an economic downturn and do not reflect the revenue and cash flow upside as we cycle into a political year. Given the steep valuation discount to historic levels, we believe that the stocks are 15% to 20% below levels where the stocks normally would be given a favorable political cycle. Our favorites in the TV space include: Entravision (EVC), one of the beneficiaries of the influx of political advertising to Hispanics; E.W. Scripps (SSP), a play on political, with the favorable fundamental tailwind of strong retransmission revenue growth; and, Gray Television (GTN), one of the leading political advertising plays.
Broadcast Radio
Shoring Up Balance Sheets
The Radio industry has struggled in the first half as National advertising weakened throughout the year. On average National advertising was down roughly 20% or more for many Radio broadcasters. Local held up relatively well, although down in the range of 3% to 5%. Fortunately, for many broadcasters, a push into digital, which grew in the first half, helped to stabilize total company revenues. As we look to the third and fourth quarters, we believe that Local advertising is weakening, expected to be down in the range of 5% to 7%, or more in some of the larger markets. For some, National advertising is improving, driven by political advertising. However, political is not evenly spread, so we anticipate that there will be a cautious outlook for many in the industry for the second half of the year.
For some in the industry, the challenged revenue environment has put a strain on managing cash flows to maintain hefty debt loads. We believe that debt leverage is among the top concerns for investors. Many of the poorest performing stocks in the quarter and for the trailing 12 months carry some of the highest debt leverage in the industry. The Noble Radio Index decreased a significant 14% in the latest quarter compared with a 4% decline for the general market. A look at the individual stock performance tells a more disappointing story. Shares of Salem Media declined 38% in the latest quarter, bringing 12-month performance to a 44% decline. Shares of iHeart Media declined 49% for the year.
Notably, Salem Media assuaged much of its liquidity concerns with recent asset sales. Such sales will bring in roughly $30 million, allowing it to fully pay off its $22 million revolver and have some flexibility with remaining cash on its balance sheet. We do not believe that investors have fully credited the significance of the recent asset sales.
One bright spot in the group was the shares of Townsquare Media (TSQ). While TSQ shares gave back a significant 27% in the third quarter, the shares are still up 20% over the past 12 months, among one of the best performing in the industry. We believe that the company’s initiation of a substantial dividend resonated with investors.
While the industry faces fundamental headwinds given the current economic challenges, we believe that most companies have made a shift toward faster growth, digital business models. In addition, we believe that Radio will see a lift from political advertising in 2024, although not to the extent that the TV industry will see. Nonetheless, we look for an improving advertising scenario in 2024, and as a result, we are constructive on the industry. One of our current favorites leads the industry in its Digital transition, Townsquare Media. As shown in the comp sheet on page 21, TSQ shares are among the cheapest in the industry, trading at 5.1x EV to our 2024 adj. EBITDA estimate, well below the average of 7.1x for the industry.
Publishing
Further Cost Cutting Will Cut Deep
Publishers are not likely to be spared from the weakening local advertising business, but publishers have a playbook on areas to cut expenses to manage cash flows. We believe that its Digital businesses should help offset some of the anticipated revenue declines on its print legacy business. We believe that the next round will cut deep into its legacy business, through the elimination of print days. Such a move likely will indicate further pressure on print revenues but would not proportionately decrease cash flow. Some print days have very little advertising and/or advertisers may shift some spending to other print days.
While many publishers would like to have a long runway for its cash flowing print business, such possible moves would accelerate the digital transition. Notably, with just some stabilization of revenues on the print side, many publishers have the potential to show total company revenue growth given benefit from digital revenue. With the prospect of strategies that may cut print days, we believe that total revenue growth may be pushed out to 2025.
Many of the Publishing stocks were written off long ago, but surprisingly, the Publishing stocks have been among the best stock performers in the latest quarter and for the trailing 12 months. The Noble Publishing Index increased a solid 36% in the trailing 12 months, outperforming the general market (as measured by the S&P 500) of 19% in the comparable time frame.
In the third quarter, Publishing stocks increased 4%, outperforming the S&P 500, which declined 4%. All of the publishers increased, with the exception of Lee Enterprises (LEE). Lee shares increased substantially a year earlier on takeover rumors. Since then, the shares have come back down to earth, while the rest of the industry moved higher. The stronger performers in the industry, however, were the larger cap companies, such as News Corp (NWSA) and The New York Times (NYT). In the latest quarter, the shares of The New York Times increased roughly 5% and the shares are up 27% for the trailing 12 months. The shares of Gannett increased a solid 9% in the latest quarter, as well.
As the Newspaper comp sheet on page 22 illustrates, there is a disparity among some of the larger, more diversified companies, like The New York Times and News Corporation. NYT shares trade at a hefty 15.7x EV to 2024 adj. EBITDA estimates, well above much of the pack currently trading in the 5x multiple range. We believe that this valuation gap should narrow, especially as many of the companies, like Lee and Gannett, have a burgeoning Digital business. While the industry faces secular challenges of its print business and there are economic headwinds in the very near term, we believe that companies like Lee Enterprises have the ability to manage cash flows and grow its digital businesses. Given the compelling stock valuation disparity, the shares of Lee Enterprises lead our list of favorites in the sector.
This newsletter was prepared and provided by Noble Capital Markets, Inc. For any questions and/or requests regarding this news letter, please contact Chris Ensley
DISCLAIMER
All statements or opinions contained herein that include the words “ we”,“ or “ are solely the responsibility of NOBLE Capital Markets, Inc and do not necessarily reflect statements or opinions expressed by any person or party affiliated with companies mentioned in this report Any opinions expressed herein are subject to change without notice All information provided herein is based on public and non public information believed to be accurate and reliable, but is not necessarily complete and cannot be guaranteed No judgment is hereby expressed or should be implied as to the suitability of any security described herein for any specific investor or any specific investment portfolio The decision to undertake any investment regarding the security mentioned herein should be made by each reader of this publication based on their own appraisal of the implications and risks of such decision This publication is intended for information purposes only and shall not constitute an offer to buy/ sell or the solicitation of an offer to buy/sell any security mentioned in this report, nor shall there be any sale of the security herein in any state or domicile in which said offer, solicitation or sale would be unlawful prior to registration or qualification under the securities laws of any such state or domicile This publication and all information, comments, statements or opinions contained or expressed herein are applicable only as of the date of this publication and subject to change without prior notice Past performance is not indicative of future results.
Please refer to the above PDF for a complete list of disclaimers pertaining to this newsletter.
Shares of clinical-stage biotech Prothena Corp skyrocketed over 20% on Monday amid reports the company is exploring strategic options including a potential sale. Prothena specializes in developing therapies for neurodegenerative diseases like Alzheimer’s, making it a hot target for larger pharmaceutical firms hungry for new assets in this space.
Based in Ireland and spun off from Elan Corp in 2012, Prothena focuses on protein misfolding disorders. Its pipeline features several promising programs targeting proteins believed to play a key role in Alzheimer’s and other neurological conditions with high unmet need.
Prothena’s lead candidate is birtamimab, an antibody-based therapy for AL amyloidosis in late-stage studies. Results expected later this year or in early 2024 could support regulatory filings. Beyond amyloidosis, the company is going all-in on Alzheimer’s research.
The most advanced Alzheimer’s asset is PRX012, an antibody targeting amyloid beta proteins thought to drive disease progression. Prothena is also developing a dual vaccine dubbed PRX012/PRX123 against amyloid beta and tau proteins. Reducing both proteins simultaneously may provide better clinical benefit.
These programs have already attracted partnership interest. Prothena has neuroscience collaborations with pharmaceutical giants Bristol Myers Squibb, Roche, and Novo Nordisk. Just this month, Bristol Myers exercised an option to license PRX005, Prothena’s anti-tau antibody, for nearly $60 million upfront.
But Prothena may seek an acquirer willing to buy the entire company outright. The potential payoff from Alzheimer’s success is massive given the huge unmet need. With late-stage data upcoming, now may be the optimal time for a sale.
Any acquirer would gain full access to Prothena’s Alzheimer’s pipeline, along with its programs for Parkinson’s disease and other neurodegenerative disorders. Adding these diverse assets to an existing neuroscience portfolio could create exciting synergistic opportunities.
Prothena’s small size also makes it financially digestible for big pharma buyers. The company’s market cap sits around $2.5 billion, presenting a worthwhile gamble for majors like Roche or Bristol Myers with scores of billions in annual revenue.
News of the company exploring strategic options sent Prothena shares surging 25% on nearly 6x normal volume. Investors are betting a buyout could be announced in coming months. Prothena’s pipeline progress makes it an alluring target.
Upcoming clinical results will prove whether Prothena’s Alzheimer’s bet pays off scientifically. But from a business perspective, the stars may be aligning for a near-term acquisition. Cash-rich pharmas need new prospects to bolster aging portfolios, and Prothena boasts some of the most exciting neurological assets out there.
If Prothena’s Alzheimer’s programs demonstrate strong efficacy, bidding wars could drive the buyout price sky-high. With biotech valuations rebounding from lows, management may see now as the perfect time to capitalize on these assets. Whether via sale, partnership or remaining independent, Prothena’s future direction should become clearer soon.