Less Expensive Batteries Don’t Always Come from Cheaper Materials

Image Credit: 24M Technology (MIT News)

Zach Winn | MIT News Office

When it comes to battery innovations, much attention gets paid to potential new chemistries and materials. Often overlooked is the importance of production processes for bringing down costs.

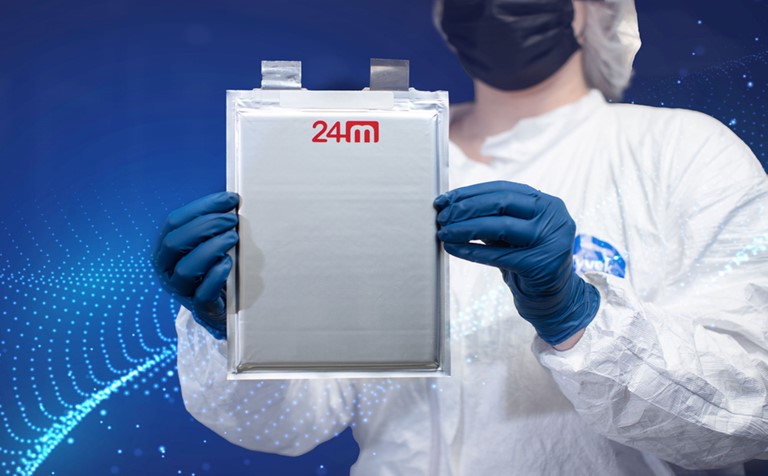
Now the MIT spinout 24M Technologies has simplified lithium-ion battery production with a new design that requires fewer materials and fewer steps to manufacture each cell. The company says the design, which it calls “SemiSolid” for its use of gooey electrodes, reduces production costs by up to 40 percent. The approach also improves the batteries’ energy density, safety, and recyclability.

Judging by industry interest, 24M is onto something. Since coming out of stealth mode in 2015, 24M has licensed its technology to multinational companies including Volkswagen, Fujifilm, Lucas TVS, Axxiva, and Freyr. Those last three companies are planning to build gigafactories (factories with gigawatt-scale annual production capacity) based on 24M’s technology in India, China, Norway, and the United States.

“The SemiSolid platform has been proven at the scale of hundreds of megawatts being produced for residential energy-storage systems. Now we want to prove it at the gigawatt scale,” says 24M CEO Naoki Ota, whose team includes 24M co-founder, chief scientist, and MIT Professor Yet-Ming Chiang.

Establishing large-scale production lines is only the first phase of 24M’s plan. Another key draw of its battery design is that it can work with different combinations of lithium-ion chemistries. That means 24M’s partners can incorporate better-performing materials down the line without substantially changing manufacturing processes.

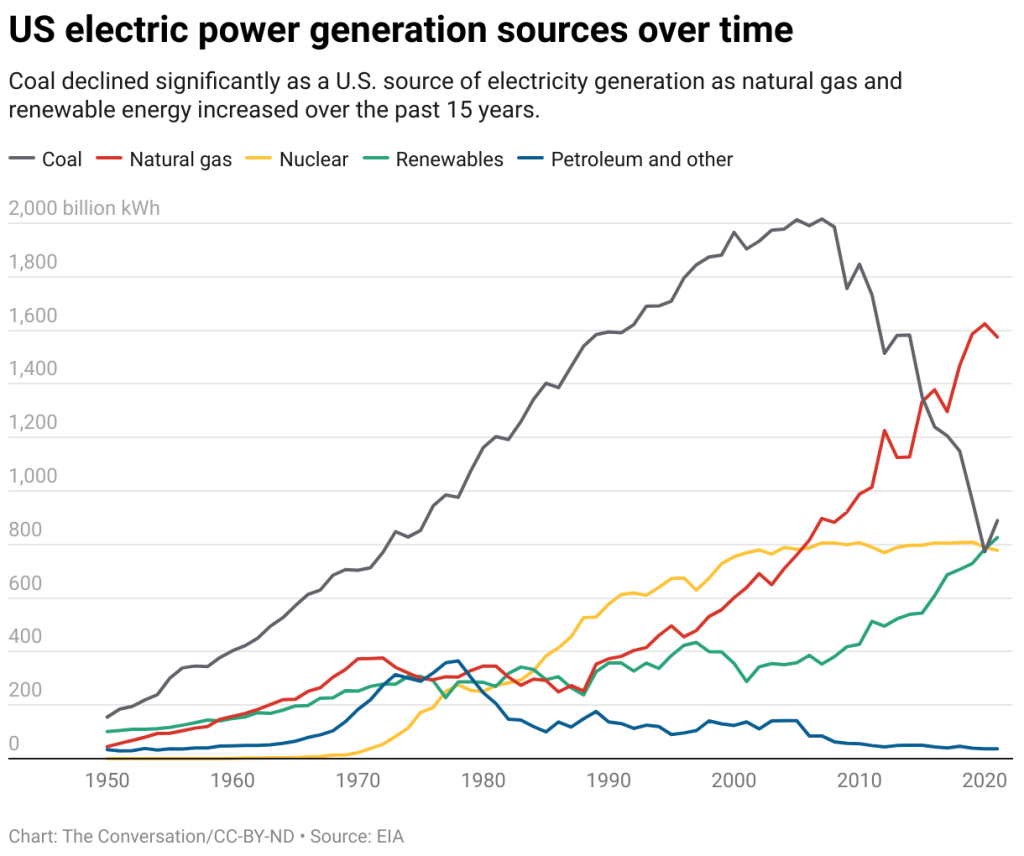
The kind of quick, large-scale production of next-generation batteries that 24M hopes to enable could have a dramatic impact on battery adoption across society — from the cost and performance of electric cars to the ability of renewable energy to replace fossil fuels.

“This is a platform technology,” Ota says. “We’re not just a low-cost and high-reliability operator. That’s what we are today, but we can also be competitive with next-generation chemistry. We can use any chemistry in the market without customers changing their supply chains. Other startups are trying to address that issue tomorrow, not today. Our tech can address the issue today and tomorrow.”

A Simplified Design

Chiang, who is MIT’s Kyocera Professor of Materials Science and Engineering, got his first glimpse into large-scale battery production after co-founding another battery company, A123 Systems, in 2001. As that company was preparing to go public in the late 2000s, Chiang began wondering if he could design a battery that would be easier to manufacture.

“I got this window into what battery manufacturing looked like, and what struck me was that even though we pulled it off, it was an incredibly complicated manufacturing process,” Chiang says. “It derived from magnetic tape manufacturing that was adapted to batteries in the late 1980s.”

In his lab at MIT, where he’s been a professor since 1985, Chiang started from scratch with a new kind of device he called a “semi-solid flow battery” that pumps liquids carrying particle-based electrodes to and from tanks to store a charge.

In 2010, Chiang partnered with W. Craig Carter, who is MIT’s POSCO Professor of Materials Science and Engineering, and the two professors supervised a student, Mihai Duduta ’11, who explored flow batteries for his undergraduate thesis. Within a month, Duduta had developed a prototype in Chiang’s lab, and 24M was born. (Duduta was the company’s first hire.)

But even as 24M worked with MIT’s Technology Licensing Office (TLO) to commercialize research done in Chiang’s lab, people in the company including Duduta began rethinking the flow battery concept. An internal cost analysis by Carter, who consulted for 24M for several years, ultimately lead the researchers to change directions.

That left the company with loads of the gooey slurry that made up the electrodes in their flow batteries. A few weeks after Carter’s cost analysis, Duduta, then a senior research scientist at 24M, decided to start using the slurry to assemble batteries by hand, mixing the gooey electrodes directly into the electrolyte. The idea caught on.

The main components of batteries are the positive and negatively charged electrodes and the electrolyte material that allows ions to flow between them. Traditional lithium-ion batteries use solid electrodes separated from the electrolyte by layers of inert plastics and metals, which hold the electrodes in place.

Stripping away the inert materials of traditional batteries and embracing the gooey electrode mix gives 24M’s design a number of advantages.

For one, it eliminates the energy-intensive process of drying and solidifying the electrodes in traditional lithium-ion production. The company says it also reduces the need for more than 80 percent of the inactive materials in traditional batteries, including expensive ones like copper and aluminum. The design also requires no binder and features extra thick electrodes, improving the energy density of the batteries.

“When you start a company, the smart thing to do is to revisit all of your assumptions  and ask what is the best way to accomplish your objectives, which in our case was simply-manufactured, low-cost batteries,” Chiang says. “We decided our real value was in making a lithium-ion suspension that was electrochemically active from the beginning, with electrolyte in it, and you just use the electrolyte as the processing solvent.”

In 2017, 24M participated in the MIT Industrial Liaison Program’s STEX25 Startup Accelerator, in which Chiang and collaborators made critical industry connections that would help it secure early partnerships. 24M has also collaborated with MIT researchers on projects funded by the Department of Energy.

Enabling the Battery Revolution

Most of 24M’s partners are eyeing the rapidly growing electric vehicle (EV) market for their batteries, and the founders believe their technology will accelerate EV adoption. (Battery costs make up 30 to 40 percent of the price of EVs, according to the Institute for Energy Research).

“Lithium-ion batteries have made huge improvements over the years, but even Elon Musk says we need some breakthrough technology,” Ota says, referring to the CEO of EV firm Tesla. “To make EVs more common, we need a production cost breakthrough; we can’t just rely on cost reduction through scaling because we already make a lot of batteries today.”

24M is also working to prove out new battery chemistries that its partners could quickly incorporate into their gigafactories. In January of this year, 24M received a grant from the Department of Energy’s ARPA-E program to develop and scale a high-energy-density battery that uses a lithium metal anode and semi-solid cathode for use in electric aviation.

That project is one of many around the world designed to validate new lithium-ion battery chemistries that could enable a long-sought battery revolution. As 24M continues to foster the creation of large scale, global production lines, the team believes it is well-positioned to turn lab innovations into ubiquitous, world-changing products.

“This technology is a platform, and our vision is to be like Google’s Android [operating system], where other people can build things on our platform,” Ota says. “We want to do that but with hardware. That’s why we’re licensing the technology. Our partners can use the same production lines to get the benefits of new chemistries and approaches. This platform gives everyone more options.”

Reprinted with permission of MIT News  ( http://news.mit.edu/)

Was the Recession Transitory?

Image Credit: Andrea Piacquado (Pexels)

Can We Wave Goodbye to Recession Talk Now that Q3 GDP is Positive?

Gross Domestic Product (GDP), the “advance estimate,” has shown we were not in a recession during the third quarter; instead, the economy expanded. This is a dramatic turn-around from the final data for the previous first two quarters of 2022, which show the U.S. economy contracted during each. Since the Spring, in the stock market, bad economic news has been met with buying, and good news has been met with selling. This GDP report has the power to change that back to more normal investor behavior.

The third quarter production report shows the economy expanded at an annual rate of 2.6%  despite nearly 325 basis points of Fed tightening from a base close to zero earlier this year. This report should be great news for the stock market as it shows that a large part of the economy is growing even while stimulus and easy money is being removed. In addition to the headline news related to overnight bank lending rates, each Thursday after the market closes, the Fed releases information on how large its balance sheet is. This balance sheet holdings report can be viewed as how much money they have at work in the system, effectively acting as stimulus. They have been pulling money out at a pace that many expected would also doom growth. It has not, this too should be taken as a positive sign for stock market investors.

This positive GDP report also helps veterans of the market that did not like playing word games by referring to two-quarters of economic recession (lower case “r”) as something other than a Recession (upper case “R”). This definition had in the past always been automatic, without needing the National Bureau of Economic Research (NBER) to decide when to put a light-shaded bar on our economic timeline charts. We expected that they had the same definition.

GDP Plus Recessions in Gray

Image: Gross Domestic Product Product since 1947-Apris 2022. Gray bars indicate declared recessions.

In 2022 market watchers were all expected to say, “I don’t know what a recession is, I’m not an NBER economist.” This is because, for some reason,, the National Bureau of Economic Research decided not to use the standard metric and definition, it decided instead to be less scientific. The bureau, for the first time declared there is “no fixed rule about what measures contribute information to the process or how they are weighted in our decisions.” In other words, every set of economic conditions is different, and there is no specific threshold that must be met before a recession is declared. We no longer have to even talk about a recession until maybe next year.

Will they declare this quarter an Expansion (upper case “E”)? We’ll see.

Why this GDP Report is Important

Economic growth of nations is measured as the cost of all goods and services sold and provided from domestic-based resources. After all, wealth comes from output, not increases in currency in circulation. GDP measures this output. As you might imagine, an entire economy’s worth of output is a lot of number crunching by the Bureau of Economic Analysis (BEA). So they do two preliminary numbers before the final. This allows them a couple of months to harvest all the needed data. The final GDP report for this quarter is unlikely to show 2.6% growth as it will have been revised twice, but it is likely to approximate this first look.  

Source: Investopedia

Take Away

Good news (economic strength) has been viewed harshly by the market this year as it has been looked at with an eye toward the Fed needing to be more aggressive. Bad news has been embraced and actually caused market rallies.

The most recent GDP report has the power to change this. Despite the historically aggressive Federal Reserve tightening, the economy has grown. Perhaps fears of a deeper recession will pass, and stocks will regain their historic trend of always reaching new highs.

Paul Hoffman

Managing Editor, Channelchek

Sources

https://www.forbes.com/sites/qai/2022/09/22/when-will-this-officially-be-called-a-recession/?sh=357b1a558a0b

https://fred.stlouisfed.org/series/GDP

https://www.investopedia.com/terms/g/gdp.asp#:~:text=GDP%20can%20be%20determined%20via,approach%2C%20and%20the%20income%20approach.

The Truth About the Fed Pivot Rumors

Image Credit: Camilo Rueda López (Flickr)

A Lack of Fed Pivot Doesn’t Have to Equate to Lower Stock Prices

The Fed is not likely to have suddenly indicated a pivot.

Despite the stock market rally and fresh news stories suggesting the Fed is indicating a more dovish stance, the notion has one problem. There are limits placed on Federal Open Market Committee (FOMC) participants and whether they can grant interviews or give speeches before policy-setting meetings. They can not interact on the subject of policy. The current blackout period began October 22nd and will carry through the November 2nd final meeting day. So, investors may wish to consider other reasons if the stock market is rallying. Earnings, oversold conditions, year-end rally, perhaps news stories created by bloggers or journalists that don’t possess experience or understanding.

Image: Number of times “Fed Pivot” was searched using Google 

Current State of Tightening

This year the Fed has been tightening aggressively after having brought interest rates down aggressively a couple of years back. For many investors, a tightening cycle, ending with interest rates a safe margin above the inflation rate, is not something they can recall. This is because the Fed has been stabilizing employment during tricky times in a way that has lifted the markets out of whatever trouble there may have been. Rates have been well below the average 6% to 8% range. This has been going on since at least 2008 –  by some measures, way before.

There have been five times since late Spring that investors and TV’s talking heads were convinced the Fed has gone too far and will now begin bringing rates back. So far, all the hoping has done nothing to help; the track record stands at zero for five. While it remains to be seen and heard what to expect from monetary policy starting mid-next week, the current inflation rate and words that the Fed board members have said indicate another 75 bp hike in funds.

Looking Forward

Can this change? We get a look at third-quarter GDP on Thursday. This measures U.S. domestic production. A bad number could cause the Fed to rethink aggressive tightening. However, the expectations are that it will be higher than it has been all year (2.3% growth rate) which gives the Fed even greater ability to hit the brakes. Also, the PCE Price Index, viewed as the Fed’s preferred inflation indicator, is released Friday (6.3% YoY expected).

The Federal Reserve’s, monetary policy does not cater to the stock market. It does consider it because, of the wealth effect. The wealth effect is where consumers feel poorer because of declines in asset values, and while their disposable income may not have changed, they hunker down and spend less. This secondary impact to spending is the only attention the Fed officially pays to stocks.

Interest Rates

Real interest rates are still negative. Imagine buying a bond knowing that despite being exposed to maturity and credit risk, while tying up money, your spending power will almost certainly be less when it matures. This isn’t why people invest; in fact, if that scenario remains and inflation persists, the best use of savings may be to consider any large purchases you think you may incur in the coming few years and make them now. At the moment, inflation hasn’t shown signs of abating, something has to give; bond investors are going to require higher yields, Japan has already experienced a bond-buyer “strike.”

Where Do We Go from Here

For now, the consensus view is that inflation should drift back down to 3% or even lower by 2025. If energy continues to decline, supply-chain issues are resolved, and a strong U.S. dollar persists, the consensus may be correct. But one should be aware there are very bright economists that deviate from the consensus by plus or minus 300 bp or more.  

The markets may have already priced in bad news; rates heading back to normalcy (upward) doesn’t immediately mean a bad stock market. We can easily rally through the end of the year and still experience a sixth time the Fed has refrained from pivoting but instead has made sure its words were cleansed of anything that can be construed as reversing course.

Paul Hoffman

Managing Editor, Channelchek

We’re in an Energy Crisis According to the IEA

Image Credit: Steve Jurvetson (Flickr)

How Deep and How Long Will the Global Energy Crisis Last?

Are we in a global energy crisis? The Executive Director of the International Energy Agency (IEA), Dr. Fatih Birol, is sure of it. He referred to the global situation as a crisis on Tuesday (Oct. 25), speaking first at a conference, and later in an interview on CNBC. He explained that tighter markets for liquefied natural gas (LNG) worldwide and major oil producers cutting supply, have put the world in the middle of “the first truly global energy crisis.”

Our world has never witnessed an energy crisis with this depth and complexity,” according to the IEA head. He explained that until February 24, 2022, Russia was the number one fossil fuel exporter in the world. What has occurred since has been a major turn in oil and natural gas markets. Birol expects the volatility in oil and gas markets will continue throughout the world. When asked on CNBC Internaational if he thought it would be a prolonged war, he made clear that this is not his area of expertise; however, he believes there won’t be a “smooth transition into the next chapter for both oil and natural gas of the energy event.”

U.S. vs OPEC+

As it relates to the U.S. and OPEC being at odds, with OPEC managing toward supply-demand issues, and the U.S. being challenged by inflation, Birol says the two billion barrels cut by the oil-exporting nations is unprecedented. He believes it goes against their ambition to maximize profits as it works against economic growth in a world that is flirting with recession. He also pointed out it isn’t the U.S. that will experience hardship, rather, the emerging and developing countries will be hit hardest.

Image: Fatih Birol, IAEA Imagebank (November 2021)

On the same day, speaking at the Singapore International Energy Week, he shared that higher oil prices would push inflation higher and growth and production to shrink.

IEA projections show global oil consumption growing by 1.7 million barrels a day in 2023. Russian crude will be needed to bridge the gap between demand and supply, Birol said.

Russian Connection

The reduced Russian supply is a result of U.S. and the European Union’s decisions to place partial bans on Russian oil imports after Russia’s invasion of its neighboring country. The current proposed plan as the region heads into the heating season is to institute price caps on Russian resources. That would limit Moscow’s potential profits from oil exports while still allowing modest deliveries. Estimates are that these measures would leave space for between 80% and 90% of Russian oil to flow outside of the price cap. Birol expects this would help to make up for expected shortfalls. “I think this is good, because the world still needs Russian oil to flow into the market for now,” he said.

Oil Reserves

IEA members have built a stockpile of oil reserves that can be released if there’s a need to boost supply or temper prices, according to Birol. “We still have a huge amount of stocks to be released in case we see supply disruptions,” he said. “Currently, it is not on the agenda, but it can come anytime.”

The IEA head says that Europe will get through the winter if the weather remains mild, though somewhat battered. Birol said. “Unless we will have an extremely cold and long winter, unless there will be any surprises in terms of what we have seen, for example, Nord Stream pipeline explosion, Europe should go through this winter with some economic and social bruises.”

Take Away

The Executive Director of the IEA was in Singapore, speaking at a conference and giving media interviews. He did not sugarcoat his expectations. He expects oil and natural gas prices to remain volatile, and believes the emerging markets will be hurt most by OPECs cutting output. As for the upcoming winter, Birol says we are experiencing the worst global energy crisis in history, and it won’t resolve itself soon.

Paul Hoffman

Managing Editor, Channelchek

Sources

https://bdnews24.com/business/7y637b19aj

https://www.iea.org/contributors/dr-fatih-birol

https://www.usnews.com/news/top-news/articles/2022-10-24/world-is-in-its-first-truly-global-energy-crisis-ieas-birol

https://www.youtube.com/watch?v=RZEYUXbcYzI

Your Genome is Partially Built by Ancient Viruses

Image: Plum Island (USDA – Public Domain)

Humans are 8% Virus – How the Ancient Viral DNA in Your Genome Plays a Role in Human Disease and Development

HERVs, or human endogenous retroviruses, make up around 8% of the human genome, left behind as a result of infections that humanity’s primate ancestors suffered millions of years ago. They became part of the human genome due to how they replicate.

Like modern HIV, these ancient retroviruses had to insert their genetic material into their host’s genome to replicate. Usually this kind of viral genetic material isn’t passed down from generation to generation. But some ancient retroviruses gained the ability to infect germ cells, such as egg or sperm, that do pass their DNA down to future generations. By targeting germ cells, these retroviruses became incorporated into human ancestral genomes over the course of millions of years and may have implications for how researchers screen and test for diseases today.

Active Viral Genes in the Human Genome

Viruses insert their genomes into their hosts in the form of a provirus. There are around 30 different kinds of human endogenous retroviruses in people today, amounting to over 60,000 proviruses in the human genome. They demonstrate the long history of the many pandemics humanity has been subjected to over the course of evolution. Scientists think these viruses once widely infected the population, since they have become fixed in not only the human genome but also in chimpanzee, gorilla and other primate genomes.

This article was republished with permission from The Conversation, a news site dedicated to sharing ideas from academic experts. It represents the research-based findings and thoughts of Seth Blumsack, Professor of Energy and Environmental Economics and International Affairs, Penn State and Aidan Burn, PhD Candidate in Genetics, Tufts University.

Research from our lab and others has demonstrated that HERV genes are active in diseased tissue, such as tumors, as well as during human embryonic development. But how active HERV genes are in healthy tissue was still largely unknown.

To answer this question, our lab decided to focus on one group of HERVs known as HML-2. This group is the most recently active of the HERVs, having gone extinct less than 5 million years ago. Even now, some of its proviruses within the human genome still retain the ability to make viral proteins.

We examined the genetic material in a database containing over 14,000 donated tissue samples from all across the body. We looked for sequences that matched each HML-2 provirus in the genome and found 37 different HML-2 proviruses that were still active. All 54 tissue samples we analyzed had some evidence of activity of one or more of these proviruses. Furthermore, each tissue sample also contained genetic material from at least one provirus that could still produce viral proteins.

The Role of HERVs in Human Health and Disease

The fact that thousands of pieces of ancient viruses still exist in the human genome and can even create protein has drawn a considerable amount of attention from researchers, particularly since related viruses still active today can cause breast cancer and AIDS-like disease in animals.

Whether the genetic remnants of human endogenous retroviruses can cause disease in people is still under study. Researchers have spotted virus-like particles from HML-2 in cancer cells, and the presence of HERV genetic material in diseased tissue has been associated with conditions such as Lou Gehrig’s disease, or amyotrophic lateral sclerosis, as well as multiple sclerosis and even schizophrenia.

Our study adds a new angle to this data by showing that HERV genes are present even in healthy tissue. This means that the presence of HERV RNA may not be enough to connect the virus to a disease.

Importantly, it also means that HERV genes or proteins may no longer be good targets for drugs. HERVs have been explored as a target for a number of potential drugs, including antiretroviral medication, antibodies for breast cancer and T-cell therapies for melanoma. Treatments using HERV genes as a cancer biomarker will also need to take into account their activity in healthy tissue.

On the other hand, our research also suggests that HERVs could even be beneficial to people. The most famous HERV embedded in human and animal genomes, syncytin, is a gene derived from an ancient retrovirus that plays an important role in the formation of the placenta. Pregnancy in all mammals is dependent on the virus-derived protein coded in this gene.

Similarly, mice, cats and sheep also found a way to use endogenous retroviruses to protect themselves against the original ancient virus that created them. While these embedded viral genes are unable to use their host’s machinery to create a full virus, enough of their damaged pieces circulate in the body to interfere with the replication cycle of their ancestral virus if the host encounters it. Scientists theorize that one HERV may have played this protective role in people millions of years ago. Our study highlights a few more HERVs that could have been claimed or co-opted by the human body much more recently for this same purpose.

Unknowns Remain

Our research reveals a level of HERV activity in the human body that was previously unknown, raising as many questions as it answered.

There is still much to learn about the ancient viruses that linger in the human genome, including whether their presence is beneficial and what mechanism drives their activity. Seeing if any of these genes are actually made into proteins will also be important.

Answering these questions could reveal previously unknown functions for these ancient viral genes and better help researchers understand how the human body reacts to evolution alongside these vestiges of ancient pandemics.

The Week Ahead – Fed Muzzled on Rate Talk, Third Quarter Growth, Earnings

If the U.S. Was in a Recession, This Week’s Numbers May Show It Has grown Out of It

A big focus of traders this week will be positioning for the FOMC meeting next week and its announcement on Wednesday, November 2nd. Members of the committee that have commented in recent weeks have left little doubt that the Federal Reserve’s fight against inflation is continuing, and a 75 bp hike can be expected. Additional comments on monetary policy from Fed governors aren’t expected this week as there is a communications blackout period in effect (midnight Saturday, October 22nd through midnight Thursday, October 27th).

There will be global interest rate commotion as more rate hikes outside the U.S. are likely. The first is on Wednesday by the Bank of Canada, followed on Thursday by the European Central Bank. The forecast consensus for each is 75bp upward.

The conversation on Thursday may move from “is the U.S. going into a recession to, has the U.S. just come out of a recession?” While the first two-quarters of receding growth have never officially been declared a recession, the first look at GDP for the third quarter is out on Thursday, and it is expected to show growth during the quarter. If this occurs markets, the stock market could trade, either way, a sigh of relief that the economy is growing or fear that the Fed now has the room it needs to keep applying the interest rate brakes.

What’s on Tap for investors:

Monday 10/24

•             At 9:45 AM Purchasing Managers Index (PMI) flash report will be released. Expectations are for the number to come in around 51.2. This leading indicator of economic activity is an early estimate of private sector output. It contains information from surveys of around 1,000 manufacturing and service sector companies. The flash data are released ten days ahead of the final report and are based on 85 percent of the full survey.

Tuesday 10/25

•             At 10:00 AM, the Consumer Confidence survey will be released. Expectations are for a decline of 2.0 points to 106.0 in October, this would be after it exceeded expectations in September and August.

•             At  10 AM, the  Richmond Fed Manufacturing Index will be reported. The consensus is -3. Last month the report came in at 0.0, which was above the consensus estimates. The headline index number is a composite of the new orders, shipments, and employment indexes in the Richmond Fed’s manufacturing sector. It provides insight into the state of the manufacturing sector.

•             At 1 PM, U.S. Money Supply is released for September. During August M2 rose by $1.8 billion.

•             Noble Capital Markets will host a roadshow in St. Louis with Harte Hanks (HHS). Qualified Investors of all levels, including registered representatives, are welcome to attend at no cost, and with no obligation to invest. More information here.

Wednesday 10/26

•             At 8:30 AM, International Trade in Goods (advance) will be reported. The consensus is for a U.S. trade deficit of 87.8 billion. This would represent a widening of more dollars spent purchasing goods from abroad than goods purchased from the U.S. The numbers may offer insight into the impact that the strong dollar has had on reducing demand for U.S.-made products.

•             At 8:30 AM, Wholesale Inventories (Advance) for September are expected to have shown an increase of 1.1%. If inventories are growing fast relative to GDP, then both production and employment may have to slow down the road. And if inventories are lagging behind growth, there may be an undersupply to be made up for later.

•             At 10:00 PM, New Home Sales are expected to show a rate of 585 thousand during September. This number surprised to the upside the previous period. The report is important to those trading securities as it indicates economic momentum, future demand for goods, and confidence in the ability to afford a big expense. New home sales multiply through other areas of the economy as new homeowners set their homes with furniture, appliances, and services.

Thursday 10/27

•             At 8:30 AM, investors will get their first look at GDP for the third quarter. The number is supposed to show the first sign of growth in 2022. Consensus expectations are for growth of 2.3% during the third quarter. Stock market investors may wrestle with whether the good news is bad news or bad news is good news as the market finds a direction after this report and ahead of a rate decision the following week.

•             At 8:30 AM, Durable Goods Orders are released. The consensus is for a .6% increase in the headline number and .2% ex-transportation. Durable goods are new orders placed with U.S. manufacturers for factory hard goods. The report also contains information on shipments, unfilled orders, and inventories. Investors get insight into how busy factories will be in the coming months. This is a leading indicator with direct implications for economic growth

•             At 8:30 AM Jobless Claims are reported for the week ending 10/22/22. The expectations are for there to be 223,000 new claims. Surprises on one side or the other are important as healthy employment is one the Federal Reserve mandates.

•             At 10:30 AM, The U.S. Energy Information Administration (EIA) releases its weekly report on natural gas. Energy supply and demand balance impact prices of fuel that can ripple through the entire economy.

Friday 10/28

•             At 8:30 AM, Personal Income and Outlays are reported. This report includes the PCE Price index that is considered to be the Feds preferred inflation indicator. The consensus for Personal Income is +.3%. The consensus for the PCE gauge is +.3% which would equate to a year-over-year inflation rate of +6.3%.

•             At 10:00 AM, Consumer Sentiment is expected to come in at 59.7; the previous month the number reported was 59.8. Consumer spending accounts for 66% of the economy. Consumer appetite is a big influencer on investments. For stocks, strong economic growth translates to healthy corporate profits and higher stock prices. For bonds, the focus is whether economic growth goes overboard and leads to inflation.

What Else

It’s earnings season, and big market moves can occur should closely watch names miss their expected earnings numbers. On Tuesday this could include GE, Microsoft, and GM. Wednesday Ford reports, Thursday MacDonalds, Merck, Mastercard, and U.S. Steel. On Friday Exxon and Alliance Bernstein will make public their third quarter earnings.

Paul Hoffman

Managing Editor, Channelchek

Sources

https://us.econoday.com/byweek.asp?cust=us&lid=0

www.EIA.gov

New Home Size as a Leading Indicator for Recession

Image Credit: Tannert11 (Flickr)

Housing Is Getting Less Affordable. Governments Are Making It Worse

The average square footage in new single-family houses has been declining since 2015. House sizes tend to fall just during recessionary periods. It happened from 2008 to 2009, from 2001 to 2002, and from 1990 to 1991.

But even with strong economic-growth numbers well into 2019, it looks like demand for houses of historically large size may have finally peaked even before the 2020 recession and our current economic malaise.  (Square footage in new multifamily construction has also increased.)

According to Census Bureau data, the average size of new houses in 2021 was 2,480 square feet. That’s down 7 percent from the 2015 peak of 2,687.

2015’s average, by the way, was an all-time high and represented decades of near-relentless growth in house sizes in the United States since the Second World War. Indeed, in the 48 years from 1973 to 2015, the average size of new houses increased by 62 percent from 1,660 to 2,687 square feet. At the same time, the quality of housing also increased substantially in everything from insulation, to roofing materials, to windows, and to the size and availability of garages.

Meanwhile, the size of American households during this period decreased 16 percent from 3.01 to 2.51 people.

Yet, even with that 7 percent decline in house size since 2015, the average new home in America as of 2021 was still well over 50 percent larger than they were in the 1960s. Home size isn’t exactly falling off a cliff. US homes, on a square-foot-per-person basis, remain quite large by historical standards. Since 1973, square footage per person in new houses has nearly doubled, rising from 503 square feet per person in 1973 to 988 square feet person in 2021. By this measure, new house size actually increased from 2020 to 2021.

This continued drive upward in new home size can be attributed in part to the persistence of easy money over the past decade. Even as homes continued to stay big—and thus stay comparatively expensive—it was not difficult to find buyers for them. Continually falling mortgage rates to historical lows below even 3 percent in many cases meant buyers could simply borrow more money to buy big houses.

But we may have finally hit the wall on home size. In recent months we’re finally starting to see evidence of falling home sales and falling home prices. It’s only now, with mortgage rates surging, inflation soaring, and real wages falling—and thus home price affordability falling—that there are now good reasons for builders to think “wow, maybe we need to build some smaller, less costly homes.”  There are many reasons to think that they won’t, and that for-purchase homes will simply become less affordable. But it’s not the fault of the builders.

This wouldn’t be a problem in a mostly-free market in which builders could easily adjust their products to meet the market where it’s at. In a flexible and generally free market, builders would flock to build homes at a price level at which a large segment of the population could afford to buy those houses.  But that’s not the sort of economy we live in. Rather, real estate and housing development are highly regulated industries at both the federal level and at the local level. Thanks to this, it is becoming more and more difficult for builders to build smaller houses at a time when millions of potential first-time home buyers would gladly snatch them up.

How Government Policy Led to a Codification of Larger, More Expensive Houses

In recent decades, local governments have continued to ratchet up mandates as to how many units can be built per acre, and what size those new houses can be. As The Washington Post reported in 2019, various government regulations and fees, such as “impact fees,” which are the same regardless of the size of the unit, “incentivize developers to build big.” The Post continues, “if zoning allows no more than two units per acre, the incentive will be to build the biggest, most expensive units possible.”

Moreover, community groups opposed to anything that sounds like “density” or “upzoning” will use the power of local governments to crush developer attempts to build more affordable housing. However, as The Post notes, at least one developer has found “where his firm has been able to encourage cities to allow smaller buildings the demand has been strong. For those building small, demand doesn’t seem to be an issue.”

Similarly, in an article last month at The New York Times, Emily Badger notes the central role of government regulations in keeping houses big and ultimately increasingly unaffordable. She writes how in recent decades,

“Land grew more expensive. But communities didn’t respond by allowing housing on smaller pieces of it. They broadly did the opposite, ratcheting up rules that ensured builders couldn’t construct smaller, more affordable homes. They required pricier materials and minimum home sizes. They wanted architectural flourishes, not flat facades. …”

It is true that in many places empty land has increased in price, but in areas where the regulatory burden is relatively low—such as Houston—builders have nonetheless responded with more building of housing such as townhouses.

In many places, however, regulations continue to push up the prices of homes.

Badger notes that in Portland, Oregon, for example, “Permits add $40,000-$50,000. Removing a fir tree 36 inches in diameter costs another $16,000 in fees.” A lack of small “starter homes” is not due to an unwillingness on the part of builders. Governments have simply made smaller home unprofitable.

“You’ve basically regulated me out of anything remotely on the affordable side,” said Justin Wood, the owner of Fish Construction NW.

In Savannah, Ga., Jerry Konter began building three-bed, two-bath, 1,350-square-foot homes in 1977 for $36,500. But he moved upmarket as costs and design mandates pushed him there.

“It’s not that I don’t want to build entry-level homes,” said Mr. Konter, the chairman of the National Association of Home Builders. “It’s that I can’t produce one that I can make a profit on and sell to that potential purchaser.”

Those familiar with how local governments zone land and set building standards will not be surprised by this. Local governments, pressured by local homeowners, will intervene to keep lot sizes large, and to pass ordinances that keep out housing that might be seen by voters as “too dense” or “too cheap-looking.”

Yet, as much as existing homeowners and city planners would love to see nothing but upper middle-class housing with three-car garages along every street, the fact is that not everyone can afford this sort of housing. But that doesn’t mean people in the middle can only afford a shack in a shanty town either — so long as governments will allow more basic housing to be built.

But there are few signs of many local governments relenting on their exclusionary housing policies, and the result has been an ossified housing policy designed to reinforce existing housing, while denying new types of housing that is perhaps more suitable to smaller households and a more stagnant economic environment.

Eventually, though, something has to give. Either governments persist indefinitely with restrictions on “undesirable” housing — which means housing costs skyrocket — or local governments finally start to allow builders to build housing more appropriate to the needs of the middle class.

If current trends continue, we may finally see real pressure to get local governments to allow more building of more affordable single-family homes, or duplexes, or townhouses. If interest rates continue to march upward, this need will become only more urgent. Moreover, as homebuilding materials continue to become more expensive thanks to 40-year highs in inflation—thanks to the Federal Reserve—there will be even more need to find ways to cut regulatory costs in other areas.

For now, the results have been spotty. But where developers are allowed to actually build for a middle-class clientele, it looks like there’s plenty of demand.

About the Author

Ryan McMaken (@ryanmcmaken) is a senior editor at the Mises Institute. Ryan has a bachelor’s degree in economics and a master’s degree in public policy and international relations from the University of Colorado. He is the author of Breaking Away: The Case for Secession, Radical Decentralization, and Smaller Polities (forthcoming) and Commie Cowboys: The Bourgeoisie and the Nation-State in the Western Genre. He was a housing economist for the State of Colorado. 

Can We Expect a Stock Market Rally After the FOMC Meeting on November 2nd?

Image Credit: AlphaTradeZone (Pexels)

Will the November Fed rate announcement cause a stock market rally?

The next time the Federal Reserve is expected to adjust the target range of the Fed Funds overnight lending rate is Wednesday, November 2nd. Few have doubt at this point that this will again be a 0.75% increase. That level is already baked into equities. Stock market strength and direction shouldn’t veer much from the rate move but could dramatically turn as a result of the Fed’s forward guidance. If Chairman Powell & Co. suggests a slower benchmark lending rate increase, it would be a very welcome sign for investors.

Focus on the Post Meeting Announcement

There are already signs the Fed may slow the pace of Fed Funds increases. There are also indications it may alter its quantitative tightening (QT) in a way that could quicken a yield curve steepening. In other words, the speed of QT may increase. To date, the real rate of return on bonds, of most all maturities, is viewed as unnatural as they are below zero (Yield – Inflation = Real Rate). While an increase in QT may do more to raise rates and reduce the money supply, the effect is stealthier; it doesn’t provide a panicky headline for investors to react to abruptly. 

Some Fed governors have already shown signs that they believe the best course from here is to slow the ratcheting up of the funds level and perhaps even stop raising Fed Funds rates early next year. A hiatus would allow them time to see if the moves have had an impact and give members a chance to see if further moves are prudent. The Fed always runs the risk of overreacting and going too far when tightening; this “oversteering” by previous Feds has occurred a high percentage of the time as they contend with a lag between monetary policy shifts and economic reaction.  

Where We Are, Where We’re Going

In the most aggressive pace since early 1980, so far in 2022, the Fed raised its benchmark federal-funds rate by 0.75 points at each of its past three meetings. The most recent move was in late September. This left the overnight interest rate at a range between 3% and 3.25%.

The stock market wants the Fed to slow down. It rallied in July and August on expectations that the Fed might slow the pace of increase. Slowing, at least at the time, would have conflicted with the central bank’s inflation target because easy financial conditions stimulate spending, economic growth, and related inflation pressures. This rally in stocks may have prompted Powell to redraft a very public speech to economists in late August. He spoke about nothing else for eight minutes at Jackson Hole except for his resolve to win the fight against higher prices.

But sentiment related to how forceful the FOMC now needs to be may be shifting. Fed Vice Chairwoman Lael Brainard, joined by other officials, have recently hinted they are uneasy with raising rates by 0.75 points beyond next month’s meeting. In a speech on Oct. 10th, Brainard laid out a case for pausing rate rises, noting how they impact the economy over time.

Others that are concerned about the danger of raising rates too high include Chicago Fed President Charles Evans. Evans told reporters on Oct. 10th that he was worried about assumptions that the Fed could just cut rates if it decided they were too high. He felt a need to share his thought that promptly lowering rates is always easier in theory than in practice. The Chicago Fed President said he would prefer to find a rate level that restricted economic growth enough to lower inflation and hold it there even if the Fed faced “a few not-so-great reports” on inflation. “I worry that if the way you judge it is, ‘Oh, another bad inflation report—it must be that we need more [rate hikes],’… that puts us at somewhat greater risk of responding overly aggressive,” Evans said.

Kansas City Fed President Esther George also had something to say on this topic last week. She said she favored moving “steadier and slower” on rate increases. “A series of very super-sized rate increases might cause you to oversteer and not be able to see those turning points,” according to the Kansas City Fed President.

Others like Fed governor Waller don’t view steady 0.75% increases as a done deal but instead something to be reviewed, “We will have a very thoughtful discussion about the pace of tightening at our next meeting,” Waller said in a speech earlier this month.

The caution surrounding oversteering isn’t unanimous; at least one Fed official wants to see proof that inflation is falling before easing up on the economic brake pedal. “Given our frankly disappointing lack of progress on curtailing inflation, I expect we will be well above 4% by the end of the year,” said Philadelphia Fed President Patrick Harker.

The ultimate result is likely to come down to what Mr. Powell decides as he seeks to fashion a consensus. In the past, votes, while not always unanimous, tend to defer to the Chairperson at the time.

Take-Away

If, after the next FOMC meeting, the Fed is entertaining a lower 0.50% rate rise in December (not 0.75%), they will prepare the markets (bond, stock, and foreign exchange) for the decision in the moments and weeks following their Nov. 1-2 meeting. If this occurs, it could cause stocks to perform well just before election day and perhaps make up some lost ground in the year’s final two months.  

Paul Hoffman

Managing Editor, Channelchek

Sources

https://www.federalreserve.gov/newsevents/speech/waller20221006a.htm

https://www.wsj.com/articles/fed-set-to-raise-rates-by-0-75-point-and-debate-size-of-future-hikes-11666356757?mod=hp_lead_pos1

https://www.federalreserve.gov/aboutthefed/federal-reserve-system-philadelphia.htm

Leadership and Embracing Existing Technology May Get Us to Net-Zero Quicker

Image Credit: Mussi Katz (Flickr)

Getting to ‘Net-Zero’ Emissions: How Energy Leaders Envision Countering Climate Change in the Future

What’s behind this view, energy leaders say, is their deep degree of skepticism that renewable energy technologies alone can meet the nation’s future energy demands at a reasonable cost.

With the federal government promising over US$360 billion in clean energy incentives under the Inflation Reduction Act, energy companies are already lining up investments. It’s a huge opportunity, and analysts project that it could help slash U.S. greenhouse gas emissions by about 40% within the decade.

But in conversations with energy industry leaders in recent months, we have heard that financial incentives alone aren’t enough to meet the nation’s goal of reaching net-zero emissions by 2050.

In the view of some energy sector leaders, reaching net zero emissions will require more pressure from regulators and investors and accepting technologies that aren’t usually thought of as the best solutions to the climate crisis.

This article was republished with permission from The Conversation, a news site dedicated to sharing ideas from academic experts. It represents the research-based findings and thoughts of Seth Blumsack, Professor of Energy and Environmental Economics and International Affairs, Penn State and Lara B. Fowler Interim Chief Sustainability Officer, Penn State; Interim Director, Penn State Sustainability Institute; Profess of Teaching, Penn State Law, Penn State.

‘Net-Zero,’ With Natural Gas

In spring 2022, we facilitated a series of conversations at Penn State University around energy and climate with leaders at several major energy companies – including Shell USA, and electric utilities American Electric Power and Xcel Energy – as well as with leaders at the Department of Energy and other public-sector agencies.

We asked them about the technologies they see the U.S. leaning on to develop an energy system with zero net greenhouse gases by 2050.

Their answers provide some insight into how energy companies are thinking about a net-zero future that will require extraordinary changes in how the world produces and manages energy.

We heard a lot of agreement among energy leaders that getting to net-zero emissions is not a matter of finding some future magic bullet. They point out that many effective technologies are available to reduce emissions and to capture those emissions that can’t be avoided. What is not an option, in their view, is to leave existing technologies in the rearview mirror.

They expect natural gas in particular to play a large, and possibly growing, role in the U.S. energy sector for many years to come.

What’s behind this view, energy leaders say, is their deep degree of skepticism that renewable energy technologies alone can meet the nation’s future energy demands at a reasonable cost.

Costs for wind and solar power and for energy storage have declined rapidly in recent years. But dependence on these technologies has some grid operators worried that they can’t count on the wind blowing or sun shining at the right time – especially as more electric vehicles and other new users connect to the power grid.

Energy companies are rightly nervous about energy grid failures – no one wants a repeat of the outages in Texas in the winter of 2021. But some energy companies, even those with lofty climate goals, also profit handsomely from traditional energy technologies and have extensive investments in fossil fuels. Some have resisted clean energy mandates.

In the view of many of these energy companies, a net-zero energy transition is not necessarily a renewable energy transition.

Instead, they see a net-zero energy transition requiring massive deployment of other technologies, including advanced nuclear power and carbon capture and sequestration technologies that capture carbon dioxide, either before it’s released or from the air, and then store it in nature or pump it underground. So far, however, attempts to deploy some of these technologies at scale have been plagued with high costs, public opposition and serious questions about their environmental impacts.

Think Globally, Act Regionally

Another key takeaway from our roundtable discussions with energy leaders is that how clean energy is deployed and what net-zero looks like will vary by region.

What sells in Appalachia, with its natural-resource-driven economy and manufacturing base, may not sell or even be effective in other regions. Heavy industries like steel require tremendous heat as well as chemical reactions that electricity just can’t replace. The economic displacement from abandoning coal and natural gas production in these regions raises questions about who bears the burden and who benefits from shifting sources of energy.

Opportunities also vary by region. Waste from Appalachian mines could boost domestic supplies of materials critical to a cleaner energy grid. Some coastal regions, on the other hand, could drive decarbonization efforts with offshore wind power.

At a regional scale, industry leaders said, it can be easier to identify shared goals. The Midcontinent Independent System Operator, known as MISO, which manages the power grid in the upper Midwest and parts of the South, is a good example.

Among the major power grid operators, MISO has a broad, varied territory, which also extends into Canada, which can make management decisions more difficult. FERC

When its coverage area was predominantly in the upper Midwest, MISO could bring regional parties together with a shared vision of more opportunities for wind energy development and higher electric reliability. It was able to produce an effective multistate power grid plan to integrate renewables.

However, as utilities from more far-flung (and less windy) states joined MISO, they challenged these initiatives as not bringing benefits to their local grids. The challenges were not successful but have raised questions about how widely costs and benefits can be shared.

Waiting for the Right Kind of Pressure

Energy leaders also said that companies are not enthusiastic about taking on risks that low-carbon energy projects will increase costs or degrade grid reliability without some kind of financial or regulatory pressure.

For example, tax credits for electric vehicles are great, but powering these vehicles could require a lot more zero-carbon electricity, not to mention a major national transmission grid upgrade to move that clean electricity around.

That could be fixed with “smart charging” – technologies that can charge vehicles during times of surplus electricity or even use electric cars to supply some of the grid’s needs on hot days. However, state utility regulators often dissuade companies from investing in power grid upgrades to meet these needs out of fear that customers will wind up footing large bills or technologies will not work as promised.

Energy companies do not yet seem to be feeling major pressure from investors to move away from fossil fuels, either.

For all the talk about environmental, social and governance concerns that industry leaders need to prioritize – known as ESG – we heard during the roundtable that investors are not moving much money out of energy companies whose responses to ESG concerns are not satisfactory. With little pressure from investors, energy companies themselves have few good reasons to take risks on clean energy or to push for changes in regulations.

Leadership Needed

These conversations reinforced the need for more leadership on climate issues from lawmakers, regulators, energy companies and shareholders.

If the energy industry is stuck because of antiquated regulations, then we believe it’s up to the public and forward-looking leaders in business and government and investors to push for change.

Circle K Convenience Stores Making Space for Marijuana Dispensaries

Image Credit: Jeremy Brooks (Flickr)

Floridians Can Soon Stop at Convenience Stores for Milk, Bread, and Cannabis

Do you use Circle K as a convenience store or a gas station? How about marijuana dispensary?

There is something new afoot at the Circle Ks in Florida, and it may forever change the medical marijuana dispensary, business model. Today, Green Thumb (GTBIF), a national cannabis consumer goods company, announced plans to expand its medical, retail footprint in Florida. It’s doing this through a lease agreement with Circle K convenience stores, where it expects to launch and test its RISE Express dispensary brand at ten Florida locations.

Green Thumb Founder and CEO Ben Kovler is very positive about the potential, “The opening of RISE Express stores at Circle K locations is a game-changer. Convenience is a strong channel in retail, and people want more access to cannabis,” said Kovler. “The new RISE Express model is a huge step forward in making it easier and more efficient for patients to purchase high-quality cannabis as part of their everyday routine when stopping by their local convenience store.”

The products available at these retail stores will come from the company’s new 28-acre cultivation facility in Ocala, FL. Green Thumb entered the Florida market in 2018 and currently owns and operates medical cannabis retail stores in many parts of the state.

Potential for Growth

Florida state marijuana laws allow for use with a medical marijuana card but prohibit recreational use. According to the Florida Department of Health, over 700,000 Floridians are currently registered active cardholders in the state’s medical marijuana program.

The deal is a first of its kind, given that legal marijuana has only been legally available in stand-alone dispensaries in the US and within pharmacies in countries such as Uruguay and Germany. This could help mainstream the substance as people stop as part of their normal routines to buy staples and daily necessities. No additional stop will be needed if you’re getting milk, bread, gas or other drugs like Tylenol.

Some Circle K locations have already ventured into cannabis-derived products that have recently become mainstream. This includes CBD oils and products and Delta-8 items, which can give consumers a mind-altering high, but currently fall through a legal loophole because it is derived from hemp.

Take Away

It was not long ago cannabinoids such as CBD could only be found at vape shops and other mom-and-pop locations. Today, we expect them to be carried in convenience stores and even at our local chain grocery.

Will medical marijuana also become widely available, so consumers don’t have to make a separate stop in their daily routines? Green Thumb and Circle K will be breaking new ground on this front beginning next year.

Paul Hoffman

Managing Editor, Channelchek

Sources:

https://investors.gtigrows.com/investors/news-and-events/press-releases/press-release-details/2022/Green-Thumb-to-Launch-RISE-Express-Dispensaries-in-Florida/default.aspx

https://www.bloomberg.com/news/articles/2022-10-19/where-is-weed-sold-circle-k-gas-stations-in-florida-in-2023

Household Income That’s Subject to Taxes Declines Next Year

Image Credit: JD Hancock (Flickr)

These Are the New Federal Tax Brackets and Standard Deductions For 2023

Now for the inflation good news. Thankfully, as it relates to federal income taxes, the IRS makes annual adjustments to certain tax provisions. Simply put, the higher the inflation, the more tax credit benefit, which includes tax credits and taxable wages adjusted downward. So, in addition to receiving much higher COLA increases on Social Security payments and earning an interest rate in excess of 9% on U.S. Savings Bonds, those making an income in 2023 are likely to see more take-home pay.

The IRS Numbers Are In

The IRS announced the 2023 inflation adjustments to the standard deduction and other tax provisions for the 2023 tax year. The adjustments affect 60 provisions in the tax code, and leave a few key provisions unchanged.

Highlights of Changes in Revenue Procedure 2021-38

The tax year 2023 adjustments described below generally apply to tax returns filed in 2024.  A higher level of details about these annual adjustments can be found in IRS Revenue Procedure 2022-38PDF.

The standard deduction for married couples filing jointly for tax year 2023 rises to $27,700 up $1,800 from the prior year. For single taxpayers and married individuals filing separately, the standard deduction rises to $13,850 for 2023, up $900, and for heads of households, the standard deduction will be $20,800 for tax year 2023, up $1,400 from the amount for tax year 2022.

 Marginal Rates: For tax year 2023, the top tax rate remains 37% for individual single taxpayers with incomes greater than $578,125 ($693,750 for married couples filing jointly).

The other rates are:

  • 35% for incomes over $231,250 ($462,500 for married couples filing jointly);
  • 32% for incomes over $182,100 ($364,200 for married couples filing jointly);
  • 24% for incomes over $95,375 ($190,750 for married couples filing jointly);
  • 22% for incomes over $44,725 ($89,450 for married couples filing jointly);
  • 12% for incomes over $11,000 ($22,000 for married couples filing jointly).

The lowest rate is 10% for incomes of single individuals with incomes of $11,000 or less ($22,000 for married couples filing jointly).

 The Alternative Minimum Tax exemption amount for tax year 2023 is $81,300 and begins to phase out at $578,150 ($126,500 for married couples filing jointly for whom the exemption begins to phase out at $1,156,300). The 2022 exemption amount was $75,900 and began to phase out at $539,900 ($118,100 for married couples filing jointly for whom the exemption began to phase out at $1,079,800).

 The tax year 2023 maximum Earned Income Tax Credit amount is $7,430 for qualifying taxpayers who have three or more qualifying children, up from $6,935 for tax year 2022. The revenue procedure contains a table providing maximum EITC amount for other categories, income thresholds and phase-outs.

 For 2023, the monthly limitation for the qualified transportation fringe benefit and the monthly limitation for qualified parking increases to $300, up $20 from the limit for 2022.

 For the taxable years beginning in 2023, the dollar limitation for employee salary reductions for contributions to health flexible spending arrangements increases to $3,050. For cafeteria plans that permit the carryover of unused amounts, the maximum carryover amount is $610, an increase of $40 from taxable years beginning in 2022.

 For tax year 2023, participants who have self-only coverage in a Medical Savings Account, the plan must have an annual deductible that is not less than $2,650, up $200 from tax year 2022; but not more than $3,950, an increase of $250 from tax year 2022. For self-only coverage, the maximum out-of-pocket expense amount is $5,300, up $350 from 2022. For tax year 2023, for family coverage, the annual deductible is not less than $5,300, up from $4,950 for 2022; however, the deductible cannot be more than $7,900, up $500 from the limit for tax year 2022. For family coverage, the out-of-pocket expense limit is $9,650 for tax year 2023, an increase of $600 from tax year 2022.

 For tax year 2023, the foreign earned income exclusion is $120,000 up from $112,000 for tax year 2022.

 Estates of decedents who die during 2023 have a basic exclusion amount of $12,920,000, up from a total of $12,060,000 for estates of decedents who died in 2022.

 The annual exclusion for gifts increases to $17,000 for calendar year 2023, up from $16,000 for calendar year 2021.

 The maximum credit allowed for adoptions for tax year 2023 is the amount of qualified adoption expenses up to $15,950, up from $14,890 for 2022.

Brand New for 2023

The Inflation Reduction Act extended some energy-related tax breaks and indexed for inflation the energy-efficient commercial buildings deduction beginning with the tax year 2023. For 2023, the applicable dollar value used to determine the maximum allowance of the deduction is $0.54 increased by $0.02 for each percentage point by which the total annual energy and power costs for the building are certified to be reduced by a percentage greater than 25 percent (but not above $1.07). The applicable dollar value used to determine the increased deduction amount for certain property is $2.68 increased (but not above $5.36) by $0.11 for each percentage point by which the total annual energy and power costs for the building are certified to be reduced by a percentage greater than 25 percent.

Items Unaffected by Inflation Indexing

By statute, these items that were indexed for inflation in the past are currently not adjusted.

The personal exemption for tax year 2023 remains at 0, as it was for 2022, this elimination of the personal exemption was a provision in the Tax Cuts and Jobs Act.

 For 2023, as in 2022, 2021, 2020, 2019 and 2018, there is no limitation on itemized deductions, as that limitation was eliminated by the Tax Cuts and Jobs Act.

 The modified adjusted gross income amount used by joint filers to determine the reduction in the Lifetime Learning Credit provided in § 25A(d)(2) is not adjusted for inflation for taxable years beginning after December 31, 2020. The Lifetime Learning Credit is phased out for taxpayers with modified adjusted gross income in excess of $80,000 ($160,000 for joint returns).

What Else is Impacted

The maximum contribution amount for a 401(k) or similar workplace retirement plan is governed by yet another formula that uses September inflation data. It is estimated that the contribution limit will increase to $22,500 in 2023 from $20,500 this year and the catch-contribution amount for those age 50 or more will rise from $6,500 to at least $7,500.

The child tax credit under current law is $2,000 per child is not adjusted for inflation. But the additional child tax credit, which is refundable and available even to taxpayers that have no tax liability, is adjusted for inflation. It is expected to increase from $1,500 to $1,600 in 2023.

For those that look forward to capping out payments to Social Security, there is bad news. This has also increased. According to the 2022 Social Security Trustees Report, the wage base tax rate is projected to increase 5.5% from $147,000 to $155,100 in 2023.

Costs are rising, but so are deductions. It’s improbable that the reduced taxes will offset skyrocketing inflation, but at least there is one financial category that is helped by the increases.

Paul Hoffman

Managing Editor, Channelchek

Sources

https://www.irs.gov/newsroom/irs-provides-tax-inflation-adjustments-for-tax-year-2023

Small Caps are Bowling Over Large Caps – Here’s Why

Image Courtesy of Bowlero (BOWL)

Tailwinds Causing Investors to Love the Small Cap Sector

Investors have been reeling in U.S. small-cap stocks, and many have experienced the market rewarding them. As the U.S. dollar has been unrelentingly strong in 2022, the cost of products in any other currency has increased, this makes sales more difficult for multinational companies. The lower sales, of course, have the impact of weighing on the profits of U.S. companies that derive a large part of their earnings from overseas trade. This puts the smaller stocks at an advantage.

U.S. Dollar Tailwind

Goods valued in dollars, for example, using The WSJ Dollar Index which measures a basket of 16 currencies against the U.S. currency, are now up 16% on the year. This represents the minimum increase of the cost of products sold after the foreign exchange transaction, before inflation.  

This has little impact on small U.S.-based companies that don’t transact as much or at all outside the U.S. borders. This is because companies in the small-cap S&P 600 generate only 20% of their revenue outside the U.S., compared with large-cap S&P 500 stocks that generate 40% of sales internationally, according to FactSet.

This by itself gives small-cap stocks, in the aggregate, an edge over large-cap indexes like the S&P 500. However, small-caps haven’t been unscathed by the overall negative market sentiment this year. But, in recent months, value investors have been putting more upward pressure on the smaller, more U.S.-centric companies than on companies in the Nasdaq 100 or S&P 500. In fact, the small-cap Russell index is the only one of the three indexes showing green over the past three months. It has also been outperforming in shorter periods like one month, 10 days, and 5 days.

Value Tailwind

Wall Street often uses the ratio of a company’s share price to its earnings (P/E ratio) as a gauge for whether a stock appears cheap or overpriced. The small-cap universe, by this measure, is very attractive relative to themselves in recent years and certainly relative to large-cap valuations now.

The S&P 600 is trading at 10.8 times expected earnings over the next 12 months, according to FactSet as of Friday. That is below its 20-year average of 15.5 and well below the S&P 500’s forward price/earnings ratio of 15.3.

The Russell Small-Cap 2000 is up .36% versus the S&P 500, down 3.85%, and Nasdaq 100, down 7.70%. Not shown on the graph below, the S&P 600 small cap index is flat on the period.

Source: Koyfin

According to Royce Investment’s Third Quarter Chartbook, when comparing the stock market segments, four observations stand out. According to their Market Overview, these are:

1) Small-Cap Value, Small-Cap Core, and Small-Cap Growth are the cheapest segments of U.S. equities, 2) These segments are the only ones that are below their 25-year average valuation,

3) While all three value segments (Small-Cap, Mid-Cap, and Large-Cap) have nearly identical 25-year average valuations, their current valuations are vastly different, and

4) Mid-Cap Growth and Large-Cap valuations still have a long way to fall to reach their 25-year average valuations.

The presumption is with the segments all having the same 25-year average valuations and small-cap being below its average, while mid-cap and large-cap has to go down to reach its mean, that not only is small-cheap, but the other segments are still expensive.

Individually, some of the largest companies in the U.S. have shared their individual risks brought on by fluctuations in the currency market. Nike Inc., Fastenal Co., Domino’s Pizza Inc. and some others have pointed to negative foreign-exchange impacts during recent earnings calls. Microsoft warned of these pressures back in June.

Small-Cap Examples

Some standouts, not necessarily in either the S&P 600 or Russell 2000, small-cap indices, but found on Channelchek are, Bowlero (BOWL), with a market cap of 2.4 billion and performance of up 26.6% over the same three-month period shown in the chart above.  For the same period, Comtech Telecommunications (CMTL), with a market cap of 281.5 million, and some international business, is up 12.6%. And RCI Hospitality Holdings (RICK), with a market cap of $705.9 million, has a three-month return of 45.7%. These examples can be found on Channelchek with complete, up-to-date research, alongside many other actionable opportunities.  

Take Away

If yesterday’s trade isn’t working because of factors working against it, perhaps what wasn’t working yesterday is now coming into favor. The tailwind for smaller companies is coming from a few different places; they include having a higher percentage of domestic customers and also the law of reversion to the mean. The continued headwinds for larger companies include being much more likely to have problems that include foreign customer FX, and valuations that are still sitting above the 25-year average.

When researching small-cap stocks, remember that is exactly what no-cost Channelchek was made for.

Paul Hoffman

Managing Editor, Channelchek

Sources

https://www.royceinvest.com/insights/chartbook/us-small-cap-mrkt-overview/index.html

https://www.wsj.com/podcasts/google-news-update/strong-dollar-boosts-bounceback-of-small-cap-stocks/

Michael Burry Wonders Aloud if Facebook Knows What It Wants to Be

Image Credit: Marco Verch (Flickr)  

Is Meta the Wrong Path for Facebook, or is it Just Ahead of its Time?

Not all ideas are good ideas, even when they come from billionaire tech start-up founders like Mark Zuckerberg.

Michael Burry, the legendary investor of “Big Short” fame, has been criticizing the social media giant’s metaverse strategy. Burry joins others in questioning why Zuck would change the Facebook formula and spend billions embracing something that is far from real. Many of Zuckerberg’s critics are other successful billionaires like Elon Musk and Mark Cuban. Other critics are investors that have endured Meta share’s 62.3% ($570 billion) decline since January.  

Burry founded and manages the hedge fund Scion Asset Management. Burry tweeted a message that seems to say Meta management blew it – and suggests they have blown it by historic proportions by taking a deep dive into something that may or may not have legs – the metaverse.

Image: @BurryDeleted (Twitter)

You don’t have to have been alive in the mid-1980s to know what Burry was saying when he posted, “Seems Meta has a New Coke problem.” Any business school textbook lists Coca-Cola’s changing the formula of its best-selling product as the #1 lesson in corporate blunders. It was an expensive change that failed miserably and caused the company to revert back to its original product or risk losing a lot more ground against rivals.

A Sweet Refresher

New Coke was a much sweeter version of the Coca-Cola people had become accustomed to using to wash down their pizza slices, or a burger and fries. It was introduced by Coca-Cola in April 1985 during the cola war Pepsi was waging.

At the time Coca Cola was perhaps one of the most recognized brands in the world. But, Pepsi stole customers after it ran a few Michael Jackson commercials suggesting its sugar water was the “choice of a new generation,” and also backed it up with ads showing blind taste test preferences. Between the taste test science and everyone wanting to be more like Michael Jackson, Coke lost market share. Coke reacted by reformulating its product and did its own blind side-by-side tests that indicated that consumers seemed to prefer the new sweeter taste, similar to Pepsi. The company then decided to market the reformulated recipe – New Coke was born.

Max Headroom was the spokesman for New Coke, Like the Grand Canyon (Flickr)

New Coke was introduced in April 1985, and within weeks they were receiving 5,000 angry calls a day. The number grew from there. Seventy-nine days after their initial announcement, Coca-Cola held a press conference in July 1985 to offer a mea culpa and announce the return of the original Coca-Cola “classic” formula.

Will Zuckerberg Relent?

So far, Facebook, I mean Meta, still wants to identify as a metaverse company, despite there being very few metaverse customers. The company is making sure users have accessories available and just unveiled a new virtual reality headset selling for $1,500 called the Meta Quest Pro. Zuckerberg says lower priced, presumably not “pro,” will follow ($300-$500 zone).

When one has built a business from a college dorm, a garage, or their mother’s basement, and it attains the kind of growth that Facebook, Apple, Amazon, or others have, it’s hard to keep growing at the pace investors and other onlookers have become accustomed to. This leads to a scenario where investors are exposed to a risk best described as the bigger they are, the farther they have to fall.  

And Facebook has fallen, not just in dollar value, but in ranking among its peers. Does this mean Zuckerberg is not right? The game isn’t over, and there aren’t many of us that can say, with honesty, that we are more forward-looking or have more luck than Zuck.

Is Michael Burry Right?

There is a whole universe of stocks beyond metaverse investments. Huge successful companies like Facebook or even Coca-Cola have ample resources to build and grow but lose nimbleness and growth potential, unlike the potential smaller companies enjoy. Huge companies are also more likely to have a “say yes to the boss, and you’ll be rewarded” culture, rather than a small company culture which is more “show the boss you can make them money, and you’ll be rewarded” culture.

Zuckerberg and Meta may very well be moving forward with a mistake that could be enshrined in textbooks years from now. However, like Coke, they may find that if it’s a lemon, they can make lemonade. Coca-Cola emerged from the brief departure from their main product strengthened as consumers discovered what life was like without their favorite soft drink.

Take Away

Michael Burry is worth paying attention to. He thinks differently and has been correct enough to always listen. The metaverse is new; does this mean it won’t grow and become something only a visionary like Mark Zuckerberg can imagine? It has been an expensive and slow start. I suspect Facebook was much less expensive to get off the ground, and adoption also required ancillary products to be useable by the masses.

A lesson investors should remember from this is how difficult it is for large companies to grow from their current offerings and huge corporate base.

Channelchek is a platform created to help investors uncover the next Apple, the next Moderna, or the next Facebook. It’s a resource to dig deeper into these less celebrated fledgling opportunities and to leave investors with enough understanding to decide whether they should take their own action by buying stock and becoming an owner of something with greater than average potential.

Paul Hoffman

Managing Editor, Channelchek  

Sources

https://www.history.com/news/why-coca-cola-new-coke-flopped

https://www.thestreet.com/technology/big-short-burry-says-facebook-and-zuckerberg-are-in-big-trouble

https://www.nytimes.com/2022/10/09/technology/meta-zuckerberg-metaverse.html