Will the Fed Indicate an Altered Course This Week?
Economic numbers may take a back seat to Fed Chair Powell’s address on Wednesday and other regional Fed President addresses throughout the week.
The PCE, which is an inflation adjuster to GDP, is reported on the same day as the Fed Chair’s midweek address, the potential for volatility is high.
Monday 11/28
10:30 ET, Dallas Fed Manufacturing Survey, is expected to show general activity down 20.5 vs. down 19.4 the prior month. This would be the seventh straight reduction in manufacturing.
12:00 ET, John Williams, the President of the New York Federal Reserve Bank, will be speaking. Although the NY Fed President has only one vote on the Federal Open Market Committee deciding monetary policy, the NY Fed tends to have more sway as the NY Fed President assumes the role of second after Chair Powell in the level of power.
Tuesday 11/29
9:00 AM ET, The FHFA House Price Index is expected to have fallen 1.2 percent in September after falling 0.7 percent in August and 0.6 percent in July. August marked the sharpest fall and first back-to-back fall in 11 years.
10:00 AM ET, Consumer Confidence for November 2022 is expected to come in at 100 vs 102.5 in October. The report measures consumers’ assessments of the labor market, business activity, and consumers’ own financial conditions. This could be one of the more important numbers of the week as consumer expectations and behavior can lead stock market movements and play into overall expectations as consumer spending is two-thirds of the U.S. economy.
Wednesday 11/30
8:30 AM ET, GDP this will be the second estimate of the third-quarter GDP. The consensus is 2.7 percent growth. The previous estimate for the same period came in at 2.6%. The Personal Consumption Expenditures (PCE), which is considered the Fed’s favored measure of inflation, is expected to show a rise of 1.5% for the month vs. the previous 1.4% monthly increase. The PCE component of GDP may get more attention than the GDP itself since it is considered a measure of inflation.
8:30 AM ET, The U.S. Goods Deficit is expected to narrow by $1.3 billion to $90.6 billion in October after narrowing by more than $6 billion in September to $91.9 billion. Changes in the levels of imports and exports, along with netting the two (trade balance), are gauges of economic trends here and abroad. These trade figures can directly impact all financial markets; however, they do this in how they impact the valuation of the dollar.
8:30 Wholesale Inventories are expected to be revised downward to 0.5%. This follows a build-up in inventories in September. A decline could suggest supply-chain difficulties are increasing.
10:00 AM ET, JOLTS consensus is for job openings to fall 10.4 million vs. 10.7 million in September. This number will be focused on as the September number was at a level that caused some to question whether the economy still has job shortages.
1:30 PM ET, Federal Reserve Chair Jerome Powell will speak on the subjects of inflation and economic outlook; this could very well be the most market-altering event of the week. Watch it live by clicking here.
2:00 PM ET, Beige Book released. A look at how each of the 12 Federal Reserve districts are reporting economic activity in their regions is important in this is a source of information the FOMC uses to make their decisions.
3:00 PM ET, Farm Prices month-over-month is expected to have declined by 0.2%. Year-over-year the inflation contributor is expected to have risen 21%.
Thursday 12/1
8:30 AM ET, Jobless Claims for the November 27 week are expected to come in at 235,000 versus 240,000 in the prior week. Employment is one of the Fed’s mandates; as such, any number that significantly varies from consensus could alter the markets thinking.
9:25 AM ET, Dallas Fed President Lorie Logan is scheduled to give an address.
10:00 AM ET, ISM Manufacturing Index was 50.2 in October; the ISM Manufacturing Index has been gradually slowing to nearly breakeven. November’s consensus is 49.9.
10:00 AM ET, Construction spending is expected to fall 0.2 percent in October. This would be dramatic relative to September’s modest 0.2 percent gain.
Friday 12/2
8:30 AM ET, The Employment Situation or Non-Farm Payroll is expected to rise by 200,000, which would compare with 261,000 as reported in October. October was the sixth straight month and eight of the last nine that payroll growth exceeded consensus. Average hourly earnings in November are expected to rise 0.3 percent on the month for a year-over-year rate of 4.6; these would compare with 0.4 and 4.7 percent in October.
What Else
There are more rumblings about the Fed easing up on how rapidly it is braking to tame an inflationary economy. The Powell’s words and promises on Wednesday, taken alongside of the other Fed President addresses may confirm a turning point – a tapering of the tightening.
The idea that correlation does not imply causation is a fundamental caveat in epidemiological research. A classic example involves a hypothetical link between ice cream sales and drownings – instead of increased ice cream consumption causing more people to drown, it’s plausible that a third variable, summer weather, is driving up an appetite for ice cream and swimming, and hence opportunities to drown.
But what about correlations involving genes? How can researchers be sure that a particular trait or disease is truly genetically linked, and not caused by something else?
This article was republished with permission from The Conversation, a news site dedicated to sharing ideas from academic experts. It represents the research-based findings and thoughts of Richard Border, Postdoctoral Researcher in Statistical Genetics, University of California, Los Angeles and Noah Zaitlen, Professor of Neurology and Human Genetics, University of California, Los Angeles.
We are statistical geneticists who study the genetic and nongenetic factors that influence human variation. In our recently published research, we found that the genetic links between traits found in many studies might not be connected by genes at all. Instead, many are a result of how humans mate.
Genome-wide association studies try to link genes to traits
Because the genes you inherit from your parents remain unchanged throughout your life, with rare exception, it makes sense to assume that there is a causal relationship between certain traits you have and your genetics.
This logic is the basis for genome-wide association studies, or GWAS. These studies collect DNA from many people to identify positions in the genome that might be correlated with a trait of interest. For example, if you have certain forms of the BRCA1 and BRCA2 genes, you may have an increased risk for certain types of cancer.
Similarly, there may be gene variants that play a role in whether or not someone has schizophrenia. The hope is to learn something about the complex mechanisms that link variation at the molecular level to individual differences. With a clearer understanding of the genetic basis of different traits, scientists would be better able to determine risk factors for related diseases.
GWAS studies seek to find genetic associations between individual traits.
Researchers have run thousands of GWAS to date, identifying genetic variants associated with myriad diseases and disease-related traits. In many instances, researchers have identified genetic variants that affect more than one trait. This form of biological overlap, in which the same genes are thought to influence several apparently unrelated traits, is known as pleiotropy. For example, certain variants of the PAH gene can have several distinct effects, including altering skin pigmentation and causing seizures.
One way scientists assess pleiotropy is through genetic correlation analysis. Here, geneticists investigate whether the genes associated with a given trait are associated with other traits or diseases by statistically analyzing large samples of genetic data. Over the past decade, genetic correlation analysis has become the primary method for assessing potential pleiotropy across fields as diverse as internal medicine, social science and psychiatry.
Scientists use the findings from genetic correlation analyses to figure out the potential shared causes of these traits. For instance, if genes associated with bipolar disorders also predict anxiety disorders, perhaps the two conditions may partially involve some of the same neural circuits or respond to similar treatments.
Assortative Mating and Genetic Correlation
However, just because a gene is correlated with two or more traits doesn’t necessarily mean it causes them.
Virtually all the statistical methods researchers commonly use to assess genetic correlations assume that mating is random. That is, they assume that potential mating partners decide who they will have children with based on a roll of the dice. In reality, many factors likely influence who mates with whom. The simplest example of this is geography – people living in different parts of the world are less likely to end up together than people living nearby.
We wanted to find out how much the assumption of random mating affects the accuracy of genetic correlation analyses. In particular, we focused on the potential confounding effects of assortative mating, or how people tend to mate with those who share similar characteristics with them. Assortative mating is a widely documented phenomenon seen across a broad array of traits, interests, measures and social factors, including height, education and psychiatric conditions.
In our study we examined cross-trait assortative mating, whereby people with one trait (for example, being tall) tend to mate with people with a completely different trait (for example, being wealthy). From our database of 413,980 mate pairs in the U.K. and Denmark, we found evidence of cross-trait assortative mating for many traits – for instance, an individual’s time spent in formal schooling was correlated not only with their mate’s educational attainment, but also with many other characteristics, including height, smoking behaviors and risk for different diseases.
We found that taking into consideration the similarities across mates could strongly predict which traits would be considered genetically linked. In other words, just based on how many characteristics a pair of mates shared, we could identify around 75% of the presumed genetic links between these traits – all without sampling any DNA.
Genetic Correlation Does Not Imply Causation
Cross-trait assortative mating shapes the genome. If people with one heritable trait tend to mate with people with another heritable trait, then these two distinct characteristics will become genetically correlated to each other in subsequent generations. This will happen regardless of whether or not these traits are truly genetically linked to each other.
Cross-trait assortative mating means that the genes you inherit from one parent will be correlated with those you inherit from the other. How people mate is not random, violating the key assumption behind genetic correlation analyses. This inflates the genetic association between traits that aren’t truly linked together by genes.
If dinosaurs with long horns preferentially mate with dinosaurs with spiked backs, genes for both of these traits can become associated with each other in subsequent generations even though the same gene doesn’t code for them.
Recent studies corroborate our findings. Earlier this year, researchers computed genetic correlations using a method that examines the association between the traits and genes of siblings. The genetic links between traits influenced by cross-trait assortative mating were substantially weakened.
But without accounting for cross-trait assortative mating, using genetic correlation estimates to study the biological pathways causing disease can be misleading. Genes that affect only one trait will appear to influence multiple different conditions. For example, a genetic test designed to assess the risk for one disease may incorrectly detect vulnerability for a broad number of unrelated conditions.
The ability to measure variation across individuals at the genetic and molecular level is truly a feat of modern science. However, genetic epidemiology is still an observational enterprise, subject to the same caveats and challenges facing other forms of nonexperimental research. Though our findings don’t discount all genetic epidemiology research, understanding what genetic studies are truly measuring will be essential to translate research findings into new ways to treat and assess disease.
Why the Fed Needs to Gain Trust, Gain Momentum, and Gain More Yards
Monetary policy and its implementation is as much sport as science. Economics is actually a social science, so it relies on human behavior to mimic past behaviors as its prediction guide. But as in sports, victory is difficult if there is distrust in the coach that’s calling the shots (in this case Powell), or if there are people on your side that have reason to work against you, (an example would be Yellen). Consistency in blocking and tackling (doing the right thing) and not giving up, over time, wins games. Knowing what to expect from the opposing team (consumers) wins a healthy economy.
One repeated trait in monetary policy is that there is a lag between implementation (easing or tightening) and a change in economic conditions. It isn’t a short lag, and the impact varies. Since it could take more than a year for a policy change to begin to impact the economy, the Fed usually moves at a slow and measured pace in order to not overdo it.
The slow pace allows policymakers to observe the impact of their moves and change tactics (positions on the playing field) mid-game.
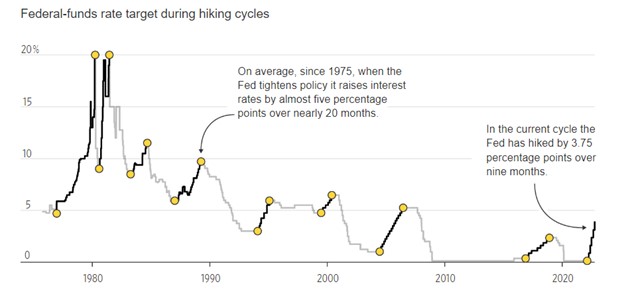
Federal-Funds Rate During Tightening Cycles
Note: From December 2008, midpoint of target range. December 2015 hike excluded from 2016-18 cycle
Source: Federal Reserve
Over the past nine months, we have been in a tightening cycle. During this period, the Fed has raised rates by 3.75%. On average (since 1975), when the Fed has tightened rates, they are notched up by 5.00% over 20 months.
The Fed’s current pace is faster than average. This is because inflation took them by surprise, and rose rapidly. Putting up a strong defense against inflation that has been rampant is necessary to not be shut out and allow the Fed to gain control over the outcome.
Because one has to be able to reflect back more than 40 years to have experienced the Fed raising rates this fast. Many have lost confidence in its ability, and are in their own way working against a winning outcome.
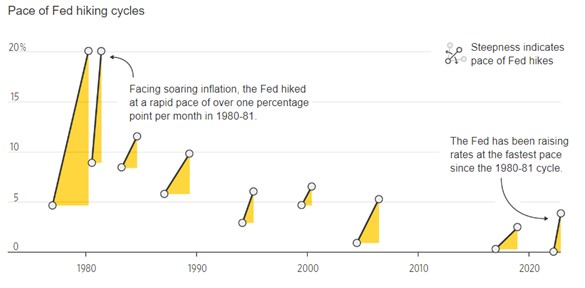
Pace of Fed Hiking Cycles
Note: From December 2008, the midpoint of target range
Source: Federal Reserve
The stock and bond markets move in group anticipation of expected policy moves by the Fed. This has been more pronounced in recent years as the Fed has basically shared its expectations after each meeting, setting up for the next. Higher rates make bonds and bank deposits more attractive. Higher rates also weaken the economy and corporate profits, and that induces investors to move away from stocks and even real estate.
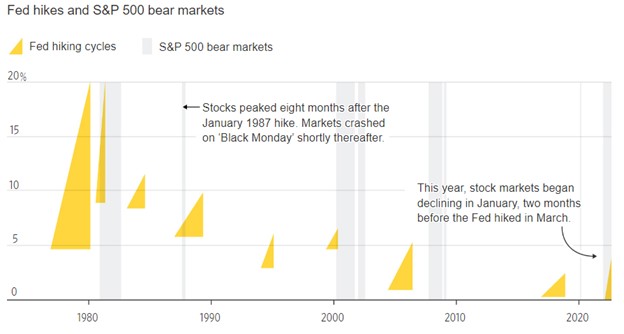
Bonds now offer the highest yields since 2007. The stock market may have anticipated what was to come as it peaked in early January of this year, more than two months before the Fed began hiking in March.
Fed Hikes and S&P 500 Bear Markets
Sources: Federal Reserve; Dow Jones Market Data
Sources: Federal Reserve; Dow Jones Market Data
Employment
The Fed is concerned with a wage-price spiral feeding on itself. It likely won’t be satisfied that its tightening has been sufficient until it can be confident that it has avoided a wage-price storm on the economy.
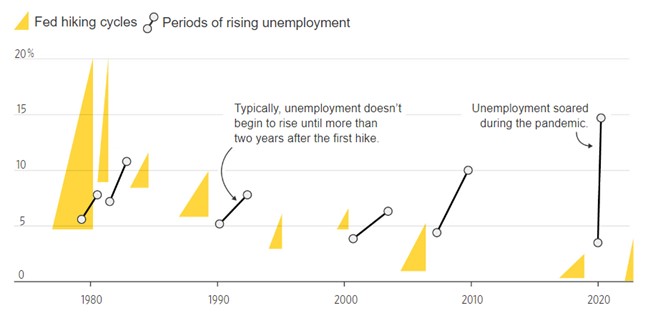
Ideally, this would happen without unemployment rising. Soft landings took place in 1983-84 and 1994-95. But when inflation starts out too high, as it is now, unemployment usually rises notably, and a recession occurs.
Historically, this doesn’t happen until several years after the first increase. This time it is hoped it will be different, since the Fed is playing more aggressively.
Periods of Fed Hiking and Rising Unemployment
Note: The unemployment rate rose to 3.7% in October, up from the pandemic low of 3.5% a month earlier. Sources: Federal Reserve; Labor Department
Inflation
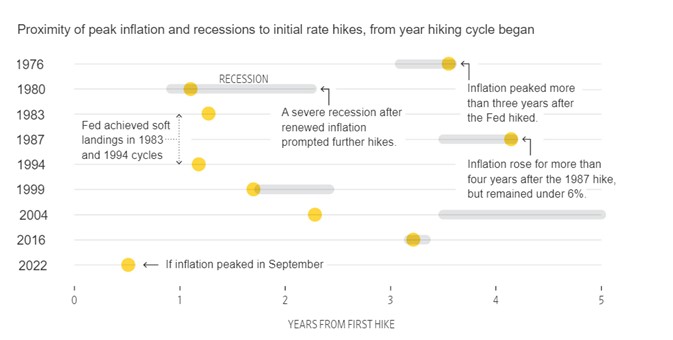
Historically, inflation has only fallen to acceptable levels after unemployment has increased, and long after the first rate increase – the exact timing has varied. If the fall in core inflation (which excludes the volatile food and energy components) between September and October continues, and September proves to be the peak, the time between the first Fed increase and the high point of inflation will be one of the shortest of any Fed hiking cycle.
Often, the break in inflation has been accompanied by a recession. The economy receded in each of the first two quarters and then grew in the third. The changes in the inflation component in Gross Domestic Product may have borrowed from one quarter and have been additive to the next. The fourth quarter reading should help level the growth averages out to see if we were indeed in a shallow recession.
Proximity of Peak Inflation and Recessions to Initial Rate Hikes, from Year Hiking Cycle Began
Note: Inflation refers to core CPI.
Sources: Federal Reserve; Labor Department
Take Away
As in many team sports, once one side gets momentum, they are difficult to stop . The Fed needs to gain the trust of the individual players in the economy in order to be successful. Saying one thing, then doing another, would undermine this trust. So far, despite the Fed originally being wrong about inflation, the Fed has done what it has said it would do. Stock and bond markets, which are a considerable part of the economy, have been slow to understand the Fed’s resolve.
It has been implementing the balance sheet run-off plan and raising rates toward a level it believes would equate to a future 2% inflation rate. Like so many other things in the social sciences, widely held expectations of the future become self-fulfilling.
Railroad Unions and Their Employers at an Impasse: Freight-Halting Strikes are Rare, and this Would be the First in 3 Decades
The prospect of a potentially devastating rail workers strike is looming again.
Fears of a strike in September 2022 prompted the Biden administration to pull out all the stops to get a deal between railroads and the largest unions representing their employees.
That deal hinged on ratification by a majority of members at all 12 of those unions. So far, eight have voted in favor, but four have rejected the terms. If even one continues to reject the deal after further negotiations, it could mean a full-scale freight strike will start as soon as midnight on Dec. 5, 2022. Any work stoppage by conductors and engineers would surely interfere with the delivery of gifts and other items Americans will want to receive in time for the holiday season, along with coal, lumber and other key commodities.
Strikes that obstruct transportation rarely occur in the United States, and the last one involving rail workers happened three decades ago. But when these workers do walk off the job, it can thrash the economy, inconveniencing millions of people and creating a large-scale crisis.
This article was republished with permission from The Conversation, a news site dedicated to sharing ideas from academic experts. It represents the research-based findings and thoughts of Erik Loomis, Professor of History, University of Rhode Island.
I’m a labor historian who has studied the history of American strikes. I believe that with the U.S. teetering toward at least a mild recession and some of the supply chain disruptions that arose at the outset of the COVID-19 pandemic still wreaking havoc, I don’t think the administration would accept a rail strike for long.
19th Century Rail Strikes
Few, if any, workers have more power over the economy than transportation workers. Their ability to shut down the entire economy has often led to heavy retaliation from the government when they have tried to exercise that power.
In 1877, a small strike against a West Virginia railroad that had cut wages spread. It grew into what became known as the Great Railroad Strike, a general rebellion against railroads that brought thousands of unemployed workers into the streets.
Seventeen years later, in 1894, the American Railway Union went on strike in solidarity with the Pullman Sleeping Car company workers who had gone on strike due to their boss lowering wages while maintaining rents on their company housing.
In both cases, the threat of a railroad strike led the federal government to call out the military to crush the labor actions. Dozens of workers died.
Once those dramatic clashes ended, for more than a century rail unions have played a generally quiet role, preferring to focus on the needs of their members and avoiding most broader social and political questions. Fearful of more rail strikes, the government passed the Railway Labor Act of 1926, which gives Congress the power to intervene before a rail strike starts.
Breaking the Air Traffic Controllers Union
With travel by road and air growing in importance in the 20th century, other transportation workers also engaged in actions that could shut down the economy.
The Professional Air Traffic Controllers Association walked off the job in 1981 after a decade of increased militancy over the stress and conditions of their job. The union had engaged in a series of slowdowns through the 1970s, delaying airplanes and frustrating passengers.
When it went on strike in 1981, the union broke the law, as federal workers do not have the right to strike. That’s when President Ronald Reagan became the first modern U.S. leader to retaliate against striking transportation workers. Two days after warning the striking workers that they would lose their jobs unless they returned to work, Reagan fired more than 11,000 of them. He also banned them from ever being rehired.
In the aftermath of Reagan’s actions, the number of strikes by U.S. workers plummeted. Rail unions engaged in brief strikes in both 1991 and 1992, but Congress used the Railway Labor Act to halt them, ordering workers back on the job and imposing a contract upon the workers.
In 1992, Congress passed another measure that forced a system of arbitration upon railroad workers before a strike – that took power away from workers to strike.
New Era of Labor Militancy
Following decades of decline in the late 20th century, U.S. labor organizing has surged in recent years.
Most notably, unionization attempts at Starbucks and Amazon have led to surprising successes against some of the biggest corporations in the country. Teachers’ unions around the nation have also held a series of successful strikes everywhere from Los Angeles to West Virginia.
United Parcel Service workers, who held the nation’s last major transportation strike, in 1997, may head back to the picket lines after their contract expires in June 2023. UPS workers, members of the Teamsters union, are angry over a two-tiered system that pays newer workers lower wages, and they are also demanding greater overtime protections.
But rail workers, angered by their employers’ refusal to offer sick leave and other concerns, may go on strike first.
Rail companies have greatly reduced the number of people they employ on freight trains as part of their efforts to maximize profits and take advantage of technological progress. They generally keep the size of crews limited to only two per train.
Many companies want to pare back their workforce further, saying that it can be safe to have crews consisting of a single crew member on freight trains. The unions reject this arrangement, saying that lacking a second set of eyes would be a recipe for mistakes, accidents and disasters.
The deal the Biden administration brokered in September would raise annual pay by 24% over several years, raising the average pay for rail workers to $110,000 by 2024. But strikes are often about much more than wages. The companies have also long refused to provide paid sick leave or to stop demanding that their workers have inflexible and unpredictable schedules.
The Biden administration had to cajole the rail companies into offering a single personal day, while workers demanded 15 days of sick leave. Companies had offered zero. The agreement did remove penalties from workers who took unpaid sick or family leave, but this would still leave a group of well-paid workers whose daily lives are filled with stress and fear.
What Lies Ahead
Seeing highly paid workers threaten to take action that would surely compound strains on supply chains at a time when inflation is at a four-decade high may not win rail unions much public support.
A coalition representing hundreds of business groups has called for government intervention to make sure freight trains keep moving, and it’s highly likely that Congress will again impose a decision on workers under the Railway Labor Act. The Biden administration, which has shown significant sympathy to unions, has resisted supporting such a step so far.
No one should expect the military to intervene like it did in the 19th century. But labor law remains tilted toward companies, and I believe that if the government were to compel striking rail workers back on the job, the move might find a receptive audience.
A team of scientists at the Whitehead Institute for Biomedical Research and the Broad Institute of MIT and Harvard has systematically evaluated the functions of over 5,000 essential human genes using a novel, pooled, imaged-based screening method. Their analysis harnesses CRISPR-Cas9 to knock out gene activity and forms a first-of-its-kind resource for understanding and visualizing gene function in a wide range of cellular processes with both spatial and temporal resolution. The team’s findings span over 31 million individual cells and include quantitative data on hundreds of different parameters that enable predictions about how genes work and operate together. The new study appears in the Nov. 7 online issue of the journal Cell.
“For my entire career, I’ve wanted to see what happens in cells when the function of an essential gene is eliminated,” says MIT Professor Iain Cheeseman, who is a senior author of the study and a member of Whitehead Institute. “Now, we can do that, not just for one gene but for every single gene that matters for a human cell dividing in a dish, and it’s enormously powerful. The resource we’ve created will benefit not just our own lab, but labs around the world.”
Systematically disrupting the function of essential genes is not a new concept, but conventional methods have been limited by various factors, including cost, feasibility, and the ability to fully eliminate the activity of essential genes. Cheeseman, who is the Herman and Margaret Sokol Professor of Biology at MIT, and his colleagues collaborated with MIT Associate Professor Paul Blainey and his team at the Broad Institute to define and realize this ambitious joint goal. The Broad Institute researchers have pioneered a new genetic screening technology that marries two approaches — large-scale, pooled, genetic screens using CRISPR-Cas9 and imaging of cells to reveal both quantitative and qualitative differences. Moreover, the method is inexpensive compared to other methods and is practiced using commercially available equipment.
“We are proud to show the incredible resolution of cellular processes that are accessible with low-cost imaging assays in partnership with Iain’s lab at the Whitehead Institute,” says Blainey, a senior author of the study, an associate professor in the Department of Biological Engineering at MIT, a member of the Koch Institute for Integrative Cancer Research at MIT, and a core institute member at the Broad Institute. “And it’s clear that this is just the tip of the iceberg for our approach. The ability to relate genetic perturbations based on even more detailed phenotypic readouts is imperative, and now accessible, for many areas of research going forward.”
Cheeseman adds, “The ability to do pooled cell biological screening just fundamentally changes the game. You have two cells sitting next to each other and so your ability to make statistically significant calculations about whether they are the same or not is just so much higher, and you can discern very small differences.”
Cheeseman, Blainey, lead authors Luke Funk and Kuan-Chung Su, and their colleagues evaluated the functions of 5,072 essential genes in a human cell line. They analyzed four markers across the cells in their screen — DNA; the DNA damage response, a key cellular pathway that detects and responds to damaged DNA; and two important structural proteins, actin and tubulin. In addition to their primary screen, the scientists also conducted a smaller, follow-up screen focused on some 200 genes involved in cell division (also called “mitosis”). The genes were identified in their initial screen as playing a clear role in mitosis but had not been previously associated with the process. These data, which are made available via a companion website, provide a resource for other scientists to investigate the functions of genes they are interested in.
“There’s a huge amount of information that we collected on these cells. For example, for the cells’ nucleus, it is not just how brightly stained it is, but how large is it, how round is it, are the edges smooth or bumpy?” says Cheeseman. “A computer really can extract a wealth of spatial information.”
Flowing from this rich, multi-dimensional data, the scientists’ work provides a kind of cell biological “fingerprint” for each gene analyzed in the screen. Using sophisticated computational clustering strategies, the researchers can compare these fingerprints to each other and construct potential regulatory relationships among genes. Because the team’s data confirms multiple relationships that are already known, it can be used to confidently make predictions about genes whose functions and/or interactions with other genes are unknown.
There are a multitude of notable discoveries to emerge from the researchers’ screening data, including a surprising one related to ion channels. Two genes, AQP7 and ATP1A1, were identified for their roles in mitosis, specifically the proper segregation of chromosomes. These genes encode membrane-bound proteins that transport ions into and out of the cell. “In all the years I’ve been working on mitosis, I never imagined ion channels were involved,” says Cheeseman.
He adds, “We’re really just scratching the surface of what can be unearthed from our data. We hope many others will not only benefit from — but also build upon — this resource.”
This work was supported by grants from the U.S. National Institutes of Health as well as support from the Gordon and Betty Moore Foundation, a National Defense Science and Engineering Graduate Fellowship, and a Natural Sciences and Engineering Research Council Fellowship.
Will Global Rate Hikes Set Off a Global Debt Bomb?
The higher levels of risky corporate debt issuance over the past few year will need to be refinanced between 2023 and 2025, In numbers terms, there will be over $10 trillion of the riskiest debt at much higher interest rates and with less liquidity. In addition to domestic high yield issuance, the majority of the major European economies have issued negative-yielding debt over the past three years and must now refinance at significantly higher rates. In 2020–21. the annual increase in the US money supply (M2) was 27 percent, more than 2.5 times higher than the quantitative easing peak of 2009 and the highest level since 1960. Negative yielding bonds, an economic anomaly that should have set off alarm bells as an example of a bubble worse than the “subprime” bubble, amounted to over $12 trillion. Even if refinancing occurs smoothly but at higher costs, the impact on new credit and innovation will be enormous, and the crowding out effect of government debt absorbing the majority of liquidity and the zombification of the already indebted will result in weaker growth and decreased productivity in the future.
Raising interest rates is a necessary but insufficient measure to combat inflation. To reduce inflation to 2 percent, central banks must significantly reduce their balance sheets, which has not yet occurred in local currency, and governments must reduce spending, which is highly unlikely.
The most challenging obstacle is also the accumulation of debt.
The so-called expansionary policies have not been an instrument for reducing debt, but rather for increasing it. In the second quarter of 2022, according to the Institute of International Finance (IIF), the global debt-to-GDP ratio will approach 350 percent of GDP. IIF anticipates that the global debt-to-GDP ratio will reach 352 percent by the end of 2022.
Global issuances of high-yield debt have slowed but remain elevated. According to the IMF, the total issuance of European and American high-yield bonds reached a record high of $1,6 trillion in 2021, as businesses and investors capitalized on still low interest rates and high liquidity. According to the IMF, high-yield bond issuances in the United States and Europe will reach $700 billion in 2022, similar to 2008 levels. All of the risky debt accumulated over the past few years will need to be refinanced between 2023 and 2025, requiring the refinancing of over $10 trillion of the riskiest debt at much higher interest rates and with less liquidity.
Moody’s estimates that United States corporate debt maturities will total $785 billion in 2023 and $800 billion in 2024. This increases the maturities of the Federal government. The United States has $31 trillion in outstanding debt with a five-year average maturity, resulting in $5 trillion in refinancing needs during fiscal 2023 and a $2 trillion budget deficit. Knowing that the federal debt of the United States will be refinanced increases the risk of crowding out and liquidity stress on the debt market.
According to The Economist, the cumulative interest bill for the United States between 2023 and 2027 should be less than 3 percent of GDP, which appears manageable. However, as a result of the current path of rate hikes, this number has increased, which exacerbates an already unsustainable fiscal problem.
If you think the problem in the United States is significant, the situation in the eurozone is even worse. Governments in the euro area are accustomed to negative nominal and real interest rates. The majority of the major European economies have issued negative-yielding debt over the past three years and must now refinance at significantly higher rates. France and Italy have longer average debt maturities than the United States, but their debt and growing structural deficits are also greater. Morgan Stanley estimates that, over the next two years, the major economies of the eurozone will require a total of $3 trillion in refinancing.
Although at higher rates, governments will refinance their debt. What will become of businesses and families? If quantitative tightening is added to the liquidity gap, a credit crunch is likely to ensue. However, the issue is not rate hikes but excessive debt accumulation complacency.
Explaining to citizens that negative real interest rates are an anomaly that should never have been implemented is challenging. Families may be concerned about the possibility of a higher mortgage payment, but they are oblivious to the fact that house prices have skyrocketed due to risk accumulation caused by excessively low interest rates.
The magnitude of the monetary insanity since 2008 is enormous, but the glut of 2020 was unprecedented. Between 2009 and 2018, we were repeatedly informed that there was no inflation, despite the massive asset inflation and the unjustified rise in financial sector valuations. This is inflation, massive inflation. It was not only an overvaluation of financial assets, but also a price increase for irreplaceable goods and services. The FAO food index reached record highs in 2018, as did the housing, health, education, and insurance indices. Those who argued that printing money without control did not cause inflation, however, continued to believe that nothing was wrong until 2020, when they broke every rule.
In 2020–21, the annual increase in the US money supply (M2) was 27 percent, more than 2.5 times higher than the quantitative easing peak of 2009 and the highest level since 1960. Negative yielding bonds, an economic anomaly that should have set off alarm bells as an example of a bubble worse than the “subprime” bubble, amounted to over $12 trillion. But statism was pleased because government bonds experienced a bubble. Statism always warns of bubbles in everything except that which causes the government’s size to expand.
In the eurozone, the increase in the money supply was the greatest in its history, nearly three times the Draghi-era peak. Today, the annualized rate is greater than 6 percent, remaining above Draghi’s “bazooka.” All of this unprecedented monetary excess during an economic shutdown was used to stimulate public spending, which continued after the economy reopened … And inflation skyrocketed. However, according to Lagarde, inflation appeared “out of nowhere.”
No, inflation is not caused by commodities, war, or “disruptions in the supply chain.” Wars are deflationary if the money supply remains constant. Several times between 2008 and 2018, the value of commodities rose sharply, but they do not cause all prices to rise simultaneously. If the amount of currency issued remains unchanged, supply chain issues do not affect all prices. If the money supply remains the same, core inflation does not rise to levels not seen in thirty years.
All of the excess of unproductive debt issued during a period of complacency will exacerbate the problem in 2023 and 2024. Even if refinancing occurs smoothly but at higher costs, the impact on new credit and innovation will be enormous, and the crowding out effect of government debt absorbing the majority of liquidity and the zombification of the already indebted will result in weaker growth and decreased productivity in the future.
Europe May Be Saved from the December Planned Oil Embargo in a Nick of Time
On December 5, the European Union plans to cap oil prices at levels where EU nations would then be permitted to buy oil from Russia. This would significantly reduce the petroleum supply of the region going into winter. The day before this goes into effect, (December 4), OPEC+ will meet to set output levels. Saudi Arabia and other OPEC producers are expected to discuss an output increase, according to emissaries from the group. The 11th hour move could keep much needed petroleum flowing into the region at a time that weather-related demand would naturally grow, holiday driving would be expected to increase, and war-related strategies would have reduced oil coming out of Russia. While western news has verified their sources as actual delegates of OPEC+, the Saudi’s are now saying that their plans are always secret.
About the New Expectations
A production increase of up to 500,000 barrels a day is now expected to be the discussion at OPEC+’s December 4 meeting, delegates said. Any output increase would mark a partial reversal of a controversial decision last month to cut production by 2 million barrels a day. This was agreed upon at the most recent meeting of the Organization of the Petroleum Exporting Countries and their Russia-led allies, a group known collectively as OPEC+.
The White House had said the production cut undermined global efforts to negatively impact Russia’s war in Ukraine. Saudi-U.S. relations have hit a low point over oil-production disagreements this year; if the December 4 OPEC+ meeting leads to increased oil, this may warm the cooled Saudi-U.S. relations.
About the EU December 5th Plan
The European Union has agreed to stop all oil imports from Russia on December 5. The plan is to cap the prices at which EU nations would buy oil from Russia, that price is expected to be near $60 per barrel. Russia has reacted by increasing exports to Asia, but the price cap is expected to reduce its exports and lower total supply by up to one million barrels per day.
About the OPEC+ December 4th Expectations
A production increase of up to 500,000 barrels a day is now under discussion for OPEC+’s December 4 meeting, emissaries said.
Any increase in OPEC+ output will partially undo the decision made at OPEC+’s its last monthly meeting. In October the cartel voted to cut production by 2 million barrels per day. The decision by the Organization of the Petroleum Exporting Countries and their Russia-led allies, (OPEC+) was a disappointment to the White House and NATO nations that saw reduced production as strengthening Russia’s ability to fund its war with higher priced exports.
Under normal production discussions by OPEC+ production increases, with oil prices falling more than 10% since the first week of November, one might not expect an increase. Brent crude traded at about $87 a barrel on Monday, while WTI, the U.S. benchmark, fell below $80 a barrel for the first time since September. Production increases could cause prices to fall further.
Emissaries say, a production increase would be to respond to expectations that oil consumption will rise in the winter. Oil demand is expected to increase by 1.69 million barrels a day to 101.3 million barrels a day in the first quarter next year, compared with the average level in 2022.
OPEC and its allies say they have been carefully studying the G-7 plans to impose a price cap on Russian oil, conceding privately that they see any such move by crude consumers to control the market as a threat. Russia has said it wouldn’t sell oil to any country participating in the price cap, potentially resulting in another effective production cut from Moscow—one of the world’s top three oil producers.
Raising oil production ahead of the December 5 EU embargo would give the Saudis another argument that they are acting in their own interests, and not is support of Russia’s.
Talk of the production increase emerged after the Biden administration told a federal court judge that Saudi Crown Prince Mohammed bin Salman should have sovereign immunity from a U.S. federal lawsuit related to the killing of Saudi journalist Jamal Khashoggi. The immunity decision is seen by some as a concession to Prince Mohammed, and heighten his standing as the kingdom’s de facto ruler. The move comes after the Biden administration tried for months to isolate him.
Another factor that helps account for the timing of OPEC+’s discussion to raise output is the two large OPEC members, Iraq and the United Arab Emirates that want to pump more oil. Both countries are pushing the oil-producing nations to allow them a higher daily-production ceiling, which would lead to more oil produced globally.
Saudi officials late Monday denied reports the kingdom is reversing course and helping the West with added production.
Dramatic Collapse of the Cryptocurrency Exchange FTX Contains Lessons for Investors but Won’t Affect Most People
In the fast-paced world of cryptocurrency, vast sums of money can be made or lost in the blink of an eye. In early November 2022, the second-largest cryptocurrency exchange, FTX, was valued at more than US$30 billion. By Nov. 14, FTX was in bankruptcy proceedings along with more than 100 companies connected to it. D. Brian Blank and Brandy Hadley are professors who study finance, investing and fintech. They explain how and why this incredible collapse happened, what effect it might have on the traditional financial sector and whether you need to care if you don’t own any cryptocurrency.
What Happened?
In 2019, Sam Bankman-Fried founded FTX, a company that ran one of the largest cryptocurrency exchanges.
FTX is where many crypto investors trade and hold their cryptocurrency, similar to the New York Stock Exchange for stocks. Bankman-Fried is also the founder of Alameda Research, a hedge fund that trades and invests in cryptocurrencies and crypto companies.
Sam Bankman-Fried founded both FTX and the investment firm Alameda Research. News sources have reported some less-than-responsible financial dealings between the two companies. Image via The Conversation.
Within the traditional financial sector, these two companies would be separate firms entirely or at least have divisions and firewalls in place between them. But in early November 2022, news outlets reported that a significant proportion of Alameda’s assets were a type of cryptocurrency released by FTX itself.
A few days later, news broke that FTX had allegedly been loaning customer assets to Alameda for risky trades without the consent of the customers and also issuing its own FTX cryptocurrency for Alameda to use as collateral. As a result, criminal and regulatory investigators began scrutinizing FTX for potentially violating securities law.
These two pieces of news basically led to a bank run on FTX.
Large crypto investors, like FTX’s competitor Binance, as well as individuals, began to sell off cryptocurrency held on FTX’s exchange. FTX quickly lost its ability to meet customer withdrawals and halted trading. On Nov. 14, FTX was also hit by an apparent insider hack and lost $600 million worth of cryptocurrency.
That same day, FTX, Alameda Research and 130 other affiliated companies founded by Bankman-Fried filed for bankruptcy. This action may leave more than a million suppliers, employees and investors who bought cryptocurrencies through the exchange or invested in these companies with no way to get their money back.
Among the groups and individuals who held currency on the FTX platform were many of the normal players in the crypto world, but a number of more traditional investment firms also held assets within FTX. Sequoia Capital, a venture capital firm, as well as the Ontario Teacher’s Pension, are estimated to have held millions of dollars of their investment portfolios in ownership stake of FTX. They have both already written off these investments with FTX as lost.
In traditional markets, corporations generally limit the risk they expose themselves to by maintaining liquidity and solvency. Liquidity is the ability of a firm to sell assets quickly without those assets losing much value. Solvency is the idea that a company’s assets are worth more than what that company owes to debtors and customers.
But the crypto world has generally operated with much less caution than the traditional financial sector, and FTX is no exception. About two-thirds of the money that FTX owed to the people who held cryptocurrency on its exchange – roughly $11.3 billion of $16 billion owed – was backed by illiquid coins created by FTX. FTX was taking its customers’ money, giving it to Alameda to make risky investments and then creating its own currency, known as FTT, as a replacement – cryptocurrency that it was unable to sell at a high enough price when it needed to.
In addition, nearly 40% of Alameda’s assets were in FTX’s own cryptocurrency – and remember, both companies were founded by the same person.
This all came to a head when investors decided to sell their coins on the exchange. FTX did not have enough liquid assets to meet those demands. This, in turn, drove the value of FTT from over $26 a coin at the beginning of November to under $2 by Nov. 13. By this point, FTX owed more money to its customers than it was worth.
In regulated exchanges, investing with customer funds is illegal. Additionally, auditors validate financial statements, and firms must publish the amount of money they hold in reserve that is available to fund customer withdrawals. And even if things go wrong, the Securities Investor Protection Corporation – or SIPC – protects depositors against the loss of investments from an exchange failure or financially troubled brokerage firm. None of these guardrails are in place within the crypto world.
Why is this a Big Deal in Crypto?
As a result of this meltdown, the company Binance is now considering creating an industry recovery fund – akin to a private version of SIPC insurance – to avoid future failures of crypto exchanges.
But while the collapse of FTX and Alameda – valued at more than $30 billion and now essentially worth nothing – is dramatic, the bigger implication is simply the potential lost trust in crypto. Bank runs are rare in traditional financial institutions, but they are increasingly common in the crypto space. Given that Bankman-Fried and FTX were seen as some of the biggest, most trusted figures in crypto, these events may lead more investors to think twice about putting money in crypto.
If I Don’t Own Crypto, Should I Care?
Though investment in cryptocurrencies has grown rapidly, the entire crypto market – valued at over $3 trillion at its peak – is much smaller than the $120 trillion traditional stock market.
While investors and regulators are still evaluating the consequences of this fall, the impact on any person who doesn’t personally own crypto will be minuscule. It is true that many larger investment funds, like BlackRock and the Ontario Teachers Pension, held investments in FTX, but the estimated $95 million the Ontario Teachers Pension lost through the collapse of FTX is just 0.05% of the entire fund’s investments.
The takeaway for most individuals is not to invest in unregulated markets without understanding the risks. In high-risk environments like crypto, it’s possible to lose everything – a lesson investors in FTX are learning the hard way.
This article was republished with permission from The Conversation, a news site dedicated to sharing ideas from academic experts. It represents the research-based findings and thoughts of D. Brian Blank, Assistant Professor of Finance, Mississippi State University and Brandy Hadley, Associate Professor of Finance and the David A. Thompson Professor in Applied Investments, Appalachian State University
Will the Fed Minutes on Wednesday Suggest the Fed Will Finally Back Off?
Fed Chair Jerome Powell said in a press conference after the last FOMC meeting that the committee has “some ways to go” on easing surging prices. Investors wondered what “some ways to go” equate to in terms of basis points. The markets will get more insight this week as minutes from that meeting will be released. This may be the most market-moving highlight of the week, but the stock and bond markets are closed on Thursday, November 24, and stock markets close at 2 PM EST on Friday, shortening this week’s cumulative trading sessions more than any other week during the year.
What’s on Tap for investors:
Monday 11/21
8:30 AM EST, Chicago Fed National Activity Index. The index is expected to be .10% with a three-month average of .17%. vs .10% last period. CFNAI is a monthly index that tracks overall economic activity and inflationary pressures. It’s a weighted average of 85 existing monthly indicators of national economic activity. Its benchmark average, by creation, is designed to be 0.00% and a standard deviation of one. Since economic activity tends toward trend growth over time, a positive index reading corresponds to growth above trend and a negative index reading corresponds to growth below trend.
Tuesday 11/22
10:00 AM EST, Richmond Fed’s Manufacturing Index had been trending lower with a reading of negative 10 last month. The consensus this week is for negative 1, which would be less negative than it has been.
11:00 AM EST, Loretta Mester, President Cleveland Fed, will speak. Last week she showed her continued hawkish stance saying the Fed is “just beginning to move into restrictive territory.” This suggests that it is Mester’s position that rates will have to be led much higher.
1:00 PM EST, Money Supply is expected to have shrunk $128 billion.
Wednesday 11/23
7:00 AM EST, Mortgage Applications. The purchase applications index measures applications at mortgage lenders. This is a leading indicator for single-family home sales and housing construction.
8:30 AM EST, Durable Goods Orders are seen as rising 0.3 percent in October following a 0.4 percent rise in September. Ex-transportation orders are seen inching 0.1 percent higher with core capital goods orders, which fell back in September by 0.4 percent, rising 0.2 percent.
8:30 AM EST, Jobless Claims for the prior week are expected to come in at 225,000 versus a steady 222,000 two weeks ago.
10 AM EST, New Home Sales have declined the last three months in a row. It is expected to come in at a 574,000 annualized rate in October versus 603,000 in September.
10 AM EST, Consumer Sentiment is expected to show a deeply depressed 55.0 versus 54.7 at mid-November. Consumer spending accounts for more than two-thirds of the economy, more during the holiday weeks. So the markets wantt to have a finger on their overall mood.
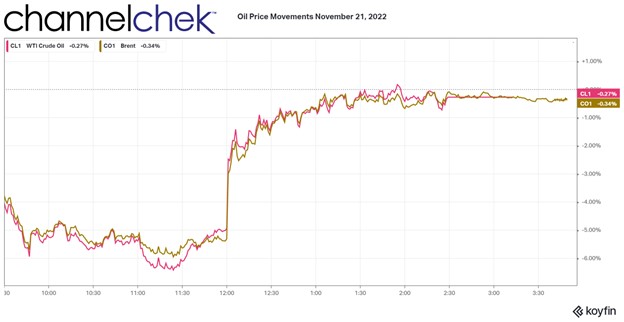
10:30 AM EST, EIA Petroleum Status Report. The Energy Information Administration (EIA) provides weekly information on petroleum inventories in the U.S., whether produced here or abroad. The level of inventories helps determine prices for petroleum products, this has been a big focus for investors because of its implications for prices.
12:00 PM EST, EIA Natural Gas Report. The Energy Information Administration (EIA) provides weekly information on natural gas inventories in the U.S., whether produced here or abroad.
2:00 PM EST, FOMC Minutes for November meeting. With just two more hours to trade before the Thanksgiving break, the FOMC minutes will be digested and reacted on quickly. It is not unusual to get a whipsaw market with such important releases in such a compressed time period.
Thursday 11/24
Image Credit: Marco Verch (Flickr)
Friday 11/25
The day after Thanksgiving is Black Friday in the U.S. It is named this because it is the day most retailers are consireded to have broken through to turn a profit. Market watchers view this day of intense shopping as a bellwether for the retail sector and overall consumer confidence. Recent retail earnings reports have been more mixed than usual with Target disappointing last week.
What Else
The last full week of November leads us to the last full month of 2022. There is still a strong push and pull between bulls and bear’s as the year comes to a close. The overall market is much cheaper than it began the year. At times like this, it is important to realize that there are always individual companies attaining above-average, positive performance. Channelchek is an excellent resource to explore and discover companies in the small and microcap space that are less reported on than other stocks that are more likely to follow market direction. Learn more.
If Cryptocurrency is not the Safe Haven it was Expected to Be, Will Assets Move Into Gold Investments?
In addition to any information discovered from Michael Burry’s 13F filing earlier this week, he’s been coming out in support of gold. He seems to expect that those that were seeking a “safe harbor investment” in various crypto-related investments are now having a change of mind. Despite his long positions held on September 30 and made public on November 14, he has teased that he could be extremely short the market; presumably, this could include any tradeable asset when you’re an investment analyst of this caliber.
Will Investors Rediscover Gold?
“Long thought that the time for gold would be when crypto scandals merge into contagion,” Burry wrote in a tweet this week.
@michaeljburry
The financial pressures spreading across the crypto industry that have helped destroy the crypto exchange FTX and exposed characters like Sam Bankman-Fried that may have been given too much trust, are causing reduced trust in digital assets.
Supporters and believers in the benefit of crypto had been using bitcoin and other tokens as a means of storage outside of securities. Their expectation has been that crypto is superior as a store of value during periods of inflation, currency depreciation, and economic turmoil.
Crypto prices have not offered much protection against plunging stock, bond, and real estate values. In fact, relative to the strong US dollar, crypto’s value has fallen off a cliff, offering no protection. The overall outstanding crypto worth has gone from $2.2 trillion to around $830 billion. Gold has not been rising during this period, but relative to US dollars, it is down only 3%.
Burry’s likely message is that the escalating cryptocurrency negatives will reduce demand for coins, yet demand for a safe haven asset would not be reduced. This could make gold again one of the only games in town for investors looking to protect against asset erosion.
Is Burry Short?
“You have no idea how short I am,” Burry said in a tweet this week.
@michaeljburry
He does not say he is short at all in this tweet. However, against the backdrop of many previous tweets warning against a market he believes will become more bearish, coupled with a holding report released that has five long holdings, the hedge fund manager of The Big Short fame is likely warning investors not to read too much positive into his fund’s holdings report. That report was released just before the tweet.
The value of long securities held in his roughly $292 million AUM was $41 million. As he demonstrated during the financial crisis, there are non-publicly reported ways to be short, even short beyond your AUM. Fund managers with assets over $100 million only have to disclose US-listed stocks in their 13F filings with the SEC each quarter. Excluded in the reporting are shares sold short, overseas-listed stocks, and other assets such as commodities.
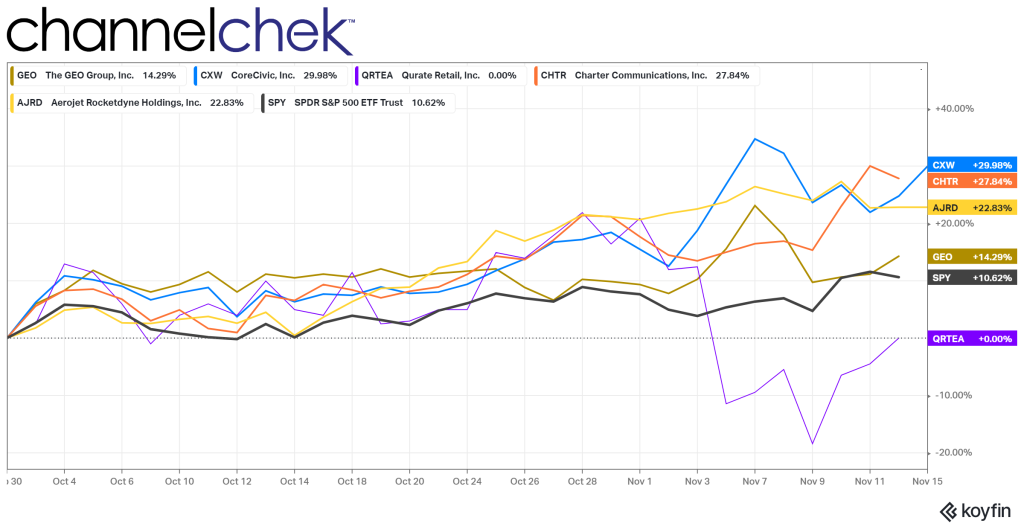
In actuality, Burry’s increased positions in prison stocks and exposure to the company involved in making Artemis’ rocket boosters is more likely a sign that he likes the prospects of some companies while at the same time doesn’t like the broader market outlook.
Positive Tweets
In addition to his positive tweet on gold, Burry has suggested the Federal Reserve’s interest-rate hikes, which have weighed on market prices, could end in the spring. This was reflected in his October 24 tweet “Still think the Fed back off on QT early next year.”
Investing in Gold
Investors that look to gain exposure to gold, will typically buy gold bullion, gold funds, gold futures, and the stocks of gold mining companies. All have unique advantages. Investors looking to research junior miners of gold and other precious metals and natural resources, find Channelchek as an excellent resource to discover and research many different unique, actionable possibilities. Start here.
Billions in Artemis Program Budget Could Cause these Companies to Rocket
What companies could gain from the Artemis missions to the moon?
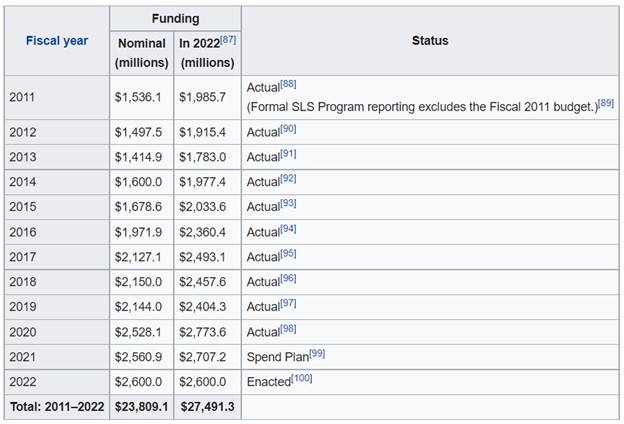
The multibillion-dollar Artemis program has been unfolding over the past several years. The most recent success is the 322-foot-tall Space Launch System (SLS), the most powerful rocket NASA has developed, and the Orion spacecraft. This is all designed to, in time, safely carry astronauts to the moon’s orbit and provide a platform for the U.S. to return to the moon’s surface for the first time since 1972.
The mission of Artemis One is to test a powerful NASA rocket called the Space Launch System, as well as the Orion spacecraft that the rocket will ferry into orbit. After the Florida launch, NASA plans to use the SLS rocket to direct Orion on a route around the moon, after which the vehicle’s crewless capsule will return to Earth and parachute into the Pacific Ocean. Those steps represent another trial geared toward ensuring the Orion crew module can safely bring astronauts back from orbit.
The initial mission will help set the stage for a crewed mission to the moon that NASA hopes to conduct as early as 2025. These efforts will entail higher technology and special equipment designed especially for a unique purpose. With billions being spent, investors may ask what companies may benefit. Obviously, the major contractors, then subcontractors and material suppliers.
The cost of SLS is shown above. Additionally, the cost to assemble, integrate, prepare and launch the SLS and its payloads are funded separately under Exploration Ground Systems, currently at about $600 million per year. (Source:Wikipedia)
Major Contractors
Keeping in mind that an unsuccessful launch could weigh on these companies, as much as they may be propelled by continued success, these are prime contractors. NASA’s prime contractors for the rock launch system is Aerojet Rocketdyne (AJRD), Boeing (NYSE: BA), and Northrop Grumman (NOC). As a note, AJRD showed up as one of 5 portfolio holdings of hedge fund manager Michael Burry.
Lockheed Martin (LMT) is the prime contractor on the Orion spacecraft, while NASA’s prime contractors for the rocket launch system include Redwire’s (RDW) critical sun sensor components and advanced optical imaging technologies, they will be launching on NASA’s Orion spacecraft as a part of the space agency’s Artemis One mission. Aeva Technologies (AEVA) is also involved with a LiDAR-based mobile terrain-mapping and navigation system for lunar and other planet exploration, while KULR Technology Group (KULR) has a battery safety contract with NASA to test its lithium-ion cells going into battery packs designed for the Artemis Program.
Raytheon Technologies'(RTX) was selected to advance spacewalking capabilities in low-Earth orbit and on the Moon. Goodyear Tire & Rubber (GT) has been contracted to develop tires to perform on the lunar surface.
Rocket Lab (RKLB) has been called upon to test new orbits around the moon. For communications, Lockheed Martin (LMT), Amazon (AMZN), and Cisco (CSCO) are working in conjunction to develop a new voice, AI, and tablet-based video technologies for use around the moon.
The companies being called upon is expected to grow rapidly after scientific experiments begin on the moon’s surface.
Scion Asset Management and Michael Burry Report Third Quarter Holdings
Four times a year, the quarter-end holdings of famous hedge fund manager Michael Burry become public through his firm’s required 13-F filing with the SEC. It’s newsworthy because people are interested in this iconic investor’s thinking. The list of 13-F securities is rarely more than a dozen positions and is just a one-day snapshot, but it can help one to understand his preferences and expectations.
The latest 13-F filing became public on Monday (November 14). It shows that he is not negative on all stocks, as he has built on his one position from the last reporting period, and added a few others. He clearly does not limit himself to only meg-cap companies. In fact two of his positions are small-cap stocks, one is a midcap, and one large cap.
Scion Asset Management’s Positions
His largest position is Geo Group (GEO) and represents 37.65% of the five. The shares represent 0.409% of GEO’s outstanding stock or 501,360 shares. The average price was listed as $6.42 per share.
The quarter-end market value of Scion’s GEO position was $3,309,000 consisting of 501,360 shares. This represents 0.4092% of the company. According to Scion’s Form ADV, filed on April 18, 2022, Scion had assets under management of $291,659,289. The GEO position is not likely a significant portion of his entire portfolio, but it represents more than a third of the firm’s 13F reportable securities.
Michael Burry first reported owning GEO Group during the fourth quarter of 2020. It’s a unique company, which may be positioned to take advantage of changes in the U.S. and internationally.
The GEO Group, based out of Boca Raton, FL, specializes in owning’ leasing, and managing secure confinement facilities, processing centers, and reentry facilities in the United States and globally. In addition to owning and operating secure and community facilities, GEO provides compliance technologies, monitoring services, and supervision and treatment programs for community-based parolees, probationers, and pretrial defendants.
For the year ended December 31, 2021, The GEO Group generated approximately 66% of its revenues from the U.S. Secure Services business, 24% from its GEO Care segment, and 10% of revenue from its International Services segment.
Gomes confirmed his earlier price target of $15.00 and reported solid operating results during the third quarter.
Scion’s third largest position is mentioned second because it also provides for correctional facilities and ancillary service, it is CoreCivic Inc. (CXW). CoreCivic is a private detention facility with three segments, CoreCivic Safety, CoreCivic Community, and CoreCivic Properties. It provides a broad range of solutions to governments with corrections and detention management, a growing network of residential reentry centers to help address America’s recidivism crisis, and government real estate solutions.
In his November 4 research report on CXW Joe Gomes pointed to the excess capacity of CXW, indicating that much of that could soon be utilized as covid restrictions loosen. Corecivic has ample excess capacity from which to add to their bottom line under improving conditions.
Burry’s second largest 13-F holding is Qurante Retail Group, Inc. (QRTEA). The company is involved in video online commerce and owns the well-known HSN (Home Shopping Network) and QVC shopping network. Its segments market and sell a wide variety of consumer products in the United States, primarily using its televised shopping programs and via the Internet through their websites and mobile applications; QVC International segment markets and sells a wide variety of consumer products in several foreign countries, primarily using its televised shopping programs and via the Internet through its international websites and mobile applications; and Zulily markets and sells a wide variety of consumer products in the United States and several foreign countries. Its geographical segments include the United States, Japan, Germany, and Other countries.
Aerojet Rocketdyne Holdings, Inc. (AJRD) is a midcap company that is Scion’s fourth largest holding. It designs, develops, manufactures, and sells aerospace and defense products and systems in the United States. It operates in two segments, Aerospace and Defense and Real Estate. The Aerospace and Defense segment offers aerospace and defense products and systems for the United States government, including the Department of Defense, the National Aeronautics and Space Administration, and aerospace and defense prime contractors. This segment provides liquid and solid rocket propulsion systems, air-breathing hypersonic engines, and electric power and propulsion systems for space, defense, civil, and commercial applications, and armament systems. The Real Estate segment engages in the re-zoning, entitlement, sale, and leasing of the company’s excess real estate assets. It owns 11,277 acres of land adjacent to the United States Highway 50 between Rancho Cordova and Folsom, California, east of Sacramento. The company was formerly known as GenCorp Inc. and changed its name to Aerojet Rocketdyne Holdings, Inc. in April 2015. Aerojet Rocketdyne Holdings, Inc. was incorporated in 1915 and is headquartered in El Segundo, California.
Burry’s smallest holding is the largest company. As the only large-cap stock of the five, Charter Communications, Inc. (CHTR) operates as a broadband connectivity and cable operator serving residential and commercial customers in the US. The company offers subscription-based video services, video on demand, high-def TV, DVR, and pay-per-view. It also has Web-based service management and sells local advertising across various platforms for networks, such as TBS, CNN, and ESPN to local sports and news channels.
Take Away
Michael Burry’s 13F filing for the third quarter showed two of his top three holdings are privately held correctional facilities that had relied on government contracts. The lifting of covid restrictions may help bolster future profits. Along with Aerojet, his fourth-largest position, GEO and Corecivic own real estate. Could this be part of Burry’s attraction?
The TV shopping channels owned by Qurante seem obscure, but the defense company Aerojet Rocketdyne should come as no surprise in a world that is moving more militarily and Space Force is gearing up.
If you have not already signed up to receive email from Channelchek with up-to-the-minute research reports on companies like GEO Group and Corecivic, along with insightful articles, sign-up here.
There is Potential for a Change in Sentiment Spurred by this Week’s Wholesale Inflation Report
One economic number doesn’t make a trend. The members of the Federal Open Market Committee know this, and certainly, the Chair, Jay Powell, understands. As it relates to last week’s CPI report, he may wish that one lower-than-expected inflation data point could prevent him from needing to do more, but it simply isn’t enough info from which the Fed can glean any actionable information.
As we head into the first trading session of a new week, it’s uncertain what the reaction of interest rates will be. They dropped substantially in response to last Thursday’s inflation data coming in better than expected. However, there was no chance of follow-through or reversal as Friday’s Veteran’s Day holiday left the bond markets closed.
With this, inflation numbers continue to be the most significant for both stock and bond investors. On this coming Tuesday, November 15, wholesale prices will be reported as the Producer Price Index (PPI). This release could have more weight in trade action than usual.
Thursday is another big day on the calendar as the markets will be grappling with a larger-than-normal volume of economic releases.
Monday 11/14
11:00 AM ET, The NY Federal Reserve Bank’s one and five-year inflation forecast. This is not an event that is usually paid much attention to by market participants. However, considering there are many parties interested in what members of the Federal Reserve System are now thinking, a dramatic shift from the previous forecast could inspire the financial markets to adjust accordingly.
Previously the one-year inflation expectation was 5.7%. The five-year inflation forecast was 2.2%.
Tuesday 10/15
8:30 AM ET, The Producer Price Index (PPI) from the Bureau of Labor Statistics (BLS) is an inflation gauge that measures the average change over time in the prices received by U.S. producers of goods and services. The prices are typically considered input costs for final products and can impact CPI, it may also impact company costs of production and, therefore, profits. The trend has been lower, YOY PPI has been running at 8.5%, and last month, it rose 0.4%, the expectation is for another 0.4% increase.
Michael Burry, and Warren Buffet’s holdings. The SEC requires investment funds to file a 13-f disclosing their publicly traded security positions. It is required every 45 days, making all of the information a minimum of 45 days old. Looking at a successful investor’s 13F filings can be revealing, especially when looking at industries they’ve been hot on or comparing one holding period to another.
Wednesday 10/16
11:00 AM ET, The Mortgage Bankers Association (MBA) creates a statistic from several mortgage loan indexes. The Mortgage Applications index measures applications at mortgage lenders. It’s considered a leading indicator and is especially important for single-family home sales and housing construction. Both are considered foundational in a strong economy. Last week the Purchase Index was 162.6.
11:00 AM ET, The Mortgage Bankers Association (MBA) also provides an average 30-year mortgage level which is consistently calculated so that it is an oranges-to-oranges comparison from previous periods. Last period the rate was 7.14%.
12:30 PM ET, Export Prices (MoM), this data set reflects changes in prices of goods and services that are produced in and exported from the United States in the given month compared to the previous one. Last reading, this came in at a negative 0.8%.
12:30 PM ET, Import Prices (MoM) The import price index m/m measures the price changes of the respective month compared to the previous month. Last month they fell 1.2% (not adjusted for fx), this month, expectations are for a decline of 0.5%.
12:30 PM ET, U.S. Retail Sales have been flat, neither rising nor falling. As we head toward Thanksgiving and Black Friday sales levels, the market will be taking more and more interest in how strong the consumer is. Expectations for October are for a rise of 0.8 percent overall, an increase from 0.0 percent. When excluding vehicles, the projection is for an increase of 0.4%, up from 0.1%. and up 0.4 when also excluding gasoline.
1:15 PM ET, Capacity Utilization is expected to remain unchanged at an 80.3% use of available manufacturing capacity. Reading well above, this may be considered inflationary as production could be using less efficient means.
1:15 PM ET, Industrial Production is expected to have been weaker at a 0.2% increase compared to a 0.4% increase.
2:00 PM ET, NAHB Housing Market Index this is expected to continue weakening, the October number was 38.
2:00 PM ET, Business inventories are expressed in dollar value held by manufacturers, wholesalers, and retailers. The level of inventories in relation to sales is an important indicator of the near-term direction of production activity. Rising inventories can be an indication of business optimism that sales will be growing in the coming months. However, if unintended inventory accumulation occurs, then production will probably have to slow while those inventories are worked off. Last month’s inventories increased by 0.8%.
Thursday 10/17
12:30 PM ET, Housing Starts, last month housing starts had declined for the seventh consecutive month by 8.7%.
Friday 10/18
2:00 PM ET, Leading Economic Indicators are expected to show a decline of 0.3% vs. a decline of 0.4% the prior month.
What Else
The focus on signs of economic weakness or receding inflation will be high, and reactions may be extra sensitive. The following week is shortened in terms of trading. The focus will be on how strong the consumer shows they will be for the holidays.