A Huge Turnaround for Marijuana Stocks This Week

Recapping the Cannabis Rally

In the U.S., Marijuana stocks have reawakened and have been enjoying investor attention. The last week in August has been one of their best since March 2020. The driver behind the surge in investor interest is the prospect of a significant shift in the regulatory landscape resulting from a potential reclassification of cannabis by the U.S. Drug Enforcement Administration (DEA). This development has provided optimism throughout the industry, causing notable gains in various cannabis stocks.

High Week for Marijuana Investors

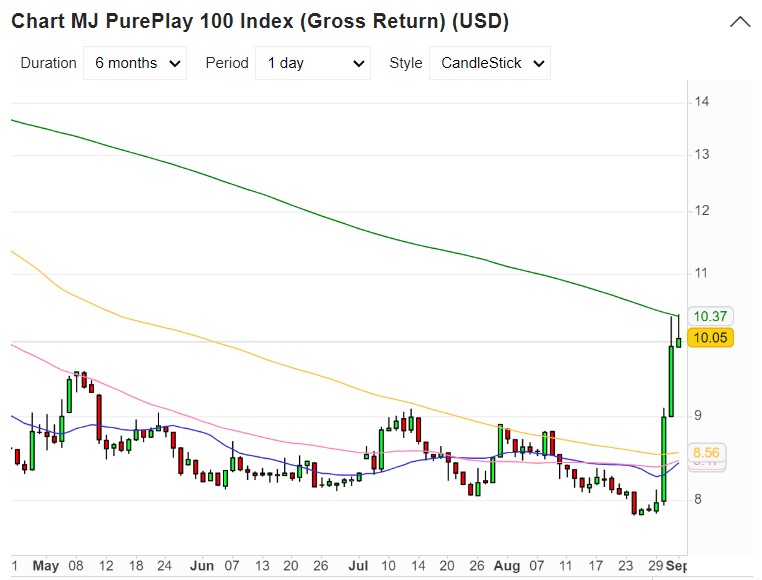
The M.J. PurePlay 100 Index soared by as much as 4.6% at the open on September 1, extending its weekly gain to an impressive 29%. This performance marks the best stretch for the index since March 2020. Similarly a benchmark Cannabis ETF, known by its ticker WEED, enjoyed an extraordinary surge, reaching an all-time high with gains of 45% for the week.

A Shifting Regulatory Landscape

The week brought unexpected excitement as the industry had begun to feel forgotten about. Then, surprisingly, Assistant Secretary for Health Rachel Levine made a groundbreaking recommendation that cannabis be reclassified as a Schedule III drug under the Controlled Substances Act. This strong support immediately drove up the industrys’ stocks as investors look to capitalize on the potential implications.

It then got even better for investors. A more pronounced turning point started when the DEA confirmed its intention to review the current classification of cannabis. This has been anticipated for years, and has not occurred.

For years, the classification of marijuana as a Schedule I drug, placing it alongside substances like heroin and LSD, has posed a significant challenge to the cannabis industry. This categorization has created hurdles for cannabis companies, particularly in their ability to access essential financial services due to conflicting federal laws.

Possible Investor Benefits

Reduced Regulatory Risk: If cannabis is reclassified as a Schedule III drug, it could significantly lower the regulatory risk associated with the industry. This shift would alleviate some of the financial obstacles that cannabis companies face under current federal law.

Take a moment to learn more about Schwazze, a leading vertically integrated cannabis holding company with a portfolio consisting of top-tier licensed brands spanning cultivation, extraction, infused-product manufacturing, dispensary operations, consulting, and a nutrient line.

Click here for company information, including equity research from Noble Capital Markets.

Banking Services: The reclassification could incentivize more banks and financial institutions to offer traditional banking services to cannabis companies, reducing their reliance on cash transactions and enhancing financial stability.

Research Opportunities: A Schedule III rating would facilitate more comprehensive research on cannabis, potentially leading to its removal from the controlled-substance category in the future. This could open doors to groundbreaking discoveries and innovations within the cannabis sector.

Tax Benefits: A change in classification may lead to the removal of certain tax credit and deduction bans for marijuana businesses, providing financial relief and potentially boosting profitability for the industry.

However, it’s important to note that despite these positives, the cannabis industry may still require additional regulatory clarity. The SAFE Banking Act, aims to address some marijuana stumbling blocks and issues by providing legitamate cannabis businesses with access to banking services. To ensure a smooth transition, further guidance may be necessary to ensure compliance with federal anti-money laundering statutes and other applicable laws.

Take Away

The reawakening of marijuana stocks this week reflects the industry’s growing optimism surrounding the potential reclassification of cannabis by the DEA. This transformative development could have far-reaching implications, ranging from reduced regulatory risks and tax benefits to improved access to banking services and expanded research opportunities. However, investors should stay up to date and informed as the regulatory landscape evolves, keeping a close eye on legislative developments and industry trends to make informed investment decisions. Part of that vigilance could include updates from Channelchek in your email each day by obtaining a free subscription here.

Paul Hoffman

Managing Editor, Channelchek

Sources

https://www.marketscreener.com/quote/index/MJ-PUREPLAY-100-INDEX-GRO-56414425/

Can Oil and Energy Continue the Trend Begun in Late August?

Drivers Impacting Oil Now and in the Weeks Ahead

Oil prices are near flat on the month but have recently been rising. Meanwhile, the energy sector itself, relative to the overall market, is outperforming in a way that is getting attention as we move to September. Are the drivers of performance solidly in place to keep crude oil prices strong? Will the energy sector continue to benefit from factors impacting oil? We lay out factors impacting future price movements below.

Source: Koyfin

What’s Impacting Oil

Credit for the recent strength in oil has been given in part to the Saudi Arabian production cuts that began in July when the Saudi’s voluntarily lowered production by one million barrels a day starting in July. This quickly strengthened prices, which then fell off as concerns over China’s weakening economy, and global economies in general, grew. China is the world’s second-largest consumer of crude oil.

The U.S. has seen strong economic reports recently. The market is still reacting poorly to “good” news. This reaction also played into the direction of stocks and commodity prices. U.S. economic activity readings raised expectations for further monetary policy tightening by the Federal Reserve. The idea of heightened activity lifted U.S. Treasury yields and, along with them, the U.S. dollar. During the last week in August, weaker U.S. labor data served to ease some of the rise in yields.  

Adding to the strength, this week, the Energy Information Administration (EIA) on Wednesday reported that U.S. commercial crude inventories fell by 10.6 million barrels for the week ending Aug. 25. That was the third straight weekly decline reported by the agency and the largest since the week ended July 28. U.S. commercial crude inventories have fallen by almost 34 million barrels over the past five weeks.

Inventories are now only 1.1% higher than the same week last year, even with over 100 million barrels having been released from the U.S. Strategic Petroleum Reserve during the 12 months.

A reversal to the upside after crude fell last week below support at $78 a barrel also coincided with the formation of what technicians refer to as a golden cross, this is when the 50-day moving average crosses above the 200-day moving average from below. This got the attention of commodity traders.

Source: EIA

Overall, the price paid per barrel of oil has been range-bound through 2023. The extended production cuts by Saudi Arabia and Russia were largely offset by fears about China’s economy flailing; it had been expected it would rebound strongly after pandemic lockdowns were lifted. Oil consumption did not rise as expected.

Source: EIA

There is also increasing indications the United States is relaxing sanctions on crude exports from Iran and Venezuela to keep prices from rising too much and in exchange for diplomatic objectives. The U.S. is the number one oil consumer.

Given still low inventories and a need to replenish the U.S. Strategic Oil Reserves there are market participants that remain bullish on oil prices and the energy sector. There are others that are more cautious, despite Saudi production cuts, as the chart above indicates, consumption recently fell below the level of production.

Take Away

Oil prices have been in a tight range all year. Better stock market performance from energy producers has in part been because of easing of rules concerning fossil fuels, and headway made on green energy projects. Consumption will increase and fall based on economic activity. Where the U.S. economy and global economy are headed is faced with more cross-currents than usual. Added supply to the U.S. may come from countries we don’t currently trade with. Those spigots can not be turned on quickly. This leaves oil and energy with a current trend upward but challenges down the road.

Paul Hoffman

Managing Editor, Channelchek

Sources

https://www.reuters.com/markets/commodities/crude-oil-prices-stalled-hedge-funds-sold-kemp-2023-08-29/

https://www.eia.gov/pressroom/releases.php

https://www.marketwatch.com/story/oil-edges-higher-as-bulls-attempt-to-salvage-monthly-gain-b12b6b8d?mod=hp_LATEST

Heightened Anticipation in Cannabis Industry

U.S. Department of Health Recommends Marijuana Reclassification – Boosts Cannabis Stocks

A letter with far-reaching implications for the cannabis industry has prompted double-digit gains for companies in the marijuana industry, both large and small. Making further headway toward a less restrictive federal government, the U.S. Department of Health and Human Services (HHS) has taken another step in reshaping the legal landscape of cannabis in the United States. In the latest move, as reported by Bloomberg News, the HHS has urged for the relaxation of restrictions on marijuana, this marks a potential turning point for the developing cannabis industry.

A Letter with Far-Reaching Implications

The letter written by U.S. Assistant Secretary for Health, Rachel Levine, to Anne Milgram, the Administrator of the Drug Enforcement Administration (DEA), has heightened anticipation for meaningful changes in marijuana’s classification. Currently categorized as a Schedule I drug under the Controlled Substances Act, marijuana’s potential reclassification to Schedule III, as proposed by Levine, could have far-reaching implications.

Divergent State Laws and Federal Stance

The ongoing contradiction between federal and state marijuana laws has long posed challenges for both cannabis businesses and users. Although around 40 U.S. states have embraced various forms of marijuana legalization, the federal stance remains staunchly prohibitive, creating a perplexing legal labyrin

A Presidential Push for Review

The DEA’s confirmation of receiving the HHS letter aligns with President Joe Biden’s call for a comprehensive review of marijuana’s classification. The administration’s objective to base its decisions on evidence and expert evaluations underscores a commitment to an impartial and well-informed process.

White House spokesperson Karine Jean-Pierre emphasized, “The administration’s process is an independent process led by HHS, led by the Department of Justice and guided by evidence … we will let that process move forward.”

Market Reaction and Future Prospects

The market response to this potentially pivotal development is what one might expect. Medicine Man Technologies, operating under the name Schwazze (SHWZ) is a vertically integrated cannabis company with roots in Colorado. Schwazze stock price jumped 18% on the news. Jushi (JUSHF) is a premium brand provider of cannabis products operating in Florida, Ohio, and Colorado. Jushi Holdings Inc. rose 34% once word of the letter spread through the markets. Charlottes Web (CWBHF), another Colorado-based company involved in farming, manufacturing, marketing, and selling hemp-derived cannabidiol (CBD) wellness products, was lifted by more than 12%.

Take a moment to learn more about Schwazze, a leading vertically integrated cannabis holding company with a portfolio consisting of top-tier licensed brands spanning cultivation, extraction, infused-product manufacturing, dispensary operations, consulting, and a nutrient line.

Click here for company information, including equity research from Noble Capital Markets.

The sharp reaction reflects tangible market optimism regarding the potential reshaping of the legal framework surrounding cannabis.

DEA’s Next Steps

The DEA, wields the final authority to determine drug scheduling under the Controlled Substances Act, it is set to initiate a comprehensive review process. HHS’s scientific and medical evaluation will serve as a crucial input in this review, potentially leading to a revision in marijuana’s classification.

Awaiting Further Insights

As this significant reevaluation unfolds, industry stakeholders, advocates, and the general public await further insights into the potential impacts of any regulatory shift. The eventual outcome could mark a defining moment in the trajectory of cannabis legalization, and ability for companies in the industry to have all the advantages non-marijuana companies enjoy.  

The evolving dynamics in the cannabis sector warrant close observation by interested investors as the regulatory landscape continues to transform.

Paul Hoffman

Managing Editor, Channelchek

Source

https://www.reuters.com/business/healthcare-pharmaceuticals/hhs-official-calls-move-marijuana-lower-risk-drug-category-bloomberg-news-2023-08-30/

Investor Opportunity in Lithium Stocks Seems to Be Increasing

Why Small Lithium Developers and  Producers May Become Stars By Mid-Decade

Lithium demand isn’t going away; in fact, it is likely to skyrocket. While most people link future EV sales forecasts with Lithium-ion battery growth, the increased use of li-ion batteries goes well beyond electric vehicle production. Some highly regarded analysts are now predicting a difficult lithium deficit as early as 2025. If demand outstrips supply that quickly, prices of the mineral will be under extreme upward pressure. If the accelerating demand unfolds as expected, investors looking to get ahead of the curve may want to increase their exposure to lithium investments soon. Below is a background on current forecasts and ideas to explore.

Background

The Fitch subsidiary, Business Monitor International (BMI), is a research unit of the parent company best known for its rating service. BMI has a team of over 300 analysts who specialize in a variety of industries, including energy, mining, and technology. The company’s research is used by businesses to make informed decisions about their operations. BMI now estimates that China’s lithium demand for EVs will grow by an average of 20.4% each year between 2023 and 2032. However, current estimates for the country’s lithium output are only expected to grow by 6% over the same period. This means that China will need to import massive amounts of lithium just to meet its growth in EV production.

At the same time, the global demand for lithium is also expected to grow significantly. Some informed projections are that global demand for lithium will reach over 3 million metric tons (tonne) by 2030. As a comparison, this is up from 540,000 metric tons in 2021.

There are currently just 101 lithium mines in the world, and many of these mining operations are nearing the end of their lifespan. In addition, the permitting process for new lithium mines can be lengthy and complex. This is slowing the development of new lithium production facilities. Consequently, the growing demand for lithium, which is already seen as straining global supply, may become substantially more challenging over the next 18 months.

More demand relative to supply is the most basic recipe for higher prices. As a result of the supply constraints, lithium prices are expected to remain high in the coming years. Lithium carbonate prices surged to a record of almost 600,000 yuan per tonne in November 2022.

Source: Google Finance

The EV industry is working to address the lithium supply deficit, but it is the producers that are working to be more efficient and productive. Some companies are developing new ways to extract lithium from brines, which are salty water bodies that contain lithium. Other companies are working to recycle lithium-ion batteries. However, lithium is a finite resource, and an approaching supply deficit shows no signs of being fixed soon. In the meantime the EV industry and others will compete for what is what is being produced, which could drive up prices.  

What This Means for Investors

Investors who are interested in the lithium market should take note of the projections for the growing supply/demand imbalance. Lithium mining companies, especially smaller pure-plays on the demand for lithium, may have the highest percentage benefit from higher prices. Three such companies are listed below with links to further information and data relevant to the company.

Century Lithium Corp. (LCE:CA) is a Canadian-based advanced-stage lithium Company, focused on developing its 100%-owned Clayton Valley Lithium Project in the U.S. (Nevada). Century Lithium is actively testing material from its lithium-bearing claystone deposit at its Lithium Extraction Facility while moving toward the completion of a Feasibility Study, with the goal to become a domestic producer of lithium for the growing electric vehicle and battery storage market.

Mark Reichamn, Noble Capital Markets senior research analyst for natural resources, published a research note explaining a collaboration between Century Lithium and Koch Technology Solutions (KTS) where lithium is being recovered from leach solution.

Noble rates the shares of Century Lithium Corp. as outperform.

LithiumBank Resources Corp. (LBNKF) is an exploration and development company focused on lithium-enriched brine projects in Western Canada where low-carbon-impact, rapid DLE technology is used. LithiumBank currently holds over 3.77 million acres of mineral titles, 3.44M acres in Alberta and 326K acres in Saskatchewan. LithiumBank is advancing and de-risking several projects in parallel of the Boardwalk Lithium Brine Project.

Mark Reichman, of Noble Capital Markets put out a research note this month explaining LithiumBank’s reasons for selling three of its projects.

Noble rates the shares of Century Lithium Corp. as outperform.

Piedmont Lithium Inc, (PLL) is a lithium-based company focused on the development of its Piedmont Lithium Project located within the Carolina TinSpodumene Belt (”TSB”) and along trend to the Hallman Beam and Kings Mountain mines.

Piedmont has been in the news recently for having received a partial prepayment of $31.6 million for the sale of 15,000 dry metric tonnes of lithium concentrate under its offtake deal with North American Lithium (NAL). According to news reported by Reuters, its CEO Keith Phillips expects sales from Piedmont shipments to help fund strategic initiatives while reducing the company’s need to raise capital in the equity markets. Piedmont said the prepayment increased its cash position to about $100 million.

A video discussion with Piedmont’s CEO Keith Phillips taken in March 2023 as part of Channelchek’s Takeaway Series is a great way to become familiar with the projects and strategies this “Made in the USA” lithium developer is involved with.  

Take Away

A lithium supply deficit is expected to emerge as early as 2025, according to analysts at BMI. The deficit is being driven by the growing demand for lithium-ion batteries for electric vehicles. Investors who are looking to understand the plans of small lithium developers and producers should visit the Company Data / Quotes tab on Channelchek and use the search bars to begin exploring.

Paul Hoffman

Managing Editor, Channelchek

Sources:

https://www.reuters.com/markets/commodities/piedmont-lithium-receives-first-payment-nal-shipment-2023-08-29/

https://www.cnbc.com/2023/08/29/a-worldwide-lithium-shortage-could-come-as-soon-as-2025.html

Newer Traders Have A Lot Going For Them; That Could Be a Problem

Deciding if Buy and Hold or Trading is Best for You?

New investors today have powerful tools that may exceed what was available even at institutions just a decade ago. This provides a leg-up on those of us who had to cover high trading fees, buy and sell, before we made a dime. Then, there is today’s information availability. Stock prices were printed in the morning from the day before close; that is how investors were updated. Then there is all the other up-to-the-minute information from your broker and company data and research from platforms like Channelchek and others.  

This can be both helpful and overwhelming to a new investor deciding where to focus and what type of investment style suits them. 

The least expensive discount brokers, when I bought my very first hundred shares cost $100 in and $100 out ($200 round trip). So exceeding two dollars per share on each round lot (orders not in lots of 100 cost more) was necessary to break even. Between this and the non-current price information, a buy-and-hold position was the only position that made much sense.

Now, transacting is just point-and-shoot. Even bid versus ask spreads are minuscule. This makes it more practical for an investor to decide not to ride out a perceived slide even if they have confidence that it will reverse later. Instead, with the ability to unload before an expected trouble spot develops, an investor that waits instead, may become angry with themselves that they held and their account value has declined.  

Today’s set of circumstances has a lot more investors acting like traders and trying to time the market. The tolerance for seeing a holding is up, say 6% over a period of time, only to be down 2% over a longer period, then up 7% down the road is much more rare. Newer investors don’t have as much price swing tolerance, they want to take a profit before the market drops. Some then expect as much as a 20% dip that they can buy back into.

Of course, hitting the near tops and low points to maximize profit is unlikely. And trying to do it usually leads to frustration from missed opportunity when it doesn’t then move in the direction that would benefit the trader.

So is it prudent to try to time price moves up and down and trade the shares, to take advantage of so much information? Or, should they do research, find companies they expect will do well, and then look for a good entry point, not even thinking about an exit unless it begins to behave outside of expectations?

This is particularly relevant in a year where the market is up above average, which means if it gravitates back to its mean average annual return, the overall market will end the year lower than it is now.  

There is no one simple answer, but a practical approach is to have core holdings to take the long ride with, and then view other stocks separately that maybe move a little faster, up and down, that are for  timing moves. This leads to diversification in holding periods. But, in order to work, one has to not forget or give up on the individual strategies of the two investment styles that are to be thought of separately, perhaps even in two different accounts.

But when does one sell from the buy-and-hold portion, is there a trigger? And what is the trigger with the assets in the trading portion?

The same idea could apply to both sets of assets. Set the parameters for every trade and stick to them. Take a profit or a loss when the parameter is met, regardless of what you may feel at that time. Good decisions and “if-this, then-that” thinking is best when not in the heat of battle. Plan your trade and trade your plan regardless. In some cases it may have worked out better if you had acted differently than planned, but if it is based on realistic expectations or probabilities, then chances are, over the years it will reap greater rewards.

This ongoing reassessment, regardless of expected holding time,  has the investor set levels, both above and below a stock’s current price, that, when struck causes the investor to evaluate. That evaluation may simply be asking oneself has anything changed since I set this parameter? If not, act. It may also be asking oneself, is this the best use of my capital right now, or is there a better place that I believe has the potential to outperform the current holding?

Take Away

An investment portfolio plan with meaningful rules to follow helps reduce the anxiety of investing. Whether 90% is earmarked buy-and-hold, or 90% is to achieve short-term gains and avoid big drawdowns, the trades must be managed to a pre-thought-out sensible plan. The expectation then is that none of the positions will work out perfectly timed, but as a whole, over a long enough period, the investor will be better off than if they had no guidelines or fewer boundaries.

Paul Hoffman

Managing Editor, Channechek

Hurricane Damage at the Individual Stock and Industry Level

Image Credit: Darryl Kenyon (Flickr)

Avoiding a Hurricane May Mean Adjusting Your Portfolio

Like most people that live in Florida, I usually first learn of approaching hurricanes from concerned family members up North. My reaction is probably different than others. My first thoughts on rare news events is to ask myself, “is this bullish or bearish?” When it comes to hurricanes, there is an answer – like most events that impact stocks, the answer is, “it depends.” Getting out of the way of a hurricane could also mean a slight adjustment to holdings.

I will mention that the toll on life and property of natural disasters, or any travesty, is not lost on me. But as investors, we must control the risks that we can and look for the rainbow in situations we have no control over.

Economic Damage

Dubravko Lakos-Bujas, JP Morgan’s head of U.S. equity and quantitative strategy, shared insights on the economic impact of hurricanes a couple of years before hurricane Ian struck Naples Florida. But the value of the information has not changed. “Major U.S. hurricane landfalls have had less significant impact on aggregate market performance (~2% decline) given the subsequent pick-up in disaster-induced public and private spending,” Mr. Lakos-Bujas said. “The most significant impact on equity performance is seen at the stock and sub-industry level.”

Money May Grow on Trees

Does your portfolio contain Orange Growers? Gulf Coast REITS? Companies that operate in the affected area of the storm see a loss in production as they close up and, at the same time, a jump in costs as they make repairs. These stocks are most likely to underperform. For those companies in the repair business, for example, lumber and roofing supplies, they could generate business whether a storm actually makes landfall or not. The rebuilding effort will cost insurance companies with a concentration of insured properties in the path of a storm.

Lakos-Bujas warned, “The underperformance should be concentrated in insurance (i.e. property loss coverage), and companies with Hotels, Restaurants, Leisure, & Airlines (i.e. based on occupancy/traffic, rising commodity costs), Telecom and Cable (i.e. capital expenditure tied to repair and potentially lower revenue per unit), and Industrials (i.e. rising input costs, disruption in production and transportation) depending on geographic footprint.”

Solutions tend to gravitate toward problems, even if those problems include damage and destruction. This is a good thing, it is capitalism working in a way that helps others. This help is profitable and could make some sectors outperformers. “The largest outperformers include industries tied to replacing and/or repairing existing capital stock (i.e. Energy Equipment & Services, Communication Equipment, Autos), transportation and logistics (i.e. Distribution, Air Freight, Trading Companies), and construction (Basic Materials and Engineering),” Lakos-Bujas’ said.

The analysis of the JP Morgan equity strategist is based on a study of 31 hurricanes between 1965 and 2014, which had a combined cost of $520 billion. Two o the large storms, Irma and Harvey, represent a high percentage of the total cost.

“Based on current unofficial damage estimates for hurricanes Harvey and Irma, losses this year are expected to exceed 50% of combined costs over the last 50 years,” he said. “These outsized losses could currently drive more pronounced moves at the stock and sub-industry levels than historically.”

So, a person may live across the country or around the globe from the storm and still feel an impact. For historical context, the S&P 500 (^GSPC) has seen an average decline of 2% in the week following a hurricane’s passing.

Rebuilding Benefits Stockholdings Differently

Much of the backstop in the economy and the markets is based on the idea that rebuilding after a storm is stimulative. Households and businesses suddenly jam work that needed to be done into a short time span and spend much more on what could’ve been routine maintenance. Economists say that the near-term impact on GDP is a net positive once the hurricanes pass. A lasting positive impact occurs if a natural disaster brings about rebuilding that improves on the existing structures or facilities instead of just restoring them to their previous state.”

One caveat is that labor markets have been tight. Most other years, roofers and builders flocked to the highest bidders and the flow of money helped speed the rebuilding process. If there are currently not sufficient human resources, this will push costs up more than they otherwise would have. Unfortunately, there continue to be reports of labor shortages in many industries, including construction. Fox Business News reported on August 28, 2023, “America’s shortage of skilled workers is impacting the ability of businesses in the construction and manufacturing industries to staff their businesses and complete jobs on time.” This situation could certainly slow any needed rebuild.

As wildfires in Hawaii have shown us, funds for rebuilding efforts are further complicated by politics. Three of the Floridian candidates for president, including the governor, are from a party that is not in power

Take Away

Opportunity comes in all forms. This includes opportunity to avoid a dip in some of your holdings, and an opportunity to capitalize on increased company profits this includes disasters of all types. Weather events can impact stock performance of individual companies and industry subsets. At roughly a negative 2% average, the overall market could impact investors over the following 30 days at a rate that feels like normal monthly swings.

As a positive thought, after the storm clears, come join Channelchek, Noble Capital Markets and an expected 150 public companies companies all converging on South Florida in early December for NobleCon19, the investment conference where you’ll discover actionable investment ideas inspired directly from company management. Learn more here.

Paul Hoffman

Managing Editor, Channelchek

Sources

https://www.wtwco.com/en-us/insights/2023/08/how-is-labor-shortage-impacting-the-construction-industry

https://www.foxbusiness.com/economy/americas-skilled-worker-shortage-impacting-construction-manufacturing-industries

https://finance.yahoo.com/news/hurricane-irma-mean-stocks-105038376.html

Will Scientific Research and Technological Innovation Be Stifled By Expiring Agreement?

Image: President Jimmy Carter and Chinese Vice Premier Deng Xiaoping meet outside of the Oval Office on Jan. 30, 1979

The US and China May Be Ending an Agreement on Science and Technology Cooperation − A Policy Expert Explains What This Means for Research

A decades-old science and technology cooperative agreement between the United States and China expires this week. On the surface, an expiring diplomatic agreement may not seem significant. But unless it’s renewed, the quiet end to a cooperative era may have consequences for scientific research and technological innovation.

The possible lapse comes after U.S. Rep. Mike Gallagher, R-Wis., led a congressional group warning the U.S. State Department in July 2023 to beware of cooperation with China. This group recommended to let the agreement expire without renewal, claiming China has gained a military advantage through its scientific and technological ties with the U.S.

The State Department has dragged its feet on renewing the agreement, only requesting an extension at the last moment to “amend and strengthen” the agreement.

The U.S. is an active international research collaborator, and since 2011 China has been its top scientific partner, displacing the United Kingdom, which had been the U.S.‘s most frequent collaborator for decades. China’s domestic research and development spending is closing in on parity with that of the United States. Its scholastic output is growing in both number and quality. According to recent studies, China’s science is becoming increasingly creative, breaking new ground.

This article was republished with permission from The Conversation, a news site dedicated to sharing ideas from academic experts. It represents the research-based findings and thoughts of, Caroline Wagner, Professor of Public Affairs, The Ohio State University.

As a policy analyst and public affairs professor, I research international collaboration in science and technology and its implications for public policy. Relations between countries are often enhanced by negotiating and signing agreements, and this agreement is no different. The U.S.’s science and technology agreement with China successfully built joint research projects and shared research centers between the two nations.

U.S. scientists can typically work with foreign counterparts without a political agreement. Most aren’t even aware of diplomatic agreements, which are signed long after researchers have worked together. But this is not the case with China, where the 1979 agreement became a prerequisite for and the initiator of cooperation.

In 1987 former President Jimmy Carter visited Yangshuo, his wife Rosalyn and he insisted that went around Yangshuo countryside by bicycle.

A 40-Year Diplomatic Investment

The U.S.-China science and technology agreement was part of a historic opening of relations between the two countries, following decades of antagonism and estrangement. U.S. President Richard Nixon set in motion the process of normalizing relations with China in the early 1970s. President Jimmy Carter continued to seek an improved relationship with China.

China had announced reforms, modernizations and a global opening after an intense period of isolation from the time of the Cultural Revolution from the late 1950s until the early 1970s. Among its “four modernizations” was science and technology, in addition to agriculture, defense and industry.

While China is historically known for inventing gunpowder, paper and the compass, China was not a scientific power in the 1970s. American and Chinese diplomats viewed science as a low-conflict activity, comparable to cultural exchange. They figured starting with a nonthreatening scientific agreement could pave the way for later discussions on more politically sensitive issues.

On July 28, 1979, Carter and Chinese Premier Deng Xiaoping signed an “umbrella agreement” that contained a general statement of intent to cooperate in science and technology, with specifics to be worked out later.

In the years that followed, China’s economy flourished, as did its scientific output. As China’s economy expanded, so did its investment in domestic research and development. This all boosted China’s ability to collaborate in science – aiding their own economy.

Early collaboration under the 1979 umbrella agreement was mostly symbolic and based upon information exchange, but substantive collaborations grew over time.

A major early achievement came when the two countries published research showing mothers could ingest folic acid to prevent birth defects like spina bifida in developing embryos. Other successful partnerships developed renewable energy, rapid diagnostic tests for the SARS virus and a solar-driven method for producing hydrogen fuel.

Joint projects then began to emerge independent of government agreements or aid. Researchers linked up around common interests – this is how nation-to-nation scientific collaboration thrives.

Many of these projects were initiated by Chinese Americans or Chinese nationals working in the United States who cooperated with researchers back home. In the earliest days of the COVID-19 pandemic, these strong ties led to rapid, increased Chinese-U.S. cooperation in response to the crisis.

Time of Conflict

Throughout the 2000s and 2010s, scientific collaboration between the two countries increased dramatically – joint research projects expanded, visiting students in science and engineering skyrocketed in number and collaborative publications received more recognition.

As China’s economy and technological success grew, however, U.S. government agencies and Congress began to scrutinize the agreement and its output. Chinese know-how began to build military strength and, with China’s military and political influence growing, they worried about intellectual property theft, trade secret violations and national security vulnerabilities coming from connections with the U.S.

Recent U.S. legislation, such as the CHIPS and Science Act, is a direct response to China’s stunning expansion. Through the CHIPS and Science Act, the U.S. will boost its semiconductor industry, seen as the platform for building future industries, while seeking to limit China’s access to advances in AI and electronics.

A Victim of Success?

Some politicians believe this bilateral science and technology agreement, negotiated in the 1970s as the least contentious form of cooperation – and one renewed many times – may now threaten the United States’ dominance in science and technology. As political and military tensions grow, both countries are wary of renewal of the agreement, even as China has signed similar agreements with over 100 nations.

The United States is stuck in a world that no longer exists – one where it dominates science and technology. China now leads the world in research publications recognized as high quality work, and it produces many more engineers than the U.S. By all measures, China’s research spending is soaring.

Even if the recent extension results in a renegotiated agreement, the U.S. has signaled to China a reluctance to cooperate. Since 2018, joint publications have dropped in number. Chinese researchers are less willing to come to the U.S. Meanwhile, Chinese researchers who are in the U.S. are increasingly likely to return home taking valuable knowledge with them.

The U.S. risks being cut off from top know-how as China forges ahead. Perhaps looking at science as a globally shared resource could help both parties craft a truly “win-win” agreement.

The Week Ahead – Look Out For Light Trading and Pre-Holiday Volatility

Heading Into the Unofficial End of Summer, Powell Gave the Market a Lot to Think About

The last “unofficial” week of summer will likely be characterized by light trading, which could amplify volatility. This week follows what is viewed by many as a more hawkish tone than expected by Fed Chair Powell on Friday. The next FOMC meeting is not until September 19–20; that is a long time to obsess over every economic number, and there are many key numbers that will be released this week. Investors will be watching the labor report, alongside the PCE price index, personal income and spending data, JOLTS job openings, ISM Manufacturing PMI, and the second estimate of Q2 GDP growth.

Monday 8/28

•              10:30 AM ET, the Dallas Fed Manufacturing Index is expected to post a 16th straight negative number, at a steep minus 21.0 in August versus minus 20.0 in July. The survey asks manufacturers whether output, employment, orders, prices and other indicators increased, decreased or remained unchanged over the previous month. Responses are aggregated into an index where positive values generally indicate growth while negative values generally indicate contraction.

Tuesday 8/29

•              10:00 AM ET, Consumer Confidence is expected to dip slightly in August, at a consensus 116.5 versus July’s 117.0. This report has exceeded not only the consensus in the last three reports but the full consensus range as well.

•              10:00 AM ET, The JOLTS report consensus for July is 9.559 million near its June’s 9.582 million level. Economist consensus have been fairy accurate for this well monitored indicator. The JOLTS report tracks monthly change in job openings and offers rates on hiring and quits.

Wednesday 8/30

•              8:30 AM ET, GDP (the second estimate of second-quarter) is expected to show no change from 2.4 percent growth in the quarter’s first estimate. Personal Consumption Expenditures (PCE), at 1.6 percent growth in the first estimate, is expected to come in at 1.7 percent in the second estimate.

•              10:00 AM ET,  Pending Home Sales are expected to fall by 0.4% after rising .3% in June. The National Association of Realtors developed the Pending Home Sales report as a leading indicator of housing activity. Specifically, it is a leading indicator of existing home sales, not new home sales. A pending sale is one in which a contract was signed, but not yet closed. It usually takes four to six weeks to close a contracted sale. Home transactions are a harbinger for economic activity.

•              10:00 AM ET,  The State Street Investor Confidence Index measures confidence by looking at actual levels of risk in investment portfolios. This is not an attitude survey. The State Street Investor Confidence Index measures confidence directly by assessing the changes in investor holdings of equities. The prior number (July) was 96.2%.

•              10:30 PM ET, EIA The Energy Information Administration (EIA) provides the Petroleum Status Report weekly with information on petroleum inventories in the US, whether produced in the US or abroad. The level of inventories helps determine prices for petroleum products.

Thursday 8/30

•              7:30 AM ET, The Challenger Job-Cut Report for August will be reported and compared to last months 23,697 job cuts.

•              8:30 AM ET, Jobless claims for the week ended 8/26 are expected to come in at 238,000. The prior week the figure was 230,000.

•              8:30 AM ET, Personal Income is expected to have risen 0.3 percent in July with Consumption Expenditures expected to increase a solid 0.6 percent. These stats will be compared with June’s 0.3 percent increase for income and 0.5 percent increase for consumption.

•              9:45 AM ET, The Chicago PMI is expected to have risen in August to 44.6 versus 42.8 in July which was the eleventh straight month of sub-50 contraction.

•              3:00 PM ET, Farm Prices for July are expected to have risen month over month by 0.4%, however year-on-year declined by 5.3%. Farm prices are a leading indicator of food price changes in the producer and consumer price indices. There is not a one-to-one correlation, but general trends move in tandem. Inflation is a general increase in the prices of goods and services.

•              4:30 PM ET, The Fed’s Balance Sheet totaled $8.139 trillion last week. Further declines in line with the Feds quantitative tightening (QT) is expected.

Friday 9/1

•              8:30 AM ET, the Employment Situation report is expected to show a moderating but still strong 170,000 increase for nonfarm payroll growth in August versus 187,000 in July which was a bit lower than expected. Average hourly earnings in August are expected to rise 0.3 percent on the month for a year-over-year rate of 4.4 percent; these would compare with 0.4 and 4.4 percent in the prior two reports. August’s unemployment rate is expected to hold unchanged at 3.5 percent.

•              10:00 AM ET, The ISM manufacturing index has been in contraction the last nine months. August’s consensus is 46.8 versus July’s 46.4.

•              10:00 AM ET, Construction Spending for July is expected to have risen 0.5% to match June’s 0.5% increase that had benefited from a second strong month for residential spending.

What Else

There is no early close scheduled for the US markets on Friday before the three day Labor Day weekend.

Have you attended an in-person roadshow organized by Noble Capital Markets. Noble has been reaching out to retail and institutional investors and holding these events designed for investors to meet management teams. Investors have been able to discover more about their companies, often enough to make an informed decision. The forum has been getting rave reviews from investors and company management teams. Use this link to see if a roadshow is scheduled near you.

Paul Hoffman

Managing Editor, Channelchek

Sources

https://www.federalreserve.gov/monetarypolicy/fomccalendars.htm

www.econoday.com

Should We Be Bullish on Small Caps?

Powell’s Right About the Resilient Economy, How it May Affects Some Stocks

One can generalize and say small cap companies are more sensitive to recessions than large caps – and they would be correct. In his speech in Jackson Hole, Fed Chair Jerome Powell said, “But we are attentive to signs that the economy may not be cooling as expected. So far this year, GDP growth has come in above expectations and above its longer-run trend, and recent readings on consumer spending have been especially robust.” His words sound like a soft landing, no landing, or puts any hard landing far off into the future. Over the past few years, the performance of small-cap stocks has not held its own relative to the performance of large caps when highly weighting the stratospheric performance of mega caps. 

After the most recent year and a half of both business news and investors expressing recession concerns, the newer conversation is one of an economic soft landing. Those mentioning the inverted yield curve “proof” has been silenced as rates out on the curve have begun to move steadily higher. The conversation has now been replaced with expectations of increased economic activity. Even if expectations don’t fully come to fruition, it is expectations that move markets – just look at last year’s down stock market which was the result of investors expecting a recession was imminent. 

Will Small Caps Finally Run With the Bulls?

The S&P 600 Small Cap Index is is at the same level as December 2020
(Source: S&P Dow Jones Indices)

The S&P 600 small cap index is up by nearly a third as much as the S&P 500 this year (4.40% versus 13.98%) and trades at only 15 times earnings. BofA Securities using Russell Index numbers for its analysis of Russell 1000 large cap and Russell 200 small cap indexes, calculated that small companies are 30% cheaper than usual in comparison to big ones. Over the next decade, according to BoA Securities estimates, small caps are poised to gain an average of 11% a year versus 4% for large caps.

Source: S&P Dow Jones Indices

The S&P 600 Small Cap Index has underperformed the S&P Large Cap Index by nearly 10% over the past year. Another well-respected firm, T. Rowe Price, takes the expectations in small-caps a step further in its August insight report titled: The Outlook for U.S. Smaller Companies Looks Increasingly Compelling (Now is not the time to wait on the sidelines). The report highlights additional factors supporting the increased probabilities of small-cap performance.

T. Rowe Price discussed how smaller companies are more oriented towards U.S. economic activity. The author,  Curt Organt, the portfolio manager of the firms smaller company equity strategy, also pointes to the many bills in Congress that support capital spending projects in the U.S., explaining this will also provide a tailwind.

•             “While the U.S. equity market has become increasingly concentrated at the top end over the past decade, smaller‑company valuations are at their most compelling levels in decades.”

•             “History shows that as high concentration in the S&P 500 Index begins to unwind, a new cycle of small‑cap outperformance usually begins.”

•             “Shifting trends in the U.S. economy are particularly supportive of smaller companies, providing a potential catalyst for higher earnings growth.”

The portfolio manager discussed how, through history, investors in small-cap stocks ordinarily command higher relative valuations compared to their larger counterparts. At present, as mentioned before, small-cap stocks are currently trading at a substantial discount in relation to large-cap stocks.

Downside protection is also seen as a positive in small-caps, whether compared to its own history, or to today’s large cap valuations. The low valuations in the smaller companies do offer a degree of downside protection during market downturns.

Take Away

 At the conclusion of his Jackson Hole speech, Powell said, “As is often the case, we are navigating by the stars under cloudy skies. In such circumstances, risk-management considerations are critical.” Although he was talking about U.S. monetary policy, the words apply equally well if applied to a portfolio’s investment policy. One can never be completely sure of what is around the corner that can either accelerate returns or set the portfolio back. But, placing probabilities on your side, over time, is good practice.

One can never have too much information when selecting companies to invest in. Small company information is particularly challenging for investors to find. Creating a login to Channelchek allows access to data on 6,000 small and microcap companies; this may be the key to further placing investment probabilities on your side. And, if you’d like to take your exploration for the ideal smaller companies to invest in to a higher level, join Noble Capital Markets and Channelchek at its annual investment conference, NobleCon19, this fall.

Paul Hoffman

Managing Editor, Channelchek

Sources

https://advantage.factset.com/hubfs/Website/Resources%20Section/Research%20Desk/Earnings%20Insight/EarningsInsight_080423.pdf

https://www.spglobal.com/spdji/en/indices/equity/sp-600/?utm_source=pdf_commentary#overview

https://www.spglobal.com/spdji/en/indices/equity/sp-600/#overview

https://www.spglobal.com/spdji/en/indices/equity/sp-500/#overview

https://www.troweprice.com/content/dam/gdx/pdfs/2023-q3/the-outlook-for-us-smaller-companies-looks-increasingly-compelling.pdf

Insider Trading − The Legal Kind − Is a Lot More Profitable If You Work for a Multinational Company

Here’s How Big the Multinational Insider Advantage Is

Corporate insiders who trade stocks based on the information they gain on the job earn a lot more if they work at multinational corporations than their peers at U.S. companies with no sales abroad. That’s the main finding of our new peer-reviewed research. We wanted to know if multinational insiders stand to make more money because of the complexity of the information they could possess relative to outsiders.

Insider trading happens when a director or employee trades their company’s public stock or other security based on important or “material” information about that business. Insider trading isn’t illegal as long as the person reports the trade to the Securities and Exchange Commission and the information is already in the public domain.

This article was republished with permission from The Conversation, a news site dedicated to sharing ideas from academic experts. It represents the research-based findings and thoughts of, D. Brian Blank, Assistant Professor of Finance, Mississippi State University, and Dallin Alldredge, Assistant Professor of Finance, Florida International University.

We wanted to know if multinational insiders stand to make more money because of the complexity of the information they could possess relative to outsiders.

So we examined returns from over 2.5 million trades reported to the SEC from 1987 to 2019 by insiders at over 10,000 companies. This is only a subset of all insider trades reported during the period because we focused on only those transactions most likely to be informed by the employee’s insight. We then compared monthly returns for insiders at multinational and domestic companies with those for a typical investor.

We found that all insiders beat the market, but those at multinationals did better – especially if they were on the highest rungs of the corporate ladder. While insiders at domestic companies typically obtained a return of 2.4% in the month following a stock purchase, those at multinational corporations reaped 2.8%. That may not sound like a lot, but, assuming consistent returns, it could amount to earning $170,000 more if an insider traded $1 million over several months. And it’s triple the typical stock market monthly gain of 0.9%

The most in-the-know insiders – executives and others with the most intimate knowledge of the company and its operations – at multinationals got an even bigger advantage, earning 3.6% per month vs. 2.7% at domestic companies.

Why it Matters

Insider trading is familiar to most people from movies that portray it in criminal terms, such as Gordon Gekko of “Wall Street.” In the film, he makes millions off others’ inside information.

But even when it is legal, insider trading is very profitable. That’s because insiders trading on public information are more knowledgeable about their industry and process information more effectively than outside investors.

With global companies, the advantage of being an insider increases. Since multinational companies generate earnings in foreign countries, with different currencies, cultures, economies and operating environments, it can be hard for an outsider or analyst to accurately value the company and its stock price. This is especially true when the company does business in regions that are culturally and linguistically distinct from the U.S. This helps insiders trade more efficiently, by buying underpriced stocks at a bargain and selling them later for a windfall.

Companies often motivate their employees to work harder by offering them a stake in their success, but if insiders seem to be getting an unfair advantage over ordinary investors, it may undermine trust in financial markets. The size and profitability of such trades – particularly in light of our data – mean regulators and policymakers may want to consider whether new restrictions on insider trading are needed, such as placing additional limits on the timing or frequency of trades.

What Other Research is Being Done?

Scholars, including us, are pursuing many avenues of research on insider trading, such as how insider trading restrictions are determined and how insider trades inform markets when news is limited. We’ve recently conducted research on how insider trades by colleagues at the same company tend to cluster together, and we are currently looking at how innovation affects insider trading.

Another recently published project relates to how information is incorporated into stock market prices and how investors underreact to news that may affect insiders’ ability to trade profitably. Similarly, ongoing research uses a GPT language model to assess the complexity of business regulatory filings and financial statements by analyzing technical jargon that can confuse investors, which could also affect how outside investors understand stock prices compared with insiders.

Do Regional Federal Reserve Branches Put Banks in Their Region at Risk?

The Fed Is Losing Tens of Billions: How Are Individual Federal Reserve Banks Doing?

The Federal Reserve System as of the end of July 2023 has accumulated operating losses of $83 billion and, with proper, generally accepted accounting principles applied, its consolidated retained earnings are negative $76 billion, and its total capital negative $40 billion. But the System is made up of 12 individual Federal Reserve Banks (FRBs). Each is a separate corporation with its own shareholders, board of directors, management and financial statements. The commercial banks that are the shareholders of the Fed actually own shares in the particular FRB of which they are a member, and receive dividends from that FRB. As the System in total puts up shockingly bad numbers, the financial situations of the individual FRBs are seldom, if ever, mentioned. In this article we explore how the individual FRBs are doing.

All 12 FRBs have net accumulated operating losses, but the individual FRB losses range from huge in New York and really big in Richmond and Chicago to almost breakeven in Atlanta. Seven FRBs have accumulated losses of more than $1 billion. The accumulated losses of each FRB as of July 26, 2023 are shown in Table 1.

Table 1: Accumulated Operating Losses of Individual Federal Reserve Banks

New York ($55.5 billion)

Richmond ($11.2 billion )

Chicago ( $6.6 billion )

San Francisco ( $2.6 billion )

Cleveland ( $2.5 billion )

Boston ( $1.6 billion )

Dallas ( $1.4 billion )

Philadelphia ($688 million)

Kansas City ($295 million )

Minneapolis ($151 million )

St. Louis ($109 million )

Atlanta ($ 13 million )

The FRBs are of very different sizes. The FRB of New York, for example, has total assets of about half of the entire Federal Reserve System. In other words, it is as big as the other 11 FRBs put together, by far first among equals. The smallest FRB, Minneapolis, has assets of less than 2% of New York. To adjust for the differences in size, Table 2 shows the accumulated losses as a percent of the total capital of each FRB, answering the question, “What percent of its capital has each FRB lost through July 2023?” There is wide variation among the FRBs. It can be seen that New York is also first, the booby prize, in this measure, while Chicago is a notable second, both having already lost more than three times their capital. Two additional FRBs have lost more than 100% of their capital, four others more than half their capital so far, and two nearly half. Two remain relatively untouched.

Table 2: Accumulated Losses as a Percent of Total Capital of Individual FRBs

New York 373%

Chicago 327%

Dallas 159%

Richmond 133%

Boston 87%

Kansas City 64%

Cleveland 56%

Minneapolis 56%

San Francisco 48%

Philadelphia 46%

St. Louis 11%

Atlanta 1%

Thanks to statutory formulas written by a Congress unable to imagine that the Federal Reserve could ever lose money, let alone lose massive amounts of money, the FRBs maintained only small amounts of retained earnings, only about 16% of their total capital. From the percentages in Table 2 compared to 16%, it may be readily observed that the losses have consumed far more than the retained earnings in all but two FRBs. The GAAP accounting principle to be applied is that operating losses are a subtraction from retained earnings. Unbelievably, the Federal Reserve claims that its losses are instead an intangible asset. But keeping books of the Federal Reserve properly, 10 of the FRBs now have negative retained earnings, so nothing left to pay out in dividends.

On orthodox principles, then, 10 of the 12 FRBs would not be paying dividends to their shareholders. But they continue to do so. Should they?

Much more striking than negative retained earnings is negative total capital. As stated above, properly accounted for, the Federal Reserve in the aggregate has negative capital of $40 billion as of July 2023. This capital deficit is growing at the rate of about $ 2 billion a week, or over $100 billion a year. The Fed urgently wants you to believe that its negative capital does not matter. Whether it does or what negative capital means to the credibility of a central bank can be debated, but the big negative number is there. It is unevenly divided among the individual FRBs, however.

With proper accounting, as is also apparent from Table 2, four of the FRBs already have negative total capital. Their negative capital in dollars shown in Table 3.

Table 3: Federal Reserve Banks with Negative Capital as of July 2023

New York ($40.7 billion)

Chicago ($ 4.6 billion )

Richmond ($ 2.8 billion )

Dallas ($514 million )

In these cases, we may even more pointedly ask: With negative capital, why are these banks paying dividends?

In six other FRBs, their already shrunken capital keeps on being depleted by continuing losses. At the current rate, they will have negative capital within a year, and in 2024 will face the same fundamental question.

What explains the notable differences among the various FRBs in the extent of their losses and the damage to their capital? The answer is the large difference in the advantage the various FRBs enjoy by issuing paper currency or dollar bills, formally called “Federal Reserve Notes.” Every dollar bill is issued by and is a liability of a particular FRB, and the FRBs differ widely in the proportion of their balance sheets funded by paper currency.

The zero-interest cost funding provided by Federal Reserve Notes reduces the need for interest-bearing funding. All FRBs are invested in billions of long-term fixed-rate bonds and mortgage securities yielding approximately 2%, while they all pay over 5% for their deposits and borrowed funds—a surefire formula for losing money. But they pay 5% on smaller amounts if they have more zero-cost paper money funding their bank. In general, more paper currency financing reduces an FRB’s operating loss, and a smaller proportion of Federal Reserve Notes in its balance sheet increases its loss. The wide range of Federal Reserve Notes as a percent of various FRBs’ total liabilities, a key factor in Atlanta’s small accumulated losses and New York’s huge ones, is shown in Table 4.

Table 4: Federal Reserve Notes Outstanding as a Percent of Total Liabilities

Atlanta 64%

St. Louis 60%

Minneapolis 58%

Dallas 51%

Kansas City 50%

Boston 45%

Philadelphia 44%

San Francisco 39%

Cleveland 38%

Chicago 26%

Richmond 23%

New York 17%

The Federal Reserve System was originally conceived not as a unitary central bank, but as 12 regional reserve banks. It has evolved a long way toward being a unitary organization since then, but there are still 12 different banks, with different balance sheets, different shareholders, different losses, and different depletion or exhaustion of their capital. Should it make a difference to a member bank shareholder which particular FRB it owns stock in? The authors of the Federal Reserve Act thought so.

About the Author

Alex J. Pollock is a Senior Fellow at the Mises Institute, and is the co-author of Surprised Again! — The Covid Crisis and the New Market Bubble (2022). Previously he served as the Principal Deputy Director of the Office of Financial Research in the U.S. Treasury Department (2019-2021), Distinguished Senior Fellow at the R Street Institute (2015-2019 and 2021), Resident Fellow at the American Enterprise Institute (2004-2015), and President and CEO, Federal Home Loan Bank of Chicago (1991-2004). He is the author of Finance and Philosophy—Why We’re Always Surprised (2018).

Will the New Buzzword Being Bandied About Regarding Inflation Be “r-star”?

Federal Reserve Chairman’s Speech at Jackson Hole Symposium Sparks Speculation on Subject and Market Impact

There’s an economic concept that is expected to be included in Fed Chair Powell’s next speech that may soon become the new buzzword. It may be worth a minute now to be sure there is a thorough understanding. Especially if his address at the Jackson Hole Symposium begins to drive markets one way or the other. Other news outlets say Powell’s address may be a pivotal moment that could potentially reshape the stock market landscape. Last year they said the same thing, but instead his address was a yawner, ultra-safe, with no new information for the markets to use.

Scheduled for 10:05 ET Friday morning, Powell’s address, it is said, may center around the concept of the neutral rate of interest, a theoretical but influential notion that holds the potential to send ripples through financial markets.

The neutral rate of interest, also referred to as r* or r-star, represents the level of real short-term interest rates anticipated to prevail when the U.S. economy is at its peak strength and inflation remains stable. Analysts estimate this real neutral rate to be around 0.5%, calculated by deducting the Federal Reserve’s 2% inflation target from policymakers’ latest predictions for the long-term trajectory of the fed funds rate. Speculation suggests that the neutral rate might be on the rise, given the current economic performance.

Amidst an environment where the U.S. economy appears to be gathering momentum, even following a series of interest rate hikes that brought rates to a 22-year high of 5.25%-5.5%, the stakes are high for determining the correct theoretical level for the neutral rate. The economy achieved a robust growth rate of 2% in the first quarter, followed by 2.4% in the second quarter. The Atlanta Fed’s GDPNow model projects an astonishing 5.8% growth rate for real gross domestic product in the third quarter, a figure met with skepticism but indicative of the economy’s notable resilience.

Investors will be hanging on the Fed chair’s every utterance, clarity from Powell’s address to better comprehend the Fed’s perspective on this crucial neutral rate. What a higher neutral rate could mean is policymakers could find themselves compelled to implement additional hikes to fed-funds. This scenario would result in longer periods of higher borrowing costs and a delay in the timing of the first rate reduction.

Traders and investors have already adjusted their expectations to anticipate the Federal Reserve maintaining elevated interest rates for a longer period.

This year has seen significant gains in the stock market, with the Dow Jones Industrial Average (DJIA) rising by 4%, the S&P 500 (SPX) surging by 15.5%, and the Nasdaq Composite (COMP) leading the pack with a remarkable 31.1% increase. Investors and traders are cautiously optimistic about a scenario where the U.S. economy navigates a soft landing, with inflation trending downward.

In the days leading up to Powell’s speech at the Kansas City Fed’s Jackson Hole symposium, the Treasury market has already incorporated expectations of stronger-than-anticipated U.S. economic growth. Yields for 10-year and 30-year Treasury bonds reached multiyear highs, though they retraced slightly in the days following. However, market participants anticipate potential fluctuations in response to Powell’s remarks, which could trigger further yield adjustments.

The recent upswing in yields, leading to the highest closing levels since 2007 and 2011 for the 10-year and 30-year rates, respectively, has been given as the reason for the decline in U.S. stock values during August. The S&P 500 experienced a decline of over 3% during the month.

Take Away

Understanding r* or r-star in advance may prevent some scurrying at 10:10 AM ET tomorrow. While Market participants eagerly await Powell’s speech, hoping for insights that will shed light on the Federal Reserve’s outlook regarding the neutral rate and its potential impact on monetary policy and the stock market, last year his words were short, and seemed to be designed to convey nothing new.

Paul Hoffman

Managing Editor, Channelchek

Financial Firms are Taking More than People as they Leave California and New York

Putting Numbers on the AUM Leaving the North

While it is no secret that there has been a migration of the finance and investment community out of New York and California, other than piecing together vehicle registrations to count people, there have been few hard numbers put on the firms and their AUM that have pulled out. This week, Bloomberg put hard numbers on the exodus, and it’s worse than most imagined. Looking at corporate filings back to the end of 2019, it found that more than 17,000 firms have moved. The two states have lost assets under management (AUM), within their borders, totaling more than $1 trillion.

This has also meant a lot of above average paying jobs, which saps tax revenue, and stresses state budgets. The commercial real estate markets in the two high-tax states have also taken a big hit as deep-pocketed tenants have packed up and left at a time when remote and hybrid work have already bled demand.

The Bloomberg piece makes clear that New York City remains the global center for asset management, but while New York is being slowly drained, it is “fueling a boom” down south. The article discusses the soaring Miami home prices and lifestyle improvements. In Dallas, the finance industry is expanding at a pace reminiscent of the 1980s oil bust. Charles Schwab moved to the area in 2020, and now Goldman Sachs and Wells Fargo are working to create office space to accommodate thousands of employees.

The moves continue to be inspired by costs and weather, and now face-to-face meetings are easier as the Dallas or Boca Raton associate is no longer an “out-of-towner”. The migration has dramatically increased the growth of professionals in the industry, in areas that previously had very few financial firms.

“The Sun Belt is continuing to change – no longer just a place of traditional industries like oil and gas, no longer just focused on tourism, of focusing on the retirement community,” Bloomberg quotes Amy Liu, interim President of the Brookings Institute, as saying.

From the beginning of 2020 through the end of the first quarter 2023, more than 370 investment companies decided to make a move. The companies represent 2.5% of the US total, and manage $2.7 trillion in assets. A high percentage was from the Northeast and the West Coast to Florida and Texas. But, North Carolina and Tennessee together grew by $600 billion in assets now managed within their borders. This is primarily from Alliance Bernstein moving out of New York and to Nashville, and Allspring Global Investment out of San Franciso and to Charlotte.

The AUM Migration by Region (Q1 2020 – Q1 2023)

Washington State saw three firms leave during this period, but the assets under management in the state dropped 19% as a result, as Fisher Investments was one of the three. Connecticut, a long-time suburb of the Big Apple is known for the hedge funds that have been headquartered there and enjoying lower taxes than in “the city.” The proximity to New York and the rising Connecticut taxes were traded by enough firms that Florida now has more assets under management than Connecticut.

Florida acquired the most assets from the migration from New York, Ark Investment Management, run by Cathie Wood, and Carl Icahn’s Icahn Capital Management were prominent names. Ken Griffin’s Citadel from Chicago is altering the South Florida skyline as it builds out offices, and DoubleLine moved from Los Angeles to Florida’s West Coast.

Smaller firms are on the move too. Whether they are following the sun, or the wealthy baby boomers, Palm Beach saw 37 investment advisors relocate, and Miami experienced an influx of 63 advisors.

The AUM in these new states is being enhanced by wealthy individuals also picking up and moving from their higher-tax residences. Tiger 21, a worldwide network of more than 1200 high net-worth investors, with assets over $150 billion, has grown its Florida chapter.

Take Away

The only thing that stays the same is change, as the saying goes. The pandemic brought on a lot of changes that most did not see coming. The migration out of places widely viewed as more difficult to live in because of costs, or year-round temperatures includes powerful financial firms. These firms are bringing in professionals who are accustomed to a certain way of conducting business. Until recently, the ability to do business this way did not fully exist in the areas where their firms have relocated – now it does.

Paul Hoffman

Managing Editor, Channelchek

Sources

https://www.bloomberg.com/graphics/2023-asset-management-relocation-wall-street-south/