Net sales of $44.6 million; up 17.8% year-over-year driven by volume growth of Lifeway Kefir
18th consecutive quarter of year-over-year growth
Delivers 410 basis points of gross profit margin expansion
MORTON GROVE, Ill., May 14, 2024 /PRNewswire/ — Lifeway Foods, Inc. (Nasdaq: LWAY) (“Lifeway” or “the Company”), a leading U.S. supplier of kefir and fermented probiotic products to support the microbiome, today reported financial results for the first quarter ended March 31, 2024.
“Following our tremendous results in 2023, I am thrilled to report yet another record-breaking quarter on the topline to kick off 2024,” commented Julie Smolyansky, President and Chief Executive Officer of Lifeway Foods. “Driven by volume growth in our flagship Lifeway drinkable kefir, we delivered our highest ever quarterly net sales of $44.6 million in the first quarter, up nearly 18% year-over-year, as our strategic sales and marketing investments continue to accelerate our sales velocities, grow awareness and win new consumers seeking better-for-you, premium products at a great value. This marked our 18th consecutive quarter of growth and 4th consecutive quarter reporting record net sales, which demonstrates the loyalty of our core customer base. Through our strong operational execution, accompanied by favorable transportation cost tailwinds, we also continued to improve on our key profitability metrics in the quarter, highlighted by our gross margin expansion and net income growth. We are pleased with this strong start to the year, and are consistently evaluating additional brand marketing and incremental distribution opportunities in an effort to build on this high bar of success throughout 2024.”
First Quarter 2024 Results
Net sales were $44.6 million for the first quarter ended March 31, 2024, an increase of $6.7 million or 17.8% from the same period in 2023. The net sales increase was primarily driven by higher volumes of our branded drinkable kefir.
Gross profit as a percentage of net sales increased to 25.8% for the first quarter ended March 31, 2024 from 21.7% during the same period in 2023. The 410-basis point increase versus the prior year was primarily due to the higher volumes of Lifeway branded products, and to a lesser extent a favorable impact of transportation costs.
Selling, general and administrative expenses as a percentage of net sales were 17.6% for the first quarter ended March 31, 2024 and 2023, respectively.
The Company reported net income of $2.4 million or $0.17 per basic and $0.16 per diluted common share for the first quarter ended March 31, 2024 compared to net income of $0.8 million or $0.06 per basic and diluted common share during the same period in 2023.
Conference Call and Webcast A pre-recorded conference call and webcast with Julie Smolyansky discussing these results with additional comments and details is available through the “Investor Relations” section of the Company’s website at https://lifewaykefir.com/webinars-reports/ and will also be available for replay.
About Lifeway Foods, Inc. Lifeway Foods, Inc., which has been recognized as one of Forbes’ Best Small Companies, is America’s leading supplier of the probiotic, fermented beverage known as kefir. In addition to its line of drinkable kefir, the company also produces a variety of cheeses and a ProBugs line for kids. Lifeway’s tart and tangy fermented dairy products are now sold across the United States, Mexico, Ireland and France. Learn how Lifeway is good for more than just you at lifewayfoods.com.
Forward-Looking Statements
This release (and oral statements made regarding the subjects of this release) contains “forward-looking statements” as defined in the Private Securities Litigation Reform Act of 1995 regarding, among other things, future operating and financial performance, product development, market position, business strategy and objectives. These statements use words, and variations of words, such as “continue,” “build,” “future,” “increase,” “drive,” “believe,” “look,” “ahead,” “confident,” “deliver,” “outlook,” “expect,” and “predict.” Other examples of forward-looking statements may include, but are not limited to, (i) statements of Company plans and objectives, including the introduction of new products, or estimates or predictions of actions by customers or suppliers, (ii) statements of future economic performance, and (III) statements of assumptions underlying other statements and statements about Lifeway or its business. You are cautioned not to rely on these forward-looking statements. These statements are based on current expectations of future events and thus are inherently subject to uncertainty. If underlying assumptions prove inaccurate or known or unknown risks or uncertainties materialize, actual results could vary materially from Lifeway’s expectations and projections. These risks, uncertainties, and other factors include: price competition; the decisions of customers or consumers; the actions of competitors; changes in the pricing of commodities; the effects of government regulation; possible delays in the introduction of new products; and customer acceptance of products and services. A further list and description of these risks, uncertainties, and other factors can be found in Lifeway’s Annual Report on Form 10-K for the fiscal year ended December 31, 2023, and the Company’s subsequent filings with the SEC. Copies of these filings are available online at https://www.sec.gov, http://lifewaykefir.com/investor-relations/, or on request from Lifeway. Information in this release is as of the dates and time periods indicated herein, and Lifeway does not undertake to update any of the information contained in these materials, except as required by law. Accordingly, YOU SHOULD NOT RELY ON THE ACCURACY OF ANY OF THE STATEMENTS OR OTHER INFORMATION CONTAINED IN ANY ARCHIVED PRESS RELEASE.
Media: Derek Miller Vice President of Communications, Lifeway Foods Email: derekm@lifeway.net
General inquiries: Lifeway Foods, Inc. Phone: 847-967-1010 Email: info@lifeway.net
BATAVIA, N.Y.–(BUSINESS WIRE)– Graham Corporation (NYSE: GHM) (“GHM” or “the Company”), a global leader in the design and manufacture of mission critical fluid, power, heat transfer and vacuum technologies for the defense, space, energy, and process industries, announced today that it has filed a universal shelf registration statement on Form S-3 with the Securities and Exchange Commission (SEC). If and when the shelf registration is declared effective, it will permit the Company to offer and sell, from time to time in one or more offerings, up to $150 million of common stock, preferred stock, warrants, purchase contracts, units, or any combination of these securities.
Christopher J. Thome, Chief Financial Officer, commented, “We believe a shelf registration is a demonstration of good corporate governance as it provides GHM with enhanced financial flexibility to meet our long-term strategic goals. It enables us to access the capital markets quickly and efficiently, if and when favorable conditions align for the Company and our shareholders.”
Should the Company decide to raise capital in a future offering using the shelf registration statement, GHM will describe the specific details of that future offering in a prospectus supplement that is filed with the SEC.
The registration statement on Form S-3 has been filed with the SEC but is not yet effective. These securities may not be sold nor may offers to buy be accepted under the Form S-3 registration statement prior to the time the Form S-3 registration statement becomes effective. This News release shall not constitute an offer to sell nor the solicitation of an offer to buy the securities that are proposed to be registered on the Form S-3, nor shall there be any sale of such securities in any state in which such offer, solicitation or sale would be unlawful prior to registration or qualification under the securities law of any such state.
About Graham Corporation
GHM is a global leader in the design and manufacture of mission critical fluid, power, heat transfer and vacuum technologies for the defense, space, energy, and process industries. The Graham Manufacturing and Barber-Nichols’ global brands are built upon world-renowned engineering expertise in vacuum and heat transfer, cryogenic pumps, and turbomachinery technologies, as well as its responsive and flexible service and the unsurpassed quality customers have come to expect from the Company’s products and systems. Graham Corporation routinely posts news and other important information on its website, grahamcorp.com, where additional information on Graham Corporation and its businesses can be found.
Safe Harbor Regarding Forward Looking Statements
This news release contains forward-looking statements within the meaning of Section 27A of the Securities Act of 1933, as amended, and Section 21E of the Securities Exchange Act of 1934, as amended.
Forward-looking statements are subject to risks, uncertainties and assumptions and are identified by words such as “believe,” “if,” “when,” “intended,” “should,” ”may”, “will,” and other similar words and include all statements with respect to the Company’s plans and expectations regarding its registration statement on Form S-3 and any potential future offering or capital raises and the use of proceeds therefrom. Because they are forward-looking, they should be evaluated in light of important risk factors and uncertainties. These risk factors and uncertainties are more fully described in Graham Corporation’s most recent Annual Report filed with the Securities and Exchange Commission (the “SEC”), included under the heading entitled “Risk Factors”, and in other reports filed with the SEC.
Should one or more of these risks or uncertainties materialize or should any of Graham Corporation’s underlying assumptions prove incorrect, actual results may vary materially from those currently anticipated. In addition, undue reliance should not be placed on Graham Corporation’s forward-looking statements. Except as required by law, Graham Corporation disclaims any obligation to update or publicly announce any revisions to any of the forward-looking statements contained in this news release.
Upcoming ISG Provider Lens™ report will evaluate providers offering a range of capabilities to improve the efficiency and agility of customers’ financial processes
STAMFORD, Conn.–(BUSINESS WIRE)– Information Services Group (ISG) (Nasdaq: III), a leading global technology research and advisory firm, has launched a research study examining outsourcing services that help enterprises improve their finance and accounting operations and business decision-making.
The study results will be published in a comprehensive ISG Provider Lens™ report, called Finance and Accounting Outsourcing Services (FAO), scheduled to be released in October. The report will cover the global market for services related to procurement, reporting, budgeting, financial planning and other functions.
Enterprise buyers will be able to use information from the report to evaluate their current vendor relationships, potential new engagements and available offerings, while ISG advisors use the information to recommend providers to the firm’s buy-side clients.
Cost reduction, enhanced speed and higher levels of accuracy continue to be the primary drivers of FAO. But as the sector has matured over the last decade, enterprises are expecting their providers to be more consultative and partner-oriented, while leveraging advanced technologies such as AI, machine learning, automation and, most recently, GenAI to deliver more impactful outcomes. Such technologies streamline processes and enable predictive analysis and sophisticated decision-making capabilities essential for strategic planning and competitive advantage.
“Enterprises are looking for FAO providers that act not just as service executors but as advisors and collaborators able to navigate and leverage the broader ecosystem of partners and industry experts,” said Namratha Dharshan, chief business leader, ISG Research. “Providers are expected to understand and align themselves with their customers’ long-term business objectives.”
ISG has distributed surveys to more than 40 finance and accounting outsourcing providers. Working in collaboration with ISG’s global advisors, the research team will produce four quadrants representing the finance and accounting outsourcing services the typical enterprise is buying, based on ISG’s experience working with its clients. The four quadrants are:
Procure to Pay (P2P), evaluating providers of services across the accounts payable process, including paying suppliers, reconciling accounts, tracking expenses and spending patterns and negotiating contracts. P2P providers use new technologies including AI and machine learning to automate processes and increase efficiency.
Order to Cash (O2C),assessing providers of end-to-end O2C operations, including processing customer orders, ensuring payments are received promptly, managing credit risk and providing customer support. Clients look to these partners to streamline operations, often through automation to reduce manual processes.
Record to Report (R2R), covering providers that manage clients’ financial record-keeping and reporting, including complex processes such as managing the end-of-period close process, preparing financial statements and assessing clients’ internal control systems.
Financial Planning and Analysis (FP&A), evaluating providers of high-end financial functions including budgeting, forecasting, financial planning and M&A. These providers act as partners to clients, delivering comprehensive and meaningful data and insights.
The report resulting from this study will cover the global finance and accounting outsourcing market. ISG analysts Gaurang Pagdi and Sneha Jayanth will serve as authors of the report.
A list of identified providers and vendors and further details on the study are available in this digital brochure. Companies not listed as finance and accounting outsourcing providers can contact ISG and ask to be included in the study.
All 2024 ISG Provider Lens™ evaluations feature expanded customer experience (CX) data that measures actual enterprise experience with specific provider services and solutions, based on ISG’s continuous CX research. Enterprise customers wishing to share their experience about a specific provider or vendor are encouraged to register here to receive a personalized survey URL. Participants will receive a copy of this report in return for their feedback.
About ISG Provider Lens™ Research
The ISG Provider Lens™ Quadrant research series is the only service provider evaluation of its kind to combine empirical, data-driven research and market analysis with the real-world experience and observations of ISG’s global advisory team. Enterprises will find a wealth of detailed data and market analysis to help guide their selection of appropriate sourcing partners, while ISG advisors use the reports to validate their own market knowledge and make recommendations to ISG’s enterprise clients. The research currently covers providers offering their services globally, across Europe, as well as in the U.S., Canada, Brazil, the U.K., France, Benelux, Germany, Switzerland, the Nordics, Australia and Singapore/Malaysia, with additional markets to be added in the future. For more information about ISG Provider Lens research, please visit this webpage.
About ISG
ISG (Information Services Group) (Nasdaq: III) is a leading global technology research and advisory firm. A trusted business partner to more than 800 clients, including more than 75 of the world’s top 100 enterprises, ISG is committed to helping corporations, public sector organizations, and service and technology providers achieve operational excellence and faster growth. The firm specializes in digital transformation services, including AI and automation, cloud and data analytics; sourcing advisory; managed governance and risk services; network carrier services; strategy and operations design; change management; market intelligence and technology research and analysis. Founded in 2006, and based in Stamford, Conn., ISG employs more than 1,300 digital-ready professionals operating in more than 20 countries—a global team known for its innovative thinking, market influence, deep industry and technology expertise, and world-class research and analytical capabilities based on the industry’s most comprehensive marketplace data. For more information, visit www.isg-one.com.
Jeremy Wensinger Appointed President and CEO, Succeeding Chuck Prow
MCLEAN, Va., May 13, 2024 /PRNewswire/ — V2X, Inc. (NYSE: VVX), a leading provider of global mission solutions, announced today that Jeremy Wensinger has been appointed President, Chief Executive Officer and a member of the company’s Board of Directors, succeeding Chuck Prow. This appointment, which is effective as of June 17, 2024, is the result of a thorough Board-led succession planning process designed to ensure a smooth transition and continue V2X’s positive business momentum.
Mr. Wensinger has had a highly distinguished 35-year career as a defense and government services industry executive. He most recently served as Chief Operating Officer of Peraton Inc., a next-generation national security company providing solutions and services primarily to the U.S. government with $7 billion in annual revenue. Mr. Wensinger previously served in various leadership roles at Harris Corporation, Cobham PLC, and PAE Government Services, Inc. Throughout his career, he has demonstrated strong leadership and organizational management in driving organic growth, implementing strong business development processes and differentiated technology strategies, executing business integrations, and leading business improvement initiatives.
“Following a thorough process to identify our next CEO, the Board is confident that Jeremy is a strong, experienced leader for V2X’s next chapter of growth,” said Mary Howell, Chairman of V2X’s Board of Directors. “He has a proven track record of delivering best-in-class financial and operational performance within the broad defense services and aerospace industry, as well as a strategic approach to managing businesses, building strong stakeholder relationships, and creating value.”
Mr. Wensinger said, “I am honored to join the V2X team as CEO. I look forward to building on the considerable growth and operating improvements V2X has made, while taking a fresh look at the areas of the business where we can further capitalize on the full potential of our market opportunity. I am eager to begin working with the Board, leadership, and talented V2X team to execute on our strategic and financial goals and drive shareholder value.”
“As the company nears the two-year anniversary of completing the transformational merger of Vectrus with Vertex to create the V2X platform, we thank Chuck for his dedication and valuable contributions,” Mrs. Howell said. “During his tenure as CEO, the company delivered significant organic growth as well as further diversified its contract and customer base, established entirely new technological and service capabilities, and delivered an enhanced customer and employee experience. We look forward to building upon these successes.”
“I would like to thank V2X’s employees, as well as our clients and industry partners, for their trust and confidence in the journey which is now V2X,” Mr. Prow said. “Leading the talented men and women of V2X, deployed globally in support of some of our nation’s most critical missions, has been an honor and privilege.”
About V2X
V2X builds smart solutions designed to integrate physical and digital infrastructure – by aligning people, actions, and outputs. Formed by the merger of Vectrus and Vertex, we bring a combined 120 years of successful mission support. Our lifecycle solutions improve security, streamline logistics, and enhance readiness. The Company delivers a comprehensive suite of integrated solutions across the operations and logistics, aerospace, training, and technology markets to national security, defense, civilian and international clients. Our global team of approximately 16,000 employees brings innovation to every point in the mission lifecycle, from preparation to operations, to sustainment, as it tackles the most complex challenges with agility, grit, and dedication.
Safe Harbor Statement
Safe Harbor Statement under the Private Securities Litigation Reform Act of 1995 (the “Act”): Certain material presented herein includes forward-looking statements intended to qualify for the safe harbor from liability established by the Act. These forward-looking statements include, but are not limited to, all the statements in this release that are not historical, including, without limitation, goals for future performance, results and value, our long-term growth outlook and targets and related assumptions and drivers, as well as the expected execution and effect of our business strategies, expectations regarding management transition plans, and any discussion of future operating or financial performance.
Forward-looking statements generally can be identified by the use of forward-looking terminology such as “may,” “will,” “expect,” “intent,” “estimate,” “anticipate,” “believe,” “could,” “potential,” “continue,” “can,” “goal,” “long-term,” “drive,” “next,” and variations of such words and or similar expressions and terminology. These statements are based on the beliefs and assumptions of the management of the Company based on information currently available to management.
These forward-looking statements are not guarantees of future performance, conditions, or results, and involve a number of known and unknown risks, uncertainties, assumptions, and other important factors, many of which are outside our management’s control, which could cause actual results to differ materially from the results discussed in the forward-looking statements. In addition, forward-looking statements are subject to certain risks and uncertainties that could cause actual results to differ materially from the Company’s historical experience and our present expectations or projections. For a discussion of some of the risks and uncertainties that could cause actual results to differ from such forward-looking statements, see the risks and other factors detailed from time to time in our Annual Report on Form 10-K, Quarterly Reports on Form 10-Q, and other filings with the SEC.
We do not undertake, and expressly disclaim, any duty or obligation to update publicly any forward-looking statement after the date of this release, whether as a result of new information, future events or otherwise, except as required by law.
Investor Contact Mike Smith, CFA Vice President, Treasury, Corporate Development and Investor Relations IR@goV2X.com 719-637-5773
Media Contact Angelica Spanos Deoudes Director, Corporate Communications Angelica.Deoudes@goV2X.com 571-338-5195
CALGARY AB, May 9, 2024 /CNW/ – InPlay Oil Corp. (TSX: IPO) (OTCQX: IPOOF) (“InPlay” or the “Company”) announces its financial and operating results for the three months ended March 31, 2024. InPlay’s condensed unaudited interim financial statements and notes, as well as Management’s Discussion and Analysis (“MD&A”) for the three months ended March 31, 2024 will be available at “www.sedarplus.ca” and our website at “www.inplayoil.com“. An updated presentation will soon be available on our website.
First Quarter 2024 Financial & Operating Results
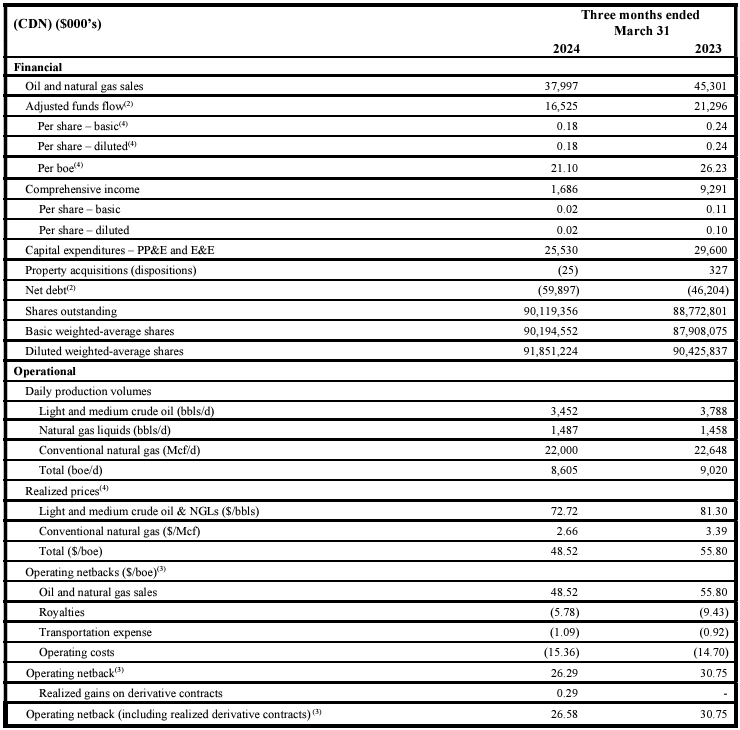
Achieved average quarterly production of 8,605 boe/d(1) (57% light crude oil and NGLs).
Generated strong quarterly AFF(2) of $16.5 million ($0.18 per basic share(3)).
Returned $4.1 million to shareholders through our monthly base dividend, representing an annual yield of 7.6% relative to quarter-end market capitalization. Since November 2022 InPlay has distributed $25.6 million in dividends, or $0.285 per share including dividends declared to date in 2024.
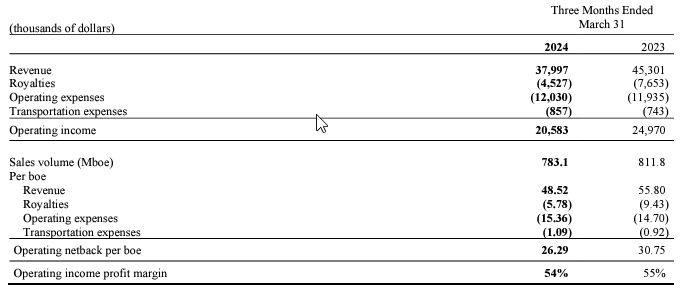
Realized a strong operating income profit margin of 54%.
Completed an active capital program investing $25.5 million to drill, complete and equip 8 (5.6 net) ERH Cardium wells in Pembina and Willesden Green. The majority of production from the program came fully onstream later in March and into April benefiting from April’s higher Edmonton Par price of $109.70/bbl compared to $92.12/bbl average for the first quarter. Current corporate production is approximately 9,350 boe/d(1) (60% light crude oil and NGLs) based on field estimates.
Outlook and Operations Update(5)
We are excited about our capital program for the remainder of the year and plan to drill and bring new production online in the third quarter of 2024 focused on high oil-weighted properties given the current low natural gas pricing environment. The oil-weighted production from new wells is expected to benefit from higher realized oil prices forecasted for the balance of the year as a result of West Texas Intermediate (“WTI”) improvements which started in April. In addition, the Mixed Sweet Blend (“MSW”) differential which was USD $8.65/bbl in Q1 2024 and is forecasted to average USD $3.65/bbl on futures pricing for the balance of the year with the commencement of flow on the Trans Mountain Pipeline expansion adding to takeaway capacity in Canada. InPlay’s second half drilling program is expected to start in June, or potentially July, with over 60% of our net wells for the year remaining to be drilled and brought on production. This activity is projected to lead to strong production rates and free adjusted funds flow (“FAFF”)(3) generation.
The Company looks forward to resuming development of a prolific area of Pembina previously restricted by third party gas plant capacity. In the first quarter, InPlay entered into a long-term Gas Handling Agreement which provides guaranteed access to natural gas processing capacity, allowing the Company to recommence development of this lucrative and strong rate of return growth area where InPlay has not drilled since the spring of 2022. These wells are characterized by strong oil rates similar to other Cardium oil wells while also benefitting from materially higher gas rates and lower overall production declines. InPlay plans to drill a three (3.0 net) extended reach horizontal (“ERH”) Cardium well pad in this area in the third quarter of 2024 with gas production expected to be sold into the stronger winter gas pricing season when forward pricing is approximately $3.45/mcf compared to current pricing of $1.70/mcf.
The Company is well positioned with strong momentum to build upon for the balance of the year as the majority of new production from the Company’s first quarter capital program came on-line in late March and early April. Minimal capital spending is planned for the second quarter, and the combination of higher average production with stronger realized oil prices which started in Q2 2024 is expected to result in significant FAFF generation and net debt reduction.
With the new wells coming on production in late March and early April, current corporate production is approximately 9,350 boe/d(1) (60% light crude oil and NGLs) based on field estimates. InPlay reiterates our 2024 annual average production guidance of 9,000 – 9,500 boe/d (59% – 61% light crude oil and NGLs) supported by strong current production rates and the majority of our wells coming on production in the second half of the year, including 3.0 net wells in our prolific Pembina play. The sustained improvement in WTI prices and a lower MSW differential since the release of our budget in late January results in an updated 2024 Adjusted Funds Flow (“AFF”)(2) forecast of $90 to $97 million based on USD $80 WTI for the remainder of the year, with estimated FAFF(3) of $23 to $33 million. The Company’s leverage metrics are projected to remain at levels which are among the lowest in our peer group. Net debt to EBITDA(3) is forecasted to be 0.4x – 0.5x for 2024 supporting the Company’s sustainable dividend and continued strategy of delivering returns to shareholders. The 2024 capital program will remain flexible and InPlay will revisit this program considering market and economic conditions through the remainder of the year.
Financial and Operating Results:
First Quarter 2024 Financial & Operations Overview:
InPlay completed an active capital program during the first quarter of 2024 consisting of $25.5 million of development capital which is approximately 40% of our capital budget for the year. The Company drilled two (1.9 net) ERH wells in Willesden Green which were brought on production in late February, with three (3.0 net) ERH wells in Pembina and two (0.3 net) non-operated Willesden Green ERH wells brought on production in late March. The Company also participated in one (0.35 net) non-operated Willesden Green ERH well which came on production in April. Drilling and completions operations were affected by cold weather and elevated industry activity limiting the availability of service providers resulting in new production coming on approximately three weeks later than anticipated. This delay however, resulted in new flush production coming on-line in a more favorable crude oil pricing environment with improved differentials resulting in materially higher Edmonton Par prices approximating CAD $109.70/bbl in April compared to CAD $92.12/bbl average for the first quarter.
The three (3.0 net) Pembina ERH wells drilled in the quarter came on production at the end of March and have exceeded internal expectations with average initial production (“IP”) rates per well of 275 boe/d(1) (86% light crude oil and NGLs) over their first 30 days and continue to produce at an average rate of 253 boe/d(1) (84% light crude oil and NGLs). These three wells offset five successful wells drilled in 2023 which have low decline rates and high light oil and liquids weightings contributing to our oil focused development strategy in 2024.
InPlay’s operations were impacted by an extreme cold snap in January including temperatures below -40°C for an extended period, which had not been experienced since 2004. The cold weather led to facility issues, low-rate wells freezing, a pipeline break, and an abnormally high number of producing wells going down and requiring servicing which took most of February to get back online. In aggregate, the impact to production for the quarter was approximately 340 boe/d (57% light crude oil and NGLs). In addition, non-operated downtime impacted production by approximately 115 boe/d in the quarter. Approximately half of this non-operated production has resumed and the majority of the remaining offline production is coming back online soon.
InPlay started a pilot optimization program in the quarter to lower pumps in older, low-rate horizontal oil wells to draw down pressure in the reservoir and increase inflows. The results have been positive to date with capital efficiency adds of approximately $6,000 per producing barrel. The Company has identified over 100 potential horizontal well candidates with pumps that can be lowered. The majority of future pump lowerings will occur as wells require servicing in the normal course of operations.
On behalf of our employees, management team and Board of Directors, we would like to thank our shareholders for their support and look forward to updating you on our progress throughout the year.
Reader Advisories
Non-GAAP and Other Financial Measures
Throughout this document and other materials disclosed by the Company, InPlay uses certain measures to analyze financial performance, financial position and cash flow. These non-GAAP and other financial measures do not have any standardized meaning prescribed under GAAP and therefore may not be comparable to similar measures presented by other entities. The non-GAAP and other financial measures should not be considered alternatives to, or more meaningful than, financial measures that are determined in accordance with GAAP as indicators of the Company performance. Management believes that the presentation of these non-GAAP and other financial measures provides useful information to shareholders and investors in understanding and evaluating the Company’s ongoing operating performance, and the measures provide increased transparency and the ability to better analyze InPlay’s business performance against prior periods on a comparable basis.
Non-GAAP Financial Measures and Ratios
Included in this document are references to the terms “free adjusted funds flow”, “operating income”, “operating netback per boe”, “operating income profit margin” and “Net Debt to EBITDA”. Management believes these measures and ratios are helpful supplementary measures of financial and operating performance and provide users with similar, but potentially not comparable, information that is commonly used by other oil and natural gas companies. These terms do not have any standardized meaning prescribed by GAAP and should not be considered an alternative to, or more meaningful than “profit before taxes”, “profit and comprehensive income”, “adjusted funds flow”, “capital expenditures”, “net debt”, or assets and liabilities as determined in accordance with GAAP as a measure of the Company’s performance and financial position.
Free Adjusted Funds Flow
Management considers FAFF an important measure to identify the Company’s ability to improve its financial condition through debt repayment and its ability to provide returns to shareholders. FAFF should not be considered as an alternative to or more meaningful than AFF as determined in accordance with GAAP as an indicator of the Company’s performance. FAFF is calculated by the Company as AFF less exploration and development capital expenditures and property dispositions (acquisitions) and is a measure of the cashflow remaining after capital expenditures before corporate acquisitions that can be used for additional capital activity, corporate acquisitions, repayment of debt or decommissioning expenditures or potentially return of capital to shareholders. Refer to the “Forward Looking Information and Statements” section for a calculation of forecast FAFF.
Operating Income/Operating Netback per boe/Operating Income Profit Margin
InPlay uses “operating income”, “operating netback per boe” and “operating income profit margin” as key performance indicators. Operating income is calculated by the Company as oil and natural gas sales less royalties, operating expenses and transportation expenses and is a measure of the profitability of operations before administrative, share-based compensation, financing and other non-cash items. Management considers operating income an important measure to evaluate its operational performance as it demonstrates its field level profitability. Operating income should not be considered as an alternative to or more meaningful than net income as determined in accordance with GAAP as an indicator of the Company’s performance. Operating netback per boe is calculated by the Company as operating income divided by average production for the respective period. Management considers operating netback per boe an important measure to evaluate its operational performance as it demonstrates its field level profitability per unit of production. Operating income profit margin is calculated by the Company as operating income as a percentage of oil and natural gas sales. Management considers operating income profit margin an important measure to evaluate its operational performance as it demonstrates how efficiently the Company generates field level profits from its sales revenue. Refer below for a calculation of operating income, operating netback per boe and operating income profit margin.
Net Debt to EBITDA
Management considers Net Debt to EBITDA an important measure as it is a key metric to identify the Company’s ability to fund financing expenses, net debt reductions and other obligations. EBITDA is calculated by the Company as adjusted funds flow before interest expense. When this measure is presented quarterly, EBITDA is annualized by multiplying by four. When this measure is presented on a trailing twelve month basis, EBITDA for the twelve months preceding the net debt date is used in the calculation. This measure is consistent with the EBITDA formula prescribed under the Company’s Senior Credit Facility. Net Debt to EBITDA is calculated as Net Debt divided by EBITDA. Refer to the “Forward Looking Information and Statements” section for a calculation of forecast Net Debt to EBITDA.
Capital Management Measures
Adjusted Funds Flow
Management considers adjusted funds flow to be an important measure of InPlay’s ability to generate the funds necessary to finance capital expenditures. Adjusted funds flow is a GAAP measure and is disclosed in the notes to the Company’s financial statements for the three months ended March 31, 2024. All references to adjusted funds flow throughout this document are calculated as funds flow adjusting for decommissioning expenditures. Decommissioning expenditures are adjusted from funds flow as they are incurred on a discretionary and irregular basis and are primarily incurred on previous operating assets. The Company also presents adjusted funds flow per share whereby per share amounts are calculated using weighted average shares outstanding consistent with the calculation of profit per common share.
Net Debt
Net debt is a GAAP measure and is disclosed in the notes to the Company’s financial statements for the three months ended March 31, 2024. The Company closely monitors its capital structure with the goal of maintaining a strong balance sheet to fund the future growth of the Company. The Company monitors net debt as part of its capital structure. The Company uses net debt (bank debt plus accounts payable and accrued liabilities less accounts receivables and accrued receivables, prepaid expenses and deposits and inventory) as an alternative measure of outstanding debt. Management considers net debt an important measure to assist in assessing the liquidity of the Company.
Supplementary Measures
“Average realized crude oil price” is comprised of crude oil commodity sales from production, as determined in accordance with IFRS, divided by the Company’s crude oil volumes. Average prices are before deduction of transportation costs and do not include gains and losses on financial instruments.
“Average realized NGL price” is comprised of NGL commodity sales from production, as determined in accordance with IFRS, divided by the Company’s NGL volumes. Average prices are before deduction of transportation costs and do not include gains and losses on financial instruments.
“Average realized natural gas price” is comprised of natural gas commodity sales from production, as determined in accordance with IFRS, divided by the Company’s natural gas volumes. Average prices are before deduction of transportation costs and do not include gains and losses on financial instruments.
“Average realized commodity price” is comprised of commodity sales from production, as determined in accordance with IFRS, divided by the Company’s volumes. Average prices are before deduction of transportation costs and do not include gains and losses on financial instruments.
“Adjusted funds flow per weighted average basic share” is comprised of adjusted funds flow divided by the basic weighted average common shares.
“Adjusted funds flow per weighted average diluted share” is comprised of adjusted funds flow divided by the diluted weighted average common shares.
“Adjusted funds flow per boe” is comprised of adjusted funds flow divided by total production.
Forward-Looking Information and Statements
This document contains certain forward–looking information and statements within the meaning of applicable securities laws. The use of any of the words “expect”, “anticipate”, “continue”, “estimate”, “may”, “will”, “project”, “should”, “believe”, “plans”, “intends”, “forecast” and similar expressions are intended to identify forward-looking information or statements. In particular, but without limiting the foregoing, this news release contains forward-looking information and statements pertaining to the following: the Company’s business strategy, milestones and objectives; the Company’s planned 2024 capital program including wells to be drilled and completed and the timing of the same including, without limitation, the timing of wells coming on production; 2024 guidance based on the planned capital program and all associated underlying assumptions set forth in this press release including, without limitation, forecasts of 2024 annual average production levels, adjusted funds flow, free adjusted funds flow, Net Debt/EBITDA ratio, operating income profit margin, and Management’s belief that the Company can grow some or all of these attributes and specified measures; light crude oil and NGLs weighting estimates including the expectation that the high light oil and liquids weighting will continue into 2024; expectations regarding future commodity prices; future oil and natural gas prices including the forecast that MSW differentials to WTI are forecasted to improve through 2024; future liquidity and financial capacity; future results from operations and operating metrics; future costs, expenses and royalty rates; future interest costs; the exchange rate between the $US and $Cdn; future development, exploration, acquisition, development and infrastructure activities and related capital expenditures, including our planned 2024 capital program; the amount and timing of capital projects; and methods of funding our capital program.
The internal projections, expectations, or beliefs underlying our Board approved 2024 capital budget and associated guidance are subject to change in light of, among other factors, the impact of world events including the Russia/Ukraine conflict and war in the Middle East, ongoing results, prevailing economic circumstances, volatile commodity prices, and changes in industry conditions and regulations. InPlay’s 2024 financial outlook and guidance provides shareholders with relevant information on management’s expectations for results of operations, excluding any potential acquisitions or dispositions, for such time periods based upon the key assumptions outlined herein. Readers are cautioned that events or circumstances could cause capital plans and associated results to differ materially from those predicted and InPlay’s guidance for 2024 may not be appropriate for other purposes. Accordingly, undue reliance should not be placed on same.
Forward-looking statements or information are based on a number of material factors, expectations or assumptions of InPlay which have been used to develop such statements and information but which may prove to be incorrect. Although InPlay believes that the expectations reflected in such forward-looking statements or information are reasonable, undue reliance should not be placed on forward-looking statements because InPlay can give no assurance that such expectations will prove to be correct. In addition to other factors and assumptions which may be identified herein, assumptions have been made regarding, among other things: the impact of increasing competition; the general stability of the economic and political environment in which InPlay operates; the timely receipt of any required regulatory approvals; the ability of InPlay to obtain qualified staff, equipment and services in a timely and cost efficient manner; drilling results; the ability of the operator of the projects in which InPlay has an interest in to operate the field in a safe, efficient and effective manner; the ability of InPlay to obtain debt financing on acceptable terms; the anticipated tax treatment of the monthly base dividend; the timing and amount of purchases under the Company’s NCIB; field production rates and decline rates; the ability to replace and expand oil and natural gas reserves through acquisition, development and exploration; the timing and cost of pipeline, storage and facility construction and the ability of InPlay to secure adequate product transportation; future commodity prices; that various conditions to a shareholder return strategy can be satisfied; the ongoing impact of the Russia/Ukraine conflict and war in the Middle East; currency, exchange and interest rates; regulatory framework regarding royalties, taxes and environmental matters in the jurisdictions in which InPlay operates; and the ability of InPlay to successfully market its oil and natural gas products.
Without limitation of the foregoing, readers are cautioned that the Company’s future dividend payments to shareholders of the Company, if any, and the level thereof will be subject to the discretion of the Board of Directors of InPlay. The Company’s dividend policy and funds available for the payment of dividends, if any, from time to time, is dependent upon, among other things, levels of FAFF, leverage ratios, financial requirements for the Company’s operations and execution of its growth strategy, fluctuations in commodity prices and working capital, the timing and amount of capital expenditures, credit facility availability and limitations on distributions existing thereunder, and other factors beyond the Company’s control. Further, the ability of the Company to pay dividends will be subject to applicable laws, including satisfaction of solvency tests under the Business Corporations Act (Alberta), and satisfaction of certain applicable contractual restrictions contained in the agreements governing the Company’s outstanding indebtedness.
The forward-looking information and statements included herein are not guarantees of future performance and should not be unduly relied upon. Such information and statements, including the assumptions made in respect thereof, involve known and unknown risks, uncertainties and other factors that may cause actual results or events to defer materially from those anticipated in such forward-looking information or statements including, without limitation: the continuing impact of the Russia/Ukraine conflict and war in the Middle East; inflation and the risk of a global recession; changes in our planned 2024 capital program; changes in our approach to shareholder returns; changes in commodity prices and other assumptions outlined herein; the risk that dividend payments may be reduced, suspended or cancelled; the potential for variation in the quality of the reservoirs in which we operate; changes in the demand for or supply of our products; unanticipated operating results or production declines; changes in tax or environmental laws, royalty rates or other regulatory matters; changes in development plans or strategies of InPlay or by third party operators of our properties; changes in our credit structure, increased debt levels or debt service requirements; inaccurate estimation of our light crude oil and natural gas reserve and resource volumes; limited, unfavorable or a lack of access to capital markets; increased costs; a lack of adequate insurance coverage; the impact of competitors; and certain other risks detailed from time-to-time in InPlay’s continuous disclosure documents filed on SEDAR including our Annual Information Form and our MD&A.
This press release contains future-oriented financial information and financial outlook information (collectively, “FOFI”) about InPlay’s financial and leverage targets and objectives, potential dividends, share buybacks and beliefs underlying our Board approved 2024 capital budget and associated guidance, all of which are subject to the same assumptions, risk factors, limitations, and qualifications as set forth in the above paragraphs. The actual results of operations of InPlay and the resulting financial results will likely vary from the amounts set forth in this press release and such variation may be material. InPlay and its management believe that the FOFI has been prepared on a reasonable basis, reflecting management’s reasonable estimates and judgments. However, because this information is subjective and subject to numerous risks, it should not be relied on as necessarily indicative of future results. Except as required by applicable securities laws, InPlay undertakes no obligation to update such FOFI. FOFI contained in this press release was made as of the date of this press release and was provided for the purpose of providing further information about InPlay’s anticipated future business operations and strategy. Readers are cautioned that the FOFI contained in this press release should not be used for purposes other than for which it is disclosed herein.
The forward-looking information and statements contained in this news release speak only as of the date hereof and InPlay does not assume any obligation to publicly update or revise any of the included forward-looking statements or information, whether as a result of new information, future events or otherwise, except as may be required by applicable securities laws.
Risk Factors to FLI
Risk factors that could materially impact successful execution and actual results of the Company’s 2024 capital program and associated guidance and estimates include:
volatility of petroleum and natural gas prices and inherent difficulty in the accuracy of predictions related thereto;
the extent of any unfavourable impacts of wildfires in the province of Alberta.
changes in Federal and Provincial regulations;
the Company’s ability to secure financing for the Board approved 2024 capital program and longer-term capital plans sourced from AFF, bank or other debt instruments, asset sales, equity issuance, infrastructure financing or some combination thereof; and
those additional risk factors set forth in the Company’s MD&A and most recent Annual Information Form filed on SEDAR
Key Budget and Underlying Material Assumptions to FLI
The Company’s 2024 guidance remains the same as previously released January 29, 2024 except as noted below. The key budget and underlying material assumptions used by the Company in the development of its 2024 guidance are as follows:
LOS ANGELES, May 10, 2024 (GLOBE NEWSWIRE) — Today Brian Hennigan of Hueston Hennigan LLP, Counsel for FAT Brands Inc., issued the following statement:
“Today FAT Brands was informed that it has been indicted on two violations of SOX 402 for arranging approximately $2.65 million in loans to Andy Wiederhorn.
These charges are unprecedented, unwarranted, unsubstantiated, and unjust. They are based on conduct that ended over three years ago and ignore the Company’s cooperation with the investigation.
FAT Brands will take all necessary action to defend itself, while seeking a just resolution to these charges. Since becoming a public company, FAT Brands has grown to at a remarkable pace to encompass 18 brands with $2.5 billion in global sales and 2,300 locations worldwide, benefitting franchisees and investors alike. The Company will continue executing on its operating plans and growth strategy.”
About FAT (Fresh. Authentic. Tasty.) Brands FAT Brands (NASDAQ: FAT) is a leading global franchising company that strategically acquires, markets and develops fast casual, casual and polished casual dining restaurant concepts around the world. The Company currently owns 18 restaurant brands: Round Table Pizza®, Fatburger, Marble Slab Creamery, Johnny Rockets, Fazoli’s, Twin Peaks, Great American Cookies, Smokey Bones, Hot Dog on a Stick, Buffalo’s Cafe & Express, Hurricane Grill & Wings, Native Grill & Wings, Pretzelmaker, Elevation Burger, Yalla Mediterranean and Ponderosa and Bonanza Steakhouses, and franchises and owns over 2,300 units worldwide. For more information on FAT Brands, please visit http://www.fatbrands.com.
Information Services Group Announces First-Quarter 2024 Results
Reports first-quarter GAAP revenues of $64 million
Reports first-quarter net loss of $3.4 million, GAAP loss per share of $0.07 and adjusted net income per share of $0.01
Reports first-quarter adjusted EBITDA of $4 million
Generates $2.3 million of cash from operations
Declares second-quarter dividend of $0.045 per share, payable July 5, 2024, to shareholders of record as of June 14, 2024
Sets second-quarter guidance: revenues between $65 million and $67 million and adjusted EBITDA between $7.0 million and $8.0 million
STAMFORD, Conn.–(BUSINESS WIRE)– Information Services Group (ISG) (Nasdaq: III), a leading global technology research and advisory firm, today announced its financial results for the first quarter ended March 31, 2024.
“As anticipated, we saw market uncertainty impact the broader global technology industry during the first quarter,” said Michael P. Connors, chairman and CEO. “With that said, our opportunity pipeline is growing, so we believe the worst is behind us. We see the market turning and gaining momentum over the course of the year.”
Connors said clients slowed their pace of spending and generally have been taking longer to decide on new investments, as they weigh economic conditions and wait to see how AI shapes the technology landscape before committing to major new initiatives.
“As the market transitions from the planning to the execution phase of AI, there will be significant investments in infrastructure and implementation,” Connors said. “Additionally, we see a notable increase in demand for cost and spend transformation, as companies continue to adapt to uncertain macroeconomic conditions. Early indicators, such as a rise in sourcing activity, suggest the demand environment is evolving and will accelerate going forward.”
Connors also said ISG is encouraged by the continuing growth of its recurring revenue business. “Demand for our research, governance and platforms continues, as clients seek market intelligence and governance solutions to shape their future investment decisions,” Connors said. “Our next-gen sourcing platform, ISG Tango™, launched in March, has been well-received, with over $2.6 billion of contract value already running on the platform.”
Connors noted that recurring revenues represented about half of the firm’s revenues in the first quarter and totaled $126 million for the trailing 12 months, up 10 percent from the previous 12-month period.
First-Quarter 2024 Results
Reported revenues for the first quarter were $64.3 million, down 18 percent from $78.5 million in the prior year’s first quarter. Reported revenues were $40.8 million in the Americas, down 16 percent; $17.8 million in Europe, down 23 percent; and $5.6 million in Asia Pacific, down 20 percent, all versus the prior year.
ISG reported a first-quarter operating loss of $2.4 million, compared with operating income of $7.1 million in the prior year. The firm’s reported first-quarter net loss was $3.4 million, compared with net income of $3.5 million in the prior year. Loss per fully diluted share was $0.07, compared with income per fully diluted share of $0.07 in the prior year.
Adjusted net income (a non-GAAP measure defined below under “Non-GAAP Financial Measures”) for the first quarter was $0.7 million, or $0.01 per share on a fully diluted basis, compared with adjusted net income of $6.0 million, or $0.12 per share on a fully diluted basis, in the prior year’s first quarter.
First-quarter adjusted EBITDA (a non-GAAP measure defined below under “Non-GAAP Financial Measures”) was $4.4 million, down 60 percent from the prior-year first quarter. Adjusted EBITDA margin (a non-GAAP measure calculated by dividing adjusted EBITDA by reported revenues) was 6.9 percent, compared with 14.0 percent in the prior year.
Other Financial and Operating Highlights
ISG generated $2.3 million of cash from operations in the first quarter, compared with using $3.4 million of cash in the first quarter last year. The firm’s cash balance totaled $14.0 million at March 31, 2024, down from $22.6 million at December 31, 2023.
During the first quarter, ISG paid dividends of $2.4 million, repurchased $2.5 million of shares and paid down debt of $5.0 million. As of March 31, 2024, ISG had $74.2 million in debt outstanding, down from $79.2 million at the end of last year.
2024 Second-Quarter Revenue and Adjusted EBITDA Guidance
“For the second quarter, ISG is targeting revenues of between $65 million and $67 million and adjusted EBITDA of between $7.0 million and $8.0 million. We will continue to monitor the macroeconomic environment, including the impact of FX, inflation and other factors, and adjust our business plans accordingly,” said Connors.
Quarterly Dividend
The ISG Board of Directors declared a second-quarter dividend of $0.045 per share, payable on July 5, 2024, to shareholders of record as of June 14, 2024.
“ISG remains committed to a disciplined capital allocation strategy that includes reinvesting in our business, managing our debt, returning capital to shareholders in the form of dividends and share repurchases, and supplementing our organic growth with strategic acquisitions to drive long-term shareholder value,” Connors said.
Conference Call
ISG has scheduled a call for 9 a.m., U.S. Eastern Time, Friday, May 10, 2024, to discuss the firm’s first-quarter results. The call can be accessed by dialing +1 (800) 715-9871, or, for international callers, by dialing +1 (646) 307-1963. The access code is 7294332. A recording of the conference call will be accessible on ISG’s website (www.isg-one.com ) for approximately four weeks following the call.
Forward-Looking Statements
This communication contains “forward-looking statements” which represent the current expectations and beliefs of management of ISG concerning future events and their potential effects. Statements contained herein including words such as “anticipate,” “believe,” “contemplate,” “plan,” “estimate,” “target,” “expect,” “intend,” “will,” “continue,” “should,” “may,” and other similar expressions are “forward-looking statements” under the Private Securities Litigation Reform Act of 1995. These forward-looking statements are not guarantees of future results and are subject to certain risks and uncertainties that could cause actual results to differ materially from those anticipated. Those risks relate to inherent business, economic and competitive uncertainties and contingencies relating to the businesses of ISG and its subsidiaries, including without limitation: (1) failure to secure new engagements or loss of important clients; (2) ability to hire and retain enough qualified employees to support operations; (3) ability to maintain or increase billing and utilization rates; (4) management of growth; (5) success of expansion internationally; (6) competition; (7) ability to move the product mix into higher margin businesses; (8) general political and social conditions such as war, political unrest and terrorism; (9) healthcare and benefit cost management; (10) ability to protect ISG and its subsidiaries’ intellectual property or data and the intellectual property or data of others; (11) currency fluctuations and exchange rate adjustments; (12) ability to successfully consummate or integrate strategic acquisitions; (13) outbreaks of diseases, including coronavirus, or similar public health threats or fear of such an event; and (14) potential terminations of engagements, delays or reductions in scope by clients. Certain of these and other applicable risks, cautionary statements and factors that could cause actual results to differ from ISG’s forward-looking statements are included in ISG’s filings with the U.S. Securities and Exchange Commission. ISG undertakes no obligation to update or revise any forward-looking statements to reflect subsequent events or circumstances.
Non-GAAP Financial Measures
ISG reports all financial information required in accordance with U.S. generally accepted accounting principles (GAAP). In this release, ISG has presented both GAAP financial results as well as non-GAAP information for the three months ended March 31, 2024, and March 31, 2023. ISG believes that evaluating its ongoing operating results will be enhanced if it discloses certain non-GAAP information. These non-GAAP financial measures exclude non-cash and certain other special charges that many investors believe may obscure the user’s overall understanding of ISG’s current financial performance and the Company’s prospects for the future. ISG believes that these non-GAAP measures provide useful information to investors because they improve the comparability of the financial results between periods and provide for greater transparency of key measures used to evaluate the Company’s performance.
ISG provides adjusted EBITDA (defined as net income, plus interest, taxes, depreciation and amortization, foreign currency transaction gains/losses, non-cash stock compensation, interest accretion associated with contingent consideration, acquisition-related costs, and severance, integration and other expense), adjusted net income (defined as net income, plus amortization of intangible assets, non-cash stock compensation, foreign currency transaction gains/losses, interest accretion associated with contingent consideration, acquisition-related costs, write-off of deferred financing cost and severance, integration and other expense on a tax-adjusted basis), adjusted net income per diluted share, adjusted EBITDA margin, and selected financial data on a constant currency basis which are non-GAAP measures that the Company believes provide useful information to both management and investors by excluding certain expenses and financial implications of foreign currency translations, which management believes are not indicative of ISG’s core operations. These non-GAAP measures are used by ISG to evaluate the Company’s business strategies and management’s performance.
We evaluate our results of operations on both an as reported and a constant currency basis. The constant currency presentation, which is a non-GAAP financial measure, excludes the impact of year-over-year fluctuations in foreign currency exchange rates. We believe providing constant currency information provides valuable supplemental information regarding our results of operations, thereby facilitating period-to-period comparisons of our business performance, and is consistent with how management evaluates the Company’s performance. We calculate constant currency percentages by converting our current and prior periods’ local currency financial results using the same point in time exchange rates and then comparing the adjusted current and prior period results. This calculation may differ from similarly titled measures used by others and, accordingly, the constant currency presentation is not meant to be a substitution for recorded amounts presented in conformity with GAAP, nor should such amounts be considered in isolation.
Management believes this information facilitates comparison of underlying results over time. Non-GAAP financial measures, when presented, are reconciled to the most closely applicable GAAP measure. Non-GAAP measures are provided as additional information and should not be considered in isolation or as a substitute for results prepared in accordance with GAAP. A reconciliation of the forward-looking non-GAAP estimates contained herein to the corresponding GAAP measures is not being provided, due to the unreasonable efforts required to prepare it.
About ISG
ISG (Information Services Group) (Nasdaq: III) is a leading global technology research and advisory firm. A trusted business partner to more than 900 clients, including more than 75 of the world’s top 100 enterprises, ISG is committed to helping corporations, public sector organizations, and service and technology providers achieve operational excellence and faster growth. The firm specializes in digital transformation services, including AI and automation, cloud and data analytics; sourcing advisory; managed governance and risk services; network carrier services; strategy and operations design; change management; market intelligence and technology research and analysis. Founded in 2006, and based in Stamford, Conn., ISG employs 1,600 digital-ready professionals operating in more than 20 countries—a global team known for its innovative thinking, market influence, deep industry and technology expertise, and world-class research and analytical capabilities based on the industry’s most comprehensive marketplace data. For more information, visit www.isg-one.com.
ESCONDIDO, Calif., May 09, 2024 (GLOBE NEWSWIRE) — One Stop Systems, Inc. (“OSS” or the “Company”) (Nasdaq: OSS), a leader in rugged Enterprise Class compute for artificial intelligence (AI), machine learning (ML) and sensor processing at the edge, reported results for the first quarter ended March 31, 2024. All quarterly comparisons are to the same year-ago period unless otherwise noted.
“Over the past year, we have focused on transitioning our business away from legacy media and niche enterprise customers to pursue emerging opportunities within large and growing defense and commercial markets,” stated OSS President and CEO, Mike Knowles. “While we expect the transition to take a couple more quarters to complete, I am encouraged by our performance during the 2024 first quarter, as consolidated revenue, bookings, gross margin, and EBITDA met or exceeded our plan. This is a testament to the focus we have employed and the investments we have made over the past year within our sales and product teams, and the diverse sales pipeline we are building. I want to thank everyone at OSS for their continued hard work during the quarter.”
“As we look to the remainder of 2024, we are excited by the long-term strategies we are pursuing to scale our business and drive profitable growth. Our OSS segment ended the first quarter with a book-to-bill ratio of 1.1 and we anticipate positive order trends will continue throughout the remainder of the year as our growing pipeline successfully converts to orders. In addition, we continue to focus on improving working capital efficiencies. Our efforts in the quarter generated $2.0 million of operating cash flow, increasing net cash and short-term investments by over $1 million from December 31, 2023. While certain market challenges in the short term may impact our second quarter results, we are focused on successfully returning to year-over-year revenue growth in the second half of 2024 and positive consolidated EBITDA in the coming quarters,” concluded Mr. Knowles.
First Quarter Operating and Customer Momentum
Won a pilot project to provide a liquid immersion-cooled data storage system for use on a deployable ground station. The project has begun, and is expected to lead to follow-on production orders in the coming quarters.
Received an order from an existing customer to design and manufacture a new ruggedized Liquid Cooling System for cooling self-driving technology in a commercial autonomous truck deployment. The initial order was valued at $300,000 for prototypes, and OSS expects to begin shipments later this year, with an additional order to follow this year.
Started shipping its latest Gen 5 4U Pro Accelerator System to a large composable infrastructure provider and expects shipments of this compute accelerator to total between $4 million and $6 million over the next three years.
Craig Powell, a proven sales executive bringing over 20 years of experience within international defense and C5ISR market verticals, joined the Company as Business Development Executive.
2024 First Quarter Financial Summary
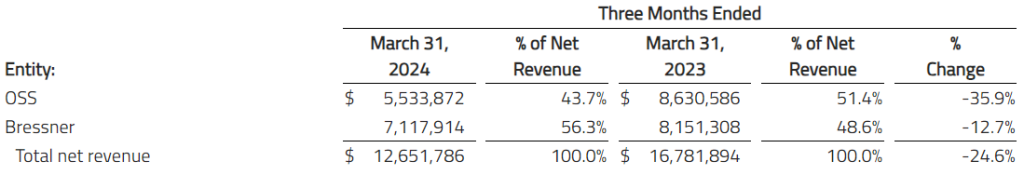
Consolidated revenue was $12.7 million, a 24.6% decline from the prior year period. The year-over-year reduction in revenue was primarily a result of quarterly order fluctuations from a large defense customer and approximately $1.5 million related to a former media customer. Lower first-quarter revenue was partially offset by approximately $1.9 million in incremental revenue to an existing aerospace customer, and $0.6 million in additional revenue to an existing autonomous truck customer. Bressner segment revenue was $7.1 million, a 12.7% decline from the prior year period, primarily due to the expected discontinuance of and delays in certain programs.
The following table sets forth net revenue by product category for the three months ended March 31, 2024, and March 31, 2023, by segment:
Gross margin percentage was 29.4%, as compared to 30.2% in the same year-ago quarter. OSS segment gross margin was 34.2%, a reduction of 2.1 percentage points from the same period a year ago, primarily due to a less profitable mix of revenue. Bressner gross margin improved 1.9 percentage points to 25.7%, primarily due to a more favorable mix of revenue.
Total operating expenses decreased 5.4% to $5.0 million. This decrease was predominantly attributable to the elimination of costs associated with organizational restructuring and outside professional services, as well as reduced R&D expenses, partially offset by higher marketing and selling expenses during the quarter.
OSS reported a net loss of $1.3 million, or $0.06 per share, as compared to a net loss of $401,000, or $0.02 per share in the prior year. The Company reported a non-GAAP net loss of $931,000, or $0.04 per share, compared to non-GAAP net income of $90,000, or $0.00 per diluted share.
Adjusted EBITDA, a non-GAAP metric, was a loss of $456,000, a decrease from adjusted EBITDA of $633,000 in the prior year first quarter.
As of March 31, 2024, OSS reported cash and short-term investments of $12.9 million, and total working capital of $34.3 million, compared to cash and short-term investments of $11.8 million, and total working capital of $35.6 million at December 31, 2023.
Outlook
The Company anticipates revenue of approximately $13.0 million in the second quarter of 2024. The Company’s revenue guidance for the second quarter of 2024 includes expected program delays from certain defense customers as a result of the prolonged U.S. government budgeting process and continuing resolution for fiscal year 2024, and softer European customer demand over the near-term.
While the Company expects revenue in the second quarter will be down on a year-over-year basis, management anticipates sequential revenue growth throughout the year. This will be supported by a continued positive book-to-bill ratio, as OSS executes on converting its growing opportunity pipeline. In addition, European demand is expected to improve in the second half of 2024, and higher bookings in the Company’s core OSS business is expected to support year-over-year revenue growth and positive consolidated EBITDA in the coming quarters.
Conference Call
OSS will hold a conference call to discuss its results for the first quarter of 2024 followed by a question-and-answer period.
Date: Thursday, May 9, 2024 Time: 5:00 p.m. ET (2:00 p.m. PT) Toll-free dial-in: 800-901-2707 International dial-in: 785-424-1629 Conference ID: ONESTOP (required for entry) Webcast: https://viavid.webcasts.com/starthere.jsp?ei=1667836&tp_key=45b15714d0
A replay of the call will be available after 8:00 p.m. ET on May 9, 2024, through May 23, 2024.
Toll-free replay: 844-512-2921 International replay: 412-317-6671 Passcode: 11155784
About One Stop Systems
One Stop Systems, Inc. (Nasdaq: OSS) is a leader in AI enabled solutions for the demanding ‘edge’. OSS designs and manufactures Enterprise Class compute and storage products that enable rugged AI, sensor fusion and autonomous capabilities without compromise. These hardware and software platforms bring the latest data center performance to harsh and challenging applications, whether they are on land, sea or in the air.
OSS products include ruggedized servers, compute accelerators, flash storage arrays, and storage acceleration software. These specialized compact products are used across multiple industries and applications, including autonomous trucking and farming, as well as aircraft, drones, ships and vehicles within the defense industry.
OSS solutions address the entire AI workflow, from high-speed data acquisition to deep learning, training and large-scale inference, and have delivered many industry firsts for industrial OEM and government customers.
As the fastest growing segment of the multi-billion-dollar edge computing market, AI enabled solutions require-and OSS delivers-the highest level of performance in the most challenging environments without compromise.
OSS products are available directly or through global distributors. For more information, go to www.onestopsystems.com. You can also follow OSS on X, YouTube, and LinkedIn.
Non-GAAP Financial Measures
We believe that the use of adjusted earnings before interest, taxes, depreciation and amortization, or adjusted EBITDA, is helpful for an investor to assess the performance of the Company. The Company defines adjusted EBITDA as income (loss) before interest, taxes, depreciation, amortization, acquisition expenses, impairment of long-lived assets, financing costs, fair value adjustments from purchase accounting, stock-based compensation expense and expenses related to discontinued operations.
Adjusted EBITDA is not a measurement of financial performance under generally accepted accounting principles in the United States, or GAAP. Because of varying available valuation methodologies, subjective assumptions and the variety of equity instruments that can impact a company’s non-cash operating expenses, we believe that providing a non-GAAP financial measure that excludes non-cash and non-recurring expenses allows for meaningful comparisons between our core business operating results and those of other companies, as well as providing us with an important tool for financial and operational decision making and for evaluating our own core business operating results over different periods of time.
Our adjusted EBITDA measure may not provide information that is directly comparable to that provided by other companies in our industry, as other companies in our industry may calculate non-GAAP financial results differently, particularly related to non-recurring, unusual items. Our adjusted EBITDA is not a measurement of financial performance under GAAP and should not be considered as an alternative to operating income or as an indication of operating performance or any other measure of performance derived in accordance with GAAP. We do not consider adjusted EBITDA to be a substitute for, or superior to, the information provided by GAAP financial results.
HOUSTON, May 09, 2024 (GLOBE NEWSWIRE) — Orion Group Holdings, Inc. (NYSE: ORN) (the “Company”), a leading specialty construction company, today announced a significant contract award valued at nearly $80 million for its Marine construction business. The contract was awarded by Port Everglades Seaport Engineering & Construction Division through Moss Construction as Managing General Contractor for the Port Everglades Bulkhead Replacement Project – Group 1, a pivotal infrastructure upgrade at one of the nation’s busiest ports. Orion has supported Port Everglades and worked with Moss successfully on previous projects.
Orion Group Holdings won the Port Everglades Bulkhead Replacement Project award through a competitive bid process. The scope of work includes the replacement of approximately 2,240 linear feet of aging steel sheet pile bulkheads, including large diameter combi-wall systems, soil anchors and encapsulated concrete caps. In addition, the project will address the aging North Bulkhead at the Entrance Channel (NBEC), which spans 1,200 feet and is vital for the safe and smooth flow of maritime traffic. The project is set to commence June 1 and will conclude in late 2026.
“We are excited to continue our relationship with Moss and the Port Everglades Seaport Engineering & Construction Division by delivering this critical marine project that will modernize and strengthen the Port’s capabilities. With our deep marine construction expertise, we look forward to supporting port business into the future,” said Travis Boone, Chief Executive Officer of Orion Group Holdings, Inc. “This project not only reinforces our commitment to maintaining the highest standards of maritime infrastructure but also ensures Port Everglades continues to serve as a critical hub for the world-class cruise industry and the growing international cargo and petroleum business.”
Orion Group Holdings, Inc. is a renowned name in specialty construction, known for its dedication to safety, quality, innovation, and timely project execution. With these new contract awards, Orion continues to strengthen its position as an industry leader capable of tackling complex projects with unmatched expertise.
About Orion Group Holdings
Orion Group Holdings, Inc., a leading specialty construction company serving the infrastructure, industrial and building sectors, provides services both on and off the water in the continental United States, Alaska, Hawaii, Canada and the Caribbean Basin through its marine segment and its concrete segment. The Company’s marine segment provides construction and dredging services relating to marine transportation facility construction, marine pipeline construction, marine environmental structures, dredging of waterways, channels and ports, environmental dredging, design and specialty services. Its concrete segment provides turnkey concrete construction services including place and finish, site prep, layout, forming, and rebar placement for large commercial, structural and other associated business areas. The Company is headquartered in Houston, Texas with regional offices throughout its operating areas. The Company’s website is located at: https://www.oriongroupholdingsinc.com.
Forward-Looking Statements
The matters discussed in this press release may constitute or include projections or other forward-looking statements within the meaning of the “safe harbor” provisions of Section 27A of the Securities Exchange Act of 1933, as amended, and Section 21E of the Securities Exchange Act of 1934, as amended, of which provisions the Company is availing itself. Certain forward-looking statements can be identified by the use of forward-looking terminology, such as ‘believes’, ‘expects’, ‘may’, ‘will’, ‘could’, ‘should’, ‘seeks’, ‘approximately’, ‘intends’, ‘plans’, ‘estimates’, or ‘anticipates’, or the negative thereof or other comparable terminology, or by discussions of strategy, plans, objectives, intentions, estimates, forecasts, outlook, assumptions, or goals. In particular, statements regarding future operations or results, including those set forth in this press release, and any other statement, express or implied, concerning future operating results or the future generation of or ability to generate revenues, income, net income, gross profit, EBITDA, Adjusted EBITDA, Adjusted EBITDA margin, or cash flow, including to service debt or maintain compliance with debt covenants, and including any estimates, forecasts or assumptions regarding future revenues or revenue growth, are forward-looking statements. Forward-looking statements also include project award announcements, estimated project start dates, anticipated revenues, and contract options which may or may not be awarded in the future. Forward-looking statements involve risks, including those associated with the Company’s fixed price contracts that impacts profits, unforeseen productivity delays that may alter the final profitability of the contract, cancellation of the contract by the customer for unforeseen reasons, delays or decreases in funding by the customer, levels and predictability of government funding or other governmental budgetary constraints, and any potential contract options which may or may not be awarded in the future, and are at the sole discretion of award by the customer. Past performance is not necessarily an indicator of future results. Considering these and other uncertainties, the inclusion of forward-looking statements in this press release should not be regarded as a representation by the Company that the Company’s plans, estimates, forecasts, goals, intentions, or objectives will be achieved or realized. Readers are cautioned not to place undue reliance on these forward-looking statements, which speak only as of the date hereof. The Company assumes no obligation to update information contained in this press release whether as a result of new developments or otherwise, except as required by law.
Please refer to the Company’s 2023 Annual Report on Form 10-K, filed on March 1, 2024 which is available on its website at www.oriongroupholdingsinc.com or at the SEC’s website at www.sec.gov, for additional and more detailed discussion of risk factors that could cause actual results to differ materially from our current expectations, estimates or forecasts.
Seanergy Maritime Announces the Date for the First Quarter Ended March 31, 2024 Financial Results, Conference Call and Webcast
Earnings Release: Wednesday, May 15, 2024, Before Market Open in New York Conference Call and Webcast: Wednesday, May 15, 2024, at 10:00 a.m. Eastern Time
May 9, 2024 – Glyfada, Greece – Seanergy Maritime Holdings Corp. (the “Company” or “Seanergy”) (NASDAQ: SHIP) announced today that it will release its financial results for the first quarter ended March 31, 2024, prior to the open of the market in New York on Wednesday, May 15, 2024.
Seanergy’s senior management will conduct a conference call and simultaneous Internet webcast to review these results on Wednesday, May 15, 2024 at 10:00 a.m. Eastern Time.
Audio Webcast:
There will be a live, and then archived, webcast of the conference call available through the Company’s website. To listen to the archived audio file, visit our website, following the Webcast & Presentations section under our Investor Relations page. Participants to the live webcast should register on the Seanergy website approximately 10 minutes prior to the start of the webcast, by following this link.
Conference Call Details:
Participants have the option to register for the call using the following link. You can use any number from the list or add your phone number and let the system call you right away.
About Seanergy Maritime Holdings Corp.
Seanergy Maritime Holdings Corp. is a prominent pure-play Capesize ship-owner publicly listed in the U.S. Seanergy provides marine dry bulk transportation services through a modern fleet of Capesize vessels. The Company’s operating fleet consists of 17 vessels (1 Newcastlemax and 16 Capesize) with an average age of approximately 13.2 years and an aggregate cargo carrying capacity of approximately 3,054,820 dwt. Upon the completion of the delivery of our latest acquisitions, the Company’s operating fleet will consist of 19 vessels (1 Newcastlemax and 18 Capesize) with an aggregate cargo carrying capacity of approximately 3,417,608 dwt.
The Company is incorporated in the Marshall Islands and has executive offices in Glyfada, Greece. The Company’s common shares trade on the Nasdaq Capital Market under the symbol “SHIP”.
$800 MillionFacility Strengthens Financial Position By Providing More Attractive Credit Terms & Flexibility Preserving Strong Liquidity Position
Extends Facility Maturity Date to May 2029
BOCA RATON, Fla.–(BUSINESS WIRE)–May 9, 2024–
The ODP Corporation (NASDAQ:ODP) (“ODP,” or the “Company”), a leading provider of business services, products and digital workplace technology solutions to businesses and consumers, today announced that it has amended and extended its existing asset-based credit facility. The amendment extends the maturity date to May 2029. The renewed $800 million facility includes certain more attractive credit terms and conditions, enhancing the company’s balance sheet and liquidity position to support future growth.
“The extension of our credit facility is a validation of our strong financial position and business model,” said Gerry Smith, chief executive officer of The ODP Corporation. “I want to thank our syndicate members for their strong support of our business and to our commitment to driving operational excellence throughout the enterprise.”
“The successful renewal of our asset-based credit facility includes improved credit terms and conditions, and extends our maturity, providing ample liquidity to manage our growth and capital allocation plans,” said Tim Perrott, vice president, investor relations and treasurer of The ODP Corporation. “We are thrilled to have the continued support of our financial partners as we continue to pursue our strategic objectives.”
The renewed credit facility was significantly oversubscribed with strong lender support, providing additional financial flexibility to grow the business and to enhance returns for shareholders.
About The ODP Corporation The ODP Corporation (NASDAQ:ODP) is a leading provider of products and services through an integrated business-to-business (B2B) distribution platform and omnichannel presence, which includes world-class supply chain and distribution operations, dedicated sales professionals, a B2B digital procurement solution, online presence and a network of Office Depot and OfficeMax retail stores. Through its operating companies Office Depot, LLC; ODP Business Solutions, LLC; Veyer, LLC; and Varis, Inc., The ODP Corporation empowers every business, professional, and consumer to achieve more every day. For more information, visit theodpcorp.com.
ODP and ODP Business Solutions are trademarks of ODP Business Solutions, LLC. Office Depot is a trademark of The Office Club, LLC. OfficeMax is a trademark of OMX, Inc. Veyer is a trademark of Veyer, LLC. Varis is a trademark of Varis, Inc. Grand&Toy is a trademark of Grand & Toy, LLC in Canada. Any other product or company names mentioned herein are the trademarks of their respective owners.
Q1 operating earnings of $26.8 million, or up 34% on an adjusted basis
Q1 revenue down following sale of European staffing operations; down 2.6% on an organic basis
Q1 adjusted EBITDA margin increased 110 basis points to 3.2% driven by meaningful reduction in operating expenses resulting from business transformation initiatives and sale of European staffing operations
Company expects further expansion of EBITDA margin from the planned Q2 2024 acquisition of Motion Recruitment Partners, LLC (“MRP”) and ongoing transformation actions
TROY, Mich., May 09, 2024 (GLOBE NEWSWIRE) — Kelly (Nasdaq: KELYA, KELYB), a leading specialty talent solutions provider, today announced results for the first quarter of 2024.
Peter Quigley, president and chief executive officer, announced revenue for the first quarter of 2024 totaled $1.05 billion, a 17.6% decrease, compared to the corresponding quarter of 2023 resulting primarily from the sale of the company’s European staffing operations on January 2, 2024. Excluding the impact of the sale of the European staffing operations, revenue declined 2.6% on an organic basis reflecting the continuing impact of customers’ more guarded approach to hiring and initiating new projects or capital spending.
Kelly reported operating earnings in the first quarter of 2024 of $26.8 million, compared to earnings of $10.7 million reported in the first quarter of 2023. Earnings in the first quarter of 2024 include an $11.6 million gain on the sale of our European staffing operations and $7.9 million of charges related to transformation actions and the sale of our European staffing operations. Excluding those charges, adjusted earnings were $23.1 million in the first quarter of 2024. Earnings in the first quarter of 2023 included $6.6 million of restructuring charges and adjusted earnings from operations were $17.3 million. The European staffing operations were break even on an adjusted basis in the first quarter of 2023. Excluding the impact of the sale in both periods, 2024 adjusted earnings improved primarily as a result of lower selling, general and administrative expenses, partially offset by lower revenue and unfavorable business mix and lower permanent placement fees which resulted in lower gross profit.
Earnings per share in the first quarter of 2024 were $0.70 compared to earnings per share of $0.29 in the first quarter of 2023. Included in earnings per share in the first quarter of 2024 were a gain on sale and gain on forward contract, net of tax, of $0.31 partially offset by restructuring and transaction-related charges, net of tax, of $0.17. Included in the earnings per share in the first quarter of 2023 is a $0.13 per share restructuring charge, net of tax. On an adjusted basis, earnings per share were $0.56 in the first quarter of 2024, an improvement from $0.42 per share in the corresponding quarter of 2023.
On May 3, Kelly announced that it had entered into a definitive agreement to acquire MRP and expects the transaction to close in the second quarter of 2024.
“In the first quarter, we continued making progress on our journey to accelerate profitable growth notwithstanding continued macroeconomic uncertainty and industry headwinds. Our ongoing growth and efficiency initiatives increased Kelly’s adjusted EBITDA margin to 3.2% – a significant improvement of 110 basis points over the prior year and well above the company’s recent average,” said Quigley. “Our more streamlined and profitable portfolio of businesses is poised to realize additional benefits from the transformational acquisition of MRP. When completed in the second quarter, this acquisition will strengthen Kelly’s scale and capabilities and meaningfully increase market share across several key areas, which in turn creates exciting opportunities for future revenue growth and additional EBITDA margin expansion.”
Kelly also reported that on May 7, its board of directors declared a dividend of $0.075 per share. The dividend is payable on June 4, 2024, to stockholders of record as of the close of business on May 20, 2024.
In conjunction with its first-quarter earnings release, Kelly has published a financial presentation on the Investor Relations page of its public website and will host a conference call at 9 a.m. ET on May 9 to review the results and answer questions. The call may be accessed in one of the following ways:
Via the Telephone (877) 692-8955 (toll free) or (234) 720-6979 (caller paid) Enter access code 5728672 After the prompt, please enter “#”
A recording of the conference call will be available after 1:30 p.m. ET on May 9, 2024, at (866) 207-1041 (toll-free) and (402) 970-0847 (caller-paid). The access code is 1646639#. The recording will also be available at kellyservices.com during this period.
This release contains statements that are forward looking in nature and, accordingly, are subject to risks and uncertainties. These statements are made under the “safe harbor” provisions of the U.S. Private Securities Litigation Reform Act of 1995. Statements that are not historical facts, including statements about Kelly’s financial expectations, are forward-looking statements. Factors that could cause actual results to differ materially from those contained in this release include, but are not limited to, (i) changing market and economic conditions, (ii) disruption in the labor market and weakened demand for human capital resulting from technological advances, loss of large corporate customers and government contractor requirements, (iii) the impact of laws and regulations (including federal, state and international tax laws), (iv) unexpected changes in claim trends on workers’ compensation, unemployment, disability and medical benefit plans, (v) litigation and other legal liabilities (including tax liabilities) in excess of our estimates, (vi) our ability to achieve our business’s anticipated growth strategies, (vii) our future business development, results of operations and financial condition, (viii) damage to our brands, (ix) dependency on third parties for the execution of critical functions, (x) conducting business in foreign countries, including foreign currency fluctuations, (xi) availability of temporary workers with appropriate skills required by customers, (xii) cyberattacks or other breaches of network or information technology security, and (xiii) other risks, uncertainties and factors discussed in this release and in the Company’s filings with the Securities and Exchange Commission. In some cases, forward-looking statements can be identified by words or phrases such as “may,” “will,” “expect,” “anticipate,” “target,” “aim,” “estimate,” “intend,” “plan,” “believe,” “potential,” “continue,” “is/are likely to” or other similar expressions. All information provided in this press release is as of the date of this press release and we undertake no duty to update any forward-looking statement to conform the statement to actual results or changes in the Company’s expectations.
About Kelly®
Kelly Services, Inc. (Nasdaq: KELYA, KELYB) helps companies recruit and manage skilled workers and helps job seekers find great work. Since inventing the staffing industry in 1946, we have become experts in the many industries and local and global markets we serve. With a network of suppliers and partners around the world, we connect more than 500,000 people with work every year. Our suite of outsourcing and consulting services ensures companies have the people they need, when and where they are needed most. Headquartered in Troy, Michigan, we empower businesses and individuals to access limitless opportunities in industries such as science, engineering, technology, education, manufacturing, retail, finance, and energy. Revenue in 2023 was $4.8 billion. Learn more at kellyservices.com.
Higher Occupancy Propels Strong Quarterly Financial Performance Capital Strategy Highlights Include Significant Share Buyback and Debt Refinancing in Quarter
BRENTWOOD, Tenn., May 08, 2024 (GLOBE NEWSWIRE) — CoreCivic, Inc. (NYSE: CXW) (the Company) announced today its financial results for the first quarter of 2024. Damon T. Hininger, CoreCivic’s President and Chief Executive Officer, commented, “CoreCivic experienced a strong first quarter of 2024. Propelled by 75.2% occupancy – our highest level since the first quarter of 2020 – CoreCivic generated sturdy margins and year-over-year growth in our key metrics. Revenue increased 9% versus the first quarter of 2023, with Federal, State, and Local revenues all increasing, and our cost-management initiatives also contributed to our favorable results.”
Commenting on capital market activities for the quarter, Hininger added, “In addition to the strong quarterly financial results, we are equally pleased with the continued progress we have made on our capital structure initiatives. During the quarter, we repurchased 2.7 million shares of our common stock for $39.4 million – an acceleration over recent quarters. Also, during the quarter, we successfully issued $500 million of new senior unsecured notes, effectively refinancing and extending the term of our existing debt by roughly three years at the same rate as the senior unsecured notes that we issued in 2021, when interest rates were much lower. Even with those activities, we ended the quarter with leverage, measured as net debt to Adjusted EBITDA, at 2.7x for the trailing twelve months – placing us, for the first time, within our target leverage range of 2.25x to 2.75x that we established in August 2020. This is a significant accomplishment, and we are proud of the strategy, focus, and discipline that led us here.”
“We are thankful for our many partners. Our federal, state, and local government partners continue to trust the essential solutions CoreCivic provides, and we renewed the eight contracts that were up for renewal during the quarter – following a year in which we renewed all of the 34 contracts up for renewal. We are also thankful to our financial partners for their ongoing support, including of our recent debt refinancing.”
Financial Highlights – First Quarter 2024
Total revenue of $500.7 million
CoreCivic Safety revenue of $457.7 million
CoreCivic Community revenue of $29.9 million
CoreCivic Properties revenue of $13.0 million
Net income of $9.5 million; Adjusted net income of $27.9 million
Diluted earnings per share of $0.08
Adjusted Diluted EPS of $0.25
Normalized FFO per diluted share of $0.46
Adjusted EBITDA of $89.5 million
First Quarter 2024 Financial Results Compared With First Quarter 2023
Net income in the first quarter of 2024 was $9.5 million, or $0.08 per diluted share, compared with net income in the first quarter of 2023 of $12.4 million, or $0.11 per diluted share. However, when adjusted for special items, adjusted net income for the first quarter of 2024 improved to $27.9 million, or $0.25 per diluted share (Adjusted Diluted EPS), compared with adjusted net income in the first quarter of 2023 of $14.7 million, or $0.13 per diluted share. Special items for each period are presented in detail in the calculation of Adjusted Diluted EPS in the Supplemental Financial Information following the financial statements presented herein and, most notably, included $27.2 million of expenses associated with debt repayments and refinancing transactions in the first quarter of 2024.
The increased adjusted per share amounts resulted from higher federal, state, and local populations, particularly at our facilities serving U.S. Immigration & Customs Enforcement (ICE), combined with lower interest expense and a decrease in shares outstanding, both resulting from our capital allocation strategy. These earnings increases were partially offset by the expiration of our lease with the Oklahoma Department of Corrections (ODC) at our North Fork Correctional Facility on June 30, 2023.
Our labor attraction and retention initiatives continue to generate positive results. The costs of registry nursing, temporary labor resources, including associated travel expenses, overtime and incentives, declined meaningfully from the prior year quarter as well as sequentially.
Revenue from ICE, our largest partner, increased significantly versus the same quarter of 2023, when Title-42 restrictions were still in effect, and ICE revenue was essentially flat versus the fourth quarter of 2023. Under Title 42, which ended May 11, 2023, asylum-seekers and anyone crossing the border without proper documentation or authority were denied entry at the United States border to contain the spread of COVID-19. During the three months ended March 31, 2024, revenue from ICE was $153.8 million compared to $130.7 million during the three months ended March 31, 2023.
Earnings before interest, taxes, depreciation and amortization (EBITDA) was $62.8 million in the first quarter of 2024. Adjusted EBITDA, which excludes special items, was $89.5 million in the first quarter of 2024, compared with $73.7 million in the first quarter of 2023. The increase in Adjusted EBITDA was attributable to an increase in occupancy, combined with a general reduction in temporary staffing incentives and related labor costs, partially offset by the expiration of the lease with the ODC at the North Fork facility.
Funds From Operations (FFO) for the first quarter of 2024 was $33.9 million. Normalized FFO, which excludes special items, increased to $52.6 million, or $0.46 per diluted share, in the first quarter of 2024, compared with $38.9 million, or $0.34 per diluted share, in the first quarter of 2023, representing an increase in Normalized FFO per share of 35%. Normalized FFO was impacted by the same factors that affected Adjusted EBITDA, further improved by a reduction in interest expense resulting from our debt reduction strategy that is not reflected in Adjusted EBITDA, as well as a 2% reduction in weighted average shares outstanding compared with the prior year quarter.
Adjusted Net Income, EBITDA, Adjusted EBITDA, FFO, and Normalized FFO, and, where appropriate, their corresponding per share amounts, are measures calculated and presented on the basis of methodologies other than in accordance with generally accepted accounting principles (GAAP). Please refer to the Supplemental Financial Information and the note following the financial statements herein for further discussion and reconciliations of these measures to net income, the most directly comparable GAAP measure.
Business Updates
Share Repurchases. On May 12, 2022, our Board of Directors approved a share repurchase program authorizing the Company to repurchase up to $150.0 million of our common stock. On August 2, 2022, our Board of Directors authorized an increase in our share repurchase program of up to an additional $75.0 million in shares of our common stock, or a total of up to $225.0 million. During the three months ended March 31, 2024, we repurchased 2.7 million shares of our common stock at an aggregate purchase price of $39.4 million, excluding fees, commissions and other costs related to the repurchases. Since the share repurchase program was authorized, through March 31, 2024, we have repurchased a total of 12.8 million shares at an aggregate price of $152.0 million, or $11.87 per share, excluding fees, commissions and other costs related to the repurchases.
As of March 31, 2024, we had $73.0 million remaining under the share repurchase program. Additional repurchases of common stock will be made in accordance with applicable securities laws and may be made at management’s discretion within parameters set by the Board of Directors from time to time in the open market, through privately negotiated transactions, or otherwise. The share repurchase program has no time limit and does not obligate us to purchase any particular amount of our common stock. The authorization for the share repurchase program may be terminated, suspended, increased or decreased by our Board of Directors in its discretion at any time.
Debt Refinancing. On March 12, 2024, we announced the completion of an underwritten registered public offering of $500 million aggregate principal amount of 8.250% senior unsecured notes due 2029 (the 2029 Notes). The net proceeds from the offering of the 2029 Notes, amounting to $490.3 million, together with borrowings under our revolving credit facility and cash on hand, were used to fund the tender offering for, and subsequent redemption of, the 8.250% senior unsecured notes due 2026 (the 2026 Notes), which had an outstanding principal balance of $593.1 million. Note holders with an aggregate principal amount of $494.3 million, or 83.3% of the aggregate principal amount of the 2026 Notes then-outstanding, tendered their notes by the expiration date on March 11, 2024, and on April 15, 2024, we redeemed the remaining $98.8 million principal balance outstanding.
California City Correctional Center. As previously disclosed, the lease with the California Department of Corrections and Rehabilitation at our 2,560-bed California City Correctional Center expired on March 31, 2024, and was not renewed. The facility was idled effective April 1, 2024. Rental revenue at this facility was $8.5 million and $31.1 million for the three months ended March 31, 2024 and twelve months ended December 31, 2023, respectively. Facility net operating income at the facility was $7.2 million and $25.5 million for the three months ended March 31, 2024 and the twelve months ended December 31, 2023, respectively. As a result, although we are marketing the facility to potential customers, we expect per share results to decline by approximately $0.06 per share during the second quarter of 2024 compared with the first quarter of 2024, and by approximately $0.15 to $0.16 per share for the year ended December 31, 2024 compared with the year ended December 31, 2023. The impact of this lease expiration has been, and continues to be, included in our 2024 financial guidance.
2024 Financial Guidance
Based on current business conditions, we are providing the following updated financial guidance for the full year 2024:
New Guidance Full Year 2024
Prior Guidance Full Year 2024
– Net income
$52.7 million to $63.7 million
$65.0 million to $80.0 million¹
– Adjusted net income
$74.0 million to $85.0 million
$65.0 million to $80.0 million
– Diluted EPS
$0.47 to $0.57
$0.58 to $0.72¹
– Adjusted Diluted EPS
$0.66 to $0.76
$0.58 to $0.72
– FFO per diluted share
$1.36 to $1.46
$1.46 to $1.61¹
– Normalized FFO per diluted share
$1.56 to $1.66
$1.46 to $1.61
– EBITDA
$281.1 million to $290.1 million
$300.3 million to $313.3 million¹
– Adjusted EBITDA
$312.0 million to $321.0 million
$300.3 million to $313.3 million
¹ Prior guidance did not include the aforementioned $27.2 million of expenses associated with debt repayments and refinancing transactions incurred during the first quarter of 2024.
During 2024, we expect to invest $70.0 million to $76.0 million in capital expenditures, consisting of $30.0 million to $31.0 million in maintenance capital expenditures on real estate assets, $32.0 million to $35.0 million for maintenance capital expenditures on other assets and information technology, and $8.0 million to $10.0 million for other capital investments.
Supplemental Financial Information and Investor Presentations
We have made available on our website supplemental financial information and other data for the first quarter of 2024. Interested parties may access this information through our website at http://ir.corecivic.com/ under “Financial Information” of the Investors section. We do not undertake any obligation and disclaim any duties to update any of the information disclosed in this report.
Management may meet with investors from time to time during the second quarter of 2024. Written materials used in the investor presentations will also be available on our website beginning on or about May 21, 2024. Interested parties may access this information through our website at http://ir.corecivic.com/ under “Events & Presentations” of the Investors section.
Conference Call, Webcast and Replay Information
We will host a webcast conference call at 10:00 a.m. central time (11:00 a.m. eastern time) on Thursday, May 9, 2024, which will be accessible through the Company’s website at www.corecivic.com under the “Events & Presentations” section of the “Investors” page. To participate via telephone and join the call live, please register in advance here https://register.vevent.com/register/BIa41ba53918294659afa34f33febf12cc. Upon registration, telephone participants will receive a confirmation email detailing how to join the conference call, including the dial-in number and a unique passcode.
About CoreCivic
CoreCivic is a diversified, government-solutions company with the scale and experience needed to solve tough government challenges in flexible, cost-effective ways. We provide a broad range of solutions to government partners that serve the public good through high-quality corrections and detention management, a network of residential and non-residential alternatives to incarceration to help address America’s recidivism crisis, and government real estate solutions. We are the nation’s largest owner of partnership correctional, detention and residential reentry facilities, and one of the largest prison operators in the United States. We have been a flexible and dependable partner for government for over 40 years. Our employees are driven by a deep sense of service, high standards of professionalism and a responsibility to help government better the public good. Learn more at www.corecivic.com.
Forward-Looking Statements
This press release contains statements as to our beliefs and expectations of the outcome of future events that are “forward-looking” statements within the meaning of Section 21E of the Securities Exchange Act of 1934, as amended, and the Private Securities Litigation Reform Act of 1995, as amended. These forward-looking statements are subject to risks and uncertainties that could cause actual results to differ materially from the statements made. These include, but are not limited to, the risks and uncertainties associated with: (i) changes in government policy, legislation and regulations that affect utilization of the private sector for corrections, detention, and residential reentry services, in general, or our business, in particular, including, but not limited to, the continued utilization of our correctional and detention facilities by the federal government, including as a consequence of the United States Department of Justice not renewing contracts as a result of President Biden’s Executive Order on Reforming Our Incarceration System to Eliminate the Use of Privately Operated Criminal Detention Facilities, impacting utilization primarily by the United States Federal Bureau of Prisons and the United States Marshals Service, and the impact of any changes to immigration reform and sentencing laws (we do not, under longstanding policy, lobby for or against policies or legislation that would determine the basis for, or duration of, an individual’s incarceration or detention); (ii) our ability to obtain and maintain correctional, detention, and residential reentry facility management contracts because of reasons including, but not limited to, sufficient governmental appropriations, contract compliance, negative publicity and effects of inmate disturbances; (iii) changes in the privatization of the corrections and detention industry, the acceptance of our services, the timing of the opening of new facilities and the commencement of new management contracts (including the extent and pace at which new contracts are utilized), as well as our ability to utilize available beds; (iv) general economic and market conditions, including, but not limited to, the impact governmental budgets can have on our contract renewals and renegotiations, per diem rates, and occupancy; (v) fluctuations in our operating results because of, among other things, changes in occupancy levels; competition; contract renegotiations or terminations; inflation and other increases in costs of operations, including a continuing rise in labor costs; fluctuations in interest rates and risks of operations; (vi) government budget uncertainty, the impact of the debt ceiling and the potential for government shutdowns and changing budget priorities; (vii) our ability to successfully identify and consummate future development and acquisition opportunities and realize projected returns resulting therefrom; (viii) our ability to have met and maintained qualification for taxation as a real estate investment trust, or REIT, for the years we elected REIT status; and (ix) the availability of debt and equity financing on terms that are favorable to us, or at all. Other factors that could cause operating and financial results to differ are described in the filings we make from time to time with the Securities and Exchange Commission.
We take no responsibility for updating the information contained in this press release following the date hereof to reflect events or circumstances occurring after the date hereof or the occurrence of unanticipated events or for any changes or modifications made to this press release or the information contained herein by any third-parties, including, but not limited to, any wire or internet services, except as may be required by law.