CULVER CITY, Calif., Aug. 13, 2024 (GLOBE NEWSWIRE) — Snail, Inc. (NASDAQ: SNAL) (“Snail” or “the Company”), a leading, global independent developer and publisher of interactive digital entertainment, today announced financial results for its second quarter ended June 30, 2024.
Tony Tian, Co-Chief Executive Officer commented, “I’m honored to lead Snail alongside an amazing team as we continue to build upon the company’s incredible legacy of innovation and creativity. Our unwavering passion for delivering exceptional gaming experiences, as showcased by the phenomenal launch of ARK: Survival Ascended, will continue to propel Snail to future successes and victories. Looking ahead, we are excited to expand the reach of our premium mods and introduce new content that will delight our growing community of players worldwide.”
Second Quarter 2024 Highlights:
ARK: Survival Ascended and ARK: Survival Evolved
On October 25, 2023, the Company launched its flagship remake of the ARK franchise leveraging Unreal Engine 5’s stunning graphics and introduced a game-altering cross-platform modding system, ushering in a new era of creativity.
In the three and six months ended June 30, 2024, ARK: Survival Evolved and ARK: Survival Ascended combined for an average total of 218,241 and 213,690 daily active users (“DAUs”) on the Steam and Epic platforms, respectively, as compared to 240,522 and 258,235 in the three and six months ended June 30, 2023, respectively.
Through June 30, 2024, our ARK franchise game has been played for 3.7 billion hours with an average playing time per user of 161 hours and with the top 21.1% of all players spending over 100 hours in the game, according to data from the Steam platform.
Since its launch, ARK: Survival Ascended sold approximately 2.5 million units and has an average of 108,515 daily active users (“DAUs”) with a peak of 307,875 DAUs.
ARK: Survival Evolved averaged a total of approximately 131,927 DAUs and sold approximately 0.5 million units in the second quarter of 2024.
In the second quarter of 2024, the Company successfully launched Bellwright, a medieval survival game, Bob’s Tall Tales DLC for ARK: Survival Ascended and the Power Rangers premium mod for ARK: Survival Ascended . Furthermore, a full-size DLC expansion, Scorched Earth, was made available to all ARK: Survival Ascended owners.
Net revenue for the three months ended June 30, 2024 was $21.6 million compared to $9.9 million in the three months ended June 30, 2023. The increase in net revenue was due to an increase in total Ark sales of $10.0 million, an increase in sales of the Company’s other games of $3.9 million driven by the release of Bellwright, partially offset by a decrease in Ark Mobile sales of $0.3 million and an increase in deferred revenue of $1.9 million related to the Ark franchise.
Net income for the three months ended June 30, 2024 was $2.3 million compared to a net loss of $4.1 million for the three months ended June 30, 2023. The improvement in net income is due to an increase in net revenue of $11.7 million, decreased general and administrative expenses of $1.2 million, and an increase in total other income (expense) of $0.5 million, partially offset by increased research and development expenses of $0.7 million, increased advertising and marketing expenses of $0.5 million, increased costs of revenue of $4.2 million and a decrease in benefit from income taxes of $1.7 million.
Bookings for the three months ended June 30, 2024 was $22.9 million as compared to $9.3 million for the three months ended June 30, 2023, the increase was primarily due to the release of ARK: Survival Ascended in the fourth quarter of 2023, and the release of Bobs Tall Tales and Bellwright along with the ARK: Survival Ascended DLC, Scorched Earth in April 2024. In addition to increased net sales of the aforementioned titles, the Company deferred approximately $7.1 million in revenue during the three months ended June 30, 2024 for the ARK: Survival Ascended DLC’s and parts of Bobs Tall Tales which have not yet released; partially offset by the recognition of $5.6 million for the release of Scorched Earth.
Earnings before interest, taxes, depreciation and amortization (“EBITDA”) for the three months ended June 30, 2024 was $3.1 million compared to a loss of $4.8 million in the prior year period. The increase was due to the improvement in net income of $6.4 million and a decrease in the benefit from income taxes of $1.7 million.
As of June 30, 2024, unrestricted cash was $15.5 million.
Use of Non-GAAP Financial Measures
In addition to the financial results determined in accordance with U.S. generally accepted accounting principles, or GAAP, Snail believes Bookings and EBITDA, as non-GAAP measures, are useful in evaluating its operating performance. Bookings and EBITDA are non-GAAP financial measures that are presented as supplemental disclosures and should not be construed as alternatives to net income (loss) or revenue as indicators of operating performance, nor as alternatives to cash flow provided by operating activities as measures of liquidity, both as determined in accordance with GAAP. Snail supplementally presents Bookings and EBITDA because they are key operating measures used by management to assess financial performance. Bookings adjusts for the impact of deferrals and, Snail believes, provides a useful indicator of sales in a given period. EBITDA adjusts for items that Snail believes do not reflect the ongoing operating performance of its business, such as certain non-cash items, unusual or infrequent items or items that change from period to period without any material relevance to its operating performance. Management believes Bookings and EBITDA are useful to investors and analysts in highlighting trends in Snail’s operating performance, while other measures can differ significantly depending on long-term strategic decisions regarding capital structure, the tax jurisdictions in which Snail operates and capital investments.
Bookings is defined as the net amount of products and services sold digitally or physically in the period. Bookings is equal to revenue, excluding the impact from deferrals. Below is a reconciliation of total net revenue to Bookings, the closest GAAP financial measure.
Net sales of $49.2 million; up 25.3% year-over-year driven by volume growth of Lifeway Kefir
19th consecutive quarter of year-over-year growth
MORTON GROVE, Ill., Aug. 13, 2024 /PRNewswire/ — Lifeway Foods, Inc. (Nasdaq: LWAY) (“Lifeway” or “the Company”), a leading U.S. supplier of kefir and fermented probiotic products to support the microbiome, today reported financial results for the second quarter ended June 30, 2024.
“Our incredible momentum continued in the second quarter as we delivered our 19th consecutive quarter of net sales growth and our 5th consecutive quarter breaking the Lifeway record on the topline,” commented Julie Smolyansky, President and Chief Executive Officer of Lifeway Foods. “Our record net sales of $49.2 million were up more than 25% year-over-year, driven by continued volume growth in our flagship Lifeway drinkable kefir. Demand for bioavailable foods like Lifeway Kefir and Farmer Cheese is soaring and our customers further demonstrated their loyalty to our premium, healthy offerings. Notably, we delivered nearly $50 million in net sales, a remarkable milestone that we look forward to surpassing, and we also outperformed our previous quarterly sales record by more than 10%. Our amazing results on the topline demonstrate the effectiveness of our sales and marketing investments at driving trial, capturing new customers and accelerating velocities of our core products. Accompanying the very strong, volume-led topline growth, we continued to enhance our profitability profile with solid gross margins and strong net income growth, a testament to the seamless operational execution of our whole Lifeway team. We are thrilled with our results in the first half of 2024, and will continue to strategically invest behind the Lifeway brand to drive velocities, win new customers and position ourself to deliver more outstanding performances through the second half of this year and beyond.”
Second Quarter 2024 Results
Net sales were $49.2 million for the second quarter ended June 30, 2024, an increase of $10.0 million or 25.3% from the same period in 2023. The net sales increase was primarily driven by higher volumes of our branded drinkable kefir.
Gross profit as a percentage of net sales was 27.0% for the second quarter ended June 30, 2024.
Selling, general and administrative expenses as a percentage of net sales were 15.8% for the second quarter ended June 30, 2024.
The Company reported net income of $3.8 million or $0.26 per basic and $0.25 per diluted common share for the second quarter ended June 30, 2024 compared to net income of $3.2 million or $0.22 per basic and $0.21 per diluted common share during the same period in 2023.
Conference Call and Webcast A pre-recorded conference call and webcast with Julie Smolyansky discussing these results with additional comments and details is available through the “Investor Relations” section of the Company’s website at https://lifewaykefir.com/webinars-reports/ and will also be available for replay.
About Lifeway Foods, Inc. Lifeway Foods, Inc., which has been recognized as one of Forbes’ Best Small Companies, is America’s leading supplier of the probiotic, fermented beverage known as kefir. In addition to its line of drinkable kefir, the company also produces a variety of cheeses and a ProBugs line for kids. Lifeway’s tart and tangy fermented dairy products are now sold across the United States, Mexico, Ireland and France. Learn how Lifeway is good for more than just you at lifewayfoods.com.
Forward-Looking Statements
This release (and oral statements made regarding the subjects of this release) contains “forward-looking statements” as defined in the Private Securities Litigation Reform Act of 1995 regarding, among other things, future operating and financial performance, product development, market position, business strategy and objectives. These statements use words, and variations of words, such as “continue,” “build,” “future,” “increase,” “drive,” “believe,” “look,” “ahead,” “confident,” “deliver,” “outlook,” “expect,” and “predict.” Other examples of forward-looking statements may include, but are not limited to, (i) statements of Company plans and objectives, including the introduction of new products, or estimates or predictions of actions by customers or suppliers, (ii) statements of future economic performance, and (III) statements of assumptions underlying other statements and statements about Lifeway or its business. You are cautioned not to rely on these forward-looking statements. These statements are based on current expectations of future events and thus are inherently subject to uncertainty. If underlying assumptions prove inaccurate or known or unknown risks or uncertainties materialize, actual results could vary materially from Lifeway’s expectations and projections. These risks, uncertainties, and other factors include: price competition; the decisions of customers or consumers; the actions of competitors; changes in the pricing of commodities; the effects of government regulation; possible delays in the introduction of new products; and customer acceptance of products and services. A further list and description of these risks, uncertainties, and other factors can be found in Lifeway’s Annual Report on Form 10-K for the fiscal year ended December 31, 2023, and the Company’s subsequent filings with the SEC. Copies of these filings are available online at https://www.sec.gov, http://lifewaykefir.com/investor-relations/, or on request from Lifeway. Information in this release is as of the dates and time periods indicated herein, and Lifeway does not undertake to update any of the information contained in these materials, except as required by law. Accordingly, YOU SHOULD NOT RELY ON THE ACCURACY OF ANY OF THE STATEMENTS OR OTHER INFORMATION CONTAINED IN ANY ARCHIVED PRESS RELEASE.
Media: Derek Miller Vice President of Communications, Lifeway Foods Email: derekm@lifeway.net
General inquiries: Lifeway Foods, Inc. Phone: 847-967-1010 Email: info@lifeway.net
NEW YORK, August 12, 2024 /PRNewswire/ — Bit Digital, Inc. (Nasdaq: BTBT) (“Bit Digital” or the “Company”), a sustainable platform for digital assets and artificial intelligence (“AI”) infrastructure headquartered in New York, announced today that it will release its Second Quarter 2024 results on Monday, August 19, 2024, after the stock market closes. Senior management will host a live webcast and conference call to review the results on Tuesday, August 20, 2024, at 10 a.m. ET.
To register for the earnings call, please click here. Additionally, participants can join the conference call by dialing 1-800-289-0459 (passcode: 633917).
The Company will issue a press release regarding Second Quarter 2024 earnings prior to the conference call. The press release will be posted on the Bit Digital website at www.bit-digital.com.
About Bit Digital
Bit Digital, Inc. is a sustainable platform for digital assets and artificial intelligence (“AI”) infrastructure headquartered in New York City. Our bitcoin mining operations are located in the US, Canada, and Iceland. For additional information, please contact ir@bit-digital.com or visit our website at www.bit-digital.com.
Investor Notice
Investing in our securities involves a high degree of risk. Before making an investment decision, you should carefully consider the risks, uncertainties and forward-looking statements described under “Risk Factors” in Item 3.D of our most recent Annual Report on Form 20-F for the fiscal year ended December 31, 2023. If any material risk was to occur, our business, financial condition or results of operations would likely suffer. In that event, the value of our securities could decline and you could lose part or all of your investment. The risks and uncertainties we describe are not the only ones facing us. Additional risks not presently known to us or that we currently deem immaterial may also impair our business operations. In addition, our past financial performance may not be a reliable indicator of future performance, and historical trends should not be used to anticipate results in the future. Future changes in the network-wide mining difficulty rate or bitcoin hash rate may also materially affect the future performance of Bit Digital’s production of bitcoin. Actual operating results will vary depending on many factors including network difficulty rate, total hash rate of the network, the operations of our facilities, the status of our miners, and other factors.
Safe Harbor Statement
This press release may contain certain “forward-looking statements” relating to the business of Bit Digital, Inc., and its subsidiary companies. All statements, other than statements of historical fact included herein are “forward-looking statements.” These forward-looking statements are often identified by the use of forward-looking terminology such as “believes,” “expects,” or similar expressions, involving known and unknown risks and uncertainties. Although the Company believes that the expectations reflected in these forward-looking statements are reasonable, they do involve assumptions, risks and uncertainties, and these expectations may prove to be incorrect. Investors should not place undue reliance on these forward-looking statements, which speak only as of the date of this press release. The Company’s actual results could differ materially from those anticipated in these forward-looking statements as a result of a variety of factors, including those discussed in the Company’s periodic reports that are filed with the Securities and Exchange Commission and available on its website at http://www.sec.gov. All forward-looking statements attributable to the Company or persons acting on its behalf are expressly qualified in their entirety by these factors. Other than as required under the securities laws, the Company does not assume a duty to update these forward-looking statements.
Company delivers 66% year-over-year revenue growth with record profitability at new plant, raises full year guidance
Secured ~3,000 orders, including first tank car conversion order
CHICAGO, Aug. 12, 2024 (GLOBE NEWSWIRE) — FreightCar America, Inc. (NASDAQ: RAIL) (“FreightCar America” or the “Company”), a diversified manufacturer and supplier of railroad freight cars, railcar parts and components, today reported results for the second quarter ended June 30, 2024.
Second Quarter 2024 Highlights
Revenues of $147.4 million on 1,159 railcar deliveries, an increase of 66% compared to revenues of $88.6 million on 760 railcar deliveries in the second quarter of 2023
Gross margin of 12.5% with gross profit of $18.4 million, compared to gross margin of 14.6% with gross profit of $13.0 million in the second quarter of 2023
Net Income of $8.2 million, or $0.11 per diluted share and Adjusted net income of $6.3 million, or $0.05 per diluted share, accounting primarily for a non-cash item associated with a change in fair market value of warrant liability and a cash item associated with a litigation settlement
Adjusted EBITDA of $12.1 million, compared to Adjusted EBITDA of $8.0 million in the second quarter of 2023
Delivered its 10,000th railcar manufactured at the Castaños facility
Received net orders for approximately 3,000 railcars within the quarter, including a multi-year order to convert over 1,000 tanks cars
“We are very pleased to report our strongest performance yet for revenue, gross profit and Adjusted EBITDA since opening our state-of-the-art facility in 2020. Importantly, these results follow the previously reported 99% growth in revenue and 192% growth in Adjusted EBITDA in the first quarter,” commented Nick Randall, President and Chief Executive Officer of FreightCar America. “Our multiyear turnaround has been a tremendous success, and our focus is on driving growth across our diversified product portfolio as we continue to maximize efficiencies across our value streams.”
Randall continued, “We built a world-class manufacturing campus that is both efficient and flexible. Our customers see this as evidenced by our largest order intake since starting the facility and our recently announced milestone of shipping our 10,000th railcar manufactured at the campus. Furthermore, and consistent with our growth plans, we are pleased to also announce that our order backlog now includes tank cars. Tank cars represent a very important part of the market and are fully aligned with our growth strategy. In summary, we are pleased with the quarter, the year-to-date, and especially with where we see ourselves headed.”
Fiscal Year 2024 Outlook
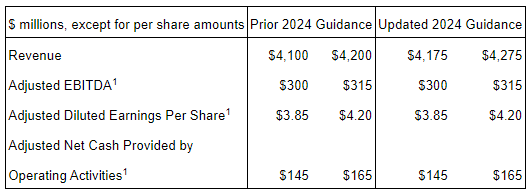
The Company has updated its outlook for fiscal year 2024 as follows:
Fiscal 2024 Outlook
Year-over-Year Growth at Midpoint
Revenue
$560 – $600 million
62.0%
Adjusted EBITDA
$35 – $39 million
84.1%
Railcar Deliveries
4,300 – 4,700 Railcars
48.9%
Mike Riordan, Chief Financial Officer of FreightCar America, commented, “With our facility complete and all production lines fully operational, we are well on track to achieve the operating performance we envisioned. Given this, combined with the significant order activity in the second quarter, we are raising our full year revenue and delivery guidance to between $560 million and $600 million and 4,300 to 4,700 railcars, respectively. Further, we are increasing our full year Adjusted EBITDA guidance to between $35 million and $39 million. With a strong pipeline of orders, we are well-positioned to leverage our operational efficiencies and cash flow generation to deliver profitable growth for our shareholders.”
Second Quarter 2024 Conference Call & Webcast Information
The Company will host a conference call and live webcast on Tuesday, August 13 at 11:00 a.m. (Eastern Time) to discuss its second quarter 2024 financial results. FreightCar America invites shareholders and other interested parties to listen to its financial results conference call via the following live and recorded methods:
Teleconference: Dial-in numbers for the live Conference Call are (877) 407-0789 or (201) 689-8562. Please call in at least 10 minutes prior to the start time of the call. An audio replay may be accessed at (844) 512-2921 or (412) 317-6671; Passcode: 13747591.
About FreightCar America
FreightCar America, headquartered in Chicago, Illinois, is a leading designer, producer and supplier of railroad freight cars, railcar parts and components. We also specialize in railcar repairs, complete railcar rebody services and railcar conversions that repurpose idled rail assets back into revenue service. Since 1901, our customers have trusted us to build quality railcars that are critical to economic growth and instrumental to the North American supply chain. To learn more about FreightCar America, visit www.freightcaramerica.com.
Forward-Looking Statements
This press release contains statements relating to our expected financial performance, financial condition, and/or future business prospects, events and/or plans that are “forward-looking statements” as defined under the Private Securities Litigation Reform Act of 1995. Forward-looking statements represent our estimates and assumptions only as of the date of this press release. Our actual results may differ materially from the results described in or anticipated by our forward-looking statements due to certain risks and uncertainties. These risks and uncertainties relate to, among other things, the cyclical nature of our business; adverse economic and market conditions including inflation; material disruption in the movement of rail traffic for deliveries; fluctuating costs of raw materials including steel and aluminum; delays in the delivery of raw materials; our ability to maintain relationships with our suppliers of railcar components; our reliance upon a small number of customers that represent a large percentage of our sales; the variable purchase patterns of our customers and the timing of completion, delivery and customer acceptance of orders; the highly competitive nature of our industry; the risk of lack of acceptance of our new railcar offerings, and other competitive factors. The factors listed above are not exhaustive. New factors emerge from time to time that may cause our business not to develop as we expect, and it is not possible for us to predict all of them. We expressly disclaim any duty to provide updates to any forward-looking statements made in this press release, whether as a result of new information, future events or otherwise.
Non-GAAP Financial Measures
This press release includes measures not derived in accordance with generally accepted accounting principles (“GAAP”), such as EBITDA, Adjusted EBITDA, Adjusted net loss and Adjusted EPS. These non-GAAP measures should not be considered in isolation or as a substitute for any measure derived in accordance with GAAP and may also be inconsistent with similar measures presented by other companies. Reconciliations of these measures to the applicable most closely comparable GAAP measures, and reasons for the Company’s use of these measures, are presented in the attached pages.
Q2 operating earnings of $12.2 million; $28.1 million on an adjusted basis, up 95%
Q2 revenue down following sale of European staffing operations; up 0.6% on an organic basis
Q2 adjusted EBITDA margin increased 170 basis points to 3.7% driven by meaningful reduction in operating expenses resulting from business transformation initiatives and sale of European staffing operations
Company expects further expansion of EBITDA margin from the May 31, 2024 acquisition of Motion Recruitment Partners, LLC (“MRP”)
TROY, Mich. , Aug. 08, 2024 (GLOBE NEWSWIRE) — Kelly (Nasdaq: KELYA, KELYB), a leading specialty talent solutions provider, today announced results for the second quarter of 2024.
Peter Quigley, president and chief executive officer, announced revenue for the second quarter of 2024 totaled $1.06 billion, a 13.1% decrease compared to the corresponding quarter of 2023 resulting primarily from the sale of the company’s European staffing operations on January 2, 2024. Excluding the impact of the sale of the European staffing operations and the recent acquisition of MRP, revenue improved 0.6% on an organic basis reflecting the continuing impact of customers’ more guarded approach to hiring and initiating new projects or capital spending. MRP revenue is included in reported revenue upon acquisition beginning in June 2024 and added 400 bps to reported year-over-year revenue growth.
Kelly reported operating earnings in the second quarter of 2024 of $12.2 million, compared to earnings of $6.2 million reported in the second quarter of 2023. Adjusted earnings were $28.1 million in the second quarter of 2024. The $15.9 million increase from reported earnings includes a loss on the sale of our European staffing operations, charges related to transformation actions and the sale of our European staffing operations, an impairment charge related to excess leased property and a gain on the sale of assets related to the Ayers Group. The acquisition of MRP added $1.5 million of earnings from operations in the second quarter of 2024. Adjusted earnings in the second quarter of 2023 were $14.2 million. The $8.0 million increase from reported earnings included transformation related charges and an asset impairment charge. The European staffing operations produced $1 million of earnings from operations on an adjusted basis in the second quarter of 2023.
Earnings per share in the second quarter of 2024 were $0.12 compared to earnings per share of $0.20 in the second quarter of 2023. Included in earnings per share in the second quarter of 2024 were a loss on the sale of EMEA staffing operations and a gain on the sale of Ayers Group, net of tax of $0.16, as well as transaction costs related to the acquisition of MRP, restructuring charges associated with our transformation and an asset impairment charge, net of tax, of $0.43. Included in the earnings per share in the second quarter of 2023 are $0.16 per share related to restructuring charges and an asset impairment charge, net of tax. On an adjusted basis, earnings per share were $0.71 in the second quarter of 2024, a significant improvement from $0.36 per share in the corresponding quarter of 2023.
“In the second quarter, employers continued to take a cautious approach to hiring, though customer demand stabilized on a sequential basis across much of our business – a development that is reflected in Kelly’s organic revenue for the quarter,” said Quigley. “As we continued to navigate uncertain market conditions, we remained focused on what we can control. Our ongoing growth and efficiency initiatives increased Kelly’s EBITDA margin in the first half of the year to 3.4% on an organic, adjusted basis – at the midpoint of our initial expectation for EBITDA margin expansion which we established one year ago. This improvement, combined with the scale and capabilities we added through our recent acquisition of MRP, position Kelly to accelerate profitable growth as market conditions improve.”
Kelly also reported that on August 7, its board of directors declared a dividend of $0.075 per share. The dividend is payable on September 4, 2024, to stockholders of record as of the close of business on August 21, 2024.
In conjunction with its second-quarter earnings release, Kelly has published a financial presentation on the Investor Relations page of its public website and will host a conference call at 9 a.m. ET on August 8 to review the results and answer questions. The call may be accessed in one of the following ways:
Via the telephone (877) 692-8955 (toll free) or (234) 720-6979 (caller paid) Enter access code 5728672 After the prompt, please enter “#”
A recording of the conference call will be available after 1:30 p.m. ET on August 8, 2024, at (866) 207-1041 (toll-free) and (402) 970-0847 (caller-paid). The access code is 2784290#. The recording will also be available at kellyservices.com during this period.
This release contains statements that are forward looking in nature and, accordingly, are subject to risks and uncertainties. These statements are made under the “safe harbor” provisions of the U.S. Private Securities Litigation Reform Act of 1995. Statements that are not historical facts, including statements about Kelly’s financial expectations, are forward-looking statements. Factors that could cause actual results to differ materially from those contained in this release include, but are not limited to, (i) changing market and economic conditions, (ii) disruption in the labor market and weakened demand for human capital resulting from technological advances, loss of large corporate customers and government contractor requirements, (iii) the impact of laws and regulations (including federal, state and international tax laws), (iv) unexpected changes in claim trends on workers’ compensation, unemployment, disability and medical benefit plans, (v) litigation and other legal liabilities (including tax liabilities) in excess of our estimates, (vi) our ability to achieve our business’s anticipated growth strategies, (vii) our future business development, results of operations and financial condition, (viii) damage to our brands, (ix) dependency on third parties for the execution of critical functions, (x) conducting business in foreign countries, including foreign currency fluctuations, (xi) availability of temporary workers with appropriate skills required by customers, (xii) cyberattacks or other breaches of network or information technology security, and (xiii) other risks, uncertainties and factors discussed in this release and in the Company’s filings with the Securities and Exchange Commission. In some cases, forward-looking statements can be identified by words or phrases such as “may,” “will,” “expect,” “anticipate,” “target,” “aim,” “estimate,” “intend,” “plan,” “believe,” “potential,” “continue,” “is/are likely to” or other similar expressions. All information provided in this press release is as of the date of this press release and we undertake no duty to update any forward-looking statement to conform the statement to actual results or changes in the Company’s expectations.
About Kelly®
Kelly Services, Inc. (Nasdaq: KELYA, KELYB) helps companies recruit and manage skilled workers and helps job seekers find great work. Since inventing the staffing industry in 1946, we have become experts in the many industries and local and global markets we serve. With a network of suppliers and partners around the world, we connect more than 500,000 people with work every year. Our suite of outsourcing and consulting services ensures companies have the people they need, when and where they are needed most. Headquartered in Troy, Michigan, we empower businesses and individuals to access limitless opportunities in industries such as science, engineering, technology, education, manufacturing, retail, finance, and energy. Revenue in 2023 was $4.8 billion. Learn more at kellyservices.com.
Continued profitability improvement and stronger pace of new business wins driven by strategic transformation plan
Company reaffirms full year 2024 outlook
CHARLOTTE, N.C., Aug. 07, 2024 (GLOBE NEWSWIRE) — NN, Inc. (NASDAQ: NNBR), a global diversified industrial company that engineers and manufactures high-precision components and assemblies, today reported its financial results for the second quarter ended June 30, 2024.
Highlights
Strategic transformation program drove enhanced results, fourth consecutive quarter of improved year-over-year performance;
Second quarter net sales of $123.0 million, down 1.8% versus prior year, driven primarily by unfavorable foreign exchange impacts and rationalization of unprofitable business in Mobile Solutions;
Second quarter operating loss of $2.1 million, an improvement of 47.5% versus prior year;
Second quarter adjusted EBITDA of $13.4 million, an improvement of 27.6% versus prior year;
Secured new business awards of $34.3 million year-to-date; and
Subsequent to quarter-end, the company executed the sale of its lone non-core plastics plant and used $15.4 million of proceeds to pay down debt.
“NN delivered another quarter of improvement, driven by the execution of our strategic transformation plan which is yielding observable momentum across key focus areas of profitability enhancement, operational performance, and accelerated new business wins,” said Harold Bevis, President and Chief Executive Officer. “Our committed efforts to strengthen profitability were evident in the quarter, as our $13.4 million of adjusted EBITDA reflected solid growth over the prior year, which is the fourth consecutive quarter of year-over-year improvement. On a trailing-twelve-month basis we have delivered adjusted EBITDA of $49.2 million, an improvement of 28.7% year-over-year. Our focus on improved operating performance and productivity has helped drive solid margin expansion, advancing our profitability and overcoming the strategic rationalization of volumes which impacted our top-line.”
Mr. Bevis continued, “We continue to see strong momentum in our commercial efforts as we have won nearly $18 million of new business awards in the second quarter and $97 million over the last six quarters. We are on pace to deliver our 2024 targets for new business wins. The electrical, industrial, and medical markets remain unchanged, healthy, and growing. However, the global auto market is recalibrating the choices of powertrain and low-cost country production.”
Mr. Bevis concluded, “We are pleased with our overall performance for the quarter and remain highly confident in our ability to accelerate our transformation and pace of growth. We are delivering significantly improved plant level performance, which is strengthening our profitability and new business win platform. In the near term, we remain highly focused on optimizing our capital structure and lowering our cost of capital through a strategic refinancing which is currently underway. We are also focusing our commercial growth agenda on expanding our electrical business, across auto and non-auto end markets, as well as our high-value NN Medical business in low-cost geographies. I would like to recognize the efforts of our global team members in supporting our ongoing transformation, as we thank them for delivering results as our improved performance is generated through their hard work.”
Second Quarter GAAP Results Net sales were $123.0 million, a decrease of 1.8% from the second quarter of 2023, which was primarily due to rationalized volume at plants undergoing transformations and unfavorable foreign exchange effects of 0.8% or $1.0 million, partially offset by the net impact of contractual pricing provisions.
Loss from operations was $2.1 million compared to a loss from operations of $4.0 million in the second quarter of 2023. The decrease in loss from operations was primarily due to improved operating performance within several facilities.
Income from operations for Power Solutions was $5.3 million compared to income from operations of $2.6 million for the same period in 2023. Loss from operations for Mobile Solutions was $1.6 million compared to loss from operations of $1.5 million for the same period in 2023.
Net loss was $2.2 million compared to net loss of $14.4 million for the same period in 2023. The decrease in net loss was primarily due to non-cash derivative mark-to-market gains recognized during the current quarter compared to losses recognized in the second quarter of 2023.
Second Quarter Adjusted Results Adjusted income from operations for the second quarter of 2024 was $2.1 million compared to adjusted income from operations of $1.3 million for the same period in 2023. Adjusted EBITDA was $13.4 million, or 10.9% of sales, compared to $10.5 million, or 8.4% of sales, for the same period in 2023.
Adjusted net loss was $0.8 million, or $0.02 per diluted share, compared to adjusted net loss of $3.3 million, or $0.08 per diluted share, for the same period in 2023. Free cash flow was a use of cash of $1.3 million compared to a generation of cash of $3.0 million for the same period in 2023.
Power Solutions Net sales for the second quarter of 2024 were $50.2 million compared to $48.1 million in the second quarter of 2023, an increase of 4.3%, or $2.1 million. The increase in sales was primarily due to higher precious metals pass-through pricing and inflation pricing, partially offset by lower volume during the current quarter.
Adjusted income from operations was $8.0 million compared to adjusted income from operations of $5.6 million in the second quarter of 2023. The increase in adjusted income from operations was primarily due to favorable production volumes and improved operating performance.
Mobile Solutions Net sales for the second quarter of 2024 were $72.9 million compared to $77.2 million in the second quarter of 2023, a decrease of 5.6%, or $4.3 million. The decrease in sales was primarily due to lower volume at facilities undergoing transformations, contractual reduction in customer pricing, and unfavorable foreign exchange effects.
Adjusted loss from operations was $0.7 million compared to adjusted income from operations of $0.2 million in the second quarter of 2023. The decrease in adjusted income from operations was primarily due to lower production volumes.
Updated 2024 Outlook NN is reaffirming its full-year 2024 outlook previously provided in its news release on July 2, 2024.
Revenue in the range of $465 million to $485 million;
Adjusted EBITDA in the range of $47 million to $51 million;
Free cash flow in the range of $8 million to $12 million; and
New business wins in the range of $55 million to $70 million.
Chris Bohnert, Senior Vice President and Chief Financial Officer, commented, “NN continued to make significant progress on its transformation goals in the quarter and we are maintaining our full year 2024 guidance ranges as market fundamentals and our improved operating performance have been in line with our previous expectations. Additionally, optimizing NN’s capital structure and the proactive strategic re-financing of our term loan remains a top priority for our team in the near-term and will be a key next step in our transformational strategy.”
Conference Call NN will discuss its results during its quarterly investor conference call on August 8, 2024, at 10 a.m. ET. The call and supplemental presentation may be accessed via NN’s website, www.nninc.com. The conference call can also be accessed by dialing 1-877-255-4315 or 1-412-317-6579. For those who are unavailable to listen to the live broadcast, a replay will be available shortly after the call until August 8, 2025.
NN discloses in this press release the non-GAAP financial measures of adjusted income (loss) from operations, adjusted EBITDA, adjusted net income (loss), adjusted net income (loss) per diluted common share, and free cash flow. Each of these non-GAAP financial measures provides supplementary information about the impacts of restructuring and integration expense, acquisition and transition expenses, foreign exchange impacts on inter-company loans, amortization of intangibles and deferred financing costs, and other non-operating impacts on our business.
The financial tables found later in this press release include a reconciliation of adjusted income (loss) from operations, adjusted operating margin, adjusted EBITDA, adjusted EBITDA margin, adjusted net income (loss), adjusted net income (loss) per diluted share, free cash flow to the U.S. GAAP financial measures of income (loss) from operations, net income (loss), net income (loss) per diluted common share, and cash provided (used) by operating activities.
About NN, Inc. NN, Inc., a global diversified industrial company, combines advanced engineering and production capabilities with in-depth materials science expertise to design and manufacture high-precision components and assemblies for a variety of markets on a global basis. Headquartered in Charlotte, North Carolina, NN has facilities in North America, Europe, South America, and Asia. For more information about the company and its products, please visit www.nninc.com.
Except for specific historical information, many of the matters discussed in this press release may express or imply projections of revenues or expenditures, statements of plans and objectives or future operations or statements of future economic performance. These statements may discuss goals, intentions and expectations as to future trends, plans, events, results of operations or financial condition, or state other information relating to NN, Inc. (the “Company”) based on current beliefs of management as well as assumptions made by, and information currently available to, management. Forward-looking statements generally will be accompanied by words such as “anticipate,” “believe,” “could,” “estimate,” “expect,” “forecast,” “guidance,” “intend,” “may,” “possible,” “potential,” “predict,” “project” or other similar words, phrases or expressions. Forward-looking statements involve a number of risks and uncertainties that are outside of management’s control and that may cause actual results to be materially different from such forward-looking statements. Such factors include, among others, general economic conditions and economic conditions in the industrial sector; the impacts of pandemics, epidemics, disease outbreaks and other public health crises on our financial condition, business operations and liquidity; competitive influences; risks that current customers will commence or increase captive production; risks of capacity underutilization; quality issues; material changes in the costs and availability of raw materials; economic, social, political and geopolitical instability, military conflict, currency fluctuation, and other risks of doing business outside of the United States; inflationary pressures and changes in the cost or availability of materials, supply chain shortages and disruptions, the availability of labor and labor disruptions along the supply chain; our dependence on certain major customers, some of whom are not parties to long-term agreements (and/or are terminable on short notice); the impact of acquisitions and divestitures, as well as expansion of end markets and product offerings; our ability to hire or retain key personnel; the level of our indebtedness; the restrictions contained in our debt agreements; our ability to obtain financing at favorable rates, if at all, and to refinance existing debt as it matures; our ability to secure, maintain or enforce patents or other appropriate protections for our intellectual property; new laws and governmental regulations; the impact of climate change on our operations; and cyber liability or potential liability for breaches of our or our service providers’ information technology systems or business operations disruptions. The foregoing factors should not be construed as exhaustive and should be read in conjunction with the sections entitled “Risk Factors” and “Management’s Discussion and Analysis of Financial Condition and Results of Operations” included in the Company’s filings made with the Securities and Exchange Commission. Any forward-looking statement speaks only as of the date of this press release, and the Company undertakes no obligation to publicly update or review any forward-looking statement, whether as a result of new information, future developments or otherwise, except as required by law. New risks and uncertainties may emerge from time to time, and it is not possible for the Company to predict their occurrence or how they will affect the Company. The Company qualifies all forward-looking statements by these cautionary statements.
With respect to any non-GAAP financial measures included in the following document, the accompanying information required by SEC Regulation G can be found in the back of this document or in the “Investors” section of the Company’s web site, www.nninc.com, under the heading “News & Events” and subheading “Presentations.”
Investor & Media Contacts: Joe Caminiti or Stephen Poe, Investors Tim Peters or Emma Brandeis, Media NNBR@alpha-ir.com 312-445-2870
BRENTWOOD, Tenn., Aug. 07, 2024 (GLOBE NEWSWIRE) — CoreCivic, Inc. (NYSE: CXW) (CoreCivic or the Company) announced today its second quarter 2024 financial results.
Financial Highlights – Second Quarter 2024
Total revenue of $490.1 million
CoreCivic Safety revenue of $455.4 million
CoreCivic Community revenue of $30.3 million
CoreCivic Properties revenue of $4.4 million
Net income of $19.0 million; Adjusted Net Income of $21.8 million
Diluted earnings per share of $0.17; Adjusted Diluted EPS of $0.20
Normalized FFO per diluted share of $0.42, an increase of 27%
Adjusted EBITDA of $83.9 million, an increase of 16%
Damon T. Hininger, CoreCivic’s President and Chief Executive Officer, commented, “CoreCivic carried its strong operating momentum into the second quarter of 2024. Revenue increased 6% versus the second quarter of 2023, with federal, state, and local revenues all increasing. Occupancy increased to 74.3% from 70.3% in the prior year quarter, and our cost management initiatives are proving effective.”
“In addition to our solid quarterly financial results,” Hininger added, “we are also proud of our continued progress toward our capital structure targets. During the quarter, we repurchased 1.3 million shares of our common stock for a total cost of $20.1 million. Through a thoughtful and disciplined capital allocation strategy, we ended the quarter with leverage, measured as net debt to Adjusted EBITDA, at 2.5x for the trailing twelve months – placing us at the midpoint of our target leverage range of 2.25x to 2.75x that we established in August 2020. Our balance sheet strength and readily available bed capacity position us well to respond to the dynamics of our industry.”
“Finally, we want to recognize the accomplishments of our South Texas Family Residential Center (South Texas Facility) in Dilley, Texas over the past decade. As we previously disclosed, U.S. Immigrations & Customs Enforcement (ICE) will discontinue using this facility as of August 9, 2024. The South Texas Facility was created in collaboration with ICE and a third-party lessor to address the unique challenges posed by then unprecedented levels of family immigration in 2014. This pioneering facility was initially designed to provide a family-oriented environment, featuring educational, medical, dining and athletic facilities. During 2021, this facility’s mission shifted to detention of single adults. We appreciate the trust placed in CoreCivic to launch this unique facility, and we appreciate our excellent leadership and staff at the South Texas Facility, whom we have offered employment opportunities at other facilities within the CoreCivic portfolio.”
Second Quarter 2024 Financial Results Compared With Second Quarter 2023
Net income in the second quarter of 2024 was $19.0 million, or $0.17 per diluted share, compared with net income in the second quarter of 2023 of $14.8 million, or $0.13 per diluted share. However, when adjusted for special items, Adjusted Net Income for the second quarter of 2024 improved to $21.8 million, or $0.20 per diluted share (Adjusted Diluted EPS), compared with Adjusted Net Income in the second quarter of 2023 of $13.6 million, or $0.12 per diluted share. Special items for each period are presented in detail in the calculation of Adjusted Diluted EPS in the Supplemental Financial Information following the financial statements presented herein.
The increased adjusted earnings per share amounts resulted from higher federal, state, and local populations, particularly at our facilities serving ICE, combined with lower interest expense and a decrease in shares of common stock outstanding, both resulting from our capital allocation strategy. These earnings increases were achieved despite being partially offset by the expiration of our leases with the California Department of Corrections and Rehabilitation (CDCR) at our California City Correctional Center on March 31, 2024, and with the Oklahoma Department of Corrections (ODC) at our North Fork Correctional Facility on June 30, 2023, which collectively accounted for a per share reduction of $0.06.
We continue to realize improvements in our cost structure, both as a result of operating leverage stemming from improving facility occupancy versus the prior year, as well as from other initiatives, particularly those related to labor attraction and retention. The costs of registry nursing, temporary labor resources, including associated travel expenses, overtime and incentives, declined meaningfully from the prior year quarter as well as sequentially.
Revenue from ICE, our largest government partner, increased 10.5% compared with the second quarter of 2023, when the impact of Title-42 restrictions remained. Under Title 42, which ended May 11, 2023, asylum-seekers and anyone crossing the border without proper documentation or authority were denied entry at the United States border to contain the spread of COVID-19. Revenue from ICE declined slightly versus the first quarter of 2024, reflecting a slight decline in ICE detention populations nationwide. During the second quarter of 2024, revenue from ICE was $151.0 million compared to $136.7 million during the second quarter of 2023, and compared to $153.8 million during the first quarter of 2024.
Earnings before interest, taxes, depreciation and amortization (EBITDA) was $79.8 million in the second quarter of 2024. Adjusted EBITDA, which excludes special items, was $83.9 million in the second quarter of 2024, compared with $72.1 million in the second quarter of 2023. The increase in Adjusted EBITDA was attributable to an increase in occupancy, combined with a general reduction in temporary staffing incentives and related labor costs, partially offset by the expiration of the leases with the CDCR at the California City facility and with the ODC at the North Fork facility.
Funds From Operations (FFO) for the second quarter of 2024 was $43.8 million. Normalized FFO, which excludes special items, increased to $46.6 million, or $0.42 per diluted share, in the second quarter of 2024, compared with $37.8 million, or $0.33 per diluted share, in the second quarter of 2023, representing an increase in Normalized FFO per share of 27%. Normalized FFO was impacted by the same factors that affected Adjusted EBITDA, further improved by a reduction in interest expense resulting from our debt reduction strategy that is not reflected in Adjusted EBITDA, as well as a 2% reduction in weighted average shares outstanding compared with the prior year quarter.
Adjusted Net Income, EBITDA, Adjusted EBITDA, FFO, and Normalized FFO, and, where appropriate, their corresponding per share amounts, are measures calculated and presented on the basis of methodologies other than in accordance with generally accepted accounting principles (GAAP). Please refer to the Supplemental Financial Information and the note following the financial statements herein for further discussion and reconciliations of these measures to net income, the most directly comparable GAAP measure.
Business Updates
Capital Strategy
Share Repurchases. During 2022, our Board of Directors approved a share repurchase program authorizing the Company to repurchase up to $225.0 million of our common stock. On May 16, 2024, our Board of Directors authorized an additional $125.0 million in shares of our common stock for our share repurchase program, increasing the total aggregate authorization to $350.0 million. During the three months ended June 30, 2024, we repurchased 1.3 million shares of our common stock at an aggregate purchase price of $20.1 million, excluding fees, commissions and other costs related to the repurchases. Since the share repurchase program was authorized, through June 30, 2024, we have repurchased a total of 14.1 million shares at an aggregate price of $172.1 million, or $12.20 per share, excluding fees, commissions and other costs related to the repurchases.
As of June 30, 2024, we had $177.9 million remaining under the share repurchase program. Additional repurchases of common stock will be made in accordance with applicable securities laws and may be made at management’s discretion within parameters set by the Board of Directors from time to time in the open market, through privately negotiated transactions, or otherwise. The share repurchase program has no time limit and does not obligate us to purchase any particular amount of our common stock. The authorization for the share repurchase program may be terminated, suspended, increased or decreased by our Board of Directors in its discretion at any time. As a result of ICE’s discontinued use of the South Texas Facility and the impact such discontinuation will have on our leverage ratios, we intend to prioritize the use of our free cash flow to further reduce our debt, although we may exercise discretion in repurchasing additional shares of our common stock in accordance with the repurchase program.
Debt Refinancing. On April 15, 2024, we redeemed the remaining $98.8 million outstanding principal balance of our 8.25% senior unsecured notes due 2026 (the 2026 Notes), at a redemption price of 104.125% of the principal amount, plus accrued and unpaid interest on such notes to, but not including April 15, 2024, resulting in a charge of $4.1 million reported during the second quarter of 2024. This redemption completed the refinancing transactions begun during the first quarter of 2024 with the underwritten registered public offering of $500 million aggregate principal amount of 8.25% senior unsecured notes due 2029 (the 2029 Notes). The net proceeds from the offering of the 2029 Notes, amounting to $490.3 million, together with borrowings under our revolving credit facility and cash on hand, were used to fund the tender offer for, and subsequent redemption of, the 2026 Notes, which had an outstanding principal balance of $593.1 million. Following the completion of the tender offer of $494.3 million, or 83.3% of the aggregate principal amount of the 2026 Notes then-outstanding during the first quarter of 2024, and the redemption of the remaining $98.8 million principal balance outstanding during the second quarter of 2024, we have no debt maturities until 2027, when $243.7 million principal amount of our 4.75% senior unsecured notes mature.
Contract Updates
New Management Contract with State of Montana. On July 25, 2024, following a competitive bid process, we received a Notice of Intent to Award a new management contract from the state of Montana to care for additional residents at CoreCivic facilities. During the third quarter of 2024, we anticipate receiving 120 residents at our 1,896-bed Saguaro Correctional Facility in Eloy, Arizona, doubling the population from the state of Montana residing at this facility under an existing management contract. As of June 30, 2024, we also cared for approximately 1,000 residents from Hawaii, and nearly 600 residents from the state of Idaho at the Saguaro Correctional Facility. Should the state of Montana need additional capacity, the State may approve the utilization of any other facility we own or operate, subject to availability. The Notice of Intent to Award a management contract is an expansion of our relationship with the state of Montana, where we also manage the fully occupied company-owned Crossroads Correctional Center in Shelby, Montana for the state of Montana pursuant to a separate management contract.
South Texas Family Residential Center. As disclosed on June 10, 2024, we received notification from ICE that the agency intends to terminate an inter-governmental service agreement (IGSA) for services at the South Texas Facility on August 9, 2024. We lease the facility and the site upon which it was constructed from a third-party lessor, and we have provided notice of lease termination to the lessor, also effective August 9, 2024. Total revenue at this facility was $39.3 million and $156.6 million for the three months ended June 30, 2024 and the twelve months ended December 31, 2023, respectively. The impact of this contract termination is included in our updated 2024 financial guidance.
2024 Financial Guidance
CoreCivic previously withdrew its financial guidance during the second quarter of 2024. Based on current business conditions, we are providing the following financial guidance for the full year 2024:
Guidance Full Year 2024
• Net income
$42.0 million to $50.4 million
• Adjusted Net Income
$65.6 million to $73.6 million
• Diluted EPS
$0.37 to $0.45
• Adjusted Diluted EPS
$0.58 to $0.66
• FFO per diluted share
$1.28 to $1.36
• Normalized FFO per diluted share
$1.48 to $1.56
• EBITDA
$268.0 million to $274.6 million
• Adjusted EBITDA
$302.4 million to $308.4 million
During 2024, we expect to invest $70.0 million to $76.0 million in capital expenditures, consisting of $30.0 million to $31.0 million in maintenance capital expenditures on real estate assets, $32.0 million to $35.0 million for maintenance capital expenditures on other assets and information technology, and $8.0 million to $10.0 million for other capital investments, including costs to prepare an idle facility for activation in the possible event an opportunity presents.
Supplemental Financial Information and Investor Presentations
We have made available on our website supplemental financial information and other data for the second quarter of 2024. Interested parties may access this information through our website at http://ir.corecivic.com/ under “Financial Information” of the Investors section. We do not undertake any obligation and disclaim any duties to update any of the information disclosed in this report.
Management may meet with investors from time to time during the third quarter of 2024. Written materials used in the investor presentations will also be available on our website beginning on or about August 26, 2024. Interested parties may access this information through our website at http://ir.corecivic.com/ under “Events & Presentations” of the Investors section.
Conference Call, Webcast and Replay Information
We will host a webcast conference call at 10:00 a.m. central time (11:00 a.m. eastern time) on Thursday, August 8, 2024, which will be accessible through the Company’s website at www.corecivic.com under the “Events & Presentations” section of the “Investors” page. To participate via telephone and join the call live, please register in advance here https://register.vevent.com/register/BIdd7601382fc644b791a9a7cfbbe4f556. Upon registration, telephone participants will receive a confirmation email detailing how to join the conference call, including the dial-in number and a unique passcode.
About CoreCivic
CoreCivic is a diversified, government-solutions company with the scale and experience needed to solve tough government challenges in flexible, cost-effective ways. We provide a broad range of solutions to government partners that serve the public good through high-quality corrections and detention management, a network of residential and non-residential alternatives to incarceration to help address America’s recidivism crisis, and government real estate solutions. We are the nation’s largest owner of partnership correctional, detention and residential reentry facilities, and one of the largest prison operators in the United States. We have been a flexible and dependable partner for government for over 40 years. Our employees are driven by a deep sense of service, high standards of professionalism and a responsibility to help government better the public good. Learn more at www.corecivic.com.
Forward-Looking Statements
This press release contains statements as to our beliefs and expectations of the outcome of future events that are “forward-looking” statements within the meaning of Section 21E of the Securities Exchange Act of 1934, as amended, and the Private Securities Litigation Reform Act of 1995, as amended. These forward-looking statements are subject to risks and uncertainties that could cause actual results to differ materially from the statements made. These include, but are not limited to, the risks and uncertainties associated with: (i) changes in government policy, legislation and regulations that affect utilization of the private sector for corrections, detention, and residential reentry services, in general, or our business, in particular, including, but not limited to, the continued utilization of our correctional and detention facilities by the federal government, including as a consequence of the United States Department of Justice not renewing contracts as a result of President Biden’s Executive Order on Reforming Our Incarceration System to Eliminate the Use of Privately Operated Criminal Detention Facilities, impacting utilization primarily by the United States Federal Bureau of Prisons and the United States Marshals Service, and the impact of any changes to immigration reform and sentencing laws (we do not, under longstanding policy, lobby for or against policies or legislation that would determine the basis for, or duration of, an individual’s incarceration or detention); (ii) our ability to obtain and maintain correctional, detention, and residential reentry facility management contracts because of reasons including, but not limited to, sufficient governmental appropriations, contract compliance, negative publicity and effects of inmate disturbances; (iii) changes in the privatization of the corrections and detention industry, the acceptance of our services, the timing of the opening of new facilities and the commencement of new management contracts (including the extent and pace at which new contracts are utilized), as well as our ability to utilize available beds; (iv) general economic and market conditions, including, but not limited to, the impact governmental budgets can have on our contract renewals and renegotiations, per diem rates, and occupancy; (v) fluctuations in our operating results because of, among other things, changes in occupancy levels; competition; contract renegotiations or terminations; inflation and other increases in costs of operations, including a continuing rise in labor costs; fluctuations in interest rates and risks of operations; (vi) government budget uncertainty, the impact of the debt ceiling and the potential for government shutdowns and changing budget priorities; (vii) our ability to successfully identify and consummate future development and acquisition opportunities and realize projected returns resulting therefrom; (viii) our ability to have met and maintained qualification for taxation as a real estate investment trust, or REIT, for the years we elected REIT status; and (ix) the availability of debt and equity financing on terms that are favorable to us, or at all. Other factors that could cause operating and financial results to differ are described in the filings we make from time to time with the Securities and Exchange Commission.
We take no responsibility for updating the information contained in this press release following the date hereof to reflect events or circumstances occurring after the date hereof or the occurrence of unanticipated events or for any changes or modifications made to this press release or the information contained herein by any third-parties, including, but not limited to, any wire or internet services, except as may be required by law.
Second Quarter Revenue of $1.7 Billion with GAAP EPS of $(0.12); Adjusted EPS of $0.56
Progress on Project Core to Drive Future Cost Savings and Implementing Growth Initiatives
Company Repurchased $191 Million of Shares Year to Date
Company Provides Update on Varis Sale Process
BOCA RATON, Fla.–(BUSINESS WIRE)–Aug. 7, 2024– The ODP Corporation (“ODP,” or the “Company”) (NASDAQ:ODP), a leading provider of products, services, and technology solutions to businesses and consumers, today announced results for the second quarter ended June 29, 2024.
Second Quarter 2024 Summary(1)(2)(3)
Total reported sales of $1.7 billion, down 10% versus the prior year on a reported basis. The decrease in reported sales is largely related to lower sales in its Office Depot Division, primarily due to 58 fewer retail locations in service compared to the previous year and reduced transactions, as well as lower sales in its ODP Business Solutions Division
GAAP operating income of approximately $400 thousand and net income (loss) from continuing operations of $(4) million, or $(0.12) per diluted share, versus $60 million and $43 million, respectively, or $1.09 per diluted share, in the prior year period
Adjusted operating income of $33 million, compared to $67 million in the second quarter of 2023; adjusted EBITDA of $57 million, compared to $95 million in the second quarter of 2023
Adjusted net income from continuing operations of $20 million, or adjusted diluted earnings per share from continuing operations of $0.56, versus $48 million or $1.22, respectively, in the prior year period
Operating cash flow from continuing operations of $(1) million and adjusted free cash flow of $5 million, versus $(8) million and $(24) million, respectively, in the prior year period
Repurchased nearly 2.4 million shares at a cost of $104 million in the second quarter of 2024; Repurchased a total of approximately $141 million of shares when including purchases made in the second quarter and post quarter through the current date
$831 million of total available liquidity including $190 million in cash and cash equivalents, of which $10 million is presented in Current assets held for sale related to the Varis Division, at quarter end
“We are executing Project Core while taking actions to improve top-line trends in both our B2B and B2C businesses,” said Gerry Smith, chief executive officer of The ODP Corporation. “Our performance in the quarter was below our expectations, impacted by more cautious business spending and weaker consumer activity, along with new customer onboarding challenges impacting revenue traction at ODP Business Solutions. Additionally, retail store traffic trends, while improving sequentially, remained sluggish. Although market challenges impacted Office Depot and ODP Business Solutions, we continued to see progress in Veyer, as they executed across their growth strategies, attracting new third-party customers and improving their external EBITDA. Furthermore, we continued to buy back our shares, returning over $100 million of our stock in the quarter and over $190 million year to date,” he added.
“While we are pacing below our prior expectations for the year, we are not standing still. We’re taking actions to improve our top-line trajectory and we remain focused on capturing the long-term opportunities derived by our strong value proposition, solid balance sheet, and flexible foundation. In addition to our efforts under Project Core, which we expect will create over $100 million in annual cost savings when fully implemented, we are executing on initiatives to accelerate sales pipeline conversion, drive additional avenues for growth with existing customers, and leverage our deep customer relationships to solve more of their procurement challenges. This is what we call the Power of 1 – the ability to add value to our customers through offering one more product or suite of products to help them succeed. For example, we recently were awarded a sizeable order for standalone air conditioning units for a government entity — something not top of mind when you think of ODP Business Solutions, but it showcases the trust customers have in our capabilities to source, deliver, and solution during a time of need – all through the Power of 1. Additionally, we are set early for the upcoming back-to-school season and well positioned with our Education 365 approach, connecting customers within the education sector.”
“Although we are disappointed by our first half performance and outlook for the remainder of the year, we are committed to driving growth back into the business, remaining focused on converting the numerous opportunities in our pipeline, strengthening our position in the second half of the year and having impact in 2025 and beyond. We have several prospects at both ODP Business Solutions and Veyer that we expect to close in the second half that will boost revenue growth velocity as we exit this year. With these opportunities, coupled with our full realization of Project Core, we expect to exit 2024 with a stronger profile,” he continued.
“Despite the near term top-line challenges, we remain committed and encouraged about the future and confident in our operational excellence approach. Our team remains focused on executing the necessary steps to position us for long term growth and profitability,” Smith concluded.
Consolidated Results
Reported (GAAP) Results Total reported sales for the second quarter of 2024 were $1.7 billion, a decrease of 10% compared with the same period last year, driven by lower sales in both its consumer and business-to-business (B2B) divisions. Lower sales in its consumer division, Office Depot, was primarily due to 58 fewer stores in service compared to last year related to planned store closures, as well as lower retail and online consumer traffic and transactions. Sales at ODP Business Solutions Division were lower compared to last year, largely driven by macroeconomic factors causing more cautious spending among business customers, as well as continued challenges related to the onboarding of new customers and fewer transactions. Meanwhile, Veyer provided strong logistics support for the ODP Business Solutions and Office Depot Divisions and continued to execute across its growth strategy, delivering supply chain and procurement solutions to new third-party customers and driving external EBITDA.
The Company reported GAAP operating income of approximately $400 thousand in the second quarter of 2024, down compared to GAAP operating income of $60 million in the prior year period. Operating results in the second quarter of 2024 included $33 million of charges, primarily related to $25 million in net merger and restructuring expenses and $8 million non-cash asset impairment primarily related to the operating lease right-of-use (ROU) assets associated with the Company’s retail store locations. Net loss from continuing operations was $4 million, or $(0.12) per diluted share in the second quarter of 2024, down compared to net income from continuing operations of $43 million, or $1.09 per diluted share in the second quarter of 2023.
Adjusted (non-GAAP) Results(1) Adjusted results for the second quarter of 2024 exclude charges and credits totaling $33 million as described above and the associated tax impacts.
Second quarter 2024 adjusted EBITDA was $57 million compared to $95 million in the prior year period. This included depreciation and amortization of $24 million and $25 million in the second quarter of 2024 and 2023, respectively
Second quarter 2024 adjusted operating income was $33 million, down compared to $67 million in the second quarter of 2023
Second quarter 2024 adjusted net income from continuing operations was $20 million, or $0.56 per diluted share, compared to $48 million, or $1.22 per diluted share, in the second quarter of 2023, a decrease of 54% on a per share basis
Division Results
ODP Business Solutions Division Leading B2B distribution solutions provider serving small, medium and enterprise level companies with an annual trailing-twelve-month revenue of nearly $4 billion.
Reported sales were $917 million in the second quarter of 2024, down 8% compared to the same period last year. The decrease in sales was related primarily to weaker macroeconomic conditions, more cautious business spending, new customer onboarding challenges, and lower sales conversion
Total adjacency category sales, including cleaning and breakroom, furniture, technology, and copy and print, were 43% of total ODP Business Solutions’ sales
Continued strong pipeline of potential new business and implementing several initiatives to regain top-line traction
Operating income was $29 million in the second quarter of 2024, down 36% compared to the same period last year on a reported basis. As a percentage of sales, operating income margin was 3%, down 140 basis points compared to the same period last year
Office Depot Division Leading provider of retail consumer and small business products and services distributed via Office Depot and OfficeMax retail locations and an eCommerce presence.
Reported sales were $799 million in the second quarter of 2024, down 12% compared to the prior year on a reported basis. Lower sales were partially driven by 58 fewer retail outlets in service associated with planned store closures, as well as lower demand relative to last year in major product categories and lower online sales. The Company closed 9 retail stores in the quarter and had 894 stores at quarter end. Sales were down 7% on a comparable store basis
Store and online traffic were lower year over year due to macroeconomic factors causing sluggish consumer activity
Operating income was $17 million in the second quarter of 2024, compared to operating income of $35 million during the same period last year, driven primarily by the flow through impact from lower sales. As a percentage of sales, operating income was 2%, down 170 basis points compared to the same period last year
Veyer Division Nationwide supply chain, distribution, procurement and global sourcing operation supporting Office Depot and ODP Business Solutions, as well as third-party customers. Veyer’s assets and capabilities include 8 million square feet of infrastructure through a network of distribution centers, cross-docks, and other facilities throughout the United States; a global sourcing presence in Asia; a large private fleet of vehicles; and next-day delivery to 98.5% of US population.
In the second quarter of 2024, Veyer provided support for its internal customers, ODP Business Solutions and Office Depot, as well as its third-party customers, generating sales of $1.2 billion
Operating income was $5 million in the second quarter of 2024, compared to $6 million in the prior year period driven by the flow through impact of lower sales to internal customers partially offset by the contribution related to services to external third-party customers
In the second quarter of 2024, sales generated from third-party customers were in-line with the same period last year and EBITDA generated from third-party customers increased by 17% year over year, resulting in sales of $10 million and EBITDA of $4 million
Share Repurchases
The Company continued to execute under its previously announced $1 billion share repurchase authorization valid through March 31, 2027. During the second quarter of 2024, the Company repurchased nearly 2.4 million shares at a cost of $104 million. Since the end of the second quarter of 2024, the Company repurchased additional shares for $37 million.
“Our capital allocation strategy balances investing in the future of our business while continuing to enhance value for shareholders through share repurchases under our buyback authorization,” stated Anthony Scaglione, executive vice president and chief financial officer of The ODP Corporation. “We have executed under this approach, investing in our business and repurchasing over $190 million of our stock thus far in 2024. Moving forward, we will continue to balance our capital allocation strategy remaining mindful of market conditions and business performance as we continue to drive our low-cost business model through Project Core.”
The number of shares to be repurchased under the authorization in the future and the timing of such transactions will depend on a variety of factors, including market conditions, regulatory requirements, and other corporate considerations. The new share repurchase authorization could be suspended or discontinued at any time as determined by the Board of Directors.
Balance Sheet and Cash Flow
As of June 29, 2024, ODP had total available liquidity of approximately $831 million, consisting of $190 million in cash and cash equivalents, including $10 million that is presented in Current assets held for sale related to the Varis Division, and $641 million of available credit under the Fourth Amended Credit Agreement. Total debt was $183 million.
For the second quarter of 2024, cash used in operating activities of continuing operations was $1 million, which included $25 million in restructuring spend, compared to cash used in operating activities of continuing operations of $8 million in the second quarter of the prior year, which included $1 million in restructuring spend. The year-over-year change in operating cash flow is largely related to the timing of certain working capital items.
Capital expenditures in the second quarter of 2024 were $19 million versus $17 million in the prior year period, reflecting continued growth investments in the Company’s digital transformation, distribution network, and eCommerce capabilities. Adjusted Free Cash Flow(3) was $5 million in the second quarter of 2024, compared to $(24) million in the prior year period.
Progress on Project Core
As the Company previously announced, Project Core is a plan designed to create further efficiencies throughout its business, focused on driving enhanced operating results and shareholder value. This broad-based plan includes cost improvement actions across the entire enterprise, optimizing its organizational structure to support future growth of the business. The Company continues to make significant progress under Project Core and is in position to realize in-year savings of approximately $50 million and annualized savings of over $100 million when fully implemented. Restructuring and related charges associated with these actions are now estimated to be in the range of $40 million to $50 million, excluding those related to the Varis Division, and are expected to be substantially incurred throughout 2024.
Varis Division Update
The Company has entered into a non-binding term sheet agreement with a third-party for the sale of Varis. Under the proposed terms, the Company would retain an approximately 20% current stake in the entity. However, there can be no assurances regarding the ultimate timing of this proposed transaction or that such transaction will be completed.
“After a thorough process, we have arrived at a path forward for Varis that aligns with our stated objectives of finalizing our capital commitment to the business, while providing ODP with a continued invested interest in the opportunities ahead. We expect to announce further details of the proposed transaction upon close, which we expect to be completed in the third quarter,” added Smith.
2024 Guidance
“Our performance in the first half of the year was clearly below expectations, placing us behind our goals for the year,” said Smith. “The initiatives we are taking to improve our top-line trajectory, along with our low-cost model, high touch service approach, and strong value proposition, give us confidence in our ability to improve our performance and position us for greater stability and growth in the future. Considering our slow start to the first half of the year, as well as the uncertain macroeconomic environment and the potential variability of the timing of our initiatives, we are updating our 2024 guidance as follows”:
Updated full-year guidance for 2024
*Adjusted Earnings per Share (fully diluted) (EPS) guidance for 2024 excludes potential discrete (tax) items that may affect quarter to quarter fluctuations and includes expected impact from share repurchases
The Company’s full year guidance for 2024 includes non-GAAP measures, such as Adjusted EBITDA, Adjusted Operating Income, Adjusted Earnings per Share (fully diluted) and Adjusted Free Cash Flow. These measures exclude charges or credits not indicative of core operations, which may include but not be limited to restructuring charges, capital expenditures, acquisition-related costs, executive transition costs, asset impairments and other significant items that currently cannot be predicted without unreasonable efforts. The exact amount of these charges or credits are not currently determinable but may be significant. Accordingly, the Company is unable to provide equivalent GAAP measures or reconciliations from GAAP to non-GAAP for these financial measures.
“As a result of our first half performance, along with a continuing challenging macro environment and lower than anticipated sales pipeline conversion in ODP Business Solutions, we are lowering our full year outlook. While first half results were below our expectations, our team remains focused on executing upon opportunities in our business to grow our top line, leveraging our low-cost business model, strong balance sheet, and diverse routes to market,” said Scaglione.
The ODP Corporation will webcast a call with financial analysts and investors on August 7, 2024, at 9:00 am Eastern Time, which will be accessible to the media and the general public. To listen to the conference call via webcast, please visit The ODP Corporation’s Investor Relations website at investor.theodpcorp.com. A replay of the webcast will be available approximately two hours following the event.
(1)
As presented throughout this release, adjusted results represent non-GAAP financial measures and exclude charges or credits not indicative of core operations and the tax effect of these items, which may include but not be limited to merger integration, restructuring, acquisition costs, and asset impairments. Reconciliations from GAAP to non-GAAP financial measures can be found in this release as well as on the Company’s Investor Relations website at investor.theodpcorp.com.
(2)
As used in this release, Free Cash Flow is defined as cash flows from operating activities less capital expenditures. Free Cash Flow is a non-GAAP financial measure and reconciliations from GAAP financial measures can be found in this release as well as on the Company’s Investor Relations website at investor.theodpcorp.com.
(3)
As used in this release, Adjusted Free Cash Flow is defined as Free Cash Flow excluding cash charges associated with the Company’s Project Core Restructuring, and related expenses. Adjusted Free Cash Flow is a non-GAAP financial measure and reconciliations from GAAP financial measures can be found in this release as well as on the Company’s Investor Relations website at investor.theodpcorp.com.
About The ODP Corporation
The ODP Corporation (NASDAQ:ODP) is a leading provider of products, services, and technology solutions through an integrated business-to-business (B2B) distribution platform and omni-channel presence, which includes supply chain and distribution operations, dedicated sales professionals, online presence, and a network of Office Depot and OfficeMax retail stores. Through its operating companies ODP Business Solutions, LLC; Office Depot, LLC; and Veyer, LLC, The ODP Corporation empowers every business, professional, and consumer to achieve more every day. For more information, visit theodpcorp.com.
FORWARD LOOKING STATEMENTS This communication may contain forward-looking statements within the meaning of the Private Securities Litigation Reform Act of 1995. These statements or disclosures may discuss goals, intentions and expectations as to future trends, plans, events, results of operations, cash flow or financial condition, or state other information relating to, among other things, the Company, based on current beliefs and assumptions made by, and information currently available to, management. Forward-looking statements generally will be accompanied by words such as “anticipate,” “believe,” “plan,” “could,” “estimate,” “expect,” “forecast,” “guidance,” “expectations”, “outlook,” “intend,” “may,” “possible,” “potential,” “predict,” “project,” “propose” or other similar words, phrases or expressions, or other variations of such words. These forward-looking statements are subject to various risks and uncertainties, many of which are outside of the Company’s control. There can be no assurances that the Company will realize these expectations or that these beliefs will prove correct, and therefore investors and stakeholders should not place undue reliance on such statements. Factors that could cause actual results to differ materially from those in the forward-looking statements include, among other things, highly competitive office products market and failure to differentiate the Company from other office supply resellers or respond to decline in general office supplies sales or to shifting consumer demands; competitive pressures on the Company’s sales and pricing; the risk that the Company is unable to transform the business into a service-driven, B2B platform or that such a strategy will not result in the benefits anticipated; the risk that the Company will not be able to achieve the expected benefits of its strategic plans, including a potential sale of Varis on the terms proposed or at all and benefits related to Project Core; the risk that the Company may not be able to realize the anticipated benefits of acquisitions due to unforeseen liabilities, future capital expenditures, expenses, indebtedness and the unanticipated loss of key customers or the inability to achieve expected revenues, synergies, cost savings or financial performance; the risk that the Company is unable to successfully maintain a relevant omni-channel experience for its customers; the risk that the Company is unable to execute the Maximize B2B Restructuring Plan successfully or that such plan will not result in the benefits anticipated; failure to effectively manage the Company’s real estate portfolio; loss of business with government entities, purchasing consortiums, and sole- or limited- source distribution arrangements; failure to attract and retain qualified personnel, including employees in stores, service centers, distribution centers, field and corporate offices and executive management, and the inability to keep supply of skills and resources in balance with customer demand; failure to execute effective advertising efforts and maintain the Company’s reputation and brand at a high level; disruptions in computer systems, including delivery of technology services; breach of information technology systems affecting reputation, business partner and customer relationships and operations and resulting in high costs and lost revenue; unanticipated downturns in business relationships with customers or terms with the suppliers, third-party vendors and business partners; disruption of global sourcing activities, evolving foreign trade policy (including tariffs imposed on certain foreign made goods); exclusive Office Depot branded products are subject to additional product, supply chain and legal risks; product safety and quality concerns of manufacturers’ branded products and services and Office Depot private branded products; covenants in the credit facility; general disruption in the credit markets; incurrence of significant impairment charges; retained responsibility for liabilities of acquired companies; fluctuation in quarterly operating results due to seasonality of the Company’s business; changes in tax laws in jurisdictions where the Company operates; increases in wage and benefit costs and changes in labor regulations; changes in the regulatory environment, legal compliance risks and violations of the U.S. Foreign Corrupt Practices Act and other worldwide anti-bribery laws; volatility in the Company’s common stock price; changes in or the elimination of the payment of cash dividends on Company common stock; macroeconomic conditions such as higher interest rates and future declines in business or consumer spending; increases in fuel and other commodity prices and the cost of material, energy and other production costs, or unexpected costs that cannot be recouped in product pricing; unexpected claims, charges, litigation, dispute resolutions or settlement expenses; catastrophic events, including the impact of weather events on the Company’s business; the discouragement of lawsuits by shareholders against the Company and its directors and officers as a result of the exclusive forum selection of the Court of Chancery, the federal district court for the District of Delaware or other Delaware state courts by the Company as the sole and exclusive forum for such lawsuits; and the impact of the COVID-19 pandemic on the Company’s business. The foregoing list of factors is not exhaustive. Investors and shareholders should carefully consider the foregoing factors and the other risks and uncertainties described in the Company’s Annual Reports on Form 10-K, Quarterly Reports on Form 10-Q, and Current Reports on Form 8-K filed with the U.S. Securities and Exchange Commission. The Company does not assume any obligation to update or revise any forward-looking statements.
Strong financial results further validates solid execution of strategic initiatives to grow and drive stronger earnings power
Revenue up 5% to a record $50.0 million reflecting strength in defense and refining; gross margin expanded 170 basis points to 24.8%
Net income increased 12% to $3.0 million for net margin of 5.9%, adjusted net income1 was up 20% to $3.6 million and adjusted EBITDA1 was $5.1 million, or 10.3% of sales
Orders of $55.8 million driven by defense market and international demand, resulted in a book-to-bill ratio of 1.1x and nearly $400 million in backlog2
Strong balance sheet with no debt and $21.6 million of cash at June 30, 2024, provides financial flexibility to support future growth
BATAVIA, N.Y.–(BUSINESS WIRE)– First paragraph, first sentence of release should read: Graham Corporation (NYSE: GHM) (“GHM” or the “Company”), a global leader in the design and manufacture of mission critical fluid, power, heat transfer and vacuum technologies for the defense, space, energy, and process industries, today reported financial results for its first quarter for the fiscal year ending March 31, 2025 (“fiscal 2025”). (instead of Graham Corporation (NYSE: GHM) (“GHM” or the “Company”), a global leader in the design and manufacture of mission critical fluid, power, heat transfer and vacuum technologies for the defense, space, energy, and process industries, today reported financial results for its first quarter for the fiscal year ended June 30, 2024 (“fiscal 2025”).
The updated release reads:
GRAHAM CORPORATION NET INCOME INCREASED 12% TO $3.0 MILLION ON EXPANDED GROSS MARGIN OF 24.8% IN FIRST QUARTER OF FISCAL 2025
Graham Corporation (NYSE: GHM) (“GHM” or the “Company”), a global leader in the design and manufacture of mission critical fluid, power, heat transfer and vacuum technologies for the defense, space, energy, and process industries, today reported financial results for its first quarter for the fiscal year ending March 31, 2025 (“fiscal 2025”). Results for the quarter include the P3 Technologies, LLC (“P3”) acquisition, which closed on November 9, 2023.
“We are delivering consistent improvement, solid growth and strengthening profitability,” commented Daniel J. Thoren, President and Chief Executive Officer. “We believe our solid results reflect the commitment and discipline of the GHM team, the confidence our customers have bestowed on us and the effectiveness of our strategy to build better companies. In addition to the visibility our nearly $400 million in backlog provides, it is worth noting that the growth of our defense business has also reduced our economic sensitivity as we receive a steady flow of program renewals and new opportunities with the U.S. Navy. In fact, we will be breaking ground this month on a new 29,000 square foot facility in Batavia, NY to provide production efficiencies, and increased capabilities and capacity to support our defense customer’s needs.”
He concluded, “These are exciting times at Graham Corp. We are steadily advancing our plan, delivering on our targets and are strategically positioning for continued growth.”
First Quarter Fiscal 2025 Performance Review (All comparisons are with the same prior-year period unless noted otherwise.)
*Graham believes that, when used in conjunction with measures prepared in accordance with U.S. generally accepted accounting principles, adjusted net income, adjusted diluted net income per share, Adjusted EBITDA and adjusted EBITDA margin, which are non-GAAP measures, help in the understanding of its operating performance. See attached tables and other information on pages 10 and 11 for important disclosures regarding Graham’s use of these non-GAAP measures.
Record quarterly net sales of $50.0 million increased 5%, or $2.4 million, and included $1.6 million of incremental sales from P3. Sales to the defense market increased $6.3 million, or 28%, and were driven by better execution, improved pricing, and increased direct labor. These increases more than offset lower “Other” revenue that reflected variability in project timing across multiple markets and customers. Aftermarket sales to the refining, chemical/petrochemical, and defense markets of $7.8 million remained strong but were $3.0 million lower than the prior year record levels. See supplemental data for a further breakdown of sales by market and region.
Gross margin expanded 170 basis points to 24.8%, which reflected higher margin defense sales, higher margin P3 sales, and improved execution. Additionally, gross profit for the quarter benefited $480 thousand due to a $2.1 million grant received from BlueForge Alliance to reimburse the Company for the cost of its defense welder training programs in Batavia and related equipment. BlueForge Alliance is a nonprofit, neutral integrator that supports the U.S. Navy’s submarine industrial base initiatives.
Selling, general and administrative expense (“SG&A”), inclusive of amortization, was $9.3 million, or 18.6% of sales, up $2.0 million over the prior year. This increase reflects the continued investments the Company is making in its operations, employees, and technology. This included $0.3 million of incremental costs related to P3, $0.3 million for enterprise resource planning (“ERP”) conversion costs at the Batavia facility, $0.4 million of incremental research and development costs, and a $0.3 million increase in the supplemental performance bonus for Barber-Nichols employees3. When compared with the fourth quarter of fiscal 2024, SG&A expenses decreased $1.8 million, or 16%, primarily due to lower professional services fees and performance-based compensation.
Cash Management and Balance Sheet Cash provided by operating activities was $8.7 million for the first quarter of fiscal 2025. Cash and cash equivalents on June 30, 2024, were $21.6 million up from $16.9 million on March 31, 2024. Capital expenditures for the first quarter of fiscal 2025 were $3.0 million.
The Company had no debt outstanding at June 30, 2024 with $29 million available on its senior secured revolving credit facility.
Orders for the three-month period ended June 30, 2024, were $55.8 million, which equated to a book-to-bill ratio of 1.1x. Defense orders represented 51% of total orders and included the second option year award to support the MK48 Mod 7 Heavyweight Torpedo program with mission critical alternators and regulators. Additionally, orders for the quarter included three surface condenser systems for the world’s first net-zero carbon emissions integrated ethylene cracker and derivatives site located in North America. Aftermarket orders for the refining and petrochemical markets for the first quarter of fiscal 2025 increased 4% to $8.2 million compared with the prior-year period.
Backlog at quarter end was $396.8 million, up 23% compared with the prior-year period and up 2% compared with the end of the trailing fourth quarter of fiscal 2024. Approximately 35% to 45% of orders currently in backlog are expected to be converted to sales in the next twelve months and another 25% to 30% is expected to convert to sales over the following year. The majority of orders expected to convert beyond twelve months are for the defense industry, specifically the U.S. Navy.
Fiscal 2025 Outlook The Company’s outlook for 2025 is reaffirmed as follows:
(1) Includes approximately $6.5 million to $7.5 million of BN supplemental performance bonus, equity-based compensation, and ERP conversion costs included in SG&A expense. (2) Excludes net interest expense, income taxes, depreciation and amortization from net income, as well as approximately $2.0 million to $3.0 million of equity-based compensation and ERP conversion costs included in SG&A expense.
Webcast and Conference Call GHM’s management will host a conference call and live webcast on August 7, 2024 at 11:00 a.m. Eastern Time (“ET”) to review its financial results as well as its strategy and outlook. The review will be accompanied by a slide presentation, which will be made available immediately prior to the conference call on GHM’s investor relations website.
A question-and-answer session will follow the formal presentation. GHM’s conference call can be accessed by calling (201) 689-8560. Alternatively, the webcast can be monitored from the events section of GHM’s investor relations website.
A telephonic replay will be available from 3:00 p.m. ET today through Wednesday, August 14, 2024. To listen to the archived call, dial (412) 317-6671 and enter conference ID number 13746993 or access the webcast replay via the Company’s website at ir.grahamcorp.com, where a transcript will also be posted once available.
About Graham Corporation Graham is a global leader in the design and manufacture of mission critical fluid, power, heat transfer and vacuum technologies for the defense, space, energy, and process industries. Graham Corporation and its family of global brands are built upon world-renowned engineering expertise in vacuum and heat transfer, cryogenic pumps, and turbomachinery technologies, as well as its responsive and flexible service and the unsurpassed quality customers have come to expect from the Company’s products and systems. Graham Corporation routinely posts news and other important information on its website, grahamcorp.com, where additional information on Graham Corporation and its businesses can be found.
Safe Harbor Regarding Forward Looking Statements This news release contains forward-looking statements within the meaning of Section 27A of the Securities Act of 1933, as amended, and Section 21E of the Securities Exchange Act of 1934, as amended.
Forward-looking statements are subject to risks, uncertainties and assumptions and are identified by words such as “expects,” “future,” “outlook,” “anticipates,” “believes,” “could,” “guidance,” “should,” ”may”, “will,” “plan” and other similar words. All statements addressing operating performance, events, or developments that Graham Corporation expects or anticipates will occur in the future, including but not limited to, profitability of future projects and the business, its ability to deliver to plan, its ability to continue to strengthen relationships with customers in the defense industry, its ability to secure future projects and applications, expected expansion and growth opportunities, anticipated sales, revenues, adjusted EBITDA, adjusted EBITDA margins, capital expenditures and SG&A expenses, the timing of conversion of backlog to sales, orders, market presence, profit margins, tax rates, foreign sales operations, customer preferences, changes in market conditions in the industries in which it operates, changes in general economic conditions and customer behavior, forecasts regarding the timing and scope of the economic recovery in its markets, and its acquisition and growth strategy, are forward-looking statements. Because they are forward-looking, they should be evaluated in light of important risk factors and uncertainties. These risk factors and uncertainties are more fully described in Graham Corporation’s most recent Annual Report filed with the Securities and Exchange Commission (the “SEC”), included under the heading entitled “Risk Factors”, and in other reports filed with the SEC.
Should one or more of these risks or uncertainties materialize or should any of Graham Corporation’s underlying assumptions prove incorrect, actual results may vary materially from those currently anticipated. In addition, undue reliance should not be placed on Graham Corporation’s forward-looking statements. Except as required by law, Graham Corporation disclaims any obligation to update or publicly announce any revisions to any of the forward-looking statements contained in this news release.
Non-GAAP Financial Measures Adjusted EBITDA is defined as consolidated net income (loss) before net interest expense, income taxes, depreciation, amortization, other acquisition related expenses, and other unusual/nonrecurring expenses. Adjusted EBITDA margin is defined as Adjusted EBITDA as a percentage of sales. Adjusted EBITDA and Adjusted EBITDA margin are not measures determined in accordance with generally accepted accounting principles in the United States, commonly known as GAAP. Nevertheless, Graham believes that providing non-GAAP information, such as Adjusted EBITDA and Adjusted EBITDA margin, is important for investors and other readers of Graham’s financial statements, as it is used as an analytical indicator by Graham’s management to better understand operating performance. Moreover, Graham’s credit facility also contains ratios based on Adjusted EBITDA. Because Adjusted EBITDA and Adjusted EBITDA margin are non-GAAP measures and are thus susceptible to varying calculations, Adjusted EBITDA, and Adjusted EBITDA margin, as presented, may not be directly comparable to other similarly titled measures used by other companies.
Adjusted net income and adjusted net income per diluted share are defined as net income and net income per diluted share as reported, adjusted for certain items and at a normalized tax rate. Adjusted net income and adjusted net income per diluted share are not measures determined in accordance with GAAP, and may not be comparable to the measures as used by other companies. Nevertheless, Graham believes that providing non-GAAP information, such as adjusted net income and adjusted net income per diluted share, is important for investors and other readers of the Company’s financial statements and assists in understanding the comparison of the current quarter’s and current fiscal year’s net income and net income per diluted share to the historical periods’ net income and net income per diluted share. Graham also believes that adjusted net income per share, which adds back intangible amortization expense related to acquisitions, provides a better representation of the cash earnings of the Company.
Forward-Looking Non-GAAP Measures Forward-looking adjusted EBITDA and adjusted EBITDA margin are non-GAAP measures. The Company is unable to present a quantitative reconciliation of these forward-looking non-GAAP financial measures to their most directly comparable forward-looking GAAP financial measures because such information is not available, and management cannot reliably predict the necessary components of such GAAP measures without unreasonable effort largely because forecasting or predicting our future operating results is subject to many factors out of our control or not readily predictable. In addition, the Company believes that such reconciliations would imply a degree of precision that would be confusing or misleading to investors. The unavailable information could have a significant impact on the Company’s fiscal 2024 financial results. These non-GAAP financial measures are preliminary estimates and are subject to risks and uncertainties, including, among others, changes in connection with purchase accounting, quarter-end, and year-end adjustments. Any variation between the Company’s actual results and preliminary financial estimates set forth above may be material.
Key Performance Indicators In addition to the foregoing non-GAAP measures, management uses the following key performance metrics to analyze and measure the Company’s financial performance and results of operations: orders, backlog, and book-to-bill ratio. Management uses orders and backlog as measures of current and future business and financial performance, and these may not be comparable with measures provided by other companies. Orders represent written communications received from customers requesting the Company to provide products and/or services. Backlog is defined as the total dollar value of net orders received for which revenue has not yet been recognized. Management believes tracking orders and backlog are useful as they often times are leading indicators of future performance. In accordance with industry practice, contracts may include provisions for cancellation, termination, or suspension at the discretion of the customer.
The book-to-bill ratio is an operational measure that management uses to track the growth prospects of the Company. The Company calculates the book-to-bill ratio for a given period as net orders divided by net sales.
Given that each of orders, backlog, and book-to-bill ratio are operational measures and that the Company’s methodology for calculating orders, backlog and book-to-bill ratio does not meet the definition of a non-GAAP measure, as that term is defined by the U.S. Securities and Exchange Commission, a quantitative reconciliation for each is not required or provided.
BOCA RATON, Fla.–(BUSINESS WIRE)–Aug. 7, 2024– The GEO Group, Inc. (NYSE: GEO) (“GEO”), a leading provider of support services for secure facilities, processing centers, and reentry centers, as well as enhanced in-custody rehabilitation, post-release support, and electronic monitoring programs, reported today its financial results for the second quarter and first six months of 2024.
Second Quarter 2024 Highlights
Total revenues of $607.2 million
Net Loss Attributable to GEO of $0.25 per diluted share, reflects costs associated with the extinguishment of debt of $82.3 million, pre-tax, in connection with the April 2024 debt refinancing
Adjusted Net Income of $0.23 per diluted share
Adjusted EBITDA of $119.3 million
For the second quarter 2024, we reported a net loss attributable to GEO of $32.5 million, or $0.25 per diluted share, compared to net income attributable to GEO of $29.6 million, or $0.20 per diluted share, for the second quarter 2023. Second quarter 2024 results reflect costs associated with the extinguishment of debt of $82.3 million, pre-tax, in connection with the April 2024 refinancing of our debt. Excluding the costs associated with the extinguishment of debt and other unusual and/or nonrecurring items, we reported adjusted net income for the second quarter 2024 of $30.1 million, or $0.23 per diluted share, compared to $29.2 million, or $0.24 per diluted share, for the second quarter 2023.
We reported total revenues for the second quarter 2024 of $607.2 million compared to $593.9 million for the second quarter 2023. We reported second quarter 2024 Adjusted EBITDA of $119.3 million, compared to $129.0 million for the second quarter 2023.
George C. Zoley, Executive Chairman of GEO, said, “Our diversified business units have continued to deliver steady financial and operational performance. We are pleased to have completed the comprehensive refinancing of our debt, including the exchange and retirement of substantially all of our convertible notes, during the second quarter of 2024. We believe that these important transactions significantly enhanced our balance sheet, lowered our average cost of debt, and have given us greater flexibility to evaluate options for capital returns in the future. We remain focused on the disciplined allocation of capital to enhance long-term value for shareholders as we execute our company’s strategic priorities and pursue quality growth opportunities.”
First Six Months 2024 Highlights
Total revenues of $1.21 billion
Net Loss Attributable to GEO of $0.08 per diluted share, reflects costs associated with the extinguishment of debt of $82.4 million, pre-tax
Adjusted Net Income of $0.43 per diluted share
Adjusted EBITDA of $236.9 million
For the first six months of 2024, we reported a net loss attributable to GEO of $9.9 million, or $0.08 per diluted share, compared to net income attributable to GEO of $57.6 million, or $0.39 per diluted share, for the first six months of 2023. Results for the first six months of 2024 reflect costs associated with the extinguishment of debt of $82.4 million, pre-tax. Excluding the costs associated with the extinguishment of debt and other unusual and/or nonrecurring items, we reported adjusted net income for the first six months of 2024 of $53.8 million, or $0.43 per diluted share, compared to $57.3 million, or $0.46 per diluted share, for the first six months of 2023.
We reported total revenues for the first six months of 2024 of $1.21 billion compared to $1.20 billion for the first six months of 2023. We reported Adjusted EBITDA for the first six months of 2024 of $236.9 million, compared to $259.9 million for the first six months of 2023.
Financial Guidance
Today, we updated our financial guidance for 2024. For the full year 2024, we expect net income Attributable to GEO to be in a range of $0.40 to $0.51 per diluted share, on annual revenues of approximately $2.44 billion and reflecting an effective tax rate of approximately 24 percent, inclusive of known discrete items. Our full-year 2024 guidance reflects the costs associated with the extinguishment of debt of $82.4 million, pre-tax, in connection with the refinancing of our debt.
Excluding the costs associated with the extinguishment of debt and other unusual and/or nonrecurring items, we expect full year 2024 Adjusted Net Income to be in a range of $0.82 to $0.93 per diluted share. We expect full year 2024 Adjusted EBITDA to be between $485 million and $505 million.
For the third quarter 2024, we expect net income attributable to GEO to be in a range of $0.21 to $0.25 per diluted share. We expect third quarter 2024 revenues to be in a range of $606 million to $616 million. We expect third quarter 2024 Adjusted EBITDA to be in a range of $123 million to $130 million.
For the fourth quarter 2024, we expect net income attributable to GEO to be in a range of $0.22 to $0.29 per diluted share. We expect fourth quarter 2024 revenues to be in a range of $611 million to $621 million. We expect fourth quarter 2024 Adjusted EBITDA to be in a range of $125 million to $138 million.
Recent Developments
During the second quarter 2024, U.S. Immigration and Customs Enforcement (“ICE”) issued a task order for the GEO-owned 1,940-bed Adelanto ICE Processing Center in California (the “Adelanto Center”), which provides for continued funding through October 19, 2024, allowing additional time for ICE to obtain relief from previously disclosed COVID-related litigation that currently prevents full use of the Adelanto Center. ICE and GEO entered into a 15-year contract on December 19, 2019, for the provision of secure residential housing and care at the Adelanto Center, consisting of a 5-year base period, ending on December 19, 2024, followed by two 5-year option periods.
On June 20, 2024, we announced that GEO had given the Oklahoma Department of Corrections (“ODOC”) notice of our intent to discontinue our management contract for the company-owned, 2,388-bed Lawton Correctional and Rehabilitation Facility (the “Lawton Facility”), which was set to expire on June 30, 2024. Subsequently, on June 26, 2024, GEO and the ODOC agreed to enter into a new one-year contract, continuing GEO’s operation of the Lawton Facility through June 30, 2025, under revised terms.
Balance Sheet
During the second quarter 2024, we completed the comprehensive refinancing of our debt, including the exchange and retirement of $229.4 million of the $230 million in aggregate principal amount of our senior unsecured exchangeable notes due 2026 using a combination of $229.4 million in cash and approximately 12.4 million shares of GEO common stock.
As of June 30, 2024, our senior debt was comprised of $650.0 million aggregate principal amount of 8.625% senior secured notes due 2029; $625.0 million aggregate principal amount of 10.25% senior unsecured notes due 2031; $444.4 million in borrowings under a Term Loan B due 2029, bearing interest at SOFR plus 5.25%; $40.0 million in borrowings outstanding under a $310 million Revolving Credit Facility bearing interest at SOFR plus 3.00%; and $40.7 million in other secured and unsecured debt. Net of cash-on-hand of $46.3 million, our total net debt was approximately $1.754 billion at the end of the second quarter 2024.
Conference Call Information
We have scheduled a conference call and webcast for today at 11:00 AM (Eastern Time) to discuss our second quarter 2024 financial results as well as our outlook. The call-in number for the U.S. is 1-877-250-1553 and the international call-in number is 1-412-542-4145. In addition, a live audio webcast of the conference call may be accessed on the Webcasts section under the News, Events and Reports tab of GEO’s investor relations webpage at investors.geogroup.com. A replay of the webcast will be available on the website for one year. A telephonic replay of the conference call will be available through August 14, 2024, at 1-877-344-7529 (U.S.) and 1-412-317-0088 (International). The participant passcode for the telephonic replay is 4116450.
About The GEO Group
The GEO Group, Inc. (NYSE: GEO) is a leading diversified government service provider, specializing in design, financing, development, and support services for secure facilities, processing centers, and community reentry centers in the United States, Australia, South Africa, and the United Kingdom. GEO’s diversified services include enhanced in-custody rehabilitation and post-release support through the award-winning GEO Continuum of Care®, secure transportation, electronic monitoring, community-based programs, and correctional health and mental health care. GEO’s worldwide operations include the ownership and/or delivery of support services for 100 facilities totaling approximately 81,000 beds, including idle facilities and projects under development, with a workforce of up to approximately 18,000 employees.
Reconciliation Tables and Supplemental Information
GEO has made available Supplemental Information which contains reconciliation tables of Net Income Attributable to GEO to Adjusted Net Income, and Net Income to EBITDA and Adjusted EBITDA, along with supplemental financial and operational information on GEO’s business and other important operating metrics. The reconciliation tables are also presented herein. Please see the section below titled “Note to Reconciliation Tables and Supplemental Disclosure – Important Information on GEO’s Non-GAAP Financial Measures” for information on how GEO defines these supplemental Non-GAAP financial measures and reconciles them to the most directly comparable GAAP measures. GEO’s Reconciliation Tables can be found herein and in GEO’s Supplemental Information available on GEO’s investor webpage at investors.geogroup.com.
Note to Reconciliation Tables and Supplemental Disclosure – Important Information on GEO’s Non-GAAP Financial Measures
Adjusted Net Income, EBITDA, and Adjusted EBITDA are non-GAAP financial measures that are presented as supplemental disclosures. GEO has presented herein certain forward-looking statements about GEO’s future financial performance that include non-GAAP financial measures, including Net Debt, Net Leverage, and Adjusted EBITDA. The determination of the amounts that are included or excluded from these non-GAAP financial measures is a matter of management judgment and depends upon, among other factors, the nature of the underlying expense or income amounts recognized in a given period.
While we have provided a high level reconciliation for the guidance ranges for full year 2024, we are unable to present a more detailed quantitative reconciliation of the forward-looking non-GAAP financial measures to their most directly comparable forward-looking GAAP financial measures because management cannot reliably predict all of the necessary components of such GAAP measures. The quantitative reconciliation of the forward-looking non-GAAP financial measures will be provided for completed annual and quarterly periods, as applicable, calculated in a consistent manner with the quantitative reconciliation of non-GAAP financial measures previously reported for completed annual and quarterly periods.
Net Debt is defined as gross principal debt less cash from restricted subsidiaries. Net Leverage is defined as Net Debt divided by Adjusted EBITDA.
EBITDA is defined as net income adjusted by adding provisions for income tax, interest expense, net of interest income, and depreciation and amortization. Adjusted EBITDA is defined as EBITDA adjusted for gain/(loss) on asset divestitures/impairment, pre-tax, net loss attributable to non-controlling interests, stock-based compensation expenses, pre-tax, start-up expenses, pre-tax, ATM equity program expenses, pre-tax, transaction fees, pre-tax, close-out expenses, pre-tax, other non-cash items, pre-tax, and certain other adjustments as defined from time to time.
Given the nature of our business as a real estate owner and operator, we believe that EBITDA and Adjusted EBITDA are helpful to investors as measures of our operational performance because they provide an indication of our ability to incur and service debt, to satisfy general operating expenses, to make capital expenditures, and to fund other cash needs or reinvest cash into our business.
We believe that by removing the impact of our asset base (primarily depreciation and amortization) and excluding certain non-cash charges, amounts spent on interest and taxes, and certain other charges that are highly variable from year to year, EBITDA and Adjusted EBITDA provide our investors with performance measures that reflect the impact to operations from trends in occupancy rates, per diem rates and operating costs, providing a perspective not immediately apparent from net income.
The adjustments we make to derive the non-GAAP measures of EBITDA and Adjusted EBITDA exclude items which may cause short-term fluctuations in income from continuing operations and which we do not consider to be the fundamental attributes or primary drivers of our business plan and they do not affect our overall long-term operating performance.
EBITDA and Adjusted EBITDA provide disclosure on the same basis as that used by our management and provide consistency in our financial reporting, facilitate internal and external comparisons of our historical operating performance and our business units and provide continuity to investors for comparability purposes.
Adjusted Net Income is defined as net income/(loss) attributable to GEO adjusted for certain items which by their nature are not comparable from period to period or that tend to obscure GEO’s actual operating performance, including for the periods presented loss on the extinguishment of debt, pre-tax, start-up expenses, pre-tax, transaction fees, pre-tax, ATM equity program expenses, pre-tax, close-out expenses, pre-tax, discrete tax benefit, and tax effect of adjustments to net income attributable to GEO.
Safe-Harbor Statement
This press release contains forward-looking statements regarding future events and future performance of GEO that involve risks and uncertainties that could materially and adversely affect actual results, including statements regarding GEO’s financial guidance for the full year, third quarter, and fourth quarter of 2024, statements regarding GEO’s focus on reducing net debt, deleveraging its balance sheet, positioning itself to explore options to return capital to shareholders in the future, and pursuing a disciplined allocation of capital to enhance long-term value for shareholders, executing on GEO’s strategic priorities, and pursuing quality growth opportunities. Forward-looking statements generally can be identified by the use of forward-looking terminology such as “may,” “will,” “expect,” “anticipate,” “intend,” “plan,” “believe,” “seek,” “estimate,” or “continue” or the negative of such words and similar expressions. Risks and uncertainties that could cause actual results to vary from current expectations and forward-looking statements contained in this press release include, but are not limited to: (1) GEO’s ability to meet its financial guidance for 2024 given the various risks to which its business is exposed; (2) GEO’s ability to deleverage and repay, refinance or otherwise address its debt maturities in an amount and on terms commercially acceptable to GEO, and on the timeline it expects or at all; (3) GEO’s ability to identify and successfully complete any potential sales of company-owned assets and businesses or potential acquisitions of assets or businesses on commercially advantageous terms on a timely basis, or at all; (4) changes in federal and state government policy, orders, directives, legislation and regulations that affect public-private partnerships with respect to secure, correctional and detention facilities, processing centers and reentry centers, including the timing and scope of implementation of President Biden’s Executive Order directing the U.S. Attorney General not to renew the U.S. Department of Justice contracts with privately operated criminal detention facilities; (5) changes in federal immigration policy; (6) public and political opposition to the use of public-private partnerships with respect to secure correctional and detention facilities, processing centers and reentry centers; (7) any continuing impact of the COVID-19 global pandemic on GEO and GEO’s ability to mitigate the risks associated with COVID-19; (8) GEO’s ability to sustain or improve company-wide occupancy rates at its facilities; (9) fluctuations in GEO’s operating results, including as a result of contract terminations, contract renegotiations, changes in occupancy levels and increases in GEO’s operating costs; (10) general economic and market conditions, including changes to governmental budgets and its impact on new contract terms, contract renewals, renegotiations, per diem rates, fixed payment provisions, and occupancy levels; (11) GEO’s ability to address inflationary pressures related to labor related expenses and other operating costs; (12) GEO’s ability to timely open facilities as planned, profitably manage such facilities and successfully integrate such facilities into GEO’s operations without substantial costs; (13) GEO’s ability to win management contracts for which it has submitted proposals and to retain existing management contracts; (14) risks associated with GEO’s ability to control operating costs associated with contract start-ups; (15) GEO’s ability to successfully pursue growth opportunities and continue to create shareholder value; (16) GEO’s ability to obtain financing or access the capital markets in the future on acceptable terms or at all; and (17) other factors contained in GEO’s Securities and Exchange Commission periodic filings, including its Form 10-K, 10-Q and 8-K reports, many of which are difficult to predict and outside of GEO’s control.
NEW YORK, August 6, 2024 /PRNewswire/ — Bit Digital, Inc. (Nasdaq: BTBT) (“Bit Digital” or the “Company”), a sustainable platform for digital assets and artificial intelligence (“AI”) infrastructure headquartered in New York, announced its unaudited digital asset production and corporate updates for the month of July 2024.
Corporate Highlights for July 2024
The Company had 256 servers actively generating revenue from its initial Bit Digital AI contract, as of July 31, 2024. The Company earned an estimated $4.3 million of unaudited revenue from this contract during the month of July 2024.
In July 2024, the Company produced 60.5 BTC, a 1.9% decrease compared to the prior month.
The Company’s active hash rate was approximately 2.46 EH/s as of July 31, 2024.
Treasury holdings of BTC and ETH were 641.8 and 27,274.4 with a fair market value of approximately $41.5 million and $88.1 million, respectively, on July 31, 2024.
The BTC equivalent1 of our digital asset holdings as of July 31, 2024, was approximately 2,009.0 or approximately $129.8 million.
The Company had cash and cash equivalents of $82.1 million and total liquidity (defined as cash and cash equivalents, USDC, and the fair market value of digital assets) of approximately $211.9 million, as of July 31, 2024.
Proof-of-Stake Highlights
The Company had approximately 17,184 ETH actively staked in native staking protocols as of July 31, 2024.
Bit Digital earned a blended APY of approximately 3.3% on its staked ETH position for the month of July 2024.
The Company earned aggregate staking rewards of approximately 47.5 ETH during July 2024.
Upcoming Events
2024 Annual Gateway Conference, San Francisco, CA on September 4-5
About Bit Digital
Bit Digital, Inc. is a sustainable platform for digital assets and artificial intelligence (“AI”) infrastructure headquartered in New York City. Our bitcoin mining operations are located in the US, Canada, and Iceland. The Company has established a business line, Bit Digital AI, that offers specialized cloud-infrastructure services for artificial intelligence applications. For additional information, please contact ir@bit-digital.com or visit our website at www.bit-digital.com.
Investor Notice
Investing in our securities involves a high degree of risk. Before making an investment decision, you should carefully consider the risks, uncertainties and forward-looking statements described under “Risk Factors” in Item 3.D of our most recent Annual Report on Form 20-F for the fiscal year ended December 31, 2023. If any material risk was to occur, our business, financial condition or results of operations would likely suffer. In that event, the value of our securities could decline and you could lose part or all of your investment. The risks and uncertainties we describe are not the only ones facing us. Additional risks not presently known to us or that we currently deem immaterial may also impair our business operations. In addition, our past financial performance may not be a reliable indicator of future performance, and historical trends should not be used to anticipate results in the future. Future changes in the network-wide mining difficulty rate or bitcoin hash rate may also materially affect the future performance of Bit Digital’s production of bitcoin. Actual operating results will vary depending on many factors including network difficulty rate, total hash rate of the network, the operations of our facilities, the status of our miners, and other factors.
Safe Harbor Statement
This press release may contain certain “forward-looking statements” relating to the business of Bit Digital, Inc., and its subsidiary companies. All statements, other than statements of historical fact included herein are “forward-looking statements.” These forward-looking statements are often identified by the use of forward-looking terminology such as “believes,” “expects,” or similar expressions, involving known and unknown risks and uncertainties. Although the Company believes that the expectations reflected in these forward-looking statements are reasonable, they do involve assumptions, risks and uncertainties, and these expectations may prove to be incorrect. Investors should not place undue reliance on these forward-looking statements, which speak only as of the date of this press release. The Company’s actual results could differ materially from those anticipated in these forward-looking statements as a result of a variety of factors, including those discussed in the Company’s periodic reports that are filed with the Securities and Exchange Commission and available on its website at http://www.sec.gov. All forward-looking statements attributable to the Company or persons acting on its behalf are expressly qualified in their entirety by these factors. Other than as required under the securities laws, the Company does not assume a duty to update these forward-looking statements.
MORTON GROVE, Ill., Aug. 6, 2024 /PRNewswire/ — Lifeway Foods, Inc. (Nasdaq: LWAY) (“Lifeway” or “the Company”), a leading U.S. supplier of kefir and fermented probiotic products to support the microbiome, today announced it will report financial results for the second quarter ended June 30, 2024 on August 13, 2024 before market hours.
A pre-recorded conference call and webcast with Julie Smolyanksy, Lifeway’s President and Chief Executive Officer, discussing these results with additional comments and details will be made available through the “Investor Relations” section of the Company’s website at https://lifewaykefir.com/webinars-reports/ upon dissemination of the second quarter results on August 13, 2024 before market hours.
About Lifeway Foods, Inc. Lifeway Foods, Inc., which has been recognized as one of Forbes’ Best Small Companies, is America’s leading supplier of the probiotic, fermented beverage known as kefir. In addition to its line of drinkable kefir, the company also produces a variety of cheeses and a ProBugs line for kids. Lifeway’s tart and tangy fermented dairy products are now sold across the United States, Mexico, Ireland and France. Learn how Lifeway is good for more than just you at lifewayfoods.com.
Media: Derek Miller Vice President of Communications, Lifeway Foods Email: derekm@lifeway.net
General inquiries: Lifeway Foods, Inc. Phone: 847-967-1010 Email: info@lifeway.net
Operating income of $27.4 million; adjusted operating income1 of $65.8 million
Net loss of $6.5 million, down $8.3 million y/y
Adjusted EBITDA1 of $72.3 million with a margin1 of 6.7%
Diluted EPS of ($0.21); Adjusted diluted EPS1 of $0.83
Over $4 billion of recent awards, including a new award valued up to $3.0+ billion to provide next generation readiness
Successfully repriced and extended $904 million Term Loan B
2024 Guidance:
Raising full-year revenue guidance and reaffirming Adjusted EBITDA, EPS, and Operating Cash Flow1
MCLEAN, Va., Aug. 6, 2024 /PRNewswire/ — V2X, Inc. (NYSE:VVX) announced second quarter 2024 financial results.
“I am honored to join the V2X team and look forward to leveraging our mission first culture, differentiated capabilities, and impressive past performance to achieve our next stage of growth,” said Jeremy C. Wensinger, President and Chief Executive Officer of V2X. “Our people, processes, agility and expertise to operate worldwide are a differentiator. This enables alignment to critical missions with an ability to operate at scale around the globe.”
Mr. Wensinger continued, “Demand remains strong for our mission based full lifecycle solutions and was demonstrated through several recent awards valued at over $4 billion. This includes a new five-year award valued at $3.0+ billion to deliver next generation readiness. In addition, we received a new production award from the U.S. Army for our Gateway Mission Routers valued at $49 million, an award valued at $265 million to support NASA’s operations in preparation for human spaceflight missions at the Johnson Space Center, and the award of the F-5 adversarial aircraft program from the U.S. Navy valued at $747 million.”
“Importantly, our ability to deliver a full range of assured communications has resulted in two awards, further expanding our relationship with the Navy and our footprint in the Pacific. Our $88 million Naval Computer and Telecommunications Pacific award will provide vital C4I support to forces across the Pacific and Indian Oceans. Our $141 million Fleet Systems Engineering Team (FSET) program will continue to deliver end-to-end C4I systems engineering solutions. FSET ensures that no U.S. Navy Strike Group deploys without V2X.”
Mr. Wensinger concluded, “V2X has great momentum and I believe there is substantial opportunity to build upon the impressive foundation by further leveraging technology and solutions to enhance business and customer outcomes.”
Second Quarter 2024 Results
“V2X reported record revenue of $1.07 billion in the quarter, which represents 10% year-over-year growth,” said Shawn Mural, Senior Vice President and Chief Financial Officer. “Revenue growth in the quarter was achieved through continued expansion of existing business in the Pacific and Middle East regions, as well as new programs. Revenue growth in the Pacific was 29% year-over-year and 23% on a sequential basis, driven by continued expansion of scope and services in the region. Revenue growth in the Middle East was also 29% year-over-year, driven primarily by expansion in Qatar and the continued phase-in of our longer-term Saudi Aviation Training and Support Services program.”
“For the quarter, the Company reported operating income of $27.4 million and adjusted operating income1 of $65.8 million. Adjusted EBITDA1 was $72.3 million with a margin of 6.7%. Second quarter GAAP diluted EPS was ($0.21). Adjusted diluted EPS1 for the quarter was $0.83. The adjusted tax rate in the second quarter was 28% due to the executive transition. Absent this, our adjusted tax rate would have been approximately 23% yielding adjusted EPS of $0.88.”
“Year to date, net cash used by operating activities was $31.6 million, reflective of working capital requirements to support growth. Adjusted net cash used by operating activities1 was $137.3 million, adding back approximately $12.1 million of M&A and integration costs and removing the contribution of the master accounts receivable purchase or MARPA facility of $117.8 million.”
“At the end of the quarter, net debt for V2X was $1,150 million. Net leverage ratio1,2 was 3.56x, essentially flat compared to the first quarter 2024. We expect to achieve a net leverage ratio of 3.0x, by the end of 2024. During the quarter, we successfully repriced and extended our $904 million Term Loan B. This outcome is a testament to the strength in our business and is yielding additional interest expense savings while lowering our overall cost of capital.”
“Total backlog as of June 28, 2024, was $12.2 billion. Funded backlog was $2.9 billion. Bookings in the quarter were $759 million. We expect backlog to increase in the second half of the year due to awards and contract definitizations.”
Raising 2024 Revenue Guidance
Mr. Mural concluded, “Given our strong revenue performance in the first half of the year we are updating our total year guidance.”
Guidance for 2024 is as follows:
The Company is not providing a quantitative reconciliation with respect to this forward-looking non-GAAP measure in reliance on the “unreasonable efforts” exception set forth in SEC rules because certain financial information, the probable significance of which cannot be determined, is not available and cannot be reasonably estimated. For example, unusual, one-time, non-ordinary, or non-recurring costs, which relate to M&A, integration and related activities cannot be reasonably estimated. Forward-looking statements are based upon current expectations and are subject to factors that could cause actual results to differ materially from those suggested here, including those factors set forth in the Safe Harbor Statement below.
Second Quarter Conference Call
Management will conduct a conference call with analysts and investors at 8:00 a.m. ET on Tuesday, August 6, 2024. U.S.-based participants may dial in to the conference call at 877-506-6380, while international participants may dial 412-542-4198. A live webcast of the conference call as well as an accompanying slide presentation will be available here: https://app.webinar.net/Aba2LPOkBXe
A replay of the conference call will be posted on the V2X website shortly after completion of the call and will be available for one year. A telephonic replay will also be available through August 20, 2024, at 844-512-2921 (domestic) or 412-317-6671 (international) with passcode 10190283.
Presentation slides that will be used in conjunction with the conference call will also be made available online in advance on the “investors” section of the company’s website at https://gov2x.com. V2X recognizes its website as a key channel of distribution to reach public investors and as a means of disclosing material non-public information to comply with its obligations under the U.S. Securities and Exchange Commission (“SEC”) Regulation FD.
Footnotes:
1 See “Key Performance Indicators and Non-GAAP Financial Measures” for descriptions and reconciliations. 2 Net leverage ratio of 3.6x equals net debt of $1,150 million divided by trailing twelve-month (TTM) bank EBITDA of $322.7 million.
About V2X
V2X builds innovative solutions that integrate physical and digital environments by aligning people, actions, and technology. V2X is embedded in all elements of a critical mission’s lifecycle to enhance readiness, optimize resource management, and boost security. The company provides innovation spanning national security, defense, civilian, and international markets. With a global team of approximately 16,000 professionals, V2X enables mission success by injecting AI and machine learning capabilities to meet today’s toughest challenges across all operational domains.
Safe Harbor Statement under the Private Securities Litigation Reform Act of 1995 (the “Act”): Certain material presented herein includes forward-looking statements intended to qualify for the safe harbor from liability established by the Act. These forward-looking statements include, but are not limited to, all the statements and items listed under “2024 Guidance” above and other assumptions contained therein for purposes of such guidance, other statements about our 2024 performance outlook, revenue, contract opportunities, and any discussion of future operating or financial performance.
Forward-looking statements generally can be identified by the use of forward-looking terminology such as “may,” “will,” “expect,” “intend,” “estimate,” “anticipate,” “believe,” “could,” “potential,” “continue” or similar terminology. These statements are based on the beliefs and assumptions of the management of the Company based on information currently available to management.
These forward-looking statements are not guarantees of future performance, conditions, or results, and involve a number of known and unknown risks, uncertainties, assumptions, and other important factors, many of which are outside our management’s control, which could cause actual results to differ materially from the results discussed in the forward-looking statements. In addition, forward-looking statements are subject to certain risks and uncertainties that could cause actual results to differ materially from the Company’s historical experience and our present expectations or projections. For a discussion of some of the risks and uncertainties that could cause actual results to differ from such forward-looking statements, see the risks and other factors detailed from time to time in our Annual Report on Form 10-K, Quarterly Reports on Form 10-Q, and other filings with the SEC.
We undertake no obligation to update any forward-looking statements, whether as a result of new information, future events or otherwise, except as required by law.