
Tuesday, February 14, 2022
Michael Kupinski, Director of Research, Noble Capital Markets, Inc.
Patrick McCann, Research Associate, Noble Capital Markets, Inc.
Jacob Mutchler, Research Associate, Noble Capital Markets, Inc.
Refer to the bottom of the report for important disclosures
Overview: Entertainment and Leisure stocks have had a good start to the New Year, but the better performance has not erased the disaster that was 2022. We believe that stocks appear to be baking in a mild economic downturn, a soft landing, so to speak. Given that we are skeptic of the conventional thought, we take a cautious stance regarding the recent lift in valuations and encourage investors to take an accumulation approach.
Entertainment:Bowlero on a roll. The Noble Entertainment Index performed well, up 1.5% in the last 12 months, compared with negative returns for the S&P 500 (-7.1%). Although there were broad economic challenges over the past year, entertainment companies benefited from the general public’s return to “normal” following the COVID pandemic. We believe that in-person experiential entertainment recovery is still in its early stage and should continue into 2024.
Gaming: Looking for value in the rubble. The Noble Gaming Index is down 53.1% in the past year, well below the S&P 500, down 7.1%. But, recently, the Noble Gaming Index increased 12.9% in the last quarter, outperforming the 3.2% increase in the general market, as measured by the S&P 500 Index. A reflex bounce? Short squeeze? Or, were the shares oversold? We encourage investors to play it safe.
Esports: Motorsport Games revs its engine. The company was full steam ahead in investing in its new product launches in 2023, but it was running out of cash. Fortunately, a couple of favorable moves to add liquidity set the stock soaring, up 1,600% in one day, creating further opportunities to raise cash. Now, flush with cash, investors look toward the product rollouts.
Leisure: Travel to new heights. The U.S. Travel Association updated its 2023 outlook, projecting a resilient domestic leisure travel market. Consumers appear eager to splurge on travel, in spite of the economic headwinds. We focus on one of our favorite internet media plays, Travelzoo. The company recently updated Fourth Quarter 2022 guidance with revenues expected to be roughly $18.5 million, a strong 31% increase year over year.
Overview
Have economic prospects improved?
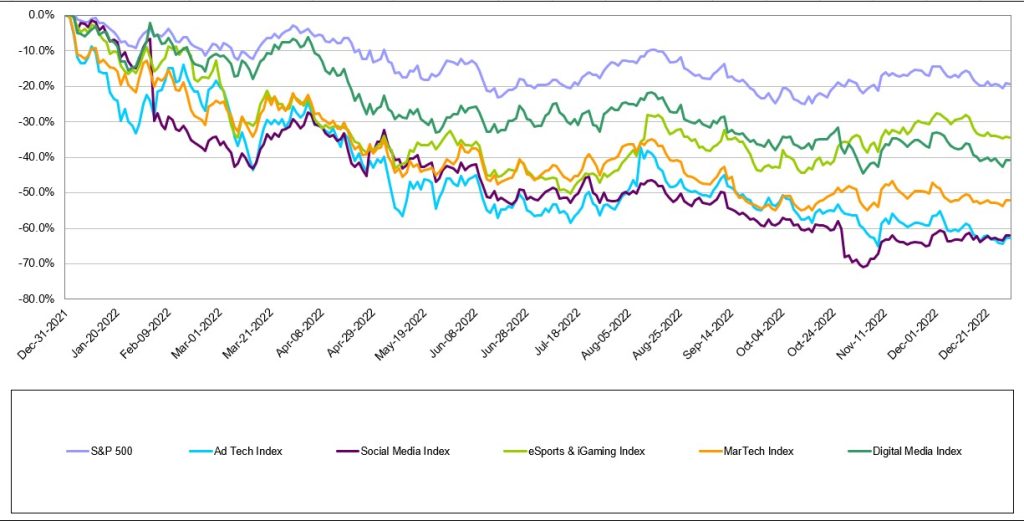
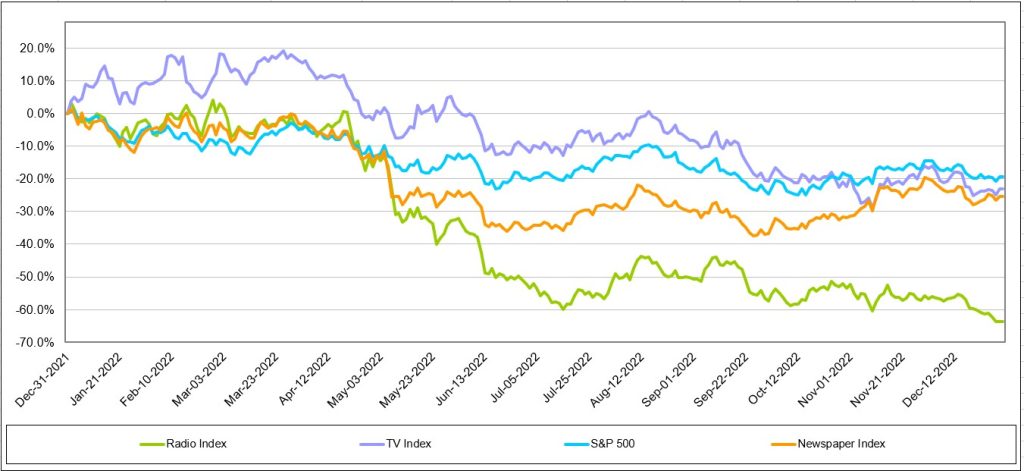
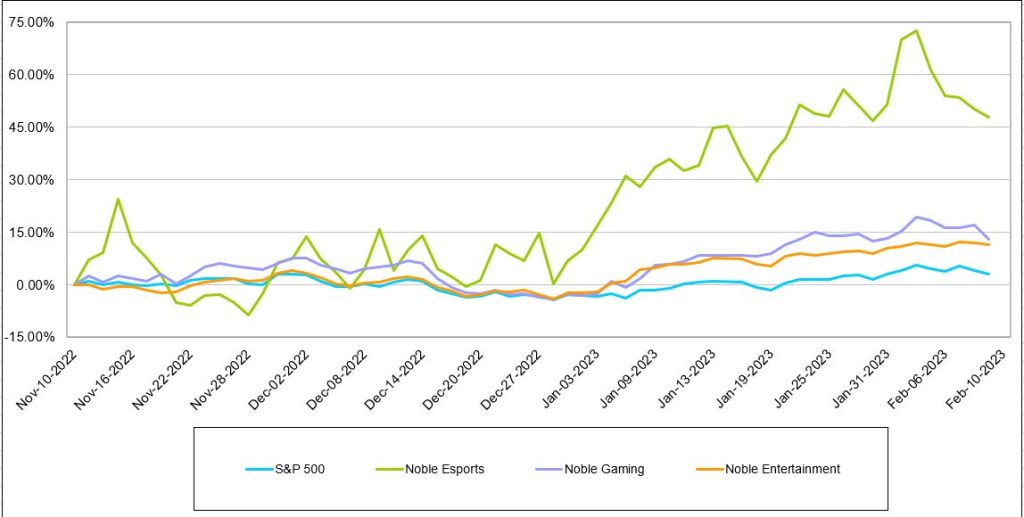
The Entertainment & Leisure industries performed better since the beginning of the year, providing some relief to the downturn that investors suffered in 2022. As Figure #1 Entertainment 12 Month Trailing Stock Performance highlights, the Entertainment and Leisure Indices are still recovering and many have yet to offset the 2022 declines, except for the Entertainment stocks. The Entertainment stocks not only have performed well in the first quarter, but have beat the general market as measured by the S&P 500 Index over the past year. The Noble Entertainment Index is up a modest 1.5% in the past year, better than the general market’s 7.1% decline. It is important to note that the Noble Indices are market cap weighted. As such, not all stocks reflected the favorable relative performance.
What is driving the improved stock performance in the latest quarter? We believe that investors have become more positive about the economic outlook, with conventional wisdom now anticipating a soft economic landing or a mild economic recession. This is a shift toward an optimistic tone from one that anticipated a severe economic recession. The Federal Reserve caused the dire outlook. The Fed signaled that it will continue to raise interest rates until inflation is arrested, in spite of the adverse impact on the economy and jobs. But, since then, conventional wisdom on the economy has brightened as inflation seems to have subsided. The more favorable economic outlook is exemplified by a Wall Street firm that decreased the risk of an economic recession in 2023 by a sizable 25%.
We tend to be skeptics and conservative. As such, we tend not to buy into strength. Our view is that the stocks were oversold and reflected recessionary type valuations. But, have the economic prospects really improved that much? We encourage investors to take an accumulation approach, focusing on some of our favorite stocks highlighted in this report, including Bowlero, Codere Online Luxembourg, Engine Gaming and Media, and Travelzoo.
Figure #1 Entertainment 12 Month Trailing Stock Performance
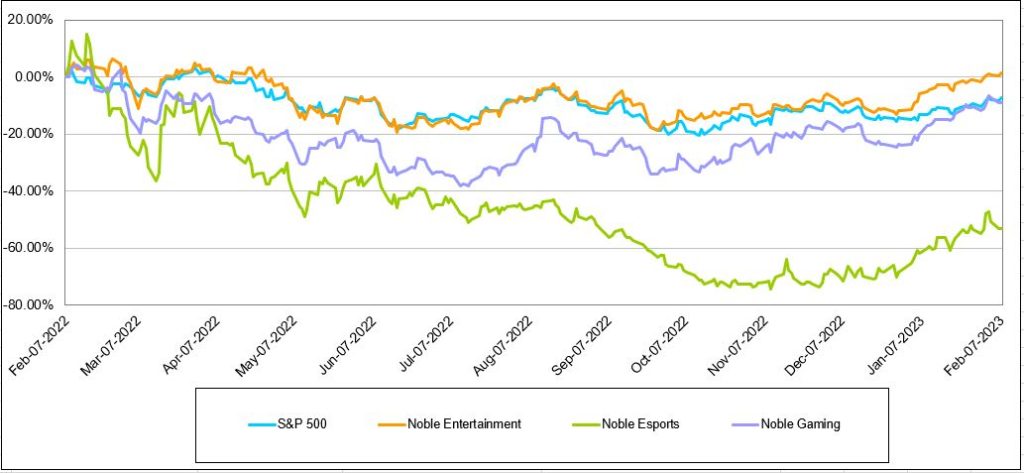
Source: Capital IQ
Entertainment
Bowlero on a roll
The Noble Entertainment Index performed well, up 1.5% in the last 12 months, compared with negative returns for the S&P 500 down 7.1%. Although there were broad economic challenges over the past year, entertainment companies benefited from the general public’s return to “normal” following the COVID pandemic. We believe that the trend toward social gathering and in-person activities are helping to offset broader macroeconomic headwinds. While some industries received a boost during late 2020 and 2021 when consumers were spending stimulus checks on online shopping, the recovery for in-person entertainment has been more recent. In our view, the recovery in experiential, in-person entertainment appears to be gaining traction and the recovery could continue into 2024.
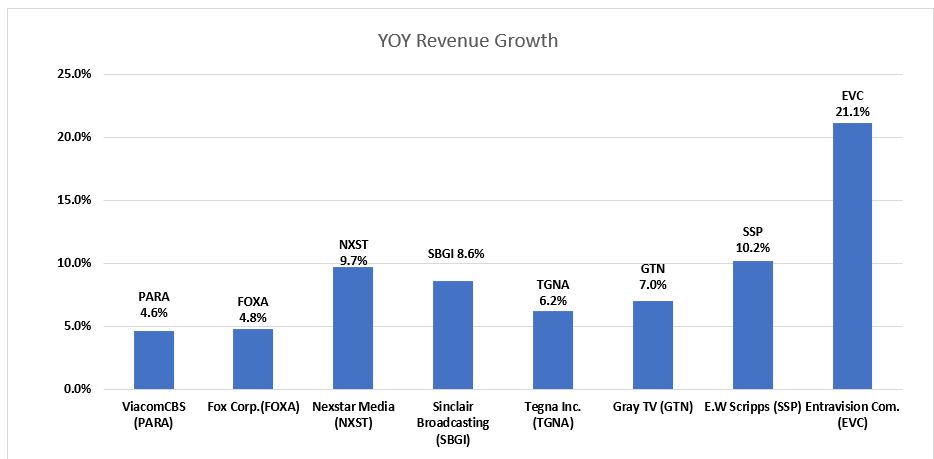
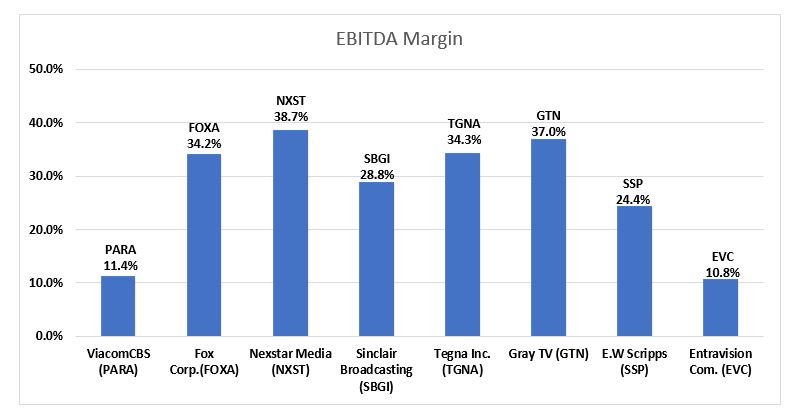
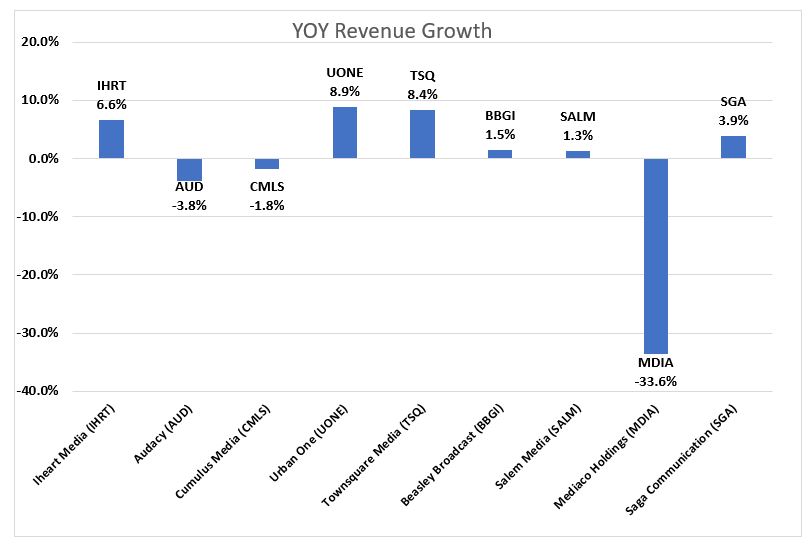
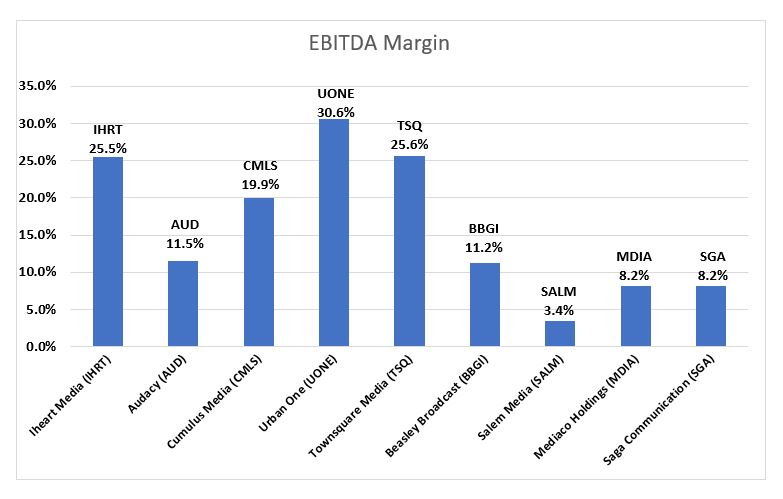
As Figure #2 Entertainment Revenue Growth illustrates, virtually all of the experiential entertainment companies reported strong revenue growth in the latest reported quarter, (the calendar third quarter end September 2022). One of the examples of the in-person recovery is in bowling centers, in general, and Bowlero, specifically. The company recently announced that it eclipsed $1 billion in Trailing Twelve Month (TTM) revenue as of December 31, 2022, which included 48% same store sales growth over the prior year. Additionally, Bowlero added 40 bowling centers over the past 18 months as it continues to successfully execute on its roll-up strategy. As revenues have improved, so too have margins. As Figure #3 Entertainment EBITDA Marginsillustrates, Bowlero delivered industry leading margins in the latest reported quarter at 24.8%.
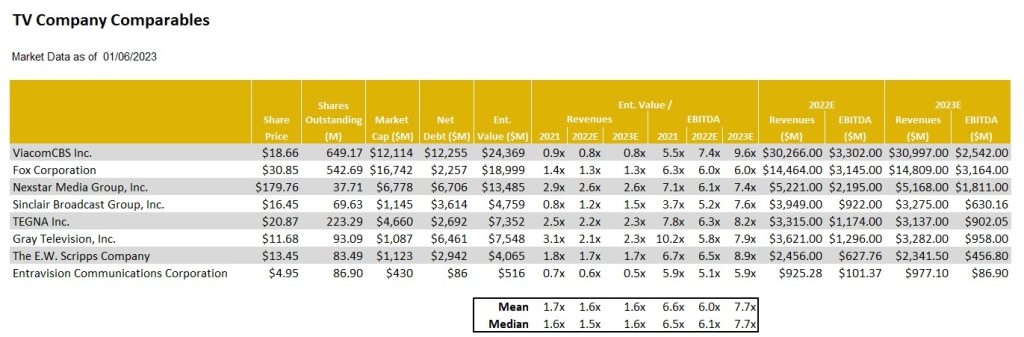
Bowlero is on a roll. With the BOWL shares up roughly 50% in the past 12 months, the shares have outperformed both the Noble Entertainment Index up 1.5%, as well as the broader market, as measured by the S&P 500, which decreased -7.1%. In spite of the favorable fundamental tailwind, the shares trade in line with its experiential entertainment peers. Figure #4 Entertainment Comparables illustrates that the BOWL shares trade at 9.7 times Enterprise Value to our estimated 2023 adj. EBITDA, below the peer average of 10.7 times, despite the company’s industry leading fundamentals. Given its favorable fundamental outlook, prospects for enhanced revenue and cash flow growth through acquisitions and favorable internal growth, and compelling stock valuation, the BOWL shares lead our list for favorites in the Entertainment industry.
Figure #2 Entertainment Revenue Growth

Source: Company 10Qs
Figure #3 Entertainment EBITDA Margins
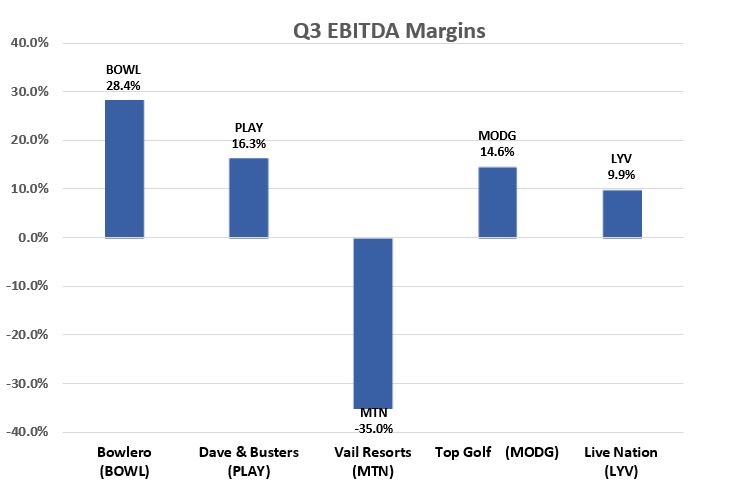
Source: Company 10Qs
Figure #4 Entertainment Comparables

Source: Company filings and Noble estimates
Gaming
Looking for value in the rubble
The Noble Gaming Index is down 53.1% in the past year, well below the S&P 500, down 7.1%. In our view, the poor performance of Gaming stocks was the result of investors trying to take risk off the table. Many Gaming companies are still in developmental stages, with high marketing and customer acquisition costs. As such, many in the industry are unprofitable and rely on the balance sheets to fund operations. Before Covid, these companies benefited from the easy money policies and favorable capital markets, which many relied on for funding. But, with the recent sharp rise in interest rates and difficult general market conditions to raise capital, the music has stopped. Gaming stock valuations are now more scrutinized, in an environment of increasing cost of capital. As such, we believe industry players that are already profitable, and those with little to no debt and ample cash on the balance sheet are best positioned for to lead the industry.
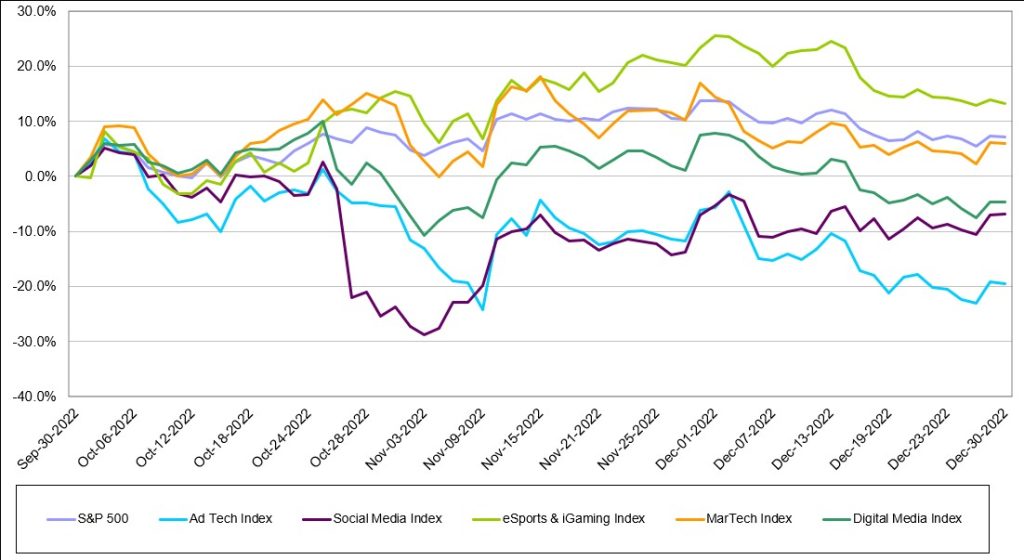
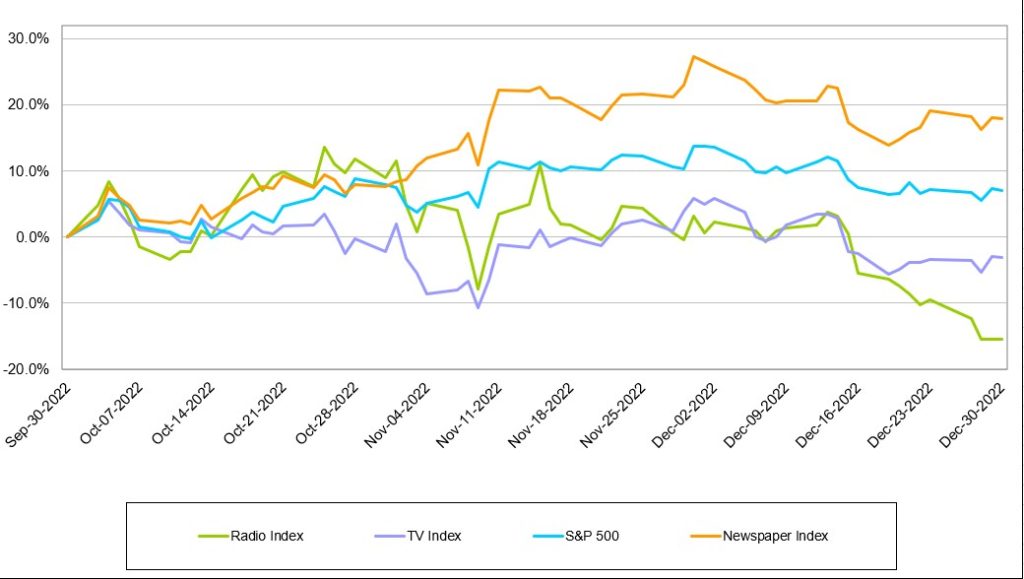
Our focus is on the shares of Codere Online Luxembourg, CDRO. The CDRO shares are down 42.4% in the last year, underperforming the S&P 500’s -7.1% return. However, despite a tough 12-month period, the CDRO shares outperformed the Noble Gaming Index, which dropped 53.1%. We believe that the relative outperformance of the CDRO shares over the past year reflects its better financial position than most of its peers. Most recently, the Noble Gaming Index improved, as illustrated in Figure #5 Three Month Stock Performance. The Noble Gaming Index increased 12.9%, outperforming the 3.2% increase in the general market, as measured by the S&P 500 Index. A reflex bounce? Short squeeze? Or, were the shares oversold? It appears to be all the above for many of the stocks in the index. The largest gains were from companies that appeared to be struggling and had favorable news. We believe that investing in struggling companies with limited access to capital is a dangerous place to be.
In terms of Codere Online Luxembourg, the fundamentals of the company appear favorable. Codere Online’s cash burn has been within expectations and the company had a strong cash balance of €72 million and virtually no long-term debt as of September 30, 2022. As such, the company appears positioned to continue executing its growth strategy in Latin America, which for the time being consists of broadening its presence in key markets such as Mexico and Columbia, and aggressively expanding in Argentina.
The company’s growth could be bolstered if Brazil begins regulating sports betting in 2023. Importantly, Entain CEO Jette Nygaard-Anderson, recently stated that she expects Brazil to complete process of regulating sports betting in 2023, citing new administration of President Lula. In summary, Codere Online is distinguished from many of its peers, with an established foothold in key Latin American markets, flush with cash to penetrate existing markets and enter new ones. It has the ability to become the industry leader in many of its markets.
Near current levels, the iGaming industry peer group is trading at 5.0 times Enterprise Value to 2023 revenues, illustrated in Figure #6 Gaming Comparables. Codere Online Luxemburg (CDRO) is one of our favorite plays in the iGaming industry due to several factors. As mentioned above, the company has virtually no long-term debt and €72 million in cash, as of September 30, 2022. We believe that the company has a favorable runway to reach cash flow breakeven while continuing to fund its expansion in the meantime. Furthermore, in our view, given its ability to invest in its developing markets, the company appears to have the ability to become the preeminent online gambling leader in many Latin American markets. Finally, the CDRO shares appear compelling, trading near 2.6 times expected 2023 revenue, well below peers. As a result, we view the CDRO shares as among our favorite online gambling plays, with the shares rated Outperform with $9 price target.
Figure #5 Three Month Stock Performance
Source: Capital IQ
Figure #6 Gaming Comparables
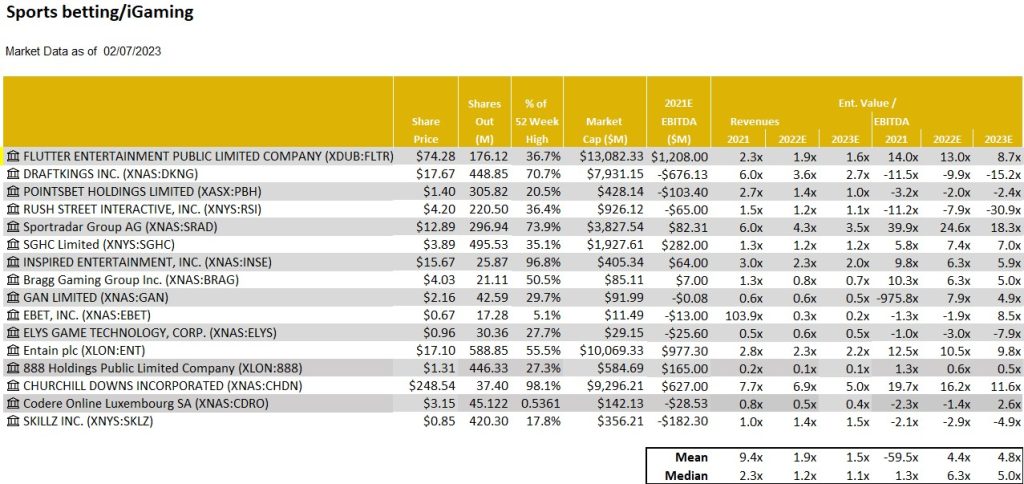
Source: Company filings and Noble estimates
Esports
Motorsport revs its engine
The Noble Esports Index was down 53% over the past year, underperforming the broader market, which was down 7%, as as measured by the S&P 500 Index. Not unlike many other emerging industries, Esports has been battered by macroeconomic headwinds over the past year. Investors are placing more importance on companies that are generating positive cash flow, rather than speculating on future profitability, given recessionary concerns and elevated interest rates. While the Esports industry has shown favorable trends in the number of viewers and hours watched, many companies are still burning cash and may need to raise additional capital. Total hours watched of esports content was up 40% in Q3 of 2022, illustrated in Figure #7 Esports Viewership.
The best performing stock in the Esports index was HUYA, which only declined by 9.7% on a TTM basis. Huya is the largest Esports live streaming platform in China and recently expanded into a variety of real-time events. Huya benefits from the favorable growth trends of the Esports and live streaming industries, as it does not rely on the popularity of a single game or tournament. The worst performing stock in the Esports index is Esports Entertainment Group (GMBL), which declined 97.2% on a TTM basis. The company burned through its cash and had limited access to additional capital.
In the latest quarter, however, the Noble Esports Index rebounded, up a strong 47.9%, as depicted in the earlier in Figure #5 Three Month Stock Performance. The strength in the quarter was due to a relatively few number of stocks, including HUYA (up 135.8%) and two of our favorite plays, Motorsport Games (MSGM) and Engine Gaming and Media (GAME), which increased 68.9% and 149.8%, respectively. In fact, Motorsport Games increased a stunning 1,618.8% with a trading day following news of a debt for equity swap.
Motorsport Games revs its engine
Motorsport Games is a publisher of motorsport video games, with the rights to iconic racing franchises such as NASCAR and 24 Hour of LeMans. The company recently completed a debt for equity swap which led to a surprisingly strong increase in the stock valuation. This allowed the company to complete several direct offerings, eliminating all company debt and raising over $11 million in cash. The capital raise alleviated liquidity concerns, allowing the company to continue developing games. In our view, the launch of several games in 2023 should allow the company to swing toward cash flow break even. We have moved our rating to Market Perform given that the shares blew through our $9 price target. Our rating is under review as the company updates investors on its product rollout roadmap and the level of cash burn until it launches its upcoming products.
Engine Gaming & Media
Another one of our favorites is Engine Gaming & Media (GAME). Engine Gaming & Media is a multi-platform media company engaged in most aspects of the Esports industry. The company’s media division coordinates video access and advertising, data analytics, and connects advertisers to social influencers in the gaming industry. Figure #7 Esports Viewership and Figure #8 Esports Live Streaming are from Stream Hatchet, the company’s live streaming data and Esports analytics business.
The company reported its fiscal first quarter results on January 17, 2023, which beat our expectations. Notably, the company’s influencer and gaming analytics software as a service revenue, a key growth vehicle, grew revenue by a strong 34.6% on a year over year basis. In addition, the company plans to merge with GameSquare Esports, which it expects will provide scale and provide cost synergies. Management indicated that the combination should accelerate the new company’s path toward profitability. We plan to update our models as more details emerge regarding the upcoming merger.
Figure #9 Esports Comparables highlight the stock valuations in the Esports industry. The valuations of many of the stocks, including Motorsport Games and Engine Gaming and Media are in flux. As mentioned, Motorsport Games significantly improved its financial position with recent equity raises and debt for equity swaps. Engine Gaming and Media’s fundamentals likely will change with a planned merger. In our view, the latest quarter has been a watershed moment for these companies. We look forward toward reevaluating our models, ratings and price targets upon more details on the developments from the respective companies.
Figure #7 Esports Viewership
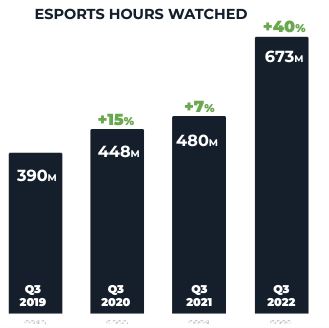
Source: Stream Hatchet
Figure #8 Esports Live Streaming
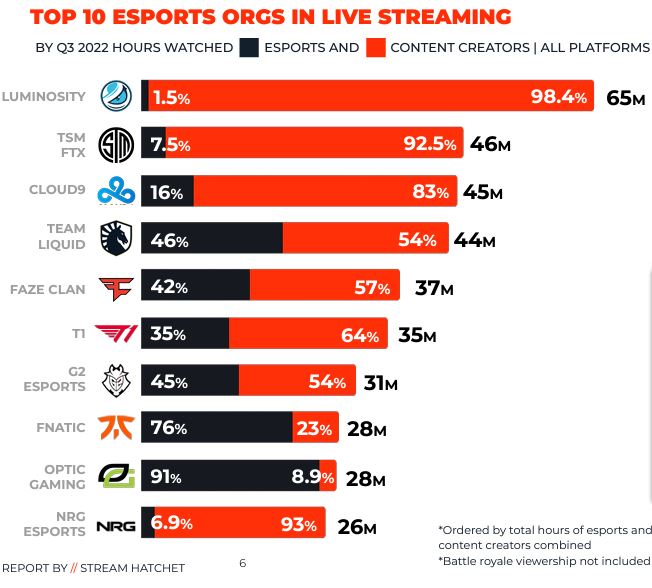
Source: Stream Hatchet
Figure #9 Esports Comparables
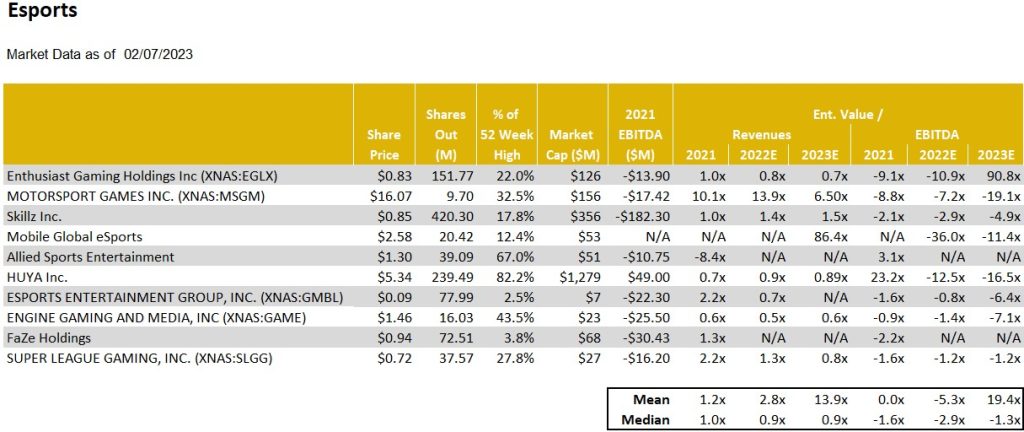
Source: Company filings and Noble estimates
Leisure
Travel to new heights
Once again, we focus on the travel industry in our Leisure section due to some favorable developments and outlook. Notably, the U.S. Travel Foundation forecasts an increase in travel spending in 2023 above both 2022 and 2019 levels. This would indicate that the travel industry has fully recovered from the depressed Covid impacted levels. Airline flights are full and there is high demand for hotels, even though pricing for those rooms are significantly higher. What is driving the demand and will it continue?
For the U.S., there are three factors influencing the relatively favorable outlook for the U.S. travel industry. The domestic leisure travel has been resilient in spite of higher gas prices, hotel rooms and airline tickets. A recent article from Forbes suggests that U.S. leisure travel is rebounding despite inflation as it is one area where people are willing to splurge. A second contributing factor to the favorable outlook is Business travel. Business travel is expected to be somewhat weaker in 2023 given the prospect of a mild economic recession in 2023. But, the business travel outlook is improved as a severe economic downturn appears less likely. The weak area has been international inbound travel to the U.S. We believe that this is a function of the strong U.S. dollar relative to other major currencies. On the flip side, international travel from the U.S. appears to be favorable given the U.S. dollar strength.
We believe that the inflationary trends, higher airline fares and hotel rates, as well as sluggish international travel, all have prompted travelers to seek travel deals. Consequently, one of our favorite plays on the travel industry, Travelzoo, has seen fundamental improvement. As an internet media company, its business is derived from its advertisers and travel partners to offer travel deals to its customers. This is different from travel suppliers and online travel agencies that rely on travel demand. Notably, Travelzoo recently updated its fourth quarter revenue guidance to be roughly $18.5 million, an increase of a strong 31% year over year, in line with our forecast.
Travelzoo is one of our favorite plays for the recovering travel industry. The shares are down roughly 46% in the past year, which we believe could present an attractive entry point for investors. Since reaching lows in December near $4.11 per share, the TZOO shares have rallied, up roughly 25% since that time. In our view, the shares may have reacted to a recent merger involving its founder, Ralph Bartel. The merger brought with it an influx of cash, but increased Mr. Bartels ownership of the company from slightly over 50% to over 60%. We view the move favorably as it provides increase liquidity for the company. Given the prospect for a favorable environment for travel deals, we view Travelzoo as among our favored ways to play the travel industry and the subsequent improved advertising from its travel partners. We rate the shares Outperform with a $9 price target.
Research reports on companies mentioned in this report are available by clicking below:
Codere Online Luxembourg (CDRO)
Engine Gaming and Media (GAME)
GENERAL DISCLAIMERS
All statements or opinions contained herein that include the words “we”, “us”, or “our” are solely the responsibility of Noble Capital Markets, Inc.(“Noble”) and do not necessarily reflect statements or opinions expressed by any person or party affiliated with the company mentioned in this report. Any opinions expressed herein are subject to change without notice. All information provided herein is based on public and non-public information believed to be accurate and reliable, but is not necessarily complete and cannot be guaranteed. No judgment is hereby expressed or should be implied as to the suitability of any security described herein for any specific investor or any specific investment portfolio. The decision to undertake any investment regarding the security mentioned herein should be made by each reader of this publication based on its own appraisal of the implications and risks of such decision.
This publication is intended for information purposes only and shall not constitute an offer to buy/sell or the solicitation of an offer to buy/sell any security mentioned in this report, nor shall there be any sale of the security herein in any state or domicile in which said offer, solicitation or sale would be unlawful prior to registration or qualification under the securities laws of any such state or domicile. This publication and all information, comments, statements or opinions contained or expressed herein are applicable only as of the date of this publication and subject to change without prior notice. Past performance is not indicative of future results. Noble accepts no liability for loss arising from the use of the material in this report, except that this exclusion of liability does not apply to the extent that such liability arises under specific statutes or regulations applicable to Noble. This report is not to be relied upon as a substitute for the exercising of independent judgement. Noble may have published, and may in the future publish, other research reports that are inconsistent with, and reach different conclusions from, the information provided in this report. Noble is under no obligation to bring to the attention of any recipient of this report, any past or future reports. Investors should only consider this report as single factor in making an investment decision.
IMPORTANT DISCLOSURES
This publication is confidential for the information of the addressee only and may not be reproduced in whole or in part, copies circulated, or discussed to another party, without the written consent of Noble Capital Markets, Inc. (“Noble”). Noble seeks to update its research as appropriate, but may be unable to do so based upon various regulatory constraints. Research reports are not published at regular intervals; publication times and dates are based upon the analyst’s judgement. Noble professionals including traders, salespeople and investment bankers may provide written or oral market commentary, or discuss trading strategies to Noble clients and the Noble proprietary trading desk that reflect opinions that are contrary to the opinions expressed in this research report.
The majority of companies that Noble follows are emerging growth companies. Securities in these companies involve a higher degree of risk and more volatility than the securities of more established companies. The securities discussed in Noble research reports may not be suitable for some investors and as such, investors must take extra care and make their own determination of the appropriateness of an investment based upon risk tolerance, investment objectives and financial status.
Company Specific Disclosures
The following disclosures relate to relationships between Noble and the company (the “Company”) covered by the Noble Research Division and referred to in this research report.
Noble is not a market maker in any of the companies mentioned in this report. Noble intends to seek compensation for investment banking services and non-investment banking services (securities and non-securities related) with any or all of the companies mentioned in this report within the next 3 months
ANALYST CREDENTIALS, PROFESSIONAL DESIGNATIONS, AND EXPERIENCE
Senior Equity Analyst focusing on Basic Materials & Mining. 20 years of experience in equity research. BA in Business Administration from Westminster College. MBA with a Finance concentration from the University of Missouri. MA in International Affairs from Washington University in St. Louis.
Named WSJ ‘Best on the Street’ Analyst and Forbes/StarMine’s “Best Brokerage Analyst.”
FINRA licenses 7, 24, 63, 87
WARNING
This report is intended to provide general securities advice, and does not purport to make any recommendation that any securities transaction is appropriate for any recipient particular investment objectives, financial situation or particular needs. Prior to making any investment decision, recipients should assess, or seek advice from their advisors, on whether any relevant part of this report is appropriate to their individual circumstances. If a recipient was referred to Noble Capital Markets, Inc. by an investment advisor, that advisor may receive a benefit in respect of
transactions effected on the recipients behalf, details of which will be available on request in regard to a transaction that involves a personalized securities recommendation. Additional risks associated with the security mentioned in this report that might impede achievement of the target can be found in its initial report issued by Noble Capital Markets, Inc.. This report may not be reproduced, distributed or published for any purpose unless authorized by Noble Capital Markets, Inc..
RESEARCH ANALYST CERTIFICATION
Independence Of View
All views expressed in this report accurately reflect my personal views about the subject securities or issuers.
Receipt of Compensation
No part of my compensation was, is, or will be directly or indirectly related to any specific recommendations or views expressed in the public
appearance and/or research report.
Ownership and Material Conflicts of Interest
Neither I nor anybody in my household has a financial interest in the securities of the subject company or any other company mentioned in this report.