MIAMI, Jan. 31, 2023 (GLOBE NEWSWIRE) — Motorsport Games Inc. (NASDAQ: MSGM) (“Motorsport Games” or “Company”), a leading racing game developer, publisher and esports ecosystem provider of official motorsport racing series throughout the world, announced today that it has received notice from the Nasdaq Stock Market LLC (Nasdaq) on January 30, 2023 informing Motorsport Games that it has regained full compliance with the Nasdaq Listing Rules.
Motorsport Games previously notified Nasdaq on November 11, 2022 that it was no longer in compliance with Nasdaq Listing Rule 5550(a)(4) requiring minimum of 500,000 publicly held shares, as defined in the Nasdaq Listing Rules, and (ii) Nasdaq Listing Rule 5605(b)(1), which requires a majority of the Company’s board of directors (the “Board”) to be comprised of independent directors as defined in Rule 5605(a)(2), and Nasdaq Listing Rule 5605(c)(2), which requires the audit committee of the Board to consist of at least 3 independent directors meeting the heightened independence standards for audit committee members.
As previously disclosed by the Company, as a result of the issuances by the Company to Alumni Capital LP of the Company’s Class A common stock pursuant to the previously reported purchase agreement with Alumni Capital LP, the Company’s publicly held shares exceeded 500,000 shares. Dmitry Kozko, Chief Executive Officer of Motorsport Games, commented, “With the addition of Nav Sunner in January and Andrew Jacobson in December, joining John Delta as independent directors, the board of directors is reconstituted adding significant talent and resources to our collective experience.”
Bios:
Nav Sunner is a highly experienced lawyer and business development expert immersed in the video games industry. After qualifying as a lawyer with Pinsent Masons, he spent several years as Head of Legal at Codemasters as well as General Counsel at Mastertronic Group. Following a further period practicing law as Co-Head of Interactive Entertainment for Osborne Clarke and, subsequently, as Head of Computer Games for Wiggin, Nav worked with Japanese games company GREE. Nav then spent time as Commercial Director for a games studio at Microsoft as well as being on the Board of esports company EGL. Currently, in addition to his video game consultancy “Navatron,” he is a Director at MMO games company Vavel. Nav’s long career in the video games industry has included extensively being involved with legal and business issues relating to racing games.
Andrew Jacobson is a digital media sales and marketing executive with over two decades of leadership experience in the online publishing, ad tech and automotive industries. During his career he has guided teams and companies – both large and startups – to record sales and revenue growth. In his current position, he leads Epsilon’s automotive programmatic digital media client team, and acts as a consultant to publishers and startups on strategy, product development, CRM, programmatic monetization, organization structure and compensation planning. In 2015, as Global Head of Sales, Andrew was part of the leadership team that grew and sold digital media company VerticalScope Holdings for more than $300 million. He has been a top-rated speaker, moderator and panelist at many industry conferences including J.D. Power Automotive Marketing Roundtable, SEMA, Programmatic I/O, Digital Dealer, Automotive Attribution Summit and others. Andrew holds a B.A. from Pomona College and an M.B.A. from the Kellogg School of Management, Northwestern University.
John Delta is an experienced operating and financial executive and entrepreneur with experience in enterprises from $2 million to $500 million. He is currently a Partner at TechCXO, which provides outsourced on demand C-Suite executives to institutionally-backed companies. He was formerly a consultant at McKinsey & Co. and Deloitte & Touche and was Vice President of Interactive Services at the NASDAQ Stock Market. He has extensive experience with both portfolio companies of Private Equity firms and US and international publicly traded companies. His main areas of focus are mid-stage software, SaaS and consumer-facing firms in need of assistance with CFO duties, transaction execution and scaling their finance/operations. John has broad consulting, operations and finance experience, and holds both a BA and MBA from the University of Virginia.
About Motorsport Games: Motorsport Games, a Motorsport Network company, is a leading racing game developer, publisher and esports ecosystem provider of official motorsport racing series throughout the world. Combining innovative and engaging video games with exciting esports competitions and content for racing fans and gamers, Motorsport Games strives to make the joy of racing accessible to everyone. The Company is the officially licensed video game developer and publisher for iconic motorsport racing series across PC, PlayStation, Xbox, Nintendo Switch and mobile, including NASCAR, INDYCAR, 24 Hours of Le Mans and the British Touring Car Championship (“BTCC”), as well as the industry leading rFactor 2 and KartKraft simulations. rFactor 2 also serves as the official sim racing platform of Formula E, while also powering F1 Arcade through a partnership with Kindred Concepts. Motorsport Games is an award-winning esports partner of choice for 24 Hours of Le Mans, Formula E, BTCC, the FIA World Rallycross Championship and the eNASCAR Heat Pro League, among others. Motorsport Games is building a virtual racing ecosystem where each product drives excitement, every esports event is an adventure and every story inspires.
Forward-Looking Statements: Certain statements in this press release which are not historical facts are forward-looking statements within the meaning of Section 27A of the Securities Act of 1933, as amended, and Section 21E of the Securities Exchange Act of 1934, as amended, and are provided pursuant to the safe harbor provisions of the Private Securities Litigation Reform Act of 1995. Any statements in this press release that are not statements of historical fact may be deemed forward-looking statements. Words such as “continue,” “will,” “may,” “could,” “should,” “expect,” “expected,” “plans,” “intend,” “anticipate,” “believe,” “estimate,” “predict,” “potential,” and similar expressions are intended to identify such forward-looking statements. All forward-looking statements involve significant risks and uncertainties that could cause actual results to differ materially from those expressed or implied in the forward-looking statements, many of which are generally outside the control of Motorsport Games and are difficult to predict. Examples of such risks and uncertainties include, without limitation, whether provided the Company will be able to maintain its compliance with the Nasdaq Listing Rules. Additional factors that could cause actual results to differ materially from those expressed or implied in the forward-looking statements can be found in Motorsport Games’ filings with the SEC, including its Annual Report on Form 10-K for the fiscal year ended December 31, 2021, its Quarterly Reports on Form 10-Q filed with the SEC during 2022, as well as in its subsequent filings with the SEC. Motorsport Games anticipates that subsequent events and developments may cause its plans, intentions and expectations to change. Motorsport Games assumes no obligation, and it specifically disclaims any intention or obligation, to update any forward-looking statements, whether as a result of new information, future events or otherwise, except as expressly required by law. Forward-looking statements speak only as of the date they are made and should not be relied upon as representing Motorsport Games’ plans and expectations as of any subsequent date.
Website and Social Media Disclosure:
Investors and others should note that we announce material financial information to our investors using our investor relations website (ir.motorsportgames.com), SEC filings, press releases, public conference calls and webcasts. We use these channels, as well as social media and blogs, to communicate with our investors and the public about our company and our products. It is possible that the information we post on our websites, social media and blogs could be deemed to be material information. Therefore, we encourage investors, the media and others interested in our company to review the information we post on the websites, social media channels and blogs, including the following (which list we will update from time to time on our investor relations website):
CHELMSFORD, MA / ACCESSWIRE / January 31, 2023 / Harte Hanks, Inc. (HHS), a leading global customer experience company, today announced it is working with leading kitchen, bath, and outdoor retailer PIRCH on a series of lead generation and integrated direct marketing initiatives in Southern California.
Harte Hanks will provide PIRCH with a series of targeted communications to reach and engage shoppers at key moments in the home remodeling journey.
Harte Hanks first identified potential PIRCH customers using strategic demographics surrounding the company’s target luxury audience. Armed with this data, direct mail formats will be tested to determine a continuous marketing cadence.
“Nobody knows direct marketing like Harte Hanks,” noted Gene Hodges, VP Marketing, PIRCH. I have worked with them for many years including my time at The Home Depot and Bed, Bath & Beyond. Their expertise in strategy, customer profiling, creative, fulfillment and analytics is unrivaled. Partnering with them means we can launch our campaigns in record time with a team that will guide us through the entire process.”
Janel Harris, Managing Director, Harte Hanks Marketing Services added “PIRCH sets the standard for exceptional customer experience. We’re honored to provide them with turnkey services to help them identify, reach, and secure new customers as they turn dream-home projects into reality.”
About PIRCH:
Founded in 2009, PIRCH is a privately held fixture and appliance retailer for kitchen, bath and outdoor products based in San Diego, CA. The company operates seven Southern California showrooms and provides kitchen, bath, and outdoor design and installation from the world’s most coveted brands.PIRCH stores are experiential showrooms that allow consumers to explore appliances, plumbing fixtures, and hardware in lifestyle displays and envision how they would look and feel in their homes. Learn more at pirch.com.
About Harte Hanks:
Harte Hanks (Nasdaq:HHS) is a leading global customer experience company that partners with clients to provide them with CX strategy, data-driven analytics and actionable insights combined with seamless program execution to better understand, attract and engage their customers.
Using its resources and talent in the areas of Customer Care, Fulfillment, Logistics, and Marketing Services, Harte Hanks has driven results for some of the world’s premier brands, including Bank of America, GlaxoSmithKline, Unilever, Pfizer, HBOMax, Volvo, Ford, FedEx, Midea, Sony and IBM. Headquartered in Chelmsford, Massachusetts, Harte Hanks has over 2,500 employees in offices across the Americas, Europe, and Asia Pacific. For more information, visit hartehanks.com.
MALVERN, Pa., Jan. 31, 2023 (GLOBE NEWSWIRE) — Ocugen, Inc. (Ocugen or the Company) (NASDAQ: OCGN), a biotechnology company focused on discovering, developing, and commercializing novel gene and cell therapies and vaccines, today announced that Dr. Shankar Musunuri, Chairman, Chief Executive Officer and Co-Founder of Ocugen will present at the BIO CEO & Investor Conference being held February 6-9, 2023, at the Marriott Marquis in New York City.
Dr. Musunuri and members of Ocugen’s executive team will conduct one-on-one meetings with registered investors and pharmaceutical companies, showcasing the Company’s business and clinical development strategy, recent corporate achievements, and anticipated milestones.
Details of the presentation are as follows:
Event: BIO CEO & Investor Conference Date: Monday, February 6, 2023 Presentation Time: 11:00 a.m. ET Location: Winter Garden Room, 6th Floor, Marriott Marquis, New York City Registration: https://www.bio.org/events/bio-ceo-investor-conference
Conference attendees that would like to schedule a meeting with the Ocugen leadership team are encouraged to register through the BIO CEO attendee portal.
About Ocugen, Inc.
Ocugen, Inc. is a biotechnology company focused on discovering, developing, and commercializing novel gene and cell therapies and vaccines that improve health and offer hope for patients across the globe. We are making an impact on patients’ lives through courageous innovation—forging new scientific paths that harness our unique intellectual and human capital. Our breakthrough modifier gene therapy platform has the potential to treat multiple retinal diseases with a single product, and we are advancing research in infectious diseases to support public health and orthopedic diseases to address unmet medical needs. Discover more at www.ocugen.com and follow us on Twitter and LinkedIn.
Forward-Looking Statements
This press release contains forward-looking statements within the meaning of The Private Securities Litigation Reform Act of 1995, which are subject to risks and uncertainties. We may, in some cases, use terms such as “predicts,” “believes,” “potential,” “proposed,” “continue,” estimates,” “anticipates,” “expects,” “plans,” “intends,” “may,” “could,” “might,” “will,” “should,” or other words that convey uncertainty of future events or outcomes to identify these forward-looking statements. Such statements are subject to numerous important factors, risks, and uncertainties that may cause actual events or results to differ materially from our current expectations. These and other risks and uncertainties are more fully described in our periodic filings with the Securities and Exchange Commission (SEC), including the risk factors described in the section entitled “Risk Factors” in the quarterly and annual reports that we file with the SEC. Any forward-looking statements that we make in this press release speak only as of the date of this press release. Except as required by law, we assume no obligation to update forward-looking statements contained in this press release whether as a result of new information, future events, or otherwise, after the date of this press release.
Preliminary Results from Human PET Study Show that Intranasal Application of a Radioisotope of Magnesium-Potentiated Oxytocin is Delivered to the Trigeminal Ganglia
Preliminary Results on Human Cadaveric Trigeminal Ganglia Show Co-expression of Oxytocin Receptors and CGRP
Preliminary Results Show Sex Differences in Oxytocin Potency in an Animal Model
CHATHAM, N.J., Jan. 31, 2023 (GLOBE NEWSWIRE) — Tonix Pharmaceuticals Holding Corp. (Nasdaq: TNXP) (Tonix or the Company), a clinical-stage biopharmaceutical company, today announced that David C. Yeomans, Ph.D., presented data from clinical and nonclinical studies in an oral presentation at the 16th Annual Headache Cooperative of the Pacific (HCOP) Winter Conference on January 27, 2023. The oral presentation titled, “Primary vs SecondarySex Hormones and Migraine,” includes research sponsored by and licensed to Tonix Pharmaceuticals. Professor Yeomans was a founder of Trigemina, which Tonix acquired, and he remains a consultant to Tonix. A copy of the presentation is available under the Scientific Presentations tab of the Tonix Pharmaceuticals corporate website at www.tonixpharma.com.
“In addition to data showing that magnesium (Mg++) potentiates the analgesic effects of oxytocin, the presentation includes new preliminary data from a Positron Emission Tomography (PET) study in human volunteers dosed with a proprietary nitrogen-13 (13N) radioisotope of oxytocin formulated with Mg++,” said Seth Lederman, M.D., Chief Executive Officer of Tonix Pharmaceuticals. “A signal was observed in the trigeminal ganglia, indicating that intranasal oxytocin plus Mg++ delivers oxytocin to the trigeminal ganglia which have known roles in migraine headache. These studies were a collaboration with Aarhus University and the principal investigator, Michael Winterdahl, PhD.”
In addition to the PET study, the presentation includes data collected from isolated human trigeminal ganglia neurons in vitro which show oxytocin receptor co-expressed with calcitonin gene-related peptide (CGRP). The results of these studies, which were performed by postdoctoral fellow Vimala Bharadwaj, PhD, are believed to represent the first observation of oxytocin receptors in human tissue rather than in an animal model. Previously, it has been shown that oxytocin receptors and CGRP co-localize in rat trigeminal ganglia neurons. The cytokine IL-6 functionally upregulated expression of human trigeminal oxytocin receptors in vitro, similar to what has been shown previously in rats, in which oxytocin has been shown to functionally inhibit electrically evoked activity of trigeminal neurons.
Finally, the presentation highlights data which suggest a sex difference in oxytocin potency. “The results indicate that oxytocin is more potent in inhibiting trigeminal ganglion neuronal excitability in female rats compared to males,” said Professor David C. Yeomans. “Moreover, treating male rats with estrogen for four days increased the responsiveness of their isolated trigeminal ganglia to oxytocin in vitro such that they show a similar level of responsiveness to oxytocin as female trigeminal ganglia. The Company believes that together, these findings have potential dosing implications in humans who suffer from chronic migraine.”
In late 2021, Tonix received Investigational New Drug clearance from the U.S. Food and Drug Administration to support the initiation of a Phase 2 study of TNX-1900 (intranasal magnesium potentiated oxytocin) for the prevention of migraine headache in chronic migraineurs. The Company expects to begin enrollment in the Phase 2 study during the first quarter of 2023.
Tonix Pharmaceuticals Holding Corp.*
Tonix is a clinical-stage biopharmaceutical company focused on discovering, licensing, acquiring and developing therapeutics to treat and prevent human disease and alleviate suffering. Tonix’s portfolio is composed of central nervous system (CNS), rare disease, immunology and infectious disease product candidates. Tonix’s CNS portfolio includes both small molecules and biologics to treat pain, neurologic, psychiatric and addiction conditions. Tonix’s lead CNS candidate, TNX-102 SL (cyclobenzaprine HCl sublingual tablet), is in mid-Phase 3 development for the management of fibromyalgia with a new Phase 3 study launched in the second quarter of 2022 and interim data expected in the second quarter of 2023. TNX-102 SL is also being developed to treat Long COVID, a chronic post-acute COVID-19 condition. Tonix initiated a Phase 2 study in Long COVID in the third quarter of 2022 and expects interim data in the third quarter of 2023. TNX-1300 (cocaine esterase) is a biologic designed to treat cocaine intoxication and has been granted Breakthrough Therapy designation by the FDA. A Phase 2 study of TNX-1300 is expected to be initiated in the first quarter of 2023. TNX-1900 (intranasal potentiated oxytocin), a small molecule in development for chronic migraine, is expected to enter the clinic with a Phase 2 study in the first quarter of 2023. TNX-601 ER (tianeptine hemioxalate extended-release tablets) is a once-daily formulation of tianeptine being developed as a potential treatment for major depressive disorder (MDD) with a Phase 2 study expected to be initiated in the first quarter of 2023. Tonix’s rare disease portfolio includes TNX-2900 (intranasal potentiated oxytocin) for the treatment of Prader-Willi syndrome. TNX-2900 has been granted Orphan Drug designation by the FDA. Tonix’s immunology portfolio includes biologics to address organ transplant rejection, autoimmunity and cancer, including TNX-1500, which is a humanized monoclonal antibody targeting CD40-ligand (CD40L or CD154) being developed for the prevention of allograft and xenograft rejection and for the treatment of autoimmune diseases. A Phase 1 study of TNX-1500 is expected to be initiated in the first half of 2023. Tonix’s infectious disease pipeline includes a vaccine in development to prevent smallpox and monkeypox, TNX-801, a next-generation vaccine to prevent COVID-19, TNX-1850, a platform to make fully human monoclonal antibodies to treat COVID-19, TNX-3600, and humanized anti-SARS-CoV-2 monoclonal antibodies, TNX-3800, recently licensed from Curia. TNX-801, Tonix’s vaccine in development to prevent smallpox and monkeypox, also serves as the live virus vaccine platform or recombinant pox vaccine (RPV) platform for other infectious diseases. A Phase 1 study of TNX-801 is expected to be initiated in Kenya in the second half of 2023.
*All of Tonix’s product candidates are investigational new drugs or biologics and have not been approved for any indication.
This press release and further information about Tonix can be found at www.tonixpharma.com.
Forward Looking Statements
Certain statements in this press release are forward-looking within the meaning of the Private Securities Litigation Reform Act of 1995. These statements may be identified by the use of forward-looking words such as “anticipate,” “believe,” “forecast,” “estimate,” “expect,” and “intend,” among others. These forward-looking statements are based on Tonix’s current expectations and actual results could differ materially. There are a number of factors that could cause actual events to differ materially from those indicated by such forward-looking statements. These factors include, but are not limited to, risks related to the failure to obtain FDA clearances or approvals and noncompliance with FDA regulations; delays and uncertainties caused by the global COVID-19 pandemic; risks related to the timing and progress of clinical development of our product candidates; our need for additional financing; uncertainties of patent protection and litigation; uncertainties of government or third party payor reimbursement; limited research and development efforts and dependence upon third parties; and substantial competition. As with any pharmaceutical under development, there are significant risks in the development, regulatory approval and commercialization of new products. Tonix does not undertake an obligation to update or revise any forward-looking statement. Investors should read the risk factors set forth in the Annual Report on Form 10-K for the year ended December 31, 2021, as filed with the Securities and Exchange Commission (the “SEC”) on March 14, 2022, and periodic reports filed with the SEC on or after the date thereof. All of Tonix’s forward-looking statements are expressly qualified by all such risk factors and other cautionary statements. The information set forth herein speaks only as of the date thereof.
MIAMI, Jan. 30, 2023 (GLOBE NEWSWIRE) — Motorsport Games Inc. (NASDAQ: MSGM) (“Motorsport Games” or the “Company”) today announced that the Company has entered into a debt-for-equity exchange agreement (the “Agreement”) with its majority stockholder, Motorsport Network, LLC (“Motorsport Network”), to repay $1,000,000 in debt (including principal and accrued and not yet paid interest) of the Company under its $12 million line of credit with Motorsport Network.
Under the Agreement, for a period of 60 days from the closing of the transactions contemplated under the Agreement, the Company agreed to file a registration statement with the Securities and Exchange Commission (“SEC”) upon Motorsport Network’s demand in order to register the resale of the shares acquired by Motorsport Network under the Agreement, subject to the terms and conditions of the Agreement. The Agreement also granted certain piggyback registration rights to Motorsport Network.
“This debt exchange benefits our balance sheet, allows us to pay less interest expense and will help Motorsport Games to pursue product development and growth opportunities,” said Dmitry Kozko, CEO and Executive Chairman of Motorsport Games. “This debt exchange also signals the ongoing confidence that our majority shareholder, Motorsport Network, has in Motorsport Games.”
The foregoing summary of the Agreement is incomplete, and further details relating to the Agreement, including additional terms and conditions, and this transaction will be contained in the Current Report on Form 8-K the Company intends to file with the SEC later today.
About Motorsport Games:
Motorsport Games, a Motorsport Network company, is a leading racing game developer, publisher and esports ecosystem provider of official motorsport racing series throughout the world. Combining innovative and engaging video games with exciting esports competitions and content for racing fans and gamers, Motorsport Games strives to make the joy of racing accessible to everyone. The Company is the officially licensed video game developer and publisher for iconic motorsport racing series across PC, PlayStation, Xbox, Nintendo Switch and mobile, including NASCAR, INDYCAR, 24 Hours of Le Mans and the British Touring Car Championship (“BTCC”), as well as the industry leading rFactor 2 and KartKraft simulations. rFactor 2 also serves as the official sim racing platform of Formula E, while also powering F1 Arcade through a partnership with Kindred Concepts. Motorsport Games is an award-winning esports partner of choice for 24 Hours of Le Mans, Formula E, BTCC, the FIA World Rallycross Championship and the eNASCAR Heat Pro League, among others. Motorsport Games is building a virtual racing ecosystem where each product drives excitement, every esports event is an adventure and every story inspires.
Forward Looking Statements:
Certain statements in this press release which are not historical facts are forward-looking statements within the meaning of Section 27A of the Securities Act of 1933, as amended, and Section 21E of the Securities Exchange Act of 1934, as amended, and are provided pursuant to the safe harbor provisions of the Private Securities Litigation Reform Act of 1995. Any statements in this press release that are not statements of historical fact may be deemed forward-looking statements. Words such as “continue,” “will,” “may,” “could,” “should,” “expect,” “expected,” “plans,” “intend,” “anticipate,” “believe,” “estimate,” “predict,” “potential,” and similar expressions are intended to identify such forward-looking statements. All forward-looking statements involve significant risks and uncertainties that could cause actual results to differ materially from those expressed or implied in the forward-looking statements, many of which are generally outside the control of Motorsport Games and are difficult to predict. Examples of such risks and uncertainties include, without limitation, issuance of shares of Class A common stock under the Agreement impacting the value of the Company’s Class A common stock and less than expected benefits, such as the ability to develop product and achieve growth, from any transaction under the Agreement. Additional factors that could cause actual results to differ materially from those expressed or implied in the forward-looking statements can be found in Motorsport Games’ filings with the SEC, including its Annual Report on Form 10-K for the fiscal year ended December 31, 2021, its Quarterly Reports on Form 10-Q filed with the SEC during 2022, as well as in its subsequent filings with the SEC. Motorsport Games anticipates that subsequent events and developments may cause its plans, intentions and expectations to change. Motorsport Games assumes no obligation, and it specifically disclaims any intention or obligation, to update any forward-looking statements, whether as a result of new information, future events or otherwise, except as expressly required by law. Forward-looking statements speak only as of the date they are made and should not be relied upon as representing Motorsport Games’ plans and expectations as of any subsequent date.
Website and Social Media Disclosure:
Investors and others should note that we announce material financial information to our investors using our investor relations website (ir.motorsportgames.com), SEC filings, press releases, public conference calls and webcasts. We use these channels, as well as social media and blogs, to communicate with our investors and the public about our company and our products. It is possible that the information we post on our websites, social media and blogs could be deemed to be material information. Therefore, we encourage investors, the media and others interested in our company to review the information we post on the websites, social media channels and blogs, including the following (which list we will update from time to time on our investor relations website):
MIAMI, Jan. 30, 2023 (GLOBE NEWSWIRE) — Adam Breeden, the pioneer of competitive socialising in the UK and entrepreneurial force behind some of the sector’s most successful concepts, has officially opened his most ambitious and exciting project. F1® Arcade, the world’s first official premium F1 experiential venue, opened on December 12, 2022 in London at One New Change, St Pauls.
The immersive state of the art F1 racing simulation experience comes with 60 motion F1 simulators, powered by the rFactor 2 racing simulation software provided by Motorsport Games, combined with exclusive F1® content, enabling guests to live the thrill of racing, complemented by a best-in-class food and beverage offering created by an executive chef and expert mixologists.
“With a mission of making the thrill of motorsports available to everyone, we graciously appreciate the selection of rFactor 2 to provide the virtual racing experience and real world handling and competition to F1® Arcade and their customers!” said Dmitry Kozko, CEO, at Motorsport Games Inc. (NASDAQ: MSGM) (“Motorsport Games”), a leading racing game developer, publisher and esports ecosystem provider of official motorsport racing series throughout the world.
Dom Duhan, Executive Producer at Studio 397 added, “It was a pleasure for our expert simulation development team at Studio 397 to collaborate on developing the racing elements, and we expect that customers will be blown away by the experience.”
“Since opening F1® Arcade in December, the take up has been absolutely phenomenal. Our ambition was to introduce a truly innovative experience that makes sim racing accessible for all in a fun and premium competitive socialising environment. To deliver on this, we needed a partner that could fully tailor the game experience, which is why we selected rFactor 2 and Motorsport Games to work with us on this project. The reaction from customers in our first month has been fantastic and we look forward to welcoming many more at our first London venue and future venues as we expand,” said Adam Breeden, Founder and Chief Executive of Kindred Concepts.
Future plans for F1® Arcade include a Birmingham, UK site in 2023 with further locations powered by rFactor 2 set to be announced. For all F1® Arcade news, be sure to follow @F1Arcade on social media platforms.
About Motorsport Games: Motorsport Games, a Motorsport Network company, is a leading racing game developer, publisher and esports ecosystem provider of official motorsport racing series throughout the world. Combining innovative and engaging video games with exciting esports competitions and content for racing fans and gamers, Motorsport Games strives to make the joy of racing accessible to everyone. The Company is the officially licensed video game developer and publisher for iconic motorsport racing series across PC, PlayStation, Xbox, Nintendo Switch and mobile, including NASCAR, INDYCAR, 24 Hours of Le Mans and the British Touring Car Championship (“BTCC”), as well as the industry leading rFactor 2 and KartKraft simulations. rFactor 2 also serves as the official sim racing platform of Formula E, while also powering F1 Arcade through a partnership with Kindred Concepts. Motorsport Games is an award-winning esports partner of choice for 24 Hours of Le Mans, Formula E, BTCC, the FIA World Rallycross Championship and the eNASCAR Heat Pro League, among others. Motorsport Games is building a virtual racing ecosystem where each product drives excitement, every esports event is an adventure and every story inspires.
Forward-Looking Statements: Certain statements in this press release which are not historical facts are forward-looking statements within the meaning of Section 27A of the Securities Act of 1933, as amended, and Section 21E of the Securities Exchange Act of 1934, as amended, and are provided pursuant to the safe harbor provisions of the Private Securities Litigation Reform Act of 1995. Any statements in this press release that are not statements of historical fact may be deemed forward-looking statements. Words such as “continue,” “will,” “may,” “could,” “should,” “expect,” “expected,” “plans,” “intend,” “anticipate,” “believe,” “estimate,” “predict,” “potential,” and similar expressions are intended to identify such forward-looking statements. These forward-looking statements include, but are not limited to, statements concerning expectations and benefits of the rFactor 2 simulation platform in powering F1® Arcade, as well as expectations that future F1® Arcade locations will be powered by the rFactor 2 simulation platform. All forward-looking statements involve significant risks and uncertainties that could cause actual results to differ materially from those expressed or implied in the forward-looking statements, many of which are generally outside the control of Motorsport Games and are difficult to predict. Examples of such risks and uncertainties include, but are not limited to: difficulties, delays in or unanticipated events that may impact the timing and expected benefits of the rFactor 2 simulation platform, such as rFactor 2 updates and/or related products and features. Factors other than those referred to above could also cause Motorsport Games’ results to differ materially from expected results. Additional examples of such risks and uncertainties include, but are not limited to: (i) delays and higher than anticipated expenses related to the ongoing and prolonged COVID-19 pandemic, any resurgence of COVID-19 and the Russia invasion of Ukraine; (ii) Motorsport Games’ ability (or inability) to maintain existing, and to secure additional, licenses and other agreements with various racing series; (iii) Motorsport Games’ ability to successfully manage and integrate any joint ventures, acquisitions of businesses, solutions or technologies; (iv) unanticipated operating costs, transaction costs and actual or contingent liabilities; (v) the ability to attract and retain qualified employees and key personnel; (vi) adverse effects of increased competition; (vii) changes in consumer behavior, including as a result of general economic factors, such as increased inflation, higher energy prices and higher interest rates; (viii) Motorsport Games’ inability to protect its intellectual property; and/or (ix) local, industry and general business and economic conditions. Additional factors that could cause actual results to differ materially from those expressed or implied in the forward-looking statements can be found in Motorsport Games’ filings with the Securities and Exchange Commission (the “SEC”), including its Annual Report on Form 10-K for the fiscal year ended December 31, 2021, its Quarterly Reports on Form 10-Q filed with the SEC during 2022, as well as in its subsequent filings with the SEC. Motorsport Games anticipates that subsequent events and developments may cause its plans, intentions and expectations to change. Motorsport Games assumes no obligation, and it specifically disclaims any intention or obligation, to update any forward-looking statements, whether as a result of new information, future events or otherwise, except as expressly required by law. Forward-looking statements speak only as of the date they are made and should not be relied upon as representing Motorsport Games’ plans and expectations as of any subsequent date. Additionally, the business and financial materials and any other statement or disclosure on, or made available through, Motorsport Games’ website or other websites referenced or linked to this press release shall not be incorporated by reference into this press release.
Website and Social Media Disclosure:
Investors and others should note that we announce material financial information to our investors using our investor relations website (ir.motorsportgames.com), SEC filings, press releases, public conference calls and webcasts. We use these channels, as well as social media and blogs, to communicate with our investors and the public about our company and our products. It is possible that the information we post on our websites, social media and blogs could be deemed to be material information. Therefore, we encourage investors, the media and others interested in our company to review the information we post on the websites, social media channels and blogs, including the following (which list we will update from time to time on our investor relations website):
CHATHAM, N.J., Jan. 30, 2023 (GLOBE NEWSWIRE) — Tonix Pharmaceuticals Holding Corp. (Nasdaq: TNXP) (Tonix or the Company), a clinical-stage biopharmaceutical company, announced today that it has regained compliance with the minimum bid price requirement for continued listing on The Nasdaq Capital Market. On January 27, 2023, Tonix received a letter from The Nasdaq Stock Market LLC stating that because Tonix’s shares had a closing bid price at or above $1.00 per share for a minimum of 10 consecutive business days, Tonix’s stock had regained compliance with the minimum bid price requirement of $1.00 per share for continued listing on The Nasdaq Capital Market, as set forth in Nasdaq Listing Rule 5550(a)(2), and the matter is now closed.
Tonix Pharmaceuticals Holding Corp.*
Tonix is a clinical-stage biopharmaceutical company focused on discovering, licensing, acquiring and developing therapeutics to treat and prevent human disease and alleviate suffering. Tonix’s portfolio is composed of central nervous system (CNS), rare disease, immunology and infectious disease product candidates. Tonix’s CNS portfolio includes both small molecules and biologics to treat pain, neurologic, psychiatric and addiction conditions. Tonix’s lead CNS candidate, TNX-102 SL (cyclobenzaprine HCl sublingual tablet), is in mid-Phase 3 development for the management of fibromyalgia with a new Phase 3 study launched in the second quarter of 2022 and interim data expected in the second quarter of 2023. TNX-102 SL is also being developed to treat Long COVID, a chronic post-acute COVID-19 condition. Tonix initiated a Phase 2 study in Long COVID in the third quarter of 2022 and expects interim data in the third quarter of 2023. TNX-1300 (cocaine esterase) is a biologic designed to treat cocaine intoxication and has been granted Breakthrough Therapy designation by the FDA. A Phase 2 study of TNX-1300 is expected to be initiated in the first quarter of 2023. TNX-1900 (intranasal potentiated oxytocin), a small molecule in development for chronic migraine, is expected to enter the clinic with a Phase 2 study in the first quarter of 2023. TNX-601 ER (tianeptine hemioxalate extended-release tablets) is a once-daily formulation of tianeptine being developed as a potential treatment for major depressive disorder (MDD) with a Phase 2 study expected to be initiated in the first quarter of 2023. Tonix’s rare disease portfolio includes TNX-2900 (intranasal potentiated oxytocin) for the treatment of Prader-Willi syndrome. TNX-2900 has been granted Orphan Drug designation by the FDA. Tonix’s immunology portfolio includes biologics to address organ transplant rejection, autoimmunity and cancer, including TNX-1500, which is a humanized monoclonal antibody targeting CD40-ligand (CD40L or CD154) being developed for the prevention of allograft and xenograft rejection and for the treatment of autoimmune diseases. A Phase 1 study of TNX-1500 is expected to be initiated in the first half of 2023. Tonix’s infectious disease pipeline includes a vaccine in development to prevent smallpox and monkeypox, TNX-801, a next-generation vaccine to prevent COVID-19, TNX-1850, a platform to make fully human monoclonal antibodies to treat COVID-19, TNX-3600, and humanized anti-SARS-CoV-2 monoclonal antibodies, TNX-3800, recently licensed from Curia. TNX-801, Tonix’s vaccine in development to prevent smallpox and monkeypox, also serves as the live virus vaccine platform or recombinant pox vaccine (RPV) platform for other infectious diseases. A Phase 1 study of TNX-801 is expected to be initiated in Kenya in the second half of 2023.
*All of Tonix’s product candidates are investigational new drugs or biologics and have not been approved for any indication.
This press release and further information about Tonix can be found at www.tonixpharma.com.
Forward Looking Statements
Certain statements in this press release are forward-looking within the meaning of the Private Securities Litigation Reform Act of 1995. These statements may be identified by the use of forward-looking words such as “anticipate,” “believe,” “forecast,” “estimate,” “expect,” and “intend,” among others. These forward-looking statements are based on Tonix’s current expectations and actual results could differ materially. There are a number of factors that could cause actual events to differ materially from those indicated by such forward-looking statements. These factors include, but are not limited to, risks related to the failure to obtain FDA clearances or approvals and noncompliance with FDA regulations; delays and uncertainties caused by the global COVID-19 pandemic; risks related to the timing and progress of clinical development of our product candidates; our need for additional financing; uncertainties of patent protection and litigation; uncertainties of government or third party payor reimbursement; limited research and development efforts and dependence upon third parties; and substantial competition. As with any pharmaceutical under development, there are significant risks in the development, regulatory approval and commercialization of new products. Tonix does not undertake an obligation to update or revise any forward-looking statement. Investors should read the risk factors set forth in the Annual Report on Form 10-K for the year ended December 31, 2021, as filed with the Securities and Exchange Commission (the “SEC”) on March 14, 2022, and periodic reports filed with the SEC on or after the date thereof. All of Tonix’s forward-looking statements are expressly qualified by all such risk factors and other cautionary statements. The information set forth herein speaks only as of the date thereof.
Fourth quarter 2022 revenue of $700.7 million, net income of $214.5 million, and EBITDA of $293.9 million, up 48.0%, 313.8%, and 125.7%, respectively, year-over-year
Record full year 2022 revenue of $2.4 billion, net income of $577.2 million, and EBITDA of $940.2 million, up 53.3%, 224.0%, and 96.3%, respectively, year-over-year
In January 2023, increased quarterly cash distribution rate to $0.70 per unit, or $2.80 per unit annualized, up 40.0% from the last quarter and 180.0% year-over-year
In January 2023, increased unit repurchase program to $100.0 million
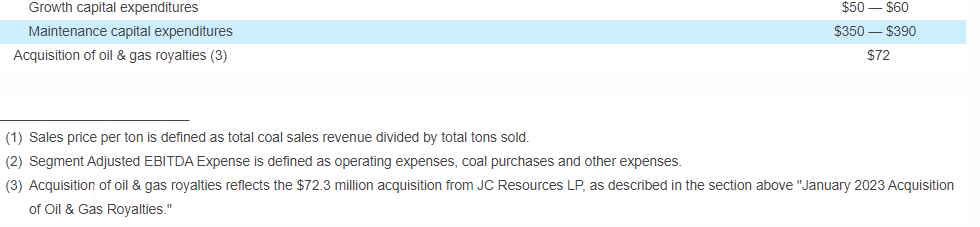
Completed $81.2 million acquisition of previously announced oil & gas mineral interests in October 2022, and today, separately announced a $72.3 million acquisition of oil & gas mineral interests
In January 2023, successfully refinanced existing revolving credit facility, extending liquidity and financial flexibility through March 2027
2023 expected coal sales volumes approximately 94% committed and priced above 2022 per ton levels
TULSA, Okla.–(BUSINESS WIRE)– Alliance Resource Partners, L.P. (NASDAQ: ARLP) (“ARLP” or the “Partnership”) today reported substantial increases to financial and operating results for the quarter and year ended December 31, 2022 (the “2022 Quarter” and “2022 Full Year”, respectively) compared to the quarter and year ended December 31, 2021 (the “2021 Quarter” and “2021 Full Year”, respectively).
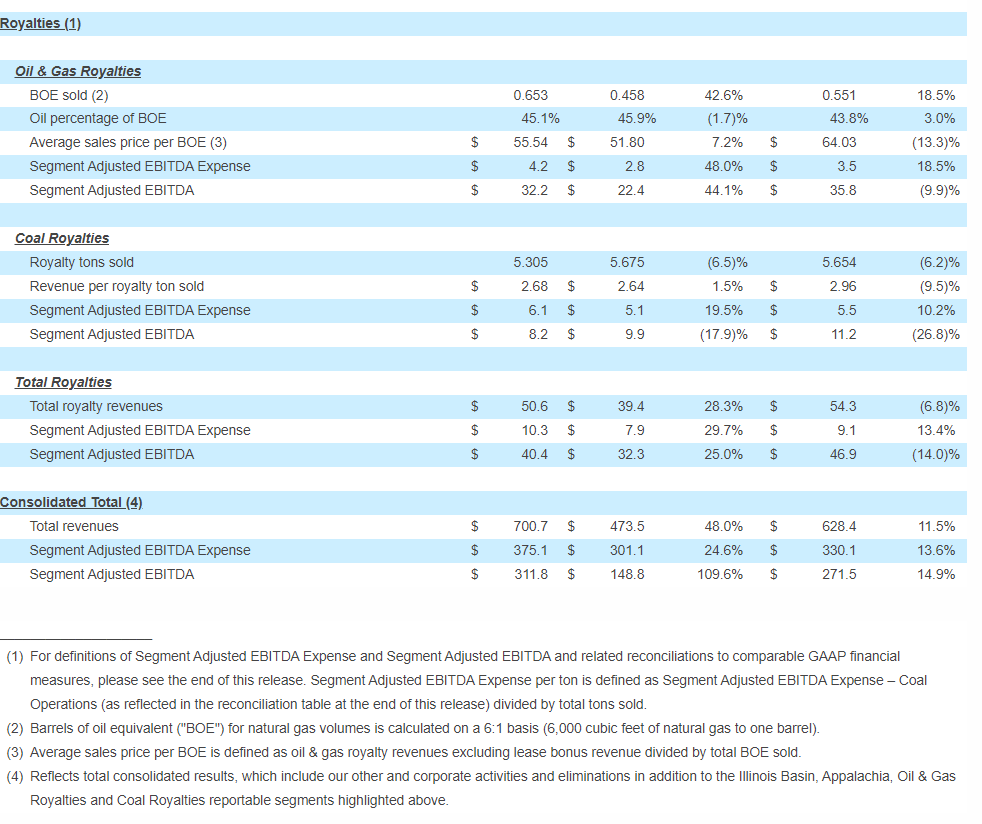
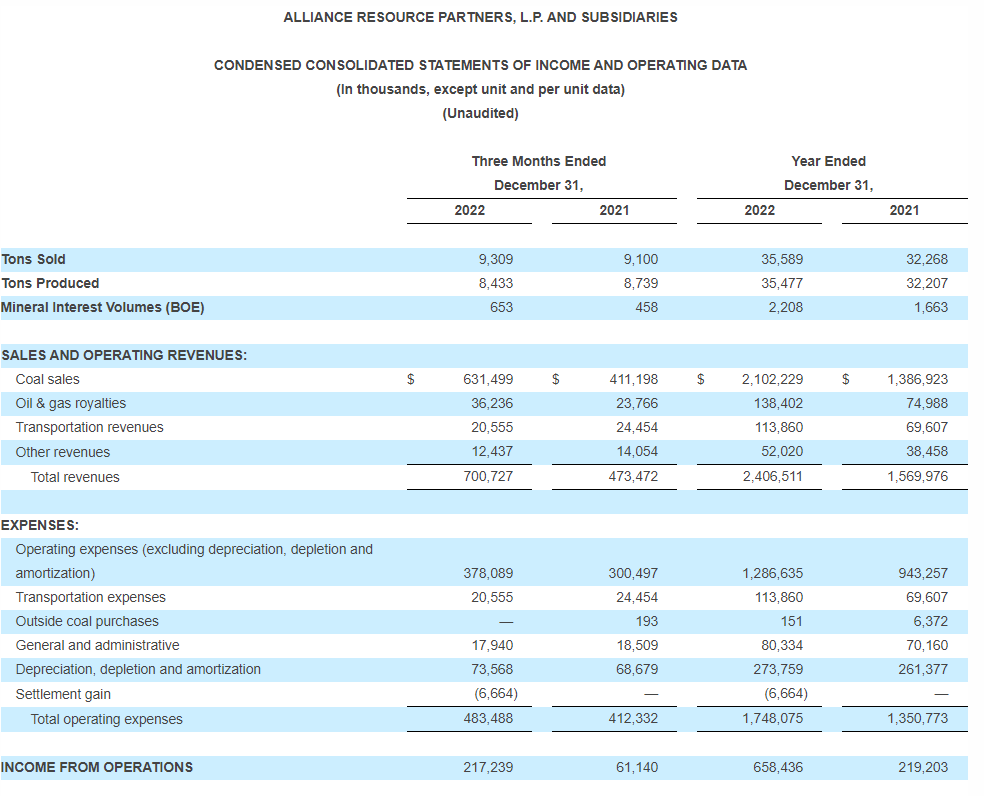
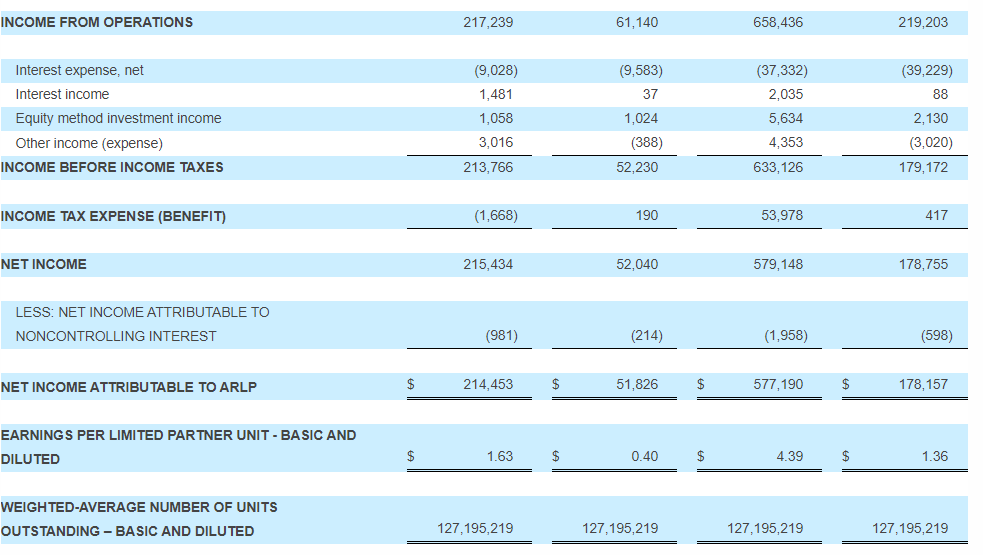
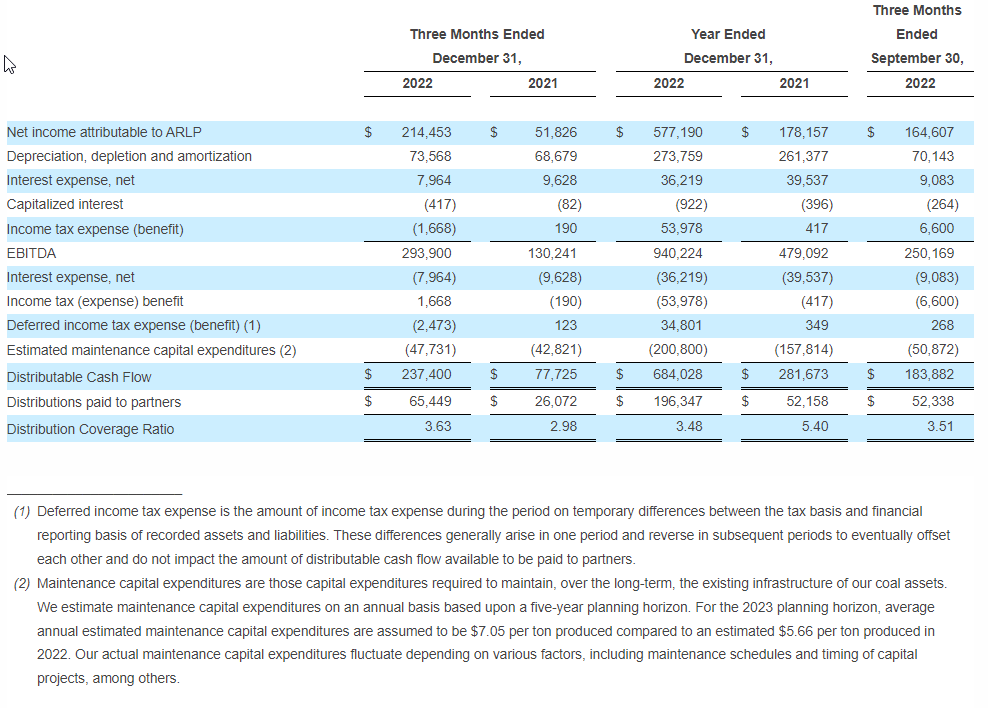
Total revenues in the 2022 Quarter increased 48.0% to a record $700.7 million compared to $473.5 million for the 2021 Quarter as a result of significantly higher coal sales and oil & gas royalties revenues. Increased revenues, partially offset by higher total operating expenses, led net income for the 2022 Quarter to a record $214.5 million, or $1.63 per basic and diluted limited partner unit, compared to $51.8 million, or $0.40 per basic and diluted limited partner unit, for the 2021 Quarter. EBITDA also increased 125.7% in the 2022 Quarter to $293.9 million compared to $130.2 million in the 2021 Quarter. (Unless otherwise noted, all references in the text of this release to “net income” refer to “net income attributable to ARLP.” For a definition of EBITDA and related reconciliation to its comparable GAAP financial measure, please see the end of this release.)
2022 Full Year performance saw total revenues increase 53.3% to a record $2.4 billion compared to $1.6 billion for the 2021 Full Year, primarily due to substantial increases in prices and volumes from both ARLP’s coal operations and royalty segments. Higher revenues, partially offset by increased total operating and income tax expenses, led to significantly higher net income, which rose 224.0% to a record $577.2 million, or $4.39 per basic and diluted limited partner unit, compared to $178.2 million, or $1.36 per basic and diluted limited partner unit, for the 2021 Full Year. EBITDA increased 96.3% to $940.2 million compared to $479.1 million for the 2021 Full Year.
CEO Commentary
“ARLP’s record performance during the 2022 quarter and full year, in a supply and transportation constrained operating environment, is a testament to our team’s ability to execute and deliver reliable energy supply under challenging circumstances,” commented Joseph W. Craft III, Chairman, President, and Chief Executive Officer. “In 2022, ARLP achieved its highest reported EBITDA and operating cash flow in the Partnership’s 23-year history, driven by continued growth in sales volumes coupled with higher price realizations across our coal operations and royalty segments.”
Mr. Craft added, “With our strong balance sheet and relentless focus on cash flow generation, we are well positioned to capitalize on growth opportunities in the market and return capital to our unitholders. Based on our highly committed coal sales book and visibility into our end markets, last week we were pleased to announce a 40% increase in ARLP’s quarterly cash distribution rate to $0.70 per unit, or $2.80 per unit on an annualized basis. This increase is consistent with our long-term strategic capital allocation plans and is well-supported by strong visibility into future cash flows with approximately 94% of our expected 2023 coal sales volumes committed and priced as we enter the year. I am proud of the team’s record of success, and, as reflected in our initial guidance, look forward to achieving even stronger results in 2023.”
Coal Operations
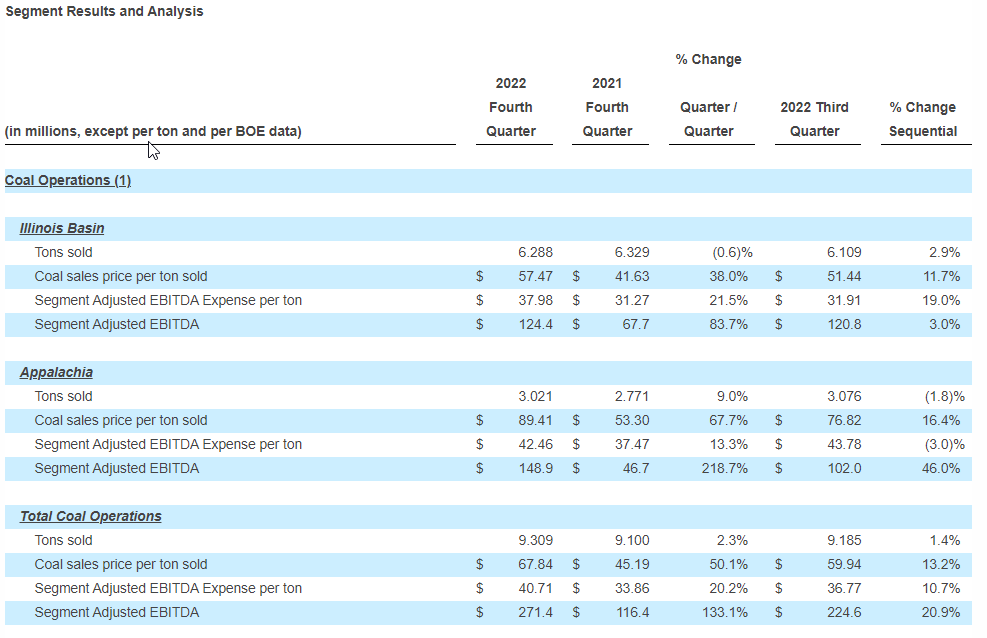
ARLP’s coal sales prices per ton increased significantly compared to the 2021 Quarter as improved price realizations in both the domestic and export markets drove coal sales prices higher by 38.0% and 67.7% in the Illinois Basin and Appalachia, respectively. Compared to the quarter ended September 30, 2022 (the “Sequential Quarter”), higher export prices led to an 11.7% increase in coal sales price realizations in the Illinois Basin while higher domestic prices primarily from our Tunnel Ridge mine resulted in an increase of 16.4% in Appalachian coal sales prices. Tons sold remained relatively consistent in the Illinois Basin compared to the 2021 Quarter while increasing by 9.0% in Appalachia due primarily to increased sales volumes from Tunnel Ridge as a result of higher recoveries. Compared to the Sequential Quarter, increased sales volumes from our Gibson South and River View mines resulted in 2.9% higher tons sold in the Illinois Basin. Coal sales volumes in Appalachia decreased by 1.8% compared to the Sequential Quarter due to higher sales from inventory at Tunnel Ridge in the Sequential Quarter. ARLP ended the 2022 Quarter with total coal inventory of 0.5 million tons, which included 0.2 million tons staged at ports for vessel export in early 2023.
Segment Adjusted EBITDA Expense per ton increased by 21.5% and 13.3% in the Illinois Basin and Appalachia, respectively, compared to the 2021 Quarter primarily as a result of ongoing inflationary pressures on certain expense items, most notably labor-related expenses, supply and maintenance costs, increased sales-related expenses due to higher price realizations, and $6.5 million of non-cash accruals for certain long-term liabilities. Also specific to the 2022 Quarter, a thermal event at our Hamilton mine resulted in an unexpected outage that lasted approximately four weeks. There were no injuries to personnel, no damage to the equipment, and mining operations returned to normal production levels in December 2022; however, third-party expenses related to the event were approximately $5.8 million and approximately 0.5 million tons of production was lost in the 2022 Quarter. Excluding certain non-cash liability accruals and the Hamilton event related expenses, Illinois Basin Segment Adjusted EBITDA Expense per ton for the 2022 Quarter would have been more in-line with the percentage increases realized in Appalachia for the 2022 Quarter.
Royalties
Segment Adjusted EBITDA for our Oil & Gas Royalties segment increased 44.1% to $32.2 million in the 2022 Quarter compared to $22.4 million in the 2021 Quarter primarily due to significantly higher oil & gas royalty volumes, which rose by 42.6% to a record 653,000 BOE sold as a result of increased drilling and completion activities and additional volumes from oil & gas mineral interest acquisitions completed during 2022. Compared to the Sequential Quarter, Segment Adjusted EBITDA decreased by 9.9% in the 2022 Quarter primarily due to lower price realizations, which decreased by 13.3%, partially offset by higher oil & gas volumes, which increased by 18.5%.
Segment Adjusted EBITDA for our Coal Royalties segment decreased 17.9% to $8.2 million for the 2022 Quarter compared to $9.9 million for the 2021 Quarter primarily related to the Hamilton thermal event which reduced royalty tons sold by 8.5%. Compared to the Sequential Quarter, Segment Adjusted EBITDA decreased 26.8% due to lower royalty tons sold and average royalty rates per ton due to the Hamilton thermal event.
Balance Sheet and Liquidity
In January 2023, the Partnership entered into a new $425.0 million senior secured revolving credit facility and $75.0 million term loan (the “Credit Facilities”), which will mature in March 2027, and renewed its $60.0 million accounts receivable securitization facility. The Credit Facilities will replace the previous revolving credit facility, which was set to mature in March 2024. More information regarding the Credit Facilities is provided in our Form 8-K filing made on January 20, 2023.
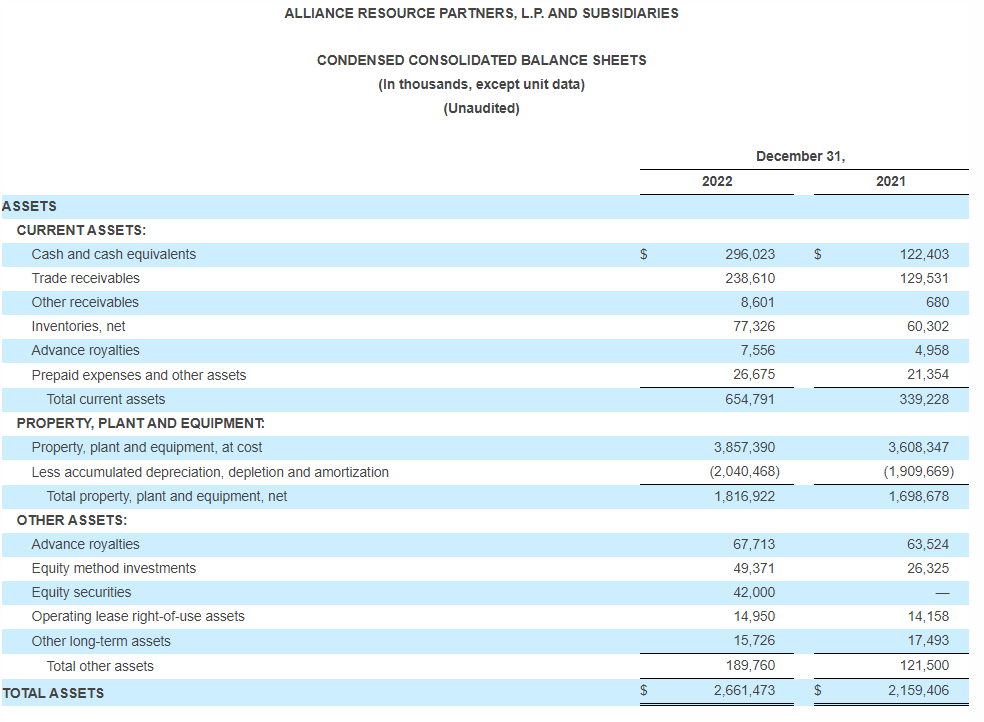
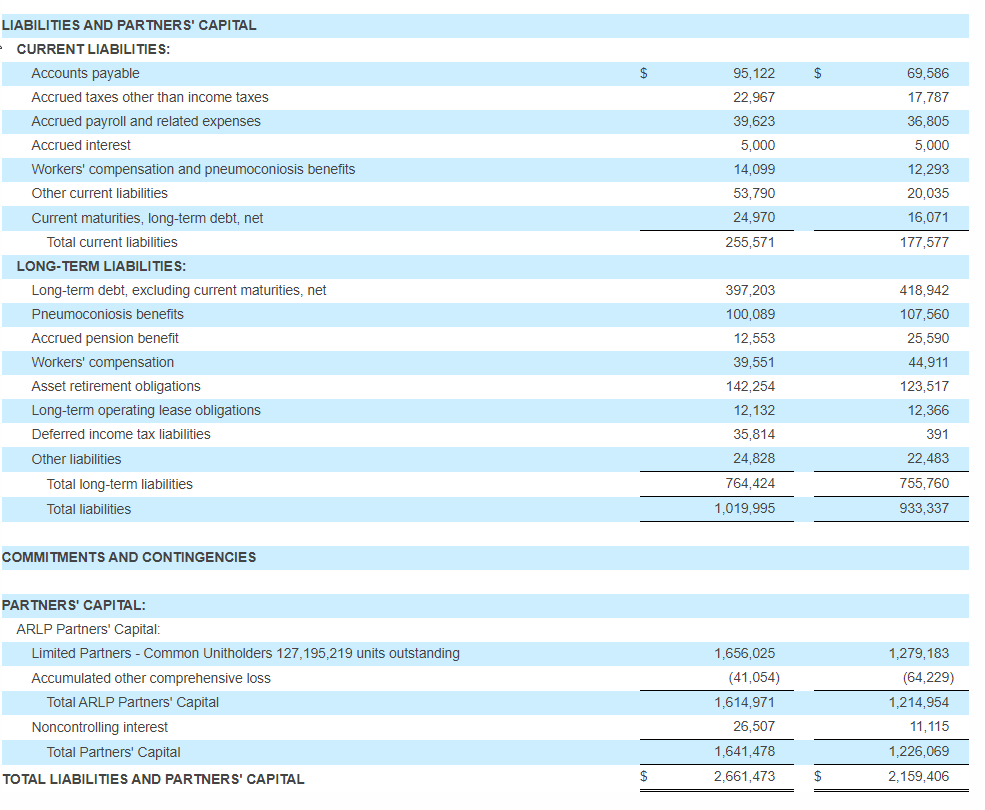
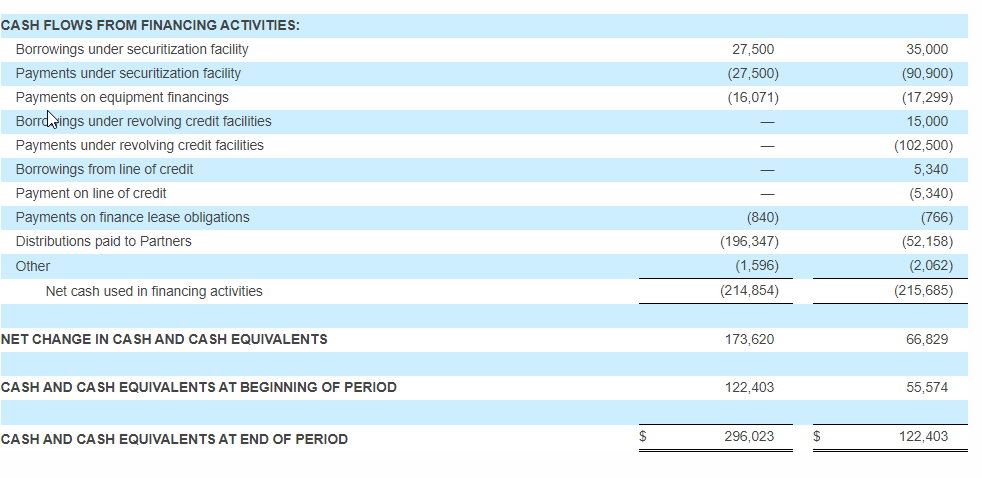
As of December 31, 2022, total debt and finance leases outstanding were $427.6 million, including $400.0 million in ARLP’s 2025 senior notes. The Partnership’s total and net leverage ratio improved to 0.45 times and 0.14 times, respectively, during the 2022 Quarter. ARLP ended the year with total liquidity of $762.8 million, which included $296.0 million of cash and cash equivalents and $466.7 million of borrowings available under our previous revolving credit and accounts receivable securitization facilities.
Distributions
As previously announced on January 27, 2023, the Board of Directors of ARLP’s general partner (the “Board”) approved a cash distribution to unitholders for the 2022 Quarter of $0.70 per unit (an annualized rate of $2.80 per unit), payable on February 14, 2023, to all unitholders of record as of the close of trading on February 7, 2023. The announced distribution represents a 180.0% increase over the cash distribution of $0.25 per unit for the 2021 Quarter and is a 40.0% increase over the cash distribution of $0.50 per unit for the Sequential Quarter.
Unit Repurchase Program
ARLP also announced today that the Board has authorized an increase to the previously established unit repurchase program, which had $6.5 million of available capacity as of December 31, 2022. The expanded unit repurchase program authorizes ARLP to repurchase up to $100.0 million of its outstanding limited partner common units. The unit repurchase program announced today is intended to enhance ARLP’s ability to achieve its goal of creating long-term value for unitholders and, along with management’s objective of increasing quarterly cash distributions, increases flexibility in returning cash to unitholders. Future unit repurchases and distributions will be subject to ongoing Board review and authorization and will be based on a number of factors, including ARLP’s financial and operating performance and other capital requirements as well as future economic, business and market conditions.
The unit repurchase program has no time limit and ARLP may repurchase units from time to time in the open market or in other privately negotiated transactions. The unit repurchase program authorization does not obligate ARLP to repurchase any dollar amount or number of its units and repurchases may be commenced or suspended from time to time without prior notice.
January 2023 Acquisition of Oil & Gas Royalties
On January 27, 2023, the Board approved an acquisition of 2,682 net oil and gas royalty acres in the Permian Basin from JC Resources LP, an entity owned by Mr. Craft, for a cash purchase price of $72.3 million, subject to customary closing adjustments. Upon closing, the acquisition is expected to be immediately accretive to cash flow. The purchase price will be funded with available cash and is expected to close within the next 30 days based on an effective date of January 1, 2023. Since the acquisition involves a related party, terms of the transaction were approved by the Board’s conflicts committee, which is comprised entirely of independent directors.
Outlook
“The supply driven energy crisis, Russia’s invasion of Ukraine and the steep build of inflation disrupted energy prices and placed a new emphasis on energy security in 2022,” commented Mr. Craft. “Europe’s shift from Russian energy and U.S. and its allies’ economic sanctions are lowering Russian supply to the world, changing global energy trade routes and energy markets for several years to come, if not permanently. U.S. natural gas and coal exports should benefit in 2023 and beyond.”
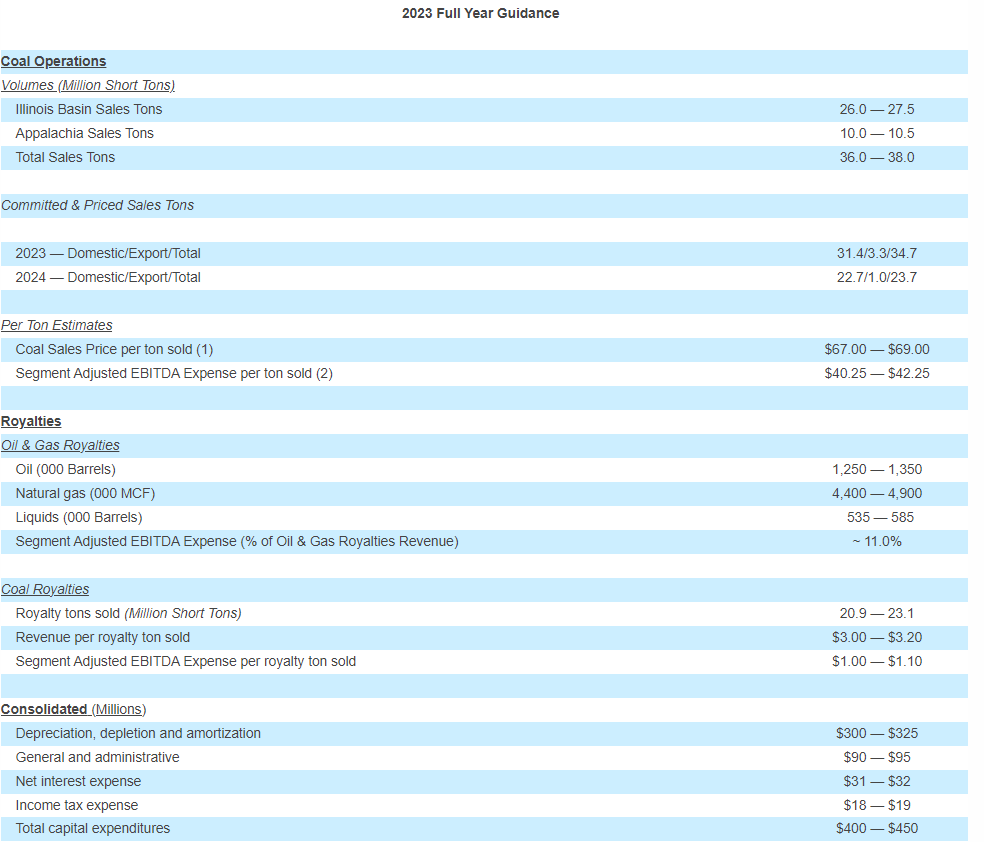
“Due in part to this ongoing disruption, ARLP is well positioned to achieve another record year in 2023 by increasing production and sales by one to two million tons and relying on our highly committed coal contract book and a favorable market outlook to deliver 13.0 to 17.0% higher realized pricing compared to 2022,” commented Mr. Craft. “Even though natural gas prices have fallen recently due to the warm winter experienced so far, coal prices remain elevated in anticipation of international demand firming throughout the year as China’s economy reopens and as European markets look to replace 40 million tons of Russian coal imports received last year but unavailable this year. While the recent decline in natural gas prices are expected to impact our oil & gas royalties segment in the front half of the year, our coal segment should not be meaningfully affected due to our contracted position. In the back of this year and into 2024, we expect global economic activity will result in rising oil, gas and coal prices, and support our guidance.”
Mr. Craft concluded, “We are beginning to see the significant inflation experienced last year start to level off, however labor pressures and higher sales related expenses as a result of higher price realizations and coal sales volumes will continue to add to our costs in 2023. However, we expect favorable market forces and our current coal sales commitments will drive top line growth that should more than offset these inflationary pressures as margins are expected to improve across our business in 2023 versus the prior year.”
ARLP is providing the following initial guidance for the 2023 full year:
Conference Call
A conference call regarding ARLP’s 2022 Quarter and Year financial results and 2023 outlook is scheduled for today at 10:00 a.m. Eastern. To participate in the conference call, dial (877) 407-0784 and request to be connected to the Alliance Resource Partners, L.P. earnings conference call. International callers should dial (201) 689-8560 and request to be connected to the same call. Investors may also listen to the call via the “investor relations” section of ARLP’s website at http://www.arlp.com.
An audio replay of the conference call will be available for approximately one week. To access the audio replay, dial U.S. Toll Free (844) 512-2921; International Toll (412) 317-6671 and request to be connected to replay using access code 13735338.
About Alliance Resource Partners, L.P.
ARLP is a diversified energy company that is one of the largest coal producers in the eastern United States. ARLP also generates operating and royalty income from mineral interests it owns in strategic coal and oil & gas producing regions in the United States. In addition, ARLP is positioning itself as an energy provider for the future by leveraging its core technology and operating competencies to make strategic investments in the fast-growing energy and infrastructure transition.
News, unit prices and additional information about ARLP, including filings with the Securities and Exchange Commission (“SEC”), are available at http://www.arlp.com. For more information, contact the investor relations department of ARLP at (918) 295-7674 or via e-mail at [email protected].
The statements and projections used throughout this release are based on current expectations. These statements and projections are forward-looking, and actual results may differ materially. These projections do not include the potential impact of any mergers, acquisitions or other business combinations that may occur after the date of this release. We have included more information below regarding business risks that could affect our results.
FORWARD-LOOKING STATEMENTS: With the exception of historical matters, any matters discussed in this press release are forward-looking statements that involve risks and uncertainties that could cause actual results to differ materially from projected results. Those forward-looking statements include expectations with respect to our future financial performance, coal and oil & gas consumption and expected future prices, our ability to increase unitholder distributions in future quarters, business plans and potential growth with respect to our energy and infrastructure transition investments, optimizing cash flows, reducing operating and capital expenditures, preserving liquidity and maintaining financial flexibility, among others. These risks to our ability to achieve these outcomes include, but are not limited to, the following: the outcome or escalation of current hostilities in Ukraine, the severity, magnitude, and duration of the COVID-19 pandemic and the emergence of new virus variants, and impacts of the pandemic and of businesses’ and governments’ responses to the pandemic, including actions to mitigate its impact and the development of treatments and vaccines, on our operations and personnel, and on demand for coal, oil, and natural gas, the financial condition of our customers and suppliers, available liquidity and capital sources and broader economic disruptions; changes in macroeconomic and market conditions and market volatility, and the impact of such changes and volatility on our financial position; decline in the coal industry’s share of electricity generation, including as a result of environmental concerns related to coal mining and combustion and the cost and perceived benefits of other sources of electricity and fuels, such as oil & gas, nuclear energy, and renewable fuels; changes in global economic and geo-political conditions or in industries in which we or our customers operate; changes in commodity prices, demand and availability which could affect our operating results and cash flows; actions of the major oil-producing countries with respect to oil production volumes and prices could have direct and indirect impacts over the near and long term on oil & gas exploration and production operations at the properties in which we hold mineral interests; changes in competition in domestic and international coal markets and our ability to respond to such changes; potential shut-ins of production by operators of the properties in which we hold oil & gas mineral interests due to low commodity prices or the lack of downstream demand or storage capacity; risks associated with the expansion of our operations and properties; our ability to identify and complete acquisitions and to successfully integrate acquisitions into our business and achieve the anticipated benefits therefrom; our ability to identify and invest in new energy and infrastructure transition ventures; the success of our development plans for our wholly owned subsidiary, MatrixDesign Group, LLC, and our investments in emerging infrastructure and technology companies; dependence on significant customer contracts, including renewing existing contracts upon expiration; adjustments made in price, volume, or terms to existing coal supply agreements; the effects of and changes in trade, monetary and fiscal policies and laws, including the interest rate policies of the Federal Reserve Board; the effects of and changes in taxes or tariffs and other trade measures adopted by the United States and foreign governments; legislation, regulations, and court decisions and interpretations thereof, both domestic and foreign, including those relating to the environment and the release of greenhouse gases, mining, miner health and safety, hydraulic fracturing, and health care; deregulation of the electric utility industry or the effects of any adverse change in the coal industry, electric utility industry, or general economic conditions; investors’ and other stakeholders’ increasing attention to environmental, social and governance matters; liquidity constraints, including those resulting from any future unavailability of financing; customer bankruptcies, cancellations or breaches to existing contracts, or other failures to perform; customer delays, failure to take coal under contracts or defaults in making payments; our productivity levels and margins earned on our coal sales; disruptions to oil & gas exploration and production operations at the properties in which we hold mineral interests; changes in equipment, raw material, service or labor costs or availability, including due to inflationary pressures; changes in our ability to recruit, hire and maintain labor, including as a result of the potential impact of government-imposed vaccine mandates; our ability to maintain satisfactory relations with our employees; increases in labor costs including costs of health insurance and taxes resulting from the Affordable Care Act, adverse changes in work rules, or cash payments or projections associated with workers’ compensation claims; increases in transportation costs and risk of transportation delays or interruptions; operational interruptions due to geologic, permitting, labor, weather, supply chain shortages of equipment or mine supplies, or other factors; risks associated with major mine-related accidents, mine fires, mine floods or other interruptions; results of litigation, including claims not yet asserted; foreign currency fluctuations that could adversely affect the competitiveness of our coal abroad; difficulty maintaining our surety bonds for mine reclamation as well as workers’ compensation and black lung benefits; difficulty in making accurate assumptions and projections regarding post-mine reclamation as well as pension, black lung benefits, and other post-retirement benefit liabilities; uncertainties in estimating and replacing our coal mineral reserves and resources; uncertainties in estimating and replacing our oil & gas reserves; uncertainties in the amount of oil & gas production due to the level of drilling and completion activity by the operators of our oil & gas properties; uncertainties in the future of the electric vehicle industry and the market for EV charging stations; the impact of current and potential changes to federal or state tax rules and regulations, including a loss or reduction of benefits from certain tax deductions and credits; difficulty obtaining commercial property insurance, and risks associated with our participation in the commercial insurance property program; evolving cybersecurity risks, such as those involving unauthorized access, denial-of-service attacks, malicious software, data privacy breaches by employees, insiders or others with authorized access, cyber or phishing-attacks, ransomware, malware, social engineering, physical breaches, or other actions; and difficulty in making accurate assumptions and projections regarding future revenues and costs associated with equity investments in companies we do not control.
Additional information concerning these and other factors can be found in ARLP’s public periodic filings with the SEC, including ARLP’s Annual Report on Form 10-K for the year ended December 31, 2021, filed on February 25, 2022 and amended on August 26, 2022, and ARLP’s Quarterly Reports on Form 10-Q for the quarters ended March 31, 2022, June 30, 2022 and September 30, 2022, filed on May 9, 2022, August 8, 2022 and November 7, 2022, respectively. Except as required by applicable securities laws, ARLP does not intend to update its forward-looking statements.
Reconciliation of Non-GAAP Financial Measures
Reconciliation of GAAP “net income attributable to ARLP” to non-GAAP “EBITDA” and “Distributable Cash Flow” (in thousands).
EBITDA is defined as net income attributable to ARLP before net interest expense, income taxes and depreciation, depletion and amortization. Distributable cash flow (“DCF”) is defined as EBITDA excluding interest expense (before capitalized interest), interest income, income taxes and estimated maintenance capital expenditures. Distribution coverage ratio (“DCR”) is defined as DCF divided by distributions paid to partners.
Management believes that the presentation of such additional financial measures provides useful information to investors regarding our performance and results of operations because these measures, when used in conjunction with related GAAP financial measures, (i) provide additional information about our core operating performance and ability to generate and distribute cash flow, (ii) provide investors with the financial analytical framework upon which management bases financial, operational, compensation and planning decisions and (iii) present measurements that investors, rating agencies and debt holders have indicated are useful in assessing us and our results of operations.
EBITDA, DCF and DCR should not be considered as alternatives to net income attributable to ARLP, net income, income from operations, cash flows from operating activities or any other measure of financial performance presented in accordance with GAAP. EBITDA and DCF are not intended to represent cash flow and do not represent the measure of cash available for distribution. Our method of computing EBITDA, DCF and DCR may not be the same method used to compute similar measures reported by other companies, or EBITDA, DCF and DCR may be computed differently by us in different contexts (i.e. public reporting versus computation under financing agreements).
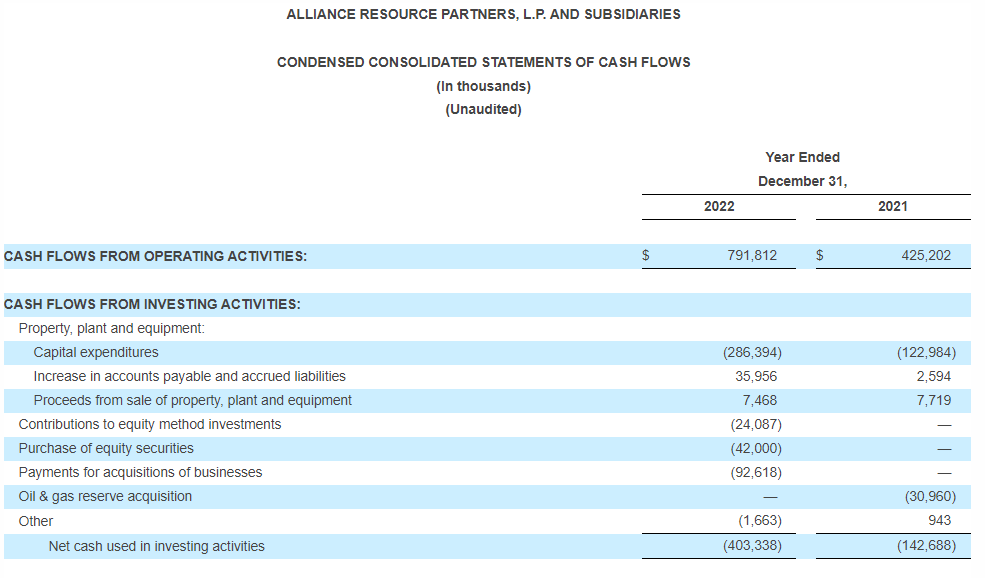
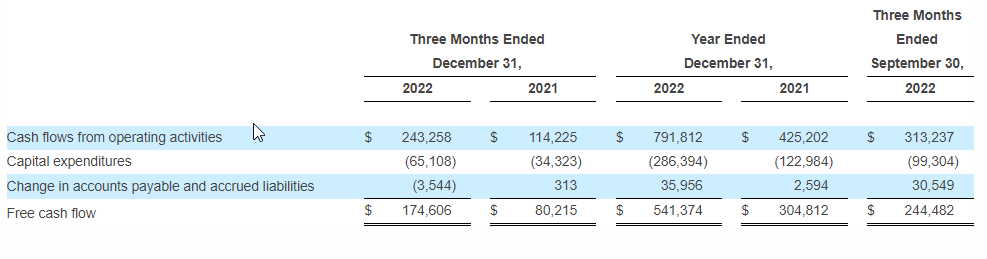
Reconciliation of GAAP “Cash flows from operating activities” to non-GAAP “Free cash flow” (in thousands).
Free cash flow is defined as cash flows from operating activities less capital expenditures and the change in accounts payable and accrued liabilities from purchases of property plant and equipment. Free cash flow should not be considered as an alternative to cash flows from operating activities or any other measure of financial performance presented in accordance with GAAP. Our method of computing free cash flow may not be the same method used by other companies. Free cash flow is a supplemental liquidity measure used by our management to assess our ability to generate excess cash flow from our operations.
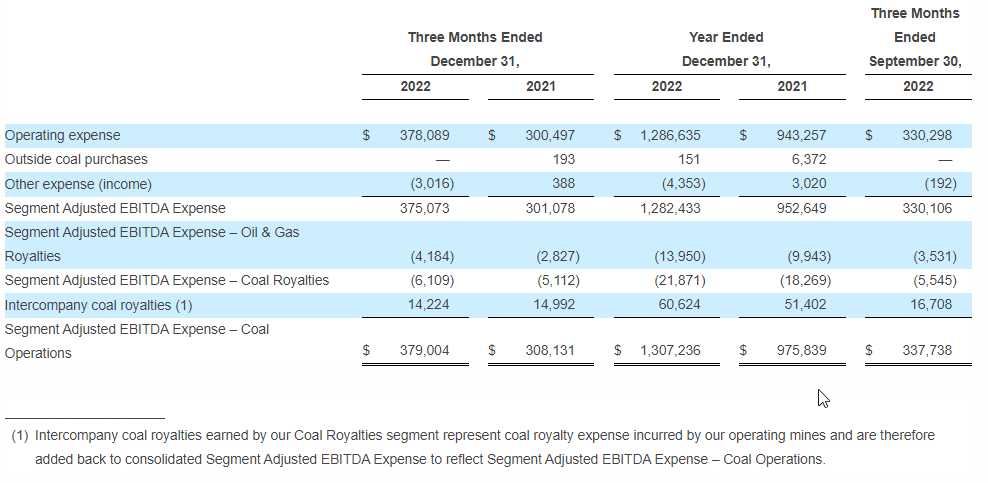
Reconciliation of GAAP “Operating Expenses” to non-GAAP “Segment Adjusted EBITDA Expense” and Reconciliation of non-GAAP ” EBITDA” to “Segment Adjusted EBITDA” (in thousands).
Segment Adjusted EBITDA Expense includes operating expenses, coal purchases and other income or expense. Transportation expenses are excluded as these expenses are passed through to our customers and, consequently, we do not realize any margin on transportation revenues. Segment Adjusted EBITDA Expense is used as a supplemental financial measure by our management to assess the operating performance of our segments. Segment Adjusted EBITDA Expense is a key component of EBITDA in addition to coal sales, royalty revenues and other revenues. The exclusion of corporate general and administrative expenses from Segment Adjusted EBITDA Expense allows management to focus solely on the evaluation of segment operating performance as it primarily relates to our operating expenses. Segment Adjusted EBITDA Expense – Coal Operations excludes expenses of our Oil & Gas Royalties segment and is adjusted for intercompany interactions with our Coal Royalties segment.
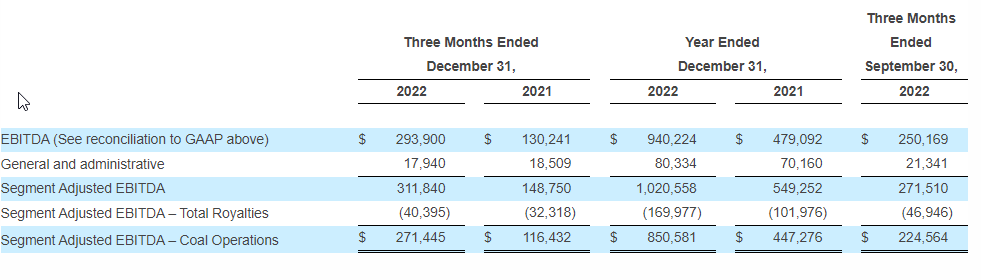
Segment Adjusted EBITDA is defined as net income attributable to ARLP before net interest expense, income taxes, depreciation, depletion and amortization, general and administrative expenses and settlement gains. Segment Adjusted EBITDA – Coal Operations excludes the contribution of our Oil & Gas and Coal Royalties segments to allow management to focus solely on the operating performance of our Illinois Basin and Appalachia segments.
Brian L. Cantrell, Chief Financial Officer 918-295-7674 [email protected]
TULSA, Okla.–(BUSINESS WIRE)– Alliance Resource Partners, L.P. (NASDAQ: ARLP) today announced that the Board of Directors of ARLP’s general partner approved an increased cash distribution to its unitholders for the quarter ended December 31, 2022 (the “2022 Quarter”).
ARLP unitholders will receive a cash distribution for the 2022 Quarter of $0.70 per unit (an annualized rate of $2.80 per unit), payable on February 14, 2023 to all unitholders of record as of the close of trading on February 7, 2023. The announced distribution represents a 180% increase over the cash distribution of $0.25 per unit for the quarter ended December 31, 2021 and a 40% increase over the cash distribution of $0.50 per unit for the quarter ended September 30, 2022.
As previously announced, ARLP will report financial results for the 2022 Quarter before the market opens on Monday, January 30, 2023 and Alliance management will discuss these results during a conference call beginning at 10:00 a.m. Eastern that same day.
To participate in the conference call, dial (877) 407-0784 and request to be connected to the Alliance Resource Partners, L.P. earnings conference call. International callers should dial (201) 689-8560 and request to be connected to the same call. Investors may also listen to the call via the “investor relations” section of ARLP’s website at http://www.arlp.com.
An audio replay of the conference call will be available for approximately one week. To access the audio replay, dial U.S. Toll Free (844) 512-2921; International Toll (412) 317-6671 and request to be connected to replay using access code 13735338.
Concurrent with this announcement we are providing qualified notice to brokers and nominees that hold ARLP units on behalf of non-U.S. investors under Treasury Regulation Section 1.1446-4(b) and (d) and Treasury Regulation Section 1.1446(f)-4(c)(2)(iii). Brokers and nominees should treat one hundred percent (100%) of ARLP’s distributions to non-U.S. investors as being attributable to income that is effectively connected with a United States trade or business. In addition, brokers and nominees should treat one hundred percent (100%) of the distribution as being in excess of cumulative net income for purposes of determining the amount to withhold. Accordingly, ARLP’s distributions to non-U.S. investors are subject to federal income tax withholding at a rate equal to the highest applicable effective tax rate plus ten percent (10%). Nominees, and not ARLP, are treated as the withholding agents responsible for withholding on the distributions received by them on behalf of non-U.S. investors.
About Alliance Resource Partners, L.P.
ARLP is a diversified energy company that is the second largest coal producer in the eastern United States. ARLP also generates operating and royalty income from mineral interests it owns in strategic coal and oil & gas producing regions in the United States. In addition, ARLP is positioning itself as an energy provider for the future by leveraging its core technology and operating competencies to make strategic investments in the fast-growing energy and infrastructure transition.
News, unit prices and additional information about ARLP, including filings with the Securities and Exchange Commission (“SEC”), are available at http://www.arlp.com. For more information, contact the investor relations department of ARLP at (918) 295-7674 or via e-mail at [email protected].
Brian L. Cantrell Alliance Resource Partners, L.P. (918) 295-7674
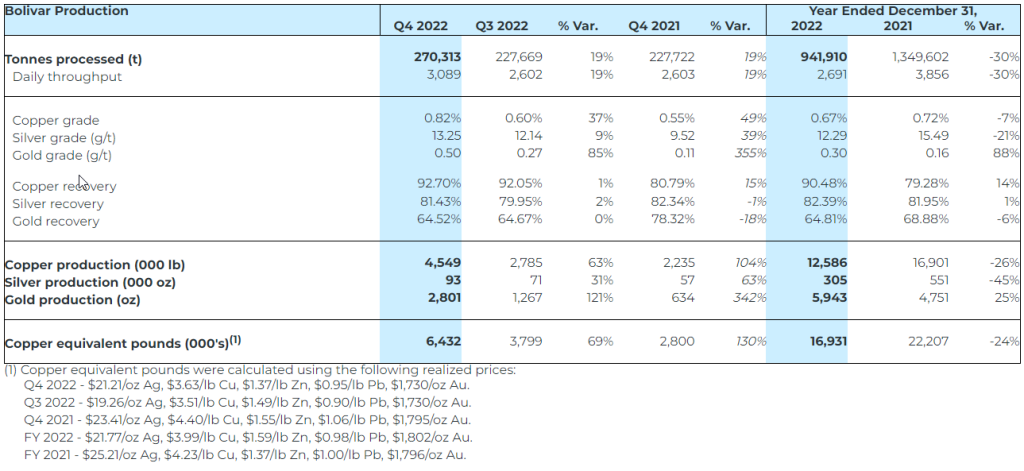
Bolivar’s improved operating performance resulted in a 69% and 130% increase in copper equivalent production over Q3 2022 and Q4 2021, respectively.
A measured and progressive approach to reach full operating capacity at Yauricocha continues, following the mudslide in Q3 2022.
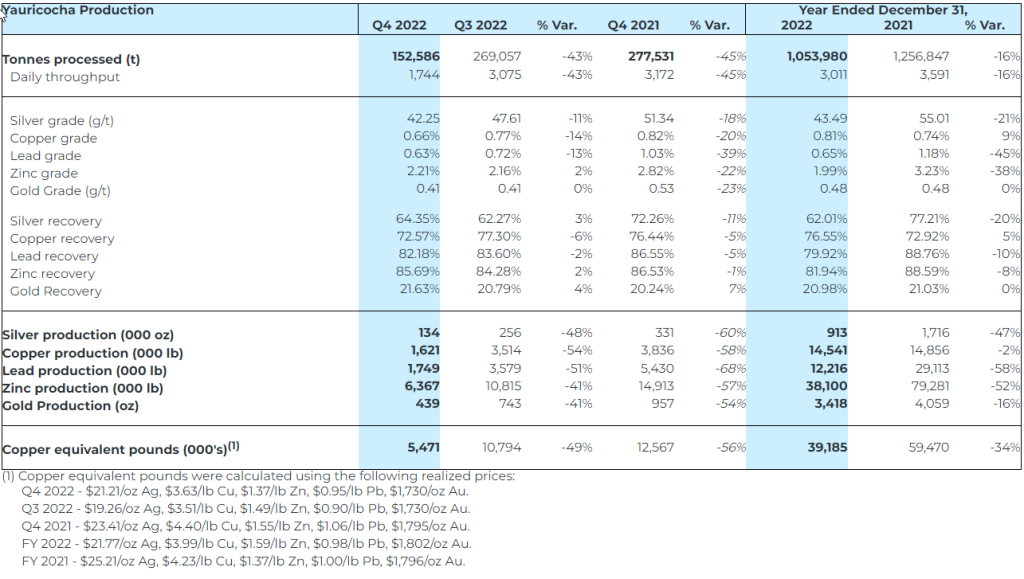
Consolidated 2022 copper equivalent production decreased 29% compared to 2021 due to lower production at Yauricocha resulting from the suspension of mining operations and lower grades across all metals, except for gold.
TORONTO–(BUSINESS WIRE)– Sierra Metals Inc. (TSX: SMT) (“Sierra Metals” or the “Company”) reports fourth quarter and full year 2022 production results. Results are from Sierra Metals’ three underground mines in Latin America: The Yauricocha polymetallic mine in Peru, the copper-producing Bolivar mine and the silver-producing Cusi mine in Mexico.
Truck being loaded at Bolivar Rom Pad headed to Concentrate Plant (Photo: Business Wire)
Ernesto Balarezo, Interim CEO of Sierra Metals, commented on a challenging 2022 for the Company, “Early in the year, Yauricocha’s throughput and grades were hindered by a shortage of mine and service personnel due to the COVID-19 pandemic, as well as permitting restrictions. In the third quarter, production was halted due to the tragic mudslide event followed by a road blockade. The mine’s throughput in Q4 declined by 43% when compared to Q3 and 45% when compared to the same quarter last year. While recovery toward Yauricocha’s full production potential continues, safety remains our highest priority. To lead this initiative, Sierra Metals has hired a Vice President, Health & Safety.
At Bolivar, progress in reducing the significant backlog in drilling and mine development that arose during the pandemic was delayed throughout the first half of the year, due to setbacks encountered during the installation of critical infrastructure. These delays were compounded in Q3 by unexpected flooding, negatively affecting production during most of the quarter. However, the Company achieved meaningfully improved performance during Q4 due to infrastructure upgrades in pumping and ventilation, which created improved conditions required to support the advancement of the mine’s preparation and development. A 19% increase in throughput along with improved head grades in all metals resulted in a 69% increase in copper equivalent pounds produced when compared to Q3 2022. When compared to Q4 2021, throughput increased by 19% and copper equivalent production increased by 130%.
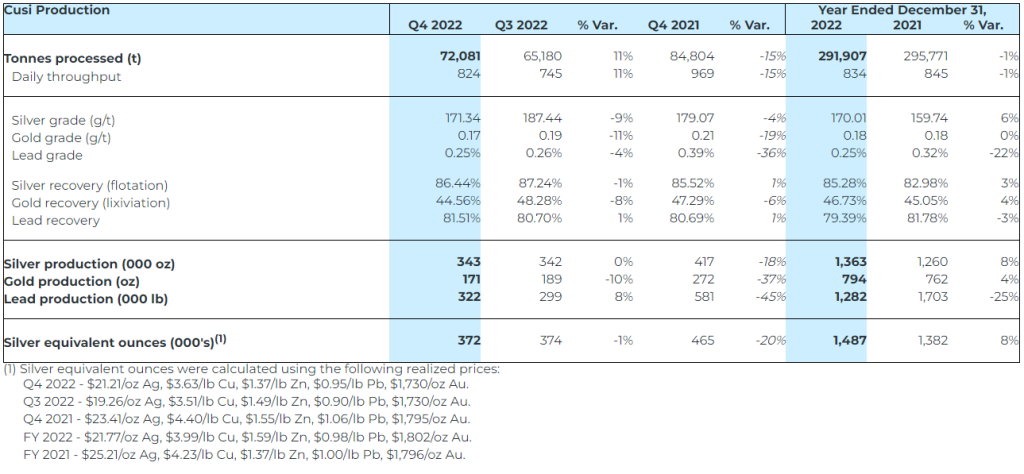
Mr. Balarezo concluded,“I am encouraged by the production improvements during the fourth quarter. Our primary goal in the new year is to ramp up production at Yauricocha, stabilize production at Bolivar and optimize Cusi’s production. We are committed to ensuring operations run safely, efficiently and effectively with efforts to streamline processes and reduce inefficiencies where possible. Consistent with the Company’s efforts, the Special Committee of the Board of Directors is continuing to diligently pursue its strategic review process.”
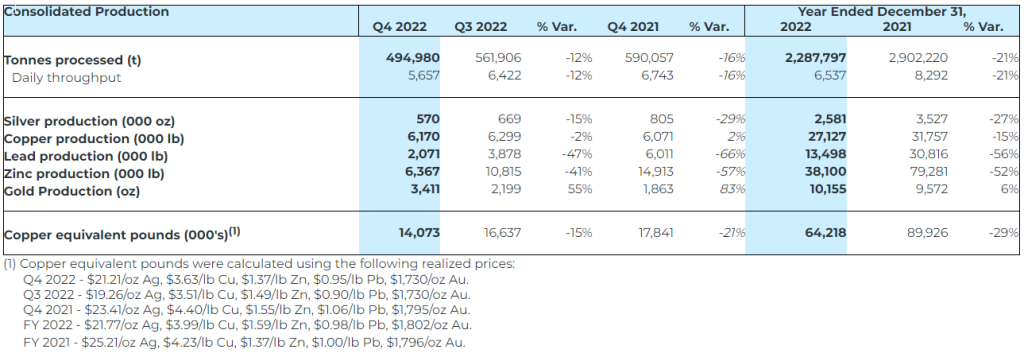
Consolidated Production Results
Consolidated quarterly throughput during Q4 2022 was 494,980 tonnes, a decrease of 12% when compared to Q3 2022, mainly due to the 43% decline in throughput at Yauricocha compared to Q3 2022. As a result, consolidated copper equivalent production also declined by 15% when compared to Q3 2022.
While a 19% increase in throughput during Q4 2022 at the Bolivar Mine, combined with higher grades in all metals, provided a 69% increase in copper equivalent production over the prior quarter, it was not enough to offset the decline in production at Yauricocha. When compared to Q4 2021, a 16% decrease in consolidated throughput resulted in a 21% decrease in consolidated copper equivalent production.
When comparing 2022 to 2021, a 21% decrease in consolidated throughput provided a 29% decrease in copper equivalent pounds produced.
Yauricocha Mine, Peru
Throughput from the Yauricocha Mine during Q4 2022 was 152,586 tonnes, a 43% decline when compared to the previous quarter due to the reduced mining activity following the mudslide incident and the community blockade that led to the suspension of mining operations late in the third quarter. As the progressive restart to operations continues, mining activity was limited to an average daily throughput of 1,744 tonnes during Q4 2022.
When compared to Q4 2021, a 45% decrease in throughput at Yauricocha, combined with lower head grades for all metals, provided for a 56% decrease in copper equivalent pounds produced. Yauricocha’s annual throughput was 1,053,980 tonnes, representing a 16% decrease when compared to the 2021 annual production.
The discovery of the higher-grade Fortuna zone during Q2 2022 was expected to help alleviate the challenges presented by regulatory requirements, which currently limit mineable areas at Yauricocha. However, plans to reap the full benefits of the new zone were delayed, due to the tragic mudslide in September 2022 that significantly limited the mine’s production capacity for the remainder of the year.
Production of all metals declined when compared to full year 2021. While copper grades increased by 9% and gold grades were in-line, compared to 2021, these could not make up for the 16% reduction in throughput and a 21%, 45% and 38% decrease in silver, lead and zinc grades, respectively. Yauricocha’s annual copper equivalent production decreased by 34% when compared to 2021.
A summary of production from the Yauricocha Mine for Q4 and Full Year 2022 is provided below:
Bolivar Mine, Mexico
The Bolivar Mine processed 270,313 tonnes during Q4 2022, a 19% increase compared to Q3 2022. Higher throughput, due to improved ventilation and advancement in the mine’s development and preparation, combined with higher grades in all metals, generated a 69% increase in copper equivalent production when compared to the previous quarter. When compared to Q4 2021, throughput at Bolivar was also 19% higher. A meaningfully improved 92.7% copper recovery rate during the quarter, combined with a substantial improvement in grades for copper, silver and gold, by 49%, 39% and 355%, respectively, resulted in a 130% increase in copper equivalent production, when compared to Q4 2021.
Annual throughput at Bolivar was 941,910 tonnes, representing a 30% decrease when compared to 2021. While the mine’s production showed an improvement during the final quarter of the year, it could not make up for the operational and production issues experienced earlier in the year. Bolivar’s annual copper equivalent production declined by 24% when compared to 2021.
A summary of production for the Bolivar Mine for Q4 and Full Year 2022 is provided below:
Cusi Mine, Mexico
The Cusi Mine processed 72,081 tonnes of ore during Q4 2022, representing an 11% increase over the previous quarter as mining resumed in the area where flooding occurred earlier in the year. The increased throughput helped offset the impact of lower grades and a lower silver and gold recovery rate during the quarter. Silver production remained flat when compared to Q3 2022 with a 1% decline in silver equivalent production.
When compared to Q4 2021, a 15% decrease in throughput, combined with a 4%, 19% and 36% decrease in silver, gold and lead grades, respectively, resulted in a 20% decrease in silver equivalent ounces produced. The decline in throughput and grades during Q4 2022, when compared to the same quarter of 2021, is attributable to the successful mining of higher-grade ore from the NE system during Q4 2021, which was an area of focus prior to the flooding event at Cusi. There was no ore processed from the NE system in Q4 2022.
Annual throughput at Cusi Mine in 2022 was 291,907 tonnes or 1% lower than 2021. In addition to higher silver grades, crushing and grinding improvements at the plant have helped enhance silver and gold recovery, resulting in an 8% increase in silver equivalent production when compared to 2021.
A summary of production for the Cusi Mine for Q4 and Full Year 2022 is provided below:
Strategic Review Process
The Company announced, on October 18, 2022, the formation of a Special Committee and the initiation of a strategic review process. The mandate of the Special Committee, comprised of its independent directors, includes exploring, reviewing and considering options to optimize the operations of the Company and possible financing, restructuring and strategic options in the best interests of the Company. The Special Committee continues to diligently execute this process with financial advisors led by CIBC Capital Markets.
Quality Control
Américo Zuzunaga, FAusIMM (Mining Engineer) is a Qualified Person under National Instrument 43-101 – Standards of Disclosure for Mineral Projects.
About Sierra Metals
Sierra Metals Inc. is a diversified Canadian mining company with Green Metal exposure including copper production and base metal production with precious metals byproduct credits, focused on the production and development of its Yauricocha Mine in Peru, and Bolivar and Cusi Mines in Mexico. The Company is focused on increasing production volume and growing mineral resources. The Company also has large land packages at all three mines with several prospective regional targets providing longer-term exploration upside and mineral resource growth potential.
This press release contains forward-looking information within the meaning of Canadian securities legislation. Forward-looking information relates to future events or the anticipated performance of Sierra and reflect management’s expectations or beliefs regarding such future events and anticipated performance based on an assumed set of economic conditions and courses of action. In certain cases, statements that contain forward-looking information can be identified by the use of words such as “plans”, “expects”, “is expected”, “budget”, “scheduled”, “estimates”, “forecasts”, “intends”, “anticipates”, “believes” or variations of such words and phrases or statements that certain actions, events or results “may”, “could”, “would”, “might”, or “will be taken”, “occur” or “be achieved” or the negative of these words or comparable terminology. By its very nature forward-looking information involves known and unknown risks, uncertainties and other factors that may cause actual performance of Sierra to be materially different from any anticipated performance expressed or implied by such forward-looking information.
Forward-looking information is subject to a variety of risks and uncertainties, which could cause actual events or results to differ from those reflected in the forward-looking information, including, without limitation, the risks described under the heading “Risk Factors” in the Company’s annual information form dated March 16, 2022 for its fiscal year ended December 31, 2021 and other risks identified in the Company’s filings with Canadian securities regulators, which are available at www.sedar.com.
The risk factors referred to above are not an exhaustive list of the factors that may affect any of the Company’s forward-looking information. Forward-looking information includes statements about the future and is inherently uncertain, and the Company’s actual achievements or other future events or conditions may differ materially from those reflected in the forward-looking information due to a variety of risks, uncertainties and other factors. The Company’s statements containing forward-looking information are based on the beliefs, expectations, and opinions of management on the date the statements are made, and the Company does not assume any obligation to update such forward-looking information if circumstances or management’s beliefs, expectations or opinions should change, other than as required by applicable law. For the reasons set forth above, one should not place undue reliance on forward-looking information.
Investor Relations Sierra Metals Inc. Tel: +1 (416) 366-7777 Email: [email protected]
Oral Presentation Describes Activity of Wnt/β-catenin Signaling Pathway Inhibitors Against SARS-CoV-2 in Cell Culture and in an Animal Model
CHATHAM, N.J., Jan. 26, 2023 (GLOBE NEWSWIRE) — Tonix Pharmaceuticals Holding Corp. (Nasdaq: TNXP) (Tonix or the Company), a clinical-stage biopharmaceutical company, today announced that Tom Hobman, Ph.D., Professor of Cell Biology, University of Alberta, presented data from his laboratory at The University of Alberta during a presentation at the 2nd Wnt & β-catenin Targeted Drug Development Conference held in Boston, Mass., on January 26, 2023. The oral presentation titled, “Targeting the Wnt/β -catenin pathway as a broad-spectrum antiviral strategy,” includes research sponsored by Tonix Pharmaceuticals focused on the development and testing of Wnt/β-catenin signaling pathway inhibitors as broad-spectrum antivirals against SARS-CoV-2 and other emerging viruses. Tonix has previously announced that it exercised an option to license the antiviral technology platform. A copy of the presentation is available on the Tonix Pharmaceuticals corporate website at www.tonixpharma.com.
“Antiviral therapeutics are needed to mitigate the effects of SARS-CoV-2 and future coronavirus outbreaks, and Professor Hobman’s work is designed to facilitate the identification and testing of novel broad-spectrum antiviral drugs,” said Seth Lederman, M.D., Chief Executive Officer of Tonix Pharmaceuticals. “Professor Hobman presented data showing that inhibition of Wnt/β-catenin pathway induces peroxisomes and enhances interferon response during viral infection, significantly reducing SARS-CoV-2 replication in vitro and in vivo.”
“For future pandemics, the scientific community must be ready with an arsenal of easily self-administered drugs that can be tested in rapid, efficient clinical trials immediately after the causative viral agent is identified,” said Professor Tom Hobman. “The research collaboration between Tonix and The University of Alberta is focused on the development and testing of Wnt/β-catenin signaling pathway inhibitors as broad-spectrum antivirals against SARS-CoV-2 and other emerging viruses.”
Tonix Pharmaceuticals Holding Corp.*
Tonix is a clinical-stage biopharmaceutical company focused on discovering, licensing, acquiring and developing therapeutics to treat and prevent human disease and alleviate suffering. Tonix’s portfolio is composed of central nervous system (CNS), rare disease, immunology and infectious disease product candidates. Tonix’s CNS portfolio includes both small molecules and biologics to treat pain, neurologic, psychiatric and addiction conditions. Tonix’s lead CNS candidate, TNX-102 SL (cyclobenzaprine HCl sublingual tablet), is in mid-Phase 3 development for the management of fibromyalgia with a new Phase 3 study launched in the second quarter of 2022 and interim data expected in the second quarter of 2023. TNX-102 SL is also being developed to treat Long COVID, a chronic post-acute COVID-19 condition. Tonix initiated a Phase 2 study in Long COVID in the third quarter of 2022 and expects interim data in the third quarter of 2023. TNX-1300 (cocaine esterase) is a biologic designed to treat cocaine intoxication and has been granted Breakthrough Therapy designation by the FDA. A Phase 2 study of TNX-1300 is expected to be initiated in the first quarter of 2023. TNX-1900 (intranasal potentiated oxytocin), a small molecule in development for chronic migraine, is expected to enter the clinic with a Phase 2 study in the first quarter of 2023. TNX-601 ER (tianeptine hemioxalate extended-release tablets) is a once-daily formulation of tianeptine being developed as a potential treatment for major depressive disorder (MDD) with a Phase 2 study expected to be initiated in the first quarter of 2023. Tonix’s rare disease portfolio includes TNX-2900 (intranasal potentiated oxytocin) for the treatment of Prader-Willi syndrome. TNX-2900 has been granted Orphan Drug designation by the FDA. Tonix’s immunology portfolio includes biologics to address organ transplant rejection, autoimmunity and cancer, including TNX-1500, which is a humanized monoclonal antibody targeting CD40-ligand (CD40L or CD154) being developed for the prevention of allograft and xenograft rejection and for the treatment of autoimmune diseases. A Phase 1 study of TNX-1500 is expected to be initiated in the first half of 2023. Tonix’s infectious disease pipeline includes a vaccine in development to prevent smallpox and monkeypox, TNX-801, a next-generation vaccine to prevent COVID-19, TNX-1850, a platform to make fully human monoclonal antibodies to treat COVID-19, TNX-3600, and humanized anti-SARS-CoV-2 monoclonal antibodies, TNX-3800, recently licensed from Curia. TNX-801, Tonix’s vaccine in development to prevent smallpox and monkeypox, also serves as the live virus vaccine platform or recombinant pox vaccine (RPV) platform for other infectious diseases. A Phase 1 study of TNX-801 is expected to be initiated in Kenya in the second half of 2023.
*All of Tonix’s product candidates are investigational new drugs or biologics and have not been approved for any indication.
This press release and further information about Tonix can be found at www.tonixpharma.com.
Forward Looking Statements
Certain statements in this press release are forward-looking within the meaning of the Private Securities Litigation Reform Act of 1995. These statements may be identified by the use of forward-looking words such as “anticipate,” “believe,” “forecast,” “estimate,” “expect,” and “intend,” among others. These forward-looking statements are based on Tonix’s current expectations and actual results could differ materially. There are a number of factors that could cause actual events to differ materially from those indicated by such forward-looking statements. These factors include, but are not limited to, risks related to the failure to obtain FDA clearances or approvals and noncompliance with FDA regulations; delays and uncertainties caused by the global COVID-19 pandemic; risks related to the timing and progress of clinical development of our product candidates; our need for additional financing; uncertainties of patent protection and litigation; uncertainties of government or third party payor reimbursement; limited research and development efforts and dependence upon third parties; and substantial competition. As with any pharmaceutical under development, there are significant risks in the development, regulatory approval and commercialization of new products. Tonix does not undertake an obligation to update or revise any forward-looking statement. Investors should read the risk factors set forth in the Annual Report on Form 10-K for the year ended December 31, 2021, as filed with the Securities and Exchange Commission (the “SEC”) on March 14, 2022, and periodic reports filed with the SEC on or after the date thereof. All of Tonix’s forward-looking statements are expressly qualified by all such risk factors and other cautionary statements. The information set forth herein speaks only as of the date thereof.
Technology Unlocks Massive New Feedstock Model to Rapidly Neutralize America’s Transportation Emissions
VIRGINIA CITY, NEVADA, JANUARY 26, 2023 – Comstock Inc. (NYSE: LODE) (“Comstock” and the “Company”) today announced the award by the U.S. Department of Energy (“DOE”) of Comstock’s $2,000,000 grant application to build a pre-pilot scale system to demonstrate one of Comstock’s unique new pathways to produce renewable diesel, sustainable aviation fuel, gasoline, and marine fuel from forestry residues and other forms of lignocellulosic biomass at dramatically improved yield, efficiency and cost in comparison to known methods.
Comstock’s technologies efficiently crack wood into a purified Cellulosic Sugar and a unique “Bioleum” hydrocarbon mixture with about 75% of the energy content of fossil crude. Together, the two streams provide the basis for an entirely new renewable fuel feedstock model with best-in-class conversion yields, efficiencies, and costs.
Cellulosic Sugar and Bioleum can be used in multiple renewable fuel production pathways, however, the DOE’s grant award is based on a unique new pathway involving fermentation of Cellulosic Sugar into lipids, reacting the lipids with Bioleum to produce a single homogenous feedstock, and converting the homogenous feedstock into drop-in renewable fuels at extraordinary yields exceeding 80 gallons per dry ton of feedstock on a gasoline gallon equivalent basis (“GGE”).
Comstock has assembled a world-class team of collaborators, including Haldor Topsoe Holding A/S, Marathon Petroleum Company LP, Novozymes A/S, Xylome Corporation, RenFuel K2B AB, Emerging Fuels Technology Inc., the University of Nevada Reno, the University of Minnesota Duluth’s Natural Resources Research Institute, and the State University of New York’s College of Environmental Science and Forestry.
“Comstock is enabling an extremely valuable new “soil to oil” ecosystem based on the sustainable growth and monetization of a massive, widely available, highly scalable, and rapidly replenishable new feedstock source for renewable fuels,” said Corrado De Gasperis, Comstock’s Executive Chairman and Chief Executive Officer. “That ecosystem will leverage existing infrastructure to neutralize mobility emissions, create thousands of high-quality jobs, invigorate America’s rural communities, and advance the Biden Administration’s 2050 objectives.”
“This is a remarkable opportunity to work with an extraordinary team of collaborators to demonstrate that the U.S. can sustain an immensely profitable new net zero balance between the Earth’s living systems and mobility emissions,” De Gasperis continued, “We are grateful for the DOE’s recognition of our technology and the strong support of renewable fuels from our Nevada representatives U.S. Senators Catherine Cortez Masto and Jacky Rosen and U.S. Congressman Mark Amodei.”
“Nevada is a hotspot for clean energy, and the federal funding I secured will help bring another innovative biofuel producer online in northern Nevada,” said Senator Cortez Masto. “I’ll continue to work to support Nevada’s position as a leader in clean-energy industries that are creating good-paying jobs and growing our state’s economy.”
“As a renewable energy source, biofuels are a critical part of our efforts to grow and strengthen our clean energy economy,” said Senator Rosen. “I’m proud to have helped secure this funding to incentivize more biofuel manufacturing in our state, which will help lower prices, improve our environment, and create more jobs in northern Nevada.”
“Congrats to Comstock and their team. Nice to see their hard work rewarded,” said Congressman Amodei.
About Comstock Inc.
Comstock (NYSE: LODE) innovates technologies that contribute to decarbonization and circularity by efficiently converting under-utilized natural resources into renewable energy products that contribute to balancing global uses and emissions of carbon. To learn more, please visit www.comstock.inc.
Forward-Looking Statements
This press release and any related calls or discussions may include forward-looking statements within the meaning of Section 27A of the Securities Act of 1933, as amended, and Section 21E of the Securities Exchange Act of 1934, as amended. All statements, other than statements of historical facts, are forward-looking statements. The words “believe,” “expect,” “anticipate,” “estimate,” “project,” “plan,” “should,” “intend,” “may,” “will,” “would,” “potential” and similar expressions identify forward-looking statements but are not the exclusive means of doing so. Forward-looking statements include statements about matters such as: future industry market conditions; future explorations or acquisitions; future changes in our exploration activities; future prices and sales of, and demand for, our products; land entitlements and uses; permits; production capacity and operations; operating and overhead costs; future capital expenditures and their impact on us; operational and management changes (including changes in the Board of Directors); changes in business strategies, planning and tactics; future employment and contributions of personnel, including consultants; future land sales; investments, acquisitions, joint ventures, strategic alliances, business combinations, operational, tax, financial and restructuring initiatives, including the nature, timing and accounting for restructuring charges, derivative assets and liabilities and the impact thereof; contingencies; litigation, administrative or arbitration proceedings; environmental compliance and changes in the regulatory environment; offerings, limitations on sales or offering of equity or debt securities, including asset sales and associated costs; and future working capital, costs, revenues, business opportunities, debt levels, cash flows, margins, taxes, earnings and growth. These statements are based on assumptions and assessments made by our management considering their experience and their perception of historical and current trends, current conditions, possible future developments, and other factors they believe to be appropriate. Forward-looking statements are not guarantees, representations or warranties and are subject to risks and uncertainties, many of which are unforeseeable and beyond our control and could cause actual results, developments, and business decisions to differ materially from those contemplated by such forward-looking statements. Some of those risks and uncertainties include the risk factors set forth in our filings with the SEC and the following: adverse effects of climate changes or natural disasters; adverse effects of global or regional pandemic disease spread or other crises; global economic and capital market uncertainties; the speculative nature of gold or mineral exploration, mercury remediation and lithium, nickel and cobalt recycling, including risks of diminishing quantities or grades of qualified resources; operational or technical difficulties in connection with exploration or mercury remediation, metal recycling, processing or mining activities; costs, hazards and uncertainties associated with precious metal based activities, including environmentally friendly and economically enhancing clean mining and processing technologies, precious metal exploration, resource development, economic feasibility assessment and cash generating mineral production; costs, hazards and uncertainties associated with mercury remediation, metal recycling, processing or mining activities; contests over our title to properties; potential dilution to our stockholders from our stock issuances, recapitalization and balance sheet restructuring activities; potential inability to comply with applicable government regulations or law; adoption of or changes in legislation or regulations adversely affecting our businesses; permitting constraints or delays; ability to achieve the benefits of business opportunities that may be presented to, or pursued by, us, including those involving battery technology, mercury remediation technology and efficacy, quantum computing and advanced materials development, and development of cellulosic technology in bio-fuels and related carbon-based material production; ability to successfully identify, finance, complete and integrate acquisitions, joint ventures, strategic alliances, business combinations, asset sales, and investments that we may be party to in the future; changes in the United States or other monetary or fiscal policies or regulations; interruptions in our production capabilities due to capital constraints; equipment failures; fluctuation of prices for gold or certain other commodities (such as silver, zinc, lithium, nickel, cobalt, cyanide, water, diesel, gasoline and alternative fuels and electricity); changes in generally accepted accounting principles; adverse effects of war, mass shooting, terrorism and geopolitical events; potential inability to implement our business strategies; potential inability to grow revenues; potential inability to attract and retain key personnel; interruptions in delivery of critical supplies, equipment and raw materials due to credit or other limitations imposed by vendors; assertion of claims, lawsuits and proceedings against us; potential inability to satisfy debt and lease obligations; potential inability to maintain an effective system of internal controls over financial reporting; potential inability or failure to timely file periodic reports with the Securities and Exchange Commission; potential inability to list our securities on any securities exchange or market or maintain the listing of our securities; and work stoppages or other labor difficulties. Occurrence of such events or circumstances could have a material adverse effect on our business, financial condition, results of operations or cash flows, or the market price of our securities. All subsequent written and oral forward-looking statements by or attributable to us or persons acting on our behalf are expressly qualified in their entirety by these factors. Except as may be required by securities or other law, we undertake no obligation to publicly update or revise any forward-looking statements, whether because of new information, future events, or otherwise.
Neither this press release nor any related calls or discussions constitutes an offer to sell, the solicitation of an offer to buy or a recommendation with respect to any securities of the Company, the fund, or any other issuer.
Comstock Cellulosic Fuels business development contact information:
David Winsness President, Comstock Fuels Tel (775) 847-3040 [email protected]
Chad Michael Black Director, Business Development Tel (775) 847-3060 [email protected]
Contact information: Comstock Inc. P.O. Box 1118 Virginia City, NV 89440 www.comstockinc.com
Corrado De Gasperis Executive Chairman & CEO Tel (775) 847-4755 [email protected]
Zach Spencer Director of External Relations Tel (775) 847-5272 Ext.151 [email protected]
FLORHAM PARK, N.J., Jan. 26, 2023 (GLOBE NEWSWIRE) — PDS Biotechnology Corporation (Nasdaq: PDSB), a clinical-stage immunotherapy company developing a growing pipeline of targeted immunotherapies for cancer and infectious disease, today announced its participation in the Channelchek Takeaway Series from the J.P. Morgan Healthcare Conference to be broadcast Thursday, January 26, starting at 10:00 a.m., EST. The event will include an overview of PDS Biotech’s business and clinical development strategy from Frank K. Bedu-Addo, Ph.D., President and CEO, followed by a question and answer session with Noble Capital Markets’ Senior Analyst Robert LeBoyer.
The J.P. Morgan Healthcare Conference is considered to be the most important healthcare investment symposium in the industry, connecting global industry leaders, emerging fast-growth companies, innovative technology creators, and members of the investment community. Noble Capital Markets’ equity analysts and investment bankers attended the conference and sat down with various c-suite executives. For the Channelchek Takeaway Series, Noble’s analysts are unpacking what they learned at the conference and talking to a selection of c-suite executives in the healthcare space.
The event will be broadcast starting at 10:00 a.m., EST on Thursday, January 26. Investors can attend the Channelchek Takeaway Series virtually at no cost. Registration details are available on Channelchek.
About PDS Biotechnology
PDS Biotech is a clinical-stage immunotherapy company developing a growing pipeline of targeted cancer and infectious disease immunotherapies based on our proprietary Versamune®, PDS0301, and Infectimune™ T cell-activating platforms. We believe our targeted Versamune® and PDS0301 based candidates have the potential to overcome the limitations of current immunotherapy approaches through the activation of the right type, quantity and potency of T cells. To date, our lead Versamune® clinical candidate, PDS0101, has demonstrated the ability to reduce tumors and stabilize disease in combination with approved and investigational therapeutics in patients with a broad range of HPV16-associated cancers in multiple Phase 2 clinical trials. Our Infectimune™ based vaccines have also demonstrated the potential to induce not only robust and durable neutralizing antibody responses, but also powerful T cell responses, including long-lasting memory T cell responses in pre-clinical studies to date. To learn more, please visit www.pdsbiotech.com or follow us on Twitter at @PDSBiotech.
Forward Looking Statements
This communication contains forward-looking statements (including within the meaning of Section 21E of the United States Securities Exchange Act of 1934, as amended, and Section 27A of the United States Securities Act of 1933, as amended) concerning PDS Biotechnology Corporation (the “Company”) and other matters. These statements may discuss goals, intentions and expectations as to future plans, trends, events, results of operations or financial condition, or otherwise, based on current beliefs of the Company’s management, as well as assumptions made by, and information currently available to, management. Forward-looking statements generally include statements that are predictive in nature and depend upon or refer to future events or conditions, and include words such as “may,” “will,” “should,” “would,” “expect,” “anticipate,” “plan,” “likely,” “believe,” “estimate,” “project,” “intend,” “forecast,” “guidance,” “outlook” and other similar expressions among others. Forward-looking statements are based on current beliefs and assumptions that are subject to risks and uncertainties and are not guarantees of future performance. Actual results could differ materially from those contained in any forward-looking statement as a result of various factors, including, without limitation: the Company’s ability to protect its intellectual property rights; the Company’s anticipated capital requirements, including the Company’s anticipated cash runway and the Company’s current expectations regarding its plans for future equity financings; the Company’s dependence on additional financing to fund its operations and complete the development and commercialization of its product candidates, and the risks that raising such additional capital may restrict the Company’s operations or require the Company to relinquish rights to the Company’s technologies or product candidates; the Company’s limited operating history in the Company’s current line of business, which makes it difficult to evaluate the Company’s prospects, the Company’s business plan or the likelihood of the Company’s successful implementation of such business plan; the timing for the Company or its partners to initiate the planned clinical trials for PDS0101, PDS0203 and other Versamune® and Infectimune™ based product candidates; the future success of such trials; the successful implementation of the Company’s research and development programs and collaborations, including any collaboration studies concerning PDS0101, PDS0203 and other Versamune® and Infectimune™ based product candidates and the Company’s interpretation of the results and findings of such programs and collaborations and whether such results are sufficient to support the future success of the Company’s product candidates; the success, timing and cost of the Company’s ongoing clinical trials and anticipated clinical trials for the Company’s current product candidates, including statements regarding the timing of initiation, pace of enrollment and completion of the trials (including the Company’s ability to fully fund its disclosed clinical trials, which assumes no material changes to our currently projected expenses), futility analyses, presentations at conferences and data reported in an abstract, and receipt of interim or preliminary results (including, without limitation, any preclinical results or data), which are not necessarily indicative of the final results of the Company’s ongoing clinical trials; any Company statements about its understanding of product candidates mechanisms of action and interpretation of preclinical and early clinical results from its clinical development programs and any collaboration studies; and other factors, including legislative, regulatory, political and economic developments not within the Company’s control, including unforeseen circumstances or other disruptions to normal business operations arising from or related to COVID-19. The foregoing review of important factors that could cause actual events to differ from expectations should not be construed as exhaustive and should be read in conjunction with statements that are included herein and elsewhere, including the risk factors included in the Company’s annual and periodic reports filed with the SEC. The forward-looking statements are made only as of the date of this press release and, except as required by applicable law, the Company undertakes no obligation to revise or update any forward-looking statement, or to make any other forward-looking statements, whether as a result of new information, future events or otherwise.
Versamune® is a registered trademark and Infectimune™ is a trademark of PDS Biotechnology.