WESTON, Fla., Jan. 03, 2024 (GLOBE NEWSWIRE) — ZyVersa Therapeutics, Inc. (Nasdaq: ZVSA; “ZyVersa”), a clinical stage specialty biopharmaceutical company developing first-in-class drugs for treatment of patients with renal and inflammatory diseases who have unmet medical needs, announces that Stephen C. Glover, Co-Founder, Chairman, Chief Executive Officer, and President, has issued a Letter to Shareholders providing a corporate outlook with anticipated milestones for 2024. The full text of the letter follows.
A MESSAGE FROM OUR PRESIDENT AND CHIEF EXECUTIVE OFFICER
To my fellow shareholders,
Like so many in the biotech and pharmaceutical industry, we are looking forward to 2024 with great optimism for improved conditions in the financial markets and a milestone-rich year in the development of our lead renal and anti-inflammatory therapeutic candidates, which is expected to drive value for our shareholders. Our renal and inflammatory disease pipelines each have potential to address multiple indications. Combined, our two proprietary product platforms target a global total addressable market of around $75 billion.
On the financial front, various market watchers are seeing signals that the biotech and pharma investment environment is set to trend positively in 2024. Capital is again starting to flow to companies that are seeking to innovate through differentiated technologies or novel mechanisms of action. Near the end of 2023, we began to witness an increase in financings and an uptick in M&A across multiple sectors from inflammatory diseases to oncology. These were driven by investors targeting high upside opportunities and large pharma seeking to re-energize their product pipelines. Our team at ZyVersa shares this optimism, anticipating improved conditions as we focus our efforts on developing innovative, disease-modifying treatments to help improve patients’ quality of life.
We are looking forward to an active first quarter of this new year, including initiation of our first clinical trial for our Cholesterol Efflux MediatorTM VAR 200. VAR 200 is designed to ameliorate renal lipid accumulation that damages the kidney’s filtration system. Currently there are no approved treatments that target lipid accumulation, which is known to contribute to structural damage, proteinuria, and progression of kidney disease. The current standard of care addresses glomerular hypertension and inflammation.
We are on schedule to initiate our Phase 2a clinical trial with VAR 200 in patients with diabetic kidney disease (DKD) in the first quarter of 2024. This will be an open label trial for real-time data reads. Initial data is anticipated to be available mid-year. DKD represents a significant area of unmet need, as it is the leading cause of end-stage kidney disease, requiring dialysis or kidney transplant for survival. Although substantial progress has been made in slowing progression of DKD with introduction of ACE inhibitors, ARBs, and most recently SGLT2 inhibitors, patients are still progressing to end-stage renal disease. We are optimistic that the protection against kidney injury, fibrosis, and disease progression that was demonstrated with VAR 200 in animal models of three different kidney diseases will translate to humans. Data from our initial Phase 2a trial will not only provide proof-of-concept for VAR 200 in renal patients, it will also provide valuable insights for designing future trials with VAR 200 in other planned renal indications, including two rare kidney diseases, focal segmental glomerulosclerosis (FSGS) and Alport syndrome.
We are equally excited about our progress in the development of our proprietary Inflammasome ASC Inhibitor IC 100, which is designed to block initiation and perpetuation of damaging inflammation that contributes to a multitude of inflammatory diseases. A growing body of scientific literature reinforces the central role of multiple types of inflammasomes in the development and progression of inflammatory diseases, and we continue to report on these developments as they are published. By inhibiting Inflammasome ASC rather than a sensor molecule such as NLRP3, IC 100 targets multiple types of inflammasome pathways (including NLRP3, NLRP1, and AIM2), which is expected to provide better control of damaging inflammation and its perpetuation.
The IC 100 preclinical program is nearing completion and IND submission is planned for the fourth quarter of 2024, with Phase 1 trial initiation expected shortly thereafter.
Two Platforms, Singular Vision
We view 2024 as a potentially transformative year for ZyVersa based on the value-building milestones that we expect to achieve over the next 12 to 15 months. I look forward to working with my leadership team and fellow Board members to execute a business and clinical strategy that has potential to position ZyVersa as a leading and innovative company developing transformative drugs for underserved patients with renal and inflammasome-mediated inflammatory diseases.
Though our platforms are independent from each other, our mission is singular – to develop drug therapies that can restore health and improve quality of life for patients living with the often debilitating symptoms of renal and inflammatory diseases. We look forward to embarking on what we believe will be a productive 2024. We thank you for your continued support.
Sincerely, Stephen C. Glover Co-Founder, Chairman, Chief Executive Officer, and President ZyVersa Therapeutics
About ZyVersa Therapeutics, Inc.
ZyVersa is a clinical stage specialty biopharmaceutical company leveraging advanced, proprietary technologies to develop first-in-class drugs. Our focus is on patients with renal or inflammatory diseases who have significant unmet medical needs. Our development pipeline includes phase clinical stage Cholesterol Efflux MediatorTM VAR 200 in development to alleviate damaging accumulation of cholesterol and lipids in the filtering system of the kidneys. The lead indication is treatment of rare kidney disease, focal segmental glomerulosclerosis. VAR 200 has potential to treat other kidney diseases, including Alport syndrome and diabetic kidney disease. ZyVersa’s pipeline also includes proprietary inflammasome ASC inhibitor IC 100 that blocks initiation and perpetuation of damaging inflammation associated with a multitude of inflammatory diseases. IC 100 has potential to treat many different CNS and other inflammatory diseases. For more information, please visit www.zyversa.com.
Certain statements contained in this press release regarding matters that are not historical facts, are forward-looking statements within the meaning of Section 21E of the Securities Exchange Act of 1934, as amended, and the Private Securities Litigation Reform Act of 1995. These include statements regarding management’s intentions, plans, beliefs, expectations, or forecasts for the future, and, therefore, you are cautioned not to place undue reliance on them. No forward-looking statement can be guaranteed, and actual results may differ materially from those projected. ZyVersa Therapeutics, Inc (“ZyVersa”) uses words such as “anticipates,” “believes,” “plans,” “expects,” “projects,” “future,” “intends,” “may,” “will,” “should,” “could,” “estimates,” “predicts,” “potential,” “continue,” “guidance,” and similar expressions to identify these forward-looking statements that are intended to be covered by the safe-harbor provisions. Such forward-looking statements are based on ZyVersa’s expectations and involve risks and uncertainties; consequently, actual results may differ materially from those expressed or implied in the statements due to a number of factors, including ZyVersa’s plans to develop and commercialize its product candidates, the timing of initiation of ZyVersa’s planned preclinical and clinical trials; the timing of the availability of data from ZyVersa’s preclinical and clinical trials; the timing of any planned investigational new drug application or new drug application; ZyVersa’s plans to research, develop, and commercialize its current and future product candidates; the clinical utility, potential benefits and market acceptance of ZyVersa’s product candidates; ZyVersa’s commercialization, marketing and manufacturing capabilities and strategy; ZyVersa’s ability to protect its intellectual property position; and ZyVersa’s estimates regarding future revenue, expenses, capital requirements and need for additional financing. A discussion of these and other factors, including risks and uncertainties with respect to ZyVersa, is set forth in ZyVersa’s filings with the Securities and Exchange Commission, including ZyVersa’s Annual Report on Form 10-K and its Quarterly Reports on Form 10-Q.
New factors emerge from time-to-time, and it is not possible for ZyVersa to predict all such factors, nor can ZyVersa assess the impact of each such factor on the business or the extent to which any factor, or combination of factors, may cause actual results to differ materially from those contained in any forward-looking statements. Forward-looking statements included in this press release are based on information available to ZyVersa as of the date of this press release. ZyVersa disclaims any obligation to update such forward-looking statements to reflect events or circumstances after the date of this press release, except as required by applicable law.
Corporate and IR Contact Karen Cashmere Chief Commercial Officer [email protected] 786-251-9641
After relocating its Headquarters to Massachusetts, the 100-year-old public company is optimizing its growth strategy with operational and leadership advancements
CHELMSFORD, MA / ACCESSWIRE / January 3, 2024 /Harte Hanks, Inc. (NASDAQ:HHS), a global sales, marketing, and customer experience company with 3,000 employees in 10 offices worldwide, announced this week the addition of corporate advertising leader Elizabeth Ross to the Board of Directors, effective January 2, 2024. Ross’s appointment to the Board is a well-planned part of Harte Hanks’ exciting growth-phase strategy, launched in 2023 with the company’s 100-year anniversary and appointment of industry-veteran Kirk Davis as the new CEO.
As the current CEO of Shift Paradigm, a leading growth and technology business partner, Elizabeth Ross brings decades of agency experience in B2B and B2C marketing. She is a growth-focused executive with expertise creating concepts and driving value for some of the world’s biggest brands, including Target, United Health, PepsiCo, Walmart, and Microsoft.
“In building our Board, we knew we wanted a strategic and creative thinker with a track record of driving growth and value. Elizabeth Ross is an excellent fit for us. Harte Hanks is a customer company-we help our clients better understand, attract, and engage their customers. Elizabeth brings a tremendous amount of real market knowledge and experience to this customer-facing domain. We are very pleased to welcome her to Harte Hanks,” said Jack Griffin, Chairman of the Board of Directors.
“I’ve spent a lot of my career at the intersection of technology, people, and insights, and Harte Hanks is a dynamic company innovating in this space on a global scale,” says Elizabeth Ross. “I’m honored and excited to join the Board. Harte Hanks is very well positioned to build on its impressive base of services. In my many conversations with Kirk [Davis] and the Board, it’s clear we share a growth and development mindset and a vision of capitalizing on advancements in technology to personalize and improve business services and transactions.”
“Elizabeth’s deep experience in formulating marketing strategy, applying technology to business, expanding client relationships and leading agencies adds immediate strategic value to our plans for 2024,” says Kirk Davis, CEO. “Technology-driven agency services are a segment of the Harte Hanks portfolio we plan to grow in 2024-2025, so her insight and background will be an important asset to us.”
Founded in 1923, Harte Hanks is a leading global customer experience company that partners with clients to provide CX strategy, data-driven analytics and actionable insights combined with seamless program execution for optimized customer engagement. Harte Hanks drives measurable results in both sales and customer loyalty for an ever-growing list of blue-chip companies and their brands including HBOMax, GlaxoSmithKline, Unilever, Pfizer, Volvo, Ford, FedEx, Blue Cross/Blue Shield, Sony, IBM, and more.
For More Information, please contact: Robert Wyman [email protected] 978-265-8919
Sharpens its focus on higher margin, higher growth global managed service provider (MSP) and recruitment process outsourcing (RPO), and North American specialty outcome-based and staffing services
Accelerates transformation to deliver significantly improved net margin
Cash proceeds to be redeployed in pursuit of growth through organic and inorganic investments
TROY, Mich., Jan. 03, 2024 (GLOBE NEWSWIRE) — Kelly (Nasdaq: KELYA, KELYB), a leading global specialty talent solutions provider, today announced it has completed the sale of its European staffing business to Gi Group Holdings S.P.A. (“Gi”). Kelly previously announced on November 2, 2023, that it had entered into a definitive agreement to sell the business to Gi.
“Today is a significant milestone in Kelly’s journey to become a more focused enterprise positioned to accelerate profitable growth,” said Peter Quigley, president and chief executive officer. “By further streamlining the company’s operating model to focus on higher margin, higher growth business and unlocking significant capital, we have greater flexibility and capacity to invest where we can compete and win over the long term.”
Kelly received cash proceeds of €100 million upon closing the transaction. Additional proceeds from an earnout provision based on a multiple of an adjusted 2023 EBITDA measure would be payable in the second quarter of 2024 if achieved.
With the sale of Kelly’s European staffing business, the company’s operating model comprises four reportable segments focused on global MSP and RPO solutions, and North American specialty outcome-based and staffing services. The segments include Professional & Industrial; Science, Engineering & Technology; Education; and Outsourcing & Consulting Group. The company retains its MSP, RPO, and functional service provider business, maintaining a global capability in these businesses in the North America, Asia Pacific, and Europe, Middle East, and Africa regions.
The sale also accelerates the company’s efforts to significantly improve its EBITDA margin through its ongoing business transformation initiative, contributing approximately 30 basis points of favorable impact on a pro forma, full year 2023 basis. By combining this impact with the benefit of a full year of expected transformation-related savings and current top-line expectations, the company would expect to achieve a normalized, adjusted EBITDA margin in the range of 3.3% to 3.5%.
DLA Piper served as legal counsel to Kelly.
About Kelly®
Kelly Services, Inc. (Nasdaq: KELYA, KELYB) helps companies recruit and manage skilled workers and helps job seekers find great work. Since inventing the staffing industry in 1946, we have become experts in the many industries and local and global markets we serve. With a network of suppliers and partners around the world, we connect more than 450,000 people with work every year. Our suite of outsourcing and consulting services ensures companies have the people they need, when and where they are needed most. Headquartered in Troy, Michigan, we empower businesses and individuals to access limitless opportunities in industries such as science, engineering, technology, education, manufacturing, retail, finance, and energy. Revenue in 2022 was $5.0 billion. Learn more at kellyservices.com.
Forward-Looking Statements
This release contains statements that are forward looking in nature and, accordingly, are subject to risks and uncertainties. These statements are made under the “safe harbor” provisions of the U.S. Private Securities Litigation Reform Act of 1995. Statements that are not historical facts, including statements about Kelly’s financial expectations, are forward-looking statements. Factors that could cause actual results to differ materially from those contained in this release include, but are not limited to, (i) changing market and economic conditions, (ii) disruption in the labor market and weakened demand for human capital resulting from technological advances, loss of large corporate customers and government contractor requirements, (iii) the impact of laws and regulations (including federal, state and international tax laws), (iv) unexpected changes in claim trends on workers’ compensation, unemployment, disability and medical benefit plans, (v) litigation and other legal liabilities (including tax liabilities) in excess of our estimates, (vi) our ability to achieve our business’s anticipated growth strategies, (vi) our future business development, results of operations and financial condition, (vii) damage to our brands, (viii) dependency on third parties for the execution of critical functions, (ix) conducting business in foreign countries, including foreign currency fluctuations, (x) availability of temporary workers with appropriate skills required by customers, (xi) cyberattacks or other breaches of network or information technology security, and (xii) other risks, uncertainties and factors discussed in this release and in the Company’s filings with the Securities and Exchange Commission. In some cases, forward-looking statements can be identified by words or phrases such as “may,” “will,” “expect,” “anticipate,” “target,” “aim,” “estimate,” “intend,” “plan,” “believe,” “potential,” “continue,” “is/are likely to” or other similar expressions. All information provided in this press release is as of the date of this press release and we undertake no duty to update any forward-looking statement to conform the statement to actual results or changes in the Company’s expectations.
BOCA RATON, Fla.–(BUSINESS WIRE)–Jan. 2, 2024– The ODP Corporation (“ODP,” or the “Company”) (NASDAQ:ODP), a leading provider of business services, products and digital workplace technology solutions to businesses and consumers, today announced that, following the expiration of the January 2021 Cooperation Agreement between the Company and HG Vora, Marcus Dunlop, partner at HG Vora, has stepped down from the ODP Board of Directors, effective December 31, 2023.
“We greatly appreciate Marcus Dunlop’s service as a Board member over the past three years,” said Joseph S. Vassalluzzo, Chairman of ODP’s Board. “The Board thanks him for his insightful perspectives during his time as a Director and respects his decision to step down at this time. HG Vora continues to be an important independent shareholder of ODP.”
“I have seen firsthand ODP’s commitment to creating shareholder value through its focus on efficient operations,” said Marcus Dunlop, partner at HG Vora. “We remain supportive of the Board’s ongoing efforts to execute on its long-term strategy and shareholder-focused capital allocation plan.”
HG Vora owns 3.0 million shares, or approximately 8% of the Company’s outstanding common stock.
About The ODP Corporation
The ODP Corporation (NASDAQ:ODP) is a leading provider of products, services, and technology solutions through an integrated business-to-business (B2B) distribution platform and omni-channel presence, which includes supply chain and distribution operations, dedicated sales professionals, a B2B digital procurement solution, online presence, and a network of Office Depot and OfficeMax retail stores. Through its operating companies ODP Business Solutions, LLC; Office Depot, LLC; Veyer, LLC; and Varis, Inc, The ODP Corporation empowers every business, professional, and consumer to achieve more every day. For more information, visit theodpcorp.com.
This communication may contain forward-looking statements within the meaning of the Private Securities Litigation Reform Act of 1995. These statements or disclosures may discuss goals, intentions and expectations as to future trends, plans, events, results of operations, cash flow or financial condition, the potential impacts on our business due to the unknown severity and duration of the COVID-19 pandemic, or state other information relating to, among other things, the Company, based on current beliefs and assumptions made by, and information currently available to, management. Forward-looking statements generally will be accompanied by words such as “anticipate,” “believe,” “plan,” “could,” “estimate,” “expect,” “forecast,” “guidance,” “expectations”, “outlook,” “intend,” “may,” “possible,” “potential,” “predict,” “project,” “propose” or other similar words, phrases or expressions, or other variations of such words. These forward-looking statements are subject to various risks and uncertainties, many of which are outside of the Company’s control. There can be no assurances that the Company will realize these expectations or that these beliefs will prove correct, and therefore investors and stakeholders should not place undue reliance on such statements.
Factors that could cause actual results to differ materially from those in the forward-looking statements include, among other things, highly competitive office products market and failure to differentiate the Company from other office supply resellers or respond to decline in general office supplies sales or to shifting consumer demands; competitive pressures on the Company’s sales and pricing; the risk that the Company is unable to transform the business into a service-driven, B2B platform that such a strategy will not result in the benefits anticipated; the risk that the Company will not be able to achieve the expected benefits of its strategic plans, including its strategic shift to maintain all of its businesses under common ownership; the risk that the Company may not be able to realize the anticipated benefits of acquisitions due to unforeseen liabilities, future capital expenditures, expenses, indebtedness and the unanticipated loss of key customers or the inability to achieve expected revenues, synergies, cost savings or financial performance; the risk that the Company is unable to successfully maintain a relevant omni-channel experience for its customers; the risk that the Company is unable to execute the Maximize B2B Restructuring Plan successfully or that such plan will not result in the benefits anticipated; failure to effectively manage the Company’s real estate portfolio; loss of business with government entities, purchasing consortiums, and sole- or limited- source distribution arrangements; failure to attract and retain qualified personnel, including employees in stores, service centers, distribution centers, field and corporate offices and executive management, and the inability to keep supply of skills and resources in balance with customer demand; failure to execute effective advertising efforts and maintain the Company’s reputation and brand at a high level; disruptions in computer systems, including delivery of technology services; breach of information technology systems affecting reputation, business partner and customer relationships and operations and resulting in high costs and lost revenue; unanticipated downturns in business relationships with customers or terms with the suppliers, third-party vendors and business partners; disruption of global sourcing activities, evolving foreign trade policy (including tariffs imposed on certain foreign made goods); exclusive Office Depot branded products are subject to additional product, supply chain and legal risks; product safety and quality concerns of manufacturers’ branded products and services and Office Depot private branded products; covenants in the credit facility; general disruption in the credit markets; incurrence of significant impairment charges; retained responsibility for liabilities of acquired companies; fluctuation in quarterly operating results due to seasonality of the Company’s business; changes in tax laws in jurisdictions where the Company operates; increases in wage and benefit costs and changes in labor regulations; changes in the regulatory environment, legal compliance risks and violations of the U.S. Foreign Corrupt Practices Act and other worldwide anti-bribery laws; volatility in the Company’s common stock price; changes in or the elimination of the payment of cash dividends on Company common stock; macroeconomic conditions such as higher interest rates and future declines in business or consumer spending; increases in fuel and other commodity prices and the cost of material, energy and other production costs, or unexpected costs that cannot be recouped in product pricing; unexpected claims, charges, litigation, dispute resolutions or settlement expenses; catastrophic events, including the impact of weather events on the Company’s business; the discouragement of lawsuits by shareholders against the Company and its directors and officers as a result of the exclusive forum selection of the Court of Chancery, the federal district court for the District of Delaware or other Delaware state courts by the Company as the sole and exclusive forum for such lawsuits; and the impact of the COVID-19 pandemic on the Company’s business. The foregoing list of factors is not exhaustive. Investors and shareholders should carefully consider the foregoing factors and the other risks and uncertainties described in the Company’s Annual Reports on Form 10-K, Quarterly Reports on Form 10-Q, and Current Reports on Form 8-K filed with the U.S. Securities and Exchange Commission. The Company does not assume any obligation to update or revise any forward-looking statements.
Sale Adds Non-Dilutive Capital and Supports GameSquare’s Focus on Marketing Technology Capabilities
GameSquare Refinances Convertible Debenture
FRISCO, TX / ACCESSWIRE / January 2, 2024 /GameSquareHoldings, Inc. (“GameSquare”) (NASDAQ:GAME)(TSXV:GAME), announces that it has completed the sale of its Frankly non-core radio business assets to SoCast, Inc. (“SoCast”). As a result of the US$3.4 million asset sale, GameSquare has added non-dilutive capital to its balance sheet. GameSquare also announced today that it has further strengthened its balance sheet by refinancing the Company’s convertible debt.
“After completing four acquisitions in under three years, we believe there are opportunities to streamline our operations, enhance our cost structure and add non-dilutive capital to support our business by unlocking the value of certain non-core assets such as the radio assets of Frankly,” noted Justin Kenna, CEO of GameSquare. “In addition, selling just the radio assets of Frankly at approximately 1.8x trailing 12-month sales, compared to GameSquare’s current market cap of approximately 0.4x trailing 12-month sales, supports our strategies to unlock and drive value for our shareholders.”
Convertible Debenture Refinancing GameSquare has retired a principal amount US$5 million debenture that was due to mature in February of 2024, and replaced it with a principal US$5.8 million convertible note issued to an arm’s length party that bears interest at 12.75%, has a two-year term, and is convertible at the holder’s option into common shares of Company at a price of US$5 per share (subject to standard anti-dilution provisions). The issuance of the debenture has been conditionally approved by the TSX Venture Exchange.
Mr. Kenna continued, “I am also pleased to announce the successful refinancing of our convertible debt. As a result of today’s announcements, we have further strengthened our balance sheet and working capital position, providing us with greater flexibility to invest in our growth initiatives.”
The asset acquisition adds thousands of broadcast professional users to SoCast, and oncoming clients will benefit from the ecosystem of radio specific digital products that SoCast has to offer within one dashboard. “SoCast is dedicated to helping radio broadcasters transform into digital businesses. This acquisition increases the impact of our R&D footprint in the industry and bolsters our vision to be the leader in the space,” said Elliott Hurst, CEO.
About GameSquare Holdings, Inc. GameSquare Holdings, Inc. (NASDAQ: GAME | TSXV: GAME) is a vertically integrated, digital media, entertainment and technology company that connects global brands with gaming and youth culture audiences. GameSquare’s end-to-end platform includes GCN, a digital media company focused on gaming and esports audiences, Cut+Sew (Zoned), a gaming and lifestyle marketing agency, Code Red Esports Ltd., a UK based esports talent agency, Complexity Gaming, a leading esports organization, Fourth Frame Studios, a creative production studio, Mission Supply, a merchandise and consumer products business, Frankly Media, a provider of programmatic advertising and media distribution applications, Stream Hatchet, a provider of live streaming analytics services, and Sideqik a social influencer marketing platform. For more information visit www.gamesquare.com.
About SoCast, Inc. SoCast Inc. is a Toronto-based privately owned Canadian based digital marketing and technology company that makes digital easy for broadcasters. SoCast will now power more than 2,500 radio brands across the globe with more than 250 million people visiting a SoCast website each year. Combining a digital first mentality with radio industry knowledge, SoCast Engage provides ground-breaking websites, apps, contests, and content tools and services that clients rely upon to do their daily jobs. The SoCast Reach platform integrates sales, billing and finance into one programmatic advertising dashboard that helps broadcasters transform into digital businesses. For more information visit www.socastdigital.com.
Forward-Looking Information This news release contains “forward-looking information” and “forward-looking statements” (collectively, “forward-looking statements”) within the meaning of the applicable Canadian and United States securities legislation. All statements, other than statements of historical fact, are forward-looking statements and are based on expectations, estimates and projections as at the date of this news release. Any statement that involves discussions with respect to predictions, expectations, beliefs, plans, projections, objectives, assumptions, future events or performance (often but not always using phrases such as “expects”, or “does not expect”, “is expected”, “anticipates” or “does not anticipate”, “plans”, “budget”, “scheduled”, “forecasts”, “estimates”, “believes” or “intends” or variations of such words and phrases or stating that certain actions, events or results “may” or “could”, “would”, “might” or “will” be taken to occur or be achieved) are not statements of historical fact and may be forward-looking statements. In this news release, forward-looking statements relate, among other things, to the closing of the proposed transaction, the Company’s future performance and revenue; the Company’s ability to execute its business plan; and the proposed use of net proceeds of the transaction. These forward-looking statements are provided only to provide information currently available to us and are not intended to serve as and must not be relied on by any investor as, a guarantee, assurance or definitive statement of fact or probability. Forward-looking statements are necessarily based upon a number of estimates and assumptions which include, but are not limited to: the Company being able to grow its business and being able to execute on its business plan, the Company being able to complete and successfully integrate acquisitions, the Company being able to recognize and capitalize on opportunities and the Company continuing to attract qualified personnel to supports its development requirements. These assumptions, while considered reasonable, are subject to known and unknown risks, uncertainties, and other factors which may cause the actual results and future events to differ materially from those expressed or implied by such forward-looking statements. Such factors include, but are not limited to: the Company’s ability to achieve its objectives, the Company successfully executing its growth strategy, the ability of the Company to obtain future financings or complete offerings on acceptable terms, failure to leverage the Company’s portfolio across entertainment and media platforms, dependence on the Company’s key personnel and general business, economic, competitive, political and social uncertainties including impact of the COVID-19 pandemic and any variants. These risk factors are not intended to represent a complete list of the factors that could affect the Company which are discussed in the Company’s most recent MD&A. There can be no assurance that forward-looking statements will prove to be accurate, as actual results and future events could differ materially from those anticipated in such statements. Accordingly, readers should not place undue reliance on the forward-looking statements and information contained in this news release. GameSquare assumes no obligation to update the forward-looking statements of beliefs, opinions, projections, or other factors, should they change, except as required by law.
Neither TSX Venture Exchange nor its Regulation Services Provider (as that term is defined in the policies of the TSX Venture Exchange) accepts responsibility for the adequacy or accuracy of this release.
IRVING, Texas–(BUSINESS WIRE)– Salem Media Group, Inc. (the “Company”) (NASDAQ: SALM) announced today that it has given formal notice to the Nasdaq Stock Market of its intention to voluntarily delist its Class A Common Stock from the Nasdaq Global Market and to deregister its Class A Common Stock under Section 12(b) of the Securities Exchange Act of 1934 (the “Exchange Act”).
The Company currently anticipates that it will file with the Securities and Exchange Commission (the “SEC”) a Form 25 (Notification of Removal of Listing) on or about January 8, 2024, with the delisting of its Class A Common Stock taking effect no earlier than ten days thereafter. As a result, the Company expects that the last trading day of its common stock on the Nasdaq Global Market will be on or about January 18, 2024. Further, prior to March 29, 2024, the Company intends to file a Form 15 with the SEC to suspend the Company’s reporting obligations under Sections 12(g) and 15(d) of the Exchange Act.
The Company anticipates significant financial savings as a result of this decision. In addition, delisting and deregistration provide several benefits to the Company and its stockholders including lower operating costs and reduced management time commitment for compliance and reporting activities.
The Company anticipates that its Class A Common Stock will be quoted on the OTCQX or other market operated by OTC Markets Group Inc. (the “OTC”), and it intends to take such actions to enable its Class A Common Stock to be quoted on the OTCQX or on another OTC market so that a trading market may continue to exist for its Class A Common Stock. The Company expects its Class A Common Stock to be quoted on the OTCQX Market beginning on or around January 19, 2024, pending approval by OTC Markets.
FORWARD-LOOKING STATEMENTS:
This press release contains “forward-looking statements” within the meaning of the Private Securities Litigation Reform Act of 1995. The Company intends such forward-looking statements to be covered by the safe harbor provisions for forward-looking statements contained in Section 27A of the Securities Act of 1933, as amended and Section 21E of the Securities Exchange Act of 1934, as amended. Such statements, including statements regarding the expected timing and process for delisting and deregistering the Company’s Class A Common Stock, are based upon current plans, estimates and expectations of management that are subject to various risks and uncertainties that could cause actual results to differ materially from such statements. The inclusion of forward-looking statements should not be regarded as a representation that such plans, estimates and expectations will be achieved. All forward-looking statements are subject to risks and uncertainties that may cause actual results to differ materially from those that we expected, including, but not limited to, the Company’s ability to facilitate the quoting of its Class A Common Stock on the OTCQX or another OTC market, and other important factors discussed in the Company’s reports on Forms 10-K, 10-Q, 8-K and other filings filed with or furnished to the SEC. Readers are urged to consider these factors carefully and in the totality of the circumstances when evaluating these forward-looking statements, and not to place undue reliance on any of them. Any such forward-looking statements represent management’s reasonable estimates and beliefs as of the date of this press release. We assume no obligation to publicly update or revise these forward-looking statements for any reason, or to update the reasons actual results could differ materially from those anticipated in these forward-looking statements, even if new information becomes available in the future.
ABOUT SALEM MEDIA GROUP:
Salem Media Group is America’s leading multimedia company specializing in Christian and conservative content, with media properties comprising radio, digital media and book and newsletter publishing. Each day Salem serves a loyal and dedicated audience of listeners and readers numbering in the millions nationally. With its unique programming focus, Salem provides compelling content, fresh commentary and relevant information from some of the most respected figures across the Christian and conservative media landscape. Learn more about Salem Media Group, Inc. at www.salemmedia.com.
IRVING, Texas–(BUSINESS WIRE)– Salem Media Group, Inc. (NASDAQ: SALM) announced today that it has closed a new $26.0 million 3-year asset-based revolving credit facility with Siena Lending Group (the “New Revolving Facility”), which refinanced its prior revolving facility with Wells Fargo Bank.
Obligations under the New Revolving Facility are secured by a first-priority lien on the Company’s and its subsidiaries’ accounts receivable, inventory, deposit and securities accounts, certain real estate and related assets, and a second-priority lien on substantially all other assets of the Company and its subsidiaries.
FORWARD LOOKING STATEMENTS:
Statements used in this press release that relate to future plans, events, financial results, prospects or performance are forward-looking statements as defined under the Private Securities Litigation Reform Act of 1995. Actual results may differ materially from those anticipated as a result of certain risks and uncertainties, including but not limited to our ability to close and integrate announced transactions, market acceptance of our radio station formats, competition from new technologies, inflation and other adverse economic conditions, and other risks and uncertainties detailed from time to time in our reports on Forms 10-K, 10-Q, 8-K and other filings filed with or furnished to the Securities and Exchange Commission. Readers are cautioned not to place undue reliance on these forward-looking statements, which speak only as of the date hereof. We undertake no obligation to update or revise any forward-looking statements to reflect new information, changed circumstances or unanticipated events.
ABOUT SALEM MEDIA GROUP:
Salem Media Group is America’s leading multimedia company specializing in Christian and conservative content, with media properties comprising radio, digital media and book and newsletter publishing. Each day Salem serves a loyal and dedicated audience of listeners and readers numbering in the millions nationally. With its unique programming focus, Salem provides compelling content, fresh commentary and relevant information from some of the most respected figures across the Christian and conservative media landscape. Learn more about Salem Media Group, Inc. at www.salemmedia.com.
27 Dec, 2023, 05:00 ETVANCOUVER, BC, Dec. 27, 2023 /PRNewswire/ – Defense Metals Corp. (“Defense Metals” or the “Company“; (TSXV: DEFN) (OTCQB: DFMTF) (FSE: 35D) announces that it has completed all infrastructure geotechnical field data collection in support of the preliminary feasibility study (“PFS“) for its 100% owned Wicheeda Rare Earth Element (“REE“) Project located near Prince George, B.C., Canada.
Craig Taylor, CEO of Defense Metals, commented:
Image 1: Heli-Sonic Overburden Drilling in PFS Tailings Option Study Area (CNW Group/Defense Metals Corp.)
Image 2: Temporary Bridge Installation to Access Tailings Study Area (CNW Group/Defense Metals Corp.)
Image 3: Excavated Overburden Test Pits Underway in Tailings Study Area (CNW Group/Defense Metals Corp.)
“We are very excited to have completed our 2023 Phase 3 geotechnical program. I would like to congratulate the APEX and SRK teams for their safe and professional execution of this work. These multi-phase programs started in early summer and we now have all field geotechnical data in hand necessary for the completion of our PFS study which we expect to be finished in Q2 2024.”
Highlights of the 2023 Wicheeda REE Project infrastructure geotechnical programs include:
16 helicopter and track sonic overburden geotechnical drill holes totalling 225.5 metres (Image 1and Image 2);
6 diamond drill holes totalling 1,182 metres within the Wicheeda REE deposit pit shell; inclusive of 4 open pit geochemical drill holes totalling 920 metres, and in pit exploration holes totalling 262 metres;
Shipment of a 2,700 kg metallurgical sample, collected from drill core, to SGS Lakefield, Ontario for continued flotation and hydrometallurgical optimization test-work;
Initiation of humidity cell testwork on 17 samples, and 250 kg sample selection for on-site kinetic leach (barrel) testing of samples representative of anticipated mine waste rock to assess metal leaching and acid rock drainage potential in support of environmental assessment.
The geotechnical work was completed by SRK Consulting (Canada) Inc. (“SRK“) with the support of APEX Geoscience Ltd. (“APEX“).
Image 1: Heli-Sonic Overburden Drilling in PFS Tailings Option Study Area
Image 2: Temporary Bridge Installation to Access Tailings Study Area
Image 3: Excavated Overburden Test Pits Underway in Tailings Study Area
Qualified Person
The scientific and technical information contained in this news release as it relates to the Wicheeda REE Project has been reviewed and approved by Kristopher J. Raffle, P.Geo. (B.C.), Principal and Consultant of APEX Geoscience Ltd. of Edmonton, Alberta, who is a “Qualified Person” as defined in NI 43-101.
About the Wicheeda Rare Earth Element Project
Defense Metals’ 100% owned, 8,301-hectare (~20,534-acre) Wicheeda REE Project is located approximately 80 km northeast of the city of Prince George, British Columbia; population 77,000. Wicheeda is readily accessible by all-weather gravel roads and is near infrastructure, including hydro power transmission lines and gas pipelines. The nearby Canadian National Railway and major highways allow easy access to the port facilities at Prince Rupert, the closest major North American port to Asia.
About Defense Metals Corp.
Defense Metals Corp. is a mineral exploration and development company focused on the development of its 100% owned Wicheeda Rare Earth Element Deposit located near Prince George, British Columbia, Canada. Defense Metals Corp. trades on the TSX Venture Exchange under the symbol “DEFN”, in the United States, trading symbol “DFMTF” on the OTCQB and in Germany on the Frankfurt Exchange under “35D”.
Defense Metals is a proud member of Discovery Group. For more information please visit: http://www.discoverygroup.ca/
Neither the TSX Venture Exchange nor its Regulation Services Provider (as that term is defined in the policies of the TSX Venture Exchange) accepts responsibility for the adequacy or accuracy of this news release.
Cautionary Statement Regarding “Forward-Looking” Information
This news release contains “forward‐looking information or statements” within the meaning of applicable securities laws, which may include, without limitation, statements relating to advancing the Wicheeda REE Project, the expected completion of the PFS and the expected timeline, the receipt of assays from drilling, continued optimization test-work, the technical, financial and business prospects of the Company, its project and other matters. All statements in this news release, other than statements of historical facts, that address events or developments that the Company expects to occur, are forward-looking statements. Although the Company believes the expectations expressed in such forward-looking statements are based on reasonable assumptions, such statements are not guarantees of future performance and actual results may differ materially from those in the forward-looking statements. Such statements and information are based on numerous assumptions regarding present and future business strategies and the environment in which the Company will operate in the future, including the price of rare earth elements, the anticipated costs and expenditures, accuracy of assay results, performance of available laboratory and other related services, future operating costs, interpretation of geological, engineering and metallurgical data, the ability to achieve its goals, that general business and economic conditions will not change in a material adverse manner, that financing will be available if and when needed and on reasonable terms. Such forward-looking information reflects the Company’s views with respect to future events and is subject to risks, uncertainties and assumptions, including the risks and uncertainties relating to the interpretation of exploration, engineering and metallurgical results, risks related to the inherent uncertainty of exploration, metallurgy and development and cost estimates, the potential for unexpected costs and expenses and those other risks filed under the Company’s profile on SEDAR at www.sedarplus.ca. While such estimates and assumptions are considered reasonable by the management of the Company, they are inherently subject to significant business, economic, competitive and regulatory uncertainties and risks. Factors that could cause actual results to differ materially from those in forward looking statements include, but are not limited to, continued availability of capital and financing and general economic, market or business conditions, adverse weather and climate conditions, failure to maintain or obtain all necessary government permits, approvals and authorizations, failure to maintain community acceptance (including First Nations), risks relating to unanticipated operational difficulties (including failure of equipment or processes to operate in accordance with specifications or expectations, cost escalation, unavailability of personnel, materials and equipment, government action or delays in the receipt of government approvals, industrial disturbances or other job action, and unanticipated events related to health, safety and environmental matters), risks relating to inaccurate geological, metallurgical and engineering assumptions, decrease in the price of rare earth elements, the impact of Covid-19 or other viruses and diseases on the Company’s ability to operate, an inability to predict and counteract the effects of COVID-19 and other viruses and diseases on the business of the Company, the price of commodities, capital market conditions, restriction on labour and international travel and supply chains, loss of key employees, consultants, or directors, increase in costs, delayed results, litigation, and failure of counterparties to perform their contractual obligations. The Company does not undertake to update forward‐looking statements or forward‐looking information, except as required by law.
IRVING, Texas–(BUSINESS WIRE)– Salem Media Group, Inc. (NASDAQ: SALM) announced today that it has reached an agreement with Skyhorse Publishing to sell Regnery Publishing. The company expects to close the transaction by the end of the year.
David Evans, Chief Operating Officer of Salem Media, said, “We are thrilled to pass the torch of the oldest and most respected conservative publishing company in America to Free Speech advocate Tony Lyons and his incredibly successful Skyhorse Publishing. Salem is committed to the dissemination of conservative ideas and is excited that Skyhorse will both be a powerful steward of this important brand and an engine for its future growth.”
Tony Lyons, President and Publisher of Skyhorse Publishing, added, “We are so pleased to acquire this legendary publishing company, founded over 75 years ago, and are committed to building on the strong foundation that the Regnery staff has developed. We see a lot of synergies and opportunities for growth and will work hard to promote, market, and sell the books we have acquired and those that are pending, as well as to develop and pursue exciting new projects. Regnery will be an imprint of Skyhorse Publishing and will maintain its own identity.”
The more than 1,500 Regnery titles will be absorbed into the Skyhorse Publishing catalogue. The former Washington D.C. based publishing house was founded in 1947 by Henry Regnery and acquired an impressive list of authors over its 75 years, including former President Donald Trump, Senator Rand Paul, Senator Ted Cruz, Senator Mitt Romney, Tulsi Gabbard, Eric Metaxas, former President Ronald Regan, and Ann Coulter.
ABOUT SKYHORSE PUBLISHING:
Skyhorse Publishing, one of the largest independent book publishers in the United States, was launched in September 2006 by Tony Lyons, former president and publisher of the Lyons Press. The company has had fifty-seven New York Times bestsellers and currently has over 10,000 titles in print.
Skyhorse maintains a firm stance against censorship and aims to provide a full spectrum of political, theological, cultural, and philosophical viewpoints to counter the increasingly biased environment in mainstream media.
Through its twenty imprints, Skyhorse publishes an eclectic and maverick list of titles. Its imprints — Allworth Press, Arcade Crime Wise, Arcade Publishing, Carrel Books, Children’s Health Defense, Clydesdale Press, Front Page Detectives, Good Books, Helios Press, Hot Books, Night Shade Books, Not For Tourists, Racehorse For Young Readers, Racehorse Publishing, Sky Pony Press, Sports Publishing, Talos Press, Yucca Publishing, Skyhorse Publishing, and World Almanac — cover everything from nature, sports, country living, history, reference, travel, humor, health, art, business, philosophy, religion, current events, politics, investigative and conspiracy, to fiction, literary nonfiction, science fiction, fantasy, and young adult and children’s literature. Its backlist includes more than ten thousand titles. Skyhorse is distributed by Simon & Schuster in the U.S. and abroad.
ABOUT SALEM MEDIA GROUP:
Salem Media Group is America’s leading multimedia company specializing in Christian and conservative content, with media properties comprising radio, digital media and book and newsletter publishing. Each day Salem serves a loyal and dedicated audience of listeners and readers numbering in the millions nationally. With its unique programming focus, Salem provides compelling content, fresh commentary and relevant information from some of the most respected figures across the Christian and conservative media landscape. Learn more about Salem Media Group, Inc. at www.salemmedia.com.
MALVERN, Pa., Dec. 21, 2023 (GLOBE NEWSWIRE) — Ocugen, Inc. (Ocugen or the Company) (NASDAQ: OCGN), a biotechnology company focused on discovering, developing, and commercializing novel gene and cell therapies and vaccines, today announced that the Company received alignment from FDA on key aspects of the Phase 3 clinical trial design to assess the safety and efficacy of OCU400 in patients with RHO and other gene mutations associated with Retinitis Pigmentosa (RP).
“This news brings us even closer to fulfilling our mission to bring our first-in-class, gene-agnostic therapies to market and provide access to patients globally,” said Dr. Shankar Musunuri, Chairman, Chief Executive Officer, and Co-Founder of Ocugen. “We look forward to beginning the Phase 3 clinical trial, which we plan to initiate in early 2024.”
During a multidisciplinary meeting with FDA, based on preliminary results from an ongoing Phase 1/2 study, Ocugen received alignment on key aspects of the Phase 3 study design—including the study endpoint, patient enrollment strategy, and study duration of one year. The Phase 3 clinical trial will enroll a broader group of RP patients, including patients with the most common RHO gene mutation, based on OCU400’s potentially gene-agnostic mechanism of action.
With orphan drug and RMAT designations in place for OCU400, FDA’s alignment on key aspects of the Phase 3 study design positions Ocugen to confidently move forward in pursuing product development and licensure for OCU400.
Currently there are approximately 110,000 patients in the United States with RP and 1.6 million patients globally. Of these patients, more than 10% have the RHO genetic mutation. Advancing OCU400 to Phase 3 clinical development will be an important step toward addressing unmet needs in the RP patient community.
About Ocugen, Inc. Ocugen, Inc. is a biotechnology company focused on discovering, developing, and commercializing novel gene and cell therapies and vaccines that improve health and offer hope for patients across the globe. We are making an impact on patient’s lives through courageous innovation—forging new scientific paths that harness our unique intellectual and human capital. Our breakthrough modifier gene therapy platform has the potential to treat multiple retinal diseases with a single product, and we are advancing research in infectious diseases to support public health and orthopedic diseases to address unmet medical needs. Discover more at www.ocugen.com and follow us on X and LinkedIn.
Cautionary Note on Forward-Looking Statements This press release contains forward-looking statements within the meaning of The Private Securities Litigation Reform Act of 1995, including, but not limited to, statements regarding qualitative assessments of available data, potential therapeutic and clinical benefits of our product candidates, expectations for clinical trial timing and results, anticipated timing of clinical trial updates and expectations for timing and outcome of regulatory interactions, which are subject to risks and uncertainties. We may, in some cases, use terms such as “predicts,” “believes,” “potential,” “proposed,” “continue,” “estimates,” “anticipates,” “expects,” “plans,” “intends,” “may,” “could,” “might,” “will,” “should,” or other words that convey uncertainty of future events or outcomes to identify these forward-looking statements. Such statements are subject to numerous important factors, risks, and uncertainties that may cause actual events or results to differ materially from our current expectations, including, but not limited to, the risks that preliminary, interim and top-line clinical trial results may not be indicative of, and may differ from, final clinical data; that unfavorable new clinical trial data may emerge in ongoing clinical trials or through further analyses of existing clinical trial data; that earlier non-clinical and clinical data and testing of may not be predictive of the results or success of later clinical trials; that that clinical trial data are subject to differing interpretations and assessments, including by regulatory authorities; that receipt of orphan drug and RMAT designations may not lead to faster development or regulatory review; and that regulatory authorities may disagree with additional aspects of our clinical trial designs or may not approve our future IND applications on the anticipated timeline or at all. These and other risks and uncertainties are more fully described in our periodic filings with the Securities and Exchange Commission (SEC), including the risk factors described in the section entitled “Risk Factors” in the quarterly and annual reports that we file with the SEC. Any forward-looking statements that we make in this press release speak only as of the date of this press release. Except as required by law, we assume no obligation to update forward-looking statements contained in this press release whether as a result of new information, future events, or otherwise, after the date of this press release.
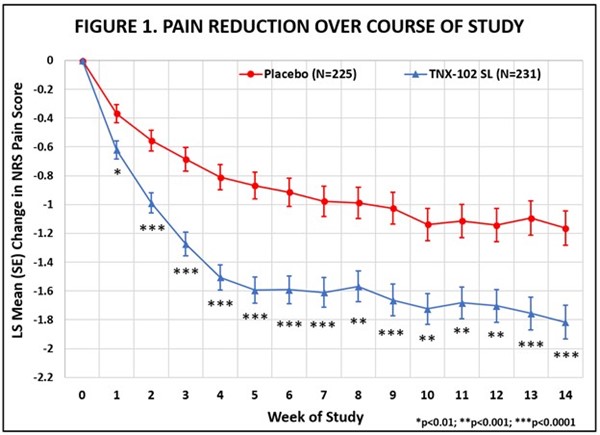
Phase 3 RESILIENT study of TNX-102 SL successfully demonstrated daily pain reduction over placebo (primary endpoint, p = 0.00005)
All six key secondary endpoints, including patient global impression, fibromyalgia-specific symptoms and dysfunction, fatigue and sleep measures were significantly improved (all p ≤ 0.001)
Positive results support planned New Drug Application (NDA) submission to the FDA in the second half of 2024 An estimated 6 million to 12 million adults in the U.S. are living with fibromyalgia, the majority of whom are women
CHATHAM, N.J., Dec. 20, 2023 (GLOBE NEWSWIRE) — Tonix Pharmaceuticals Holding Corp. (Nasdaq: TNXP) (Tonix or the Company), a biopharmaceutical company with marketed products and a pipeline of development candidates, today announced that the Phase 3 RESILIENT study evaluating TNX-102 SL (cyclobenzaprine HCl sublingual tablets) met its pre-specified primary endpoint in the second of two positive Phase 3 clinical trials, significantly reducing daily pain compared to placebo (p=0.00005) in participants with fibromyalgia (Table 1). Statistically significant and clinically meaningful results were also seen in all key secondary endpoints related to improving sleep quality, reducing fatigue, and improving overall fibromyalgia symptoms and function. Additionally, as it relates to improving daily pain, treatment with TNX-102 SL showed a robust and clinically meaningful analgesic effect size of 0.38, with rapid onset of action, separating from placebo for each week of the study. TNX-102 SL was well tolerated with an adverse event profile comparable to prior studies, and no new safety signals were observed. Tonix plans to submit a New Drug Application (NDA) to the U.S. Food and Drug Administration (FDA) in the second half of 2024 for TNX-102 SL for the management of fibromyalgia. An estimated 6 million to 12 million U.S. adults are living with fibromyalgia, the majority of whom are women.
TNX-102 SL is a tablet formulation containing 2.8 mg cyclobenzaprine HCl and is a novel, centrally-acting, non-opioid analgesic, designed to be taken once daily at bedtime for the management of fibromyalgia. RESILIENT was a 14-week randomized, double-blind, placebo-controlled trial of TNX-102 SL 5.6 mg, in which 457 participants with fibromyalgia were randomized in a 1:1 ratio to TNX-102 SL or placebo across 33 sites in the U.S. All participants received one 2.8 mg tablet of TNX-102 SL (2.8 mg) or placebo for the first 2 weeks, which was increased to two 2.8 mg tablets of TNX-102 SL (5.6 mg) or placebo for the remaining 12 weeks.
In December 2020, Tonix reported positive results from the first Phase 3 RELIEF study of TNX-102 SL 5.6 mg for the management of fibromyalgia. The RELIEF study met its pre-specified primary endpoint, significantly reducing daily pain compared to placebo (p=0.010) in participants with fibromyalgia, and showing activity in key secondary endpoints.
“We believe that the positive results of RESILIENT and RELIEF show that fibromyalgia can be successfully treated by TNX-102 SL 5.6 mg and may provide the opportunity for Tonix to have the first FDA-approved drug for fibromyalgia in more than a decade,” said Seth Lederman, M.D., President and Chief Executive Officer of Tonix Pharmaceuticals. “We are now an important step closer to bringing a new, first-line treatment to fibromyalgia patients that offers broad symptom relief and favorable tolerability for chronic use and adherence. We believe that we are well positioned to submit an NDA to the FDA under the 505(b)(2) regulatory approval pathway in the second half of 2024, and are on track to supply the U.S. market upon FDA approval.”
Table 1. Results of Primary and Secondary Endpoints for the Phase 3 RESILIENT Study of TNX-102 SL
Outcome Measure at Week 14
Intent-to-Treat Analysis1
P-value
Primary Endpoint
Daily Pain Diary, NRS
Mean Change from Baseline2
0.00005*
Key Secondary Endpoints
Non-specific
Patient Global Impression of Change
Proportion “Much” or “Very Much Improved”3
<0.001*
Fibromyalgia Syndrome-Related
FIQ-R Symptom Domain
Mean Change from Baseline
<0.001*
FIQ-R Function Domain
Mean Change from Baseline
0.001*
PROMIS Sleep Disturbance
Mean Change from Baseline
<0.001*
PROMIS Fatigue
Mean Change from Baseline
<0.001*
Daily Sleep Quality Diary, NRS
Mean Change from Baseline
<0.001*
Abbreviations: FIQ-R = Fibromyalgia Impact Questionnaire – Revised; NRS = Numeric Rating Scale; PROMIS = Patient-Reported Outcomes Measurement Information System
*Statistically significant; to control for overall type 1 error, a pre-specified, serial gatekeeping procedure was utilized.
1Analysis by mixed model repeated measures with multiple imputation unless otherwise indicated.
2Primary endpoint analysis for FDA approvals of Cymbalta®and Lyrica® in fibromyalgia.
3Pearson’s chi-squared test responder analysis, with missing data considered non-responders
“These data are terrific news for patients with fibromyalgia,” said Daniel J. Clauw, M.D., Professor of Anesthesiology, Medicine and Psychiatry at the University of Michigan. “Despite approved medications, there remains a need for new treatment options to better address the quality of life impacts many fibromyalgia patients experience on a chronic basis. TNX-102 SL is a non-opioid, centrally-acting analgesic, the active ingredient of which has a known, favorable safety profile from decades of use. The fact that cyclobenzaprine was also beneficial in many other key symptom domains, including sleep quality, sleep disturbance and fatigue, will be appreciated by fibromyalgia patients that struggle with not just pain but multiple other symptoms.”
“These positive data from RESILIENT and previously with RELIEF, with remarkable separation from placebo on pain, sleep, and fatigue, add support to TNX-102 SL’s proposed mechanism of improving sleep quality to improve the syndromal effects of fibromyalgia,” commented Gregory Sullivan, M.D., Chief Medical Officer of Tonix Pharmaceuticals. “The sublingual formulation of TNX-102 SL, which uses our proprietary Protectic® and Angstro® technologies, is integral to our treatment paradigm. These technologies enable transmucosal delivery of cyclobenzaprine with distinctive pharmacokinetic properties that include rapid absorption after dosing and bypass of first-pass hepatic metabolism. I would like to thank the RESILIENT study participants and their families and caregivers, as well as the investigators and their hard-working staff who all made this a highly successful trial.”
Summary of Topline Results of the RESILIENT Study
The RESILIENT study achieved statistical significance on the pre-specified primary efficacy endpoint: change from baseline in the weekly average of daily diary pain severity numerical rating scale (NRS) scores for TNX-102 SL 5.6 mg (LS mean [SE]: -1.8 [0.12] units) versus placebo (-1.2 [0.12] units), analyzed by mixed model repeated measures with multiple imputation (LS mean [SE] difference: -0.7 [0.16] units, p=0.00005, Table 1). In addition, all pre-specified sensitivity analyses of the primary endpoint were statistically significant (p<0.001). Figure 1 shows reduction in pain across all weeks of the 14-week study, with nominal p<0.01 for every week. Note the rapid onset of action with separation from placebo at Week 1 was sustained throughout all weeks of dosing.
Abbreviations: LS = least squares; NRS = numerical rating scale; SE = standard error
The statistically significant improvement in pain is further substantiated when diary pain was analyzed by another standard statistical approach, a 30 percent responder analysis, with 45.9% on active and 27.1% on placebo having a 30 percent or greater reduction in pain (Pearson Chi-Squared Test; difference in proportions [95% CI]: 18.8% [10.1%, 27.4%]; nominal p<0.001).
TNX-102 SL showed statistical significance (p≤0.001) on all six pre-specified key secondary efficacy outcome measures (Table 1).
Consistent with the proposed mechanism that TNX-102 SL acts in fibromyalgia through improving sleep quality, TNX-102 SL showed statistically significant improvement of sleep by two main measures. For the daily diary sleep quality ratings, improvement in sleep quality for TNX-102 SL (-1.8 [0.12] units) was significantly greater than that of placebo (-1.2 [0.12] units; LS mean [SE] difference from placebo: -0.6 [0.17] units; p<0.001). For the PROMIS Sleep Disturbance instrument, TNX-102 SL also demonstrated significantly greater improvement over placebo on T-scores (LS mean [SE] difference from placebo: -4.2 [0.79] units; p<0.001). Fatigue is another cardinal symptom of fibromyalgia and has a major impact on quality of life. TNX-102 SL showed significant improvement over placebo on the PROMIS Fatigue instrument T-scores (-3.0 [0.77] units; p<0.001).
The Fibromyalgia Impact Questionnaire – Revised (FIQ-R) is a 21-item self-rated instrument that assesses level of function, overall impact, and symptoms due to fibromyalgia, and the symptoms and function domains were key secondary endpoints in RESILENT. At Week 14 on the FIQ-R Symptoms domain, there was significantly greater improvement with TNX-102 SL than with placebo (LS mean [SE] difference from placebo: -7.7 [1.62], p<0.001). Similarly, TNX-102 SL resulted in greater improvement on FIQ-R Function (LS mean [SE] difference from placebo: -5.4 [1.66], p=0.001). Although not a key secondary efficacy endpoint, TNX-102 SL also separated from placebo on the FIQ-R Impact domain (nominal p=0.001). These results, along with the robust effects on improving sleep and fatigue, suggests broad symptomatic coverage of the syndrome of fibromyalgia.
Safety Results of the Phase 3 RESILIENT Study
In the RESILIENT study, TNX-102 SL was well tolerated and consistent with prior trials, with no new safety signals observed. Among participants randomized to the TNX-102 SL and placebo arms, 81.0% and 79.2%, respectively, completed the 14-week dosing period. As expected based on prior TNX-102 SL studies, administration site reactions were the most commonly reported adverse events and were higher in the TNX-102 SL treatment group (Table 2). Hypoaesthesia oral and paraesthesia oral, or tongue and mouth numbness or tingling, product taste abnormal (typically a bitter aftertaste upon dosing), and tongue discomfort were local effects nearly always temporally related to dose administration and transiently expressed (<60 minutes) in most occurrences. The only treatment-emergent adverse events that occurred at a rate of 3.0% or greater in either arm were these four oral adverse events, along with COVID-19, somnolence, and headache (Table 2). Adverse events resulted in premature study discontinuation in 6.1% of those who received TNX-102 SL compared with 3.5% of placebo recipients. There were a total of seven serious adverse events in five patients, five of which were experienced by three patients in the placebo arm, and two of which were in the TNX-102 SL arm. Of the two in the TNX-102 SL arm, one was renal cancer, deemed unrelated to study drug, and the other was acute pancreatitis with onset 14 days after dosing was completed and reported as possibly related to study drug.
Table 2. Treatment-Emergent Adverse Events at a Rate of 3% or Greater in Either Treatment Arm
TNX-102 SL (N=231)
Placebo (N=226)
Total (N=457)*
Administration Site Reactions
N
%
N
%
N
%
Hypoaesthesia oral
55
23.8%
1
0.4%
56
12.3%
Product taste abnormal
27
11.7%
2
0.9%
29
6.3%
Paraesthesia oral
16
6.9%
2
0.9%
18
3.9%
Tongue discomfort
16
6.9%
0
0.0%
16
3.5%
Systemic
Adverse Events
N
%
N
%
N
%
COVID-19
10
4.3%
7
3.1%
17
3.7%
Somnolence
7
3.0%
3
1.3%
10
2.2%
Headache
7
3.0%
4
1.8%
11
2.4%
*Safety Population
The Changes in Sexual Functioning Questionnaire short form (CSFQ-14) served as a safety measure for assessing potential adverse effects on sexual functioning. In females, the total score on the CSFQ-14 at Week 14 improved (indicating better sexual functioning) in the TNX-102 SL group compared with placebo (nominal p=0.010 by analysis of covariance). This potentially indicates an important tolerability advantage over pharmacotherapeutics which potently inhibit reuptake of serotonin. The low percentage of males in the safety population (<5%) did not allow meaningful analysis of the CSFQ-14 data.
About the Phase 3 RESILIENT Study
The RESILIENT study is a double-blind, randomized, placebo-controlled trial designed to evaluate the efficacy and safety of TNX-102 SL (cyclobenzaprine HCl sublingual tablets) in the management of fibromyalgia. The two-arm trial randomized 457 participants in the U.S. across 33 sites. The first two weeks of treatment consist of a run-in period in which participants start on TNX-102 SL 2.8 mg (1 tablet) or placebo. Thereafter, all participants increase their dose to TNX-102 SL 5.6 mg (2 x 2.8 mg tablets) or two placebo tablets for the remaining 12 weeks. The primary endpoint is the daily diary pain severity score change (TNX-102 SL 5.6 mg vs. placebo) from baseline to Week 14 (using the weekly averages of the daily numerical rating scale scores), analyzed by mixed model repeated measures with multiple imputation.
For more information, see ClinicalTrials.gov Identifier: NCT05273749.
About Fibromyalgia
Fibromyalgia is a chronic pain disorder that is understood to result from amplified sensory and pain signaling within the central nervous system. Fibromyalgia afflicts an estimated 6 million to 12 million adults in the U.S., the majority of whom are women. Symptoms of fibromyalgia include chronic widespread pain, nonrestorative sleep, fatigue, and morning stiffness. Other associated symptoms include cognitive dysfunction and mood disturbances, including anxiety and depression. Individuals suffering from fibromyalgia struggle with their daily activities, have impaired quality of life, and frequently are disabled. Physicians and patients report common dissatisfaction with currently marketed products.
About TNX-102 SL
TNX-102 SL is a patented sublingual tablet formulation of cyclobenzaprine hydrochloride which provides rapid transmucosal absorption and reduced production of a long half-life active metabolite, norcyclobenzaprine, due to bypass of first-pass hepatic metabolism. As a multifunctional agent with potent binding and antagonist activities at the 5-HT2A-serotonergic, α1-adrenergic, H1-histaminergic, and M1-muscarinic cholinergic receptors, TNX-102 SL is in development as a daily bedtime treatment for fibromyalgia, fibromyalgia-type Long COVID (formally known as post-acute sequelae of COVID-19 [PASC]), alcohol use disorder and agitation in Alzheimer’s disease. Dr. Harvey Moldofsky, Professor Emeritus of Psychiatry and Medicine at the University of Toronto, founding Director of the University of Toronto Center for Sleep and Chronobiology, first recognized the central role of non-restorative sleep in the pathogenesis of fibromyalgia1,2. Our program is based on the subsequent pioneering work of Dr. Iredell W. Iglehart III, who recognized that a sleep-focused cyclobenzaprine treatment protocol had the potential to target non-restorative sleep and lead to improvement of fibromyalgia at the syndromal level3. Teams led by Giorgio Reiner at APR Applied Pharma Research S.A., a wholly-owned subsidiary of Relief Therapeutics Holding AG, and Professor Marino Nebuloni and Patrizia Colombo at Redox Analytical Science Srl invented and developed these underlying technologies in collaboration with Tonix. The United States Patent and Trademark Office (USPTO) issued United States Patent No. 9636408 in May 2017, Patent No. 9956188 in May 2018, Patent No. 10117936 in November 2018, Patent No. 10,357,465 in July 2019, and Patent No. 10736859 in August 2020. The Protectic™ protective eutectic and Angstro-Technology™ formulation claimed in the patent are important elements of Tonix’s proprietary TNX-102 SL composition. These patents are expected to provide TNX-102 SL, upon NDA approval, with U.S. market exclusivity until 2034/2035. In addition, Tonix has pending but not issued U.S. patent applications directed to the transmucosal absorption of CBP-HCl, with U.S. market exclusivity expected until 2033, for treating major depressive disorder in fibromyalgia, with U.S. market exclusivity expected until 2032, and for treating pain in fibromyalgia with U.S. market exclusivity expected until 2041.
1Moldofsky H et al, Psychosom Med 1975;37:341-51. 2Moldofsky H and Scarisbrick P. Psychosom Med 1976;38:35-44. 3Iglehart IW. 2003; US Patent 6,541,523.
Tonix Pharmaceuticals Holding Corp.*
Tonix is a biopharmaceutical company focused on commercializing, developing, discovering and licensing therapeutics to treat and prevent human disease and alleviate suffering. Tonix Medicines, our commercial subsidiary, markets Zembrace® SymTouch® (sumatriptan injection) 3 mg and Tosymra® (sumatriptan nasal spray) 10 mg under a transition services agreement with Upsher-Smith Laboratories, LLC from whom the products were acquired on June 30, 2023. Zembrace SymTouch and Tosymra are each indicated for the treatment of acute migraine with or without aura in adults. Tonix’s development portfolio is composed of central nervous system (CNS), rare disease, immunology and infectious disease product candidates. Tonix’s CNS development portfolio includes both small molecules and biologics to treat pain, neurologic, psychiatric and addiction conditions. Tonix’s lead development CNS candidate, TNX-102 SL (cyclobenzaprine HCl sublingual tablet), has completed two positive Phase 3 studies for the management of fibromyalgia. Tonix intends to meet with the FDA and submit an NDA for the approval of TNX-102 SL for the management of fibromyalgia in the second half of 2024. TNX-102 SL is also being developed to treat fibromyalgia-type Long COVID, a chronic post-acute COVID-19 condition, and topline results were reported in the third quarter of 2023. TNX-1900 (intranasal potentiated oxytocin) is being studied in binge eating disorder, pediatric obesity, bone health in autism and social anxiety disorder by academic collaborators under investigator-initiated INDs. TNX-1300 (cocaine esterase) is a biologic designed to treat cocaine intoxication and has been granted Breakthrough Therapy designation by the FDA. A Phase 2 study of TNX-1300 is expected to be initiated in the first quarter of 2024 Tonix’s rare disease development portfolio includes TNX-2900 (intranasal potentiated oxytocin) for the treatment of Prader-Willi syndrome. TNX-2900 has been granted Orphan Drug designation by the FDA. Tonix’s immunology development portfolio includes biologics to address organ transplant rejection, autoimmunity and cancer, including TNX-1500, which is a humanized monoclonal antibody targeting CD40-ligand (CD40L or CD154) being developed for the prevention of allograft rejection and for the treatment of autoimmune diseases. A Phase 1 study of TNX-1500 was initiated in the third quarter of 2023. Tonix’s infectious disease pipeline includes TNX-801, a vaccine in development to prevent smallpox and mpox. TNX-801 also serves as the live virus vaccine platform or recombinant pox vaccine platform for other infectious diseases, including TNX-1800, in development as a vaccine to protect against COVID-19. During the fourth quarter of 2023, TNX-1800 was selected by the U.S. National Institutes of Health (NIH), National Institute of Allergy and Infectious Diseases (NIAID) Project NextGen for inclusion in Phase 1 clinical trials. The infectious disease development portfolio also includes TNX-3900 and TNX-4000, which are classes of broad-spectrum small molecule oral antivirals.
*Tonix’s product development candidates are investigational new drugs or biologics and have not been approved for any indication.
Zembrace SymTouch and Tosymra are registered trademarks of Tonix Medicines. All other marks are property of their respective owners.
This press release and further information about Tonix can be found at www.tonixpharma.com.
About Redox – Analytical Science Srl
Redox is an independent CRO company headquartered in Monza- Italy with R&D activities and customer analytical support to pharmaceutical companies for more than 30 years. From more than 25 years the analytical activities have been certified by national and international agencies (European Medicines Agency, the Italian Medicines Agency (AIFA), FDA, and etc). One of the main activities is the development of new drug products in order to improve the pharmaceutical actions and at the same time improve the stability and reducing the cost of the new drug substance. Several unique and sophisticated analytical techniques and equipment are used in support to research and development strategies with the focus to reach the best and effective pharmaceutical formulation in a short time frame. More than 30 professional people are dedicated to our efforts and many projects are ongoing in collaboration with the pharmaceutical industry as well as with Italian and international Universities.
Further information about Redox can be found at www.labredox.com.
About APR Applied Pharma Research S.A., a wholly-owned subsidiary of Relief Therapeutics Holding AG
Relief Therapeutics is a commercial-stage biopharmaceutical company committed to advancing treatment paradigms and delivering improvements in efficacy, safety, and convenience to benefit the lives of patients living with select specialty and rare diseases. Relief Therapeutics’ portfolio offers a balanced mix of marketed, revenue-generating products, our proprietary, globally patented Physiomimic™ and TEHCLO™ platform technologies and a targeted clinical development pipeline consisting of risk-mitigated assets focused in three core therapeutic areas: rare metabolic disorders, rare skin diseases and rare respiratory diseases. In addition, Relief Therapeutics is commercializing several legacy products via licensing and distribution partners. Relief Therapeutics’ mission is to provide therapeutic relief to those suffering from rare diseases and is being advanced by an international team of well-established, experienced biopharma industry leaders with extensive research, development and rare disease expertise. Relief Therapeutics is headquartered in Geneva, with additional offices in Balerna, Switzerland, Offenbach am Main, Germany and Monza, Italy. Relief Therapeutics is listed on the SIX Swiss Exchange under the symbol RLF.
Further information about APR can be found at www.relieftherapeutics.com or by following Relief Therapeutics on LinkedIn and Twitter.
Forward Looking Statements
Certain statements in this press release are forward-looking within the meaning of the Private Securities Litigation Reform Act of 1995. These statements may be identified by the use of forward-looking words such as “anticipate,” “believe,” “forecast,” “estimate,” “expect,” and “intend,” among others. These forward-looking statements are based on Tonix’s current expectations and actual results could differ materially. There are a number of factors that could cause actual events to differ materially from those indicated by such forward-looking statements. These factors include, but are not limited to, risks related to the failure to obtain FDA clearances or approvals and noncompliance with FDA regulations; risks related to the failure to successfully market any of our products; risks related to the timing and progress of clinical development of our product candidates; our need for additional financing; uncertainties of patent protection and litigation; uncertainties of government or third party payor reimbursement; limited research and development efforts and dependence upon third parties; and substantial competition. As with any pharmaceutical under development, there are significant risks in the development, regulatory approval and commercialization of new products. Tonix does not undertake an obligation to update or revise any forward-looking statement. Investors should read the risk factors set forth in the Annual Report on Form 10-K for the year ended December 31, 2022, as filed with the Securities and Exchange Commission (the “SEC”) on March 13, 2023, and periodic reports filed with the SEC on or after the date thereof. All of Tonix’s forward-looking statements are expressly qualified by all such risk factors and other cautionary statements. The information set forth herein speaks only as of the date thereof.
Beloved Pizza Chain Expands Texas Footprint in Richmond Suburb
LOS ANGELES, Dec. 19, 2023 (GLOBE NEWSWIRE) — FAT (Fresh. Authentic. Tasty.) Brands Inc., parent company of Round Table Pizza and 17 other restaurant concepts, announces that it has officially opened its first Round Table Pizza location in greater Houston. Located in Richmond, Texas, the new restaurant is operated by franchisee Paul Tran, an oil industry veteran and retiree, and will be a welcome addition to the West Houston suburbs.
Since its founding, Round Table Pizza has been recognized as “Pizza Royalty™” for its homemade dough, signature three-cheese blend, and gold-standard ingredients topped to the edge. Customers can enjoy the chain’s proprietary handmade pizzas, salads, baked-to-perfection Garlic Parmesan Twists, classic and boneless wings, and more.
“Establishing a presence in Houston represents a pivotal step in Round Table Pizza’s domestic growth strategy, especially as we continue building upon our presence in Texas,” says Taylor Wiederhorn, Chief Development Officer of FAT Brands. “Round Table Pizza has seen great success in the San Antonio and Dallas markets, and we believe the Richmond community will enjoy what we have to offer.”
Round Table Pizza in Richmond will be located at 8323 Farm to Market Rd 723, Richmond, TX 77406. It is open Sunday through Thursday, 11 a.m. to 9 p.m., and Fridays and Saturdays, 11 a.m. to 10 p.m. For more information on Round Table Pizza, please visit www.roundtablepizza.com.
About FAT (Fresh. Authentic. Tasty.) Brands
FAT Brands (NASDAQ: FAT) is a leading global franchising company that strategically acquires, markets, and develops fast casual, quick-service, casual dining, and polished casual dining concepts around the world. The Company currently owns 18 restaurant brands: Round Table Pizza, Fatburger, Marble Slab Creamery, Johnny Rockets, Fazoli’s, Twin Peaks, Great American Cookies, Hot Dog on a Stick, Buffalo’s Cafe & Express, Hurricane Grill & Wings, Pretzelmaker, Elevation Burger, Smokey Bones, Native Grill & Wings, Yalla Mediterranean and Ponderosa and Bonanza Steakhouses, and franchises and owns over 2,300 units worldwide. For more information on FAT Brands, please visit www.fatbrands.com.
About Round Table Pizza
Inspired by the honor, valor, and revelry of the Knights of the Round Table, Round Table Pizza’s® superior pizza and commitment to quality and authenticity have earned the reputation of “Pizza Royalty™” for over 60 years. With more than 410 restaurants across the United States, Round Table celebrates community, family, and making merry. For more information, visit www.roundtablepizza.com.
MEDIA CONTACT: Erin Mandzik FAT Brands [email protected] 860-212-6509
RMAT designation intended to help expedite development of new regenerative medicines
MALVERN, Pa., Dec. 19, 2023 (GLOBE NEWSWIRE) — Ocugen, Inc. (Ocugen or the Company) (NASDAQ: OCGN), a biotechnology company focused on discovering, developing, and commercializing novel gene and cell therapies and vaccines, today announced that the FDA has granted RMAT designation to Ocugen’s investigational product OCU400 for the treatment of retinitis pigmentosa (RP) associated with RHO mutations.
“RMAT designation is a significant accomplishment for the OCU400 clinical development program, as it validates the potential for our game-changing gene therapy approach to fulfill an unmet medical need for people who are facing blindness due to RP,” said Arun Upadhyay, PhD, Chief Scientific Officer and Head of R&D at Ocugen. “FDA’s decision also reinforces the sense of urgency to bring a therapeutic option to these patients.”
RMAT designation for OCU400 was based on preliminary clinical data supporting the maintenance and improvement of visual acuity and function in RP patients in the OCU400 -101 Phase 1/2 clinical trial as measured by Best Corrected Visual Acuity (BCVA), Low Luminance Visual Acuity (LLVA), and Multi-Luminance Mobility Test (MLMT).
RMAT designation is part of the 21st Century Cures Act. The program was created to expedite the development and review of regenerative medicine therapies intended to treat, modify, reverse, or cure a serious condition. Receiving RMAT designation offers sponsor companies all the benefits of the fast track and breakthrough therapy designation programs, including early interactions with the FDA. Ocugen is working with the FDA to finalize the Phase 3 protocol necessary to advance the clinical development for OCU400 to support an application for marketing authorization.
Current data support the gene-agnostic mechanism of action for OCU400, which suggests that it may be able to provide treatment benefit to a broader group of RP and Leber congenital amaurosis (LCA) patients. Ocugen intends to submit additional efficacy and safety data for OCU400 in RP and LCA patients to the FDA in the future to potentially expand this RMAT designation to broader RP and LCA patient populations.
RHO mutations affect more than 10,000 of the 110,000 people in the United States diagnosed with RP. In the latest clinical study update from the Phase 1/2 trial of OCU400, 86% (6/7) of RHO mutation subjects experienced either stabilization or improvement in MLMT scores from baseline, among which 29% (2/7) demonstrated 3 Lux luminance level improvement. There are currently no treatment options available for RP patients with RHO gene mutations.
OCU400 represents Ocugen’s modifier gene therapy approach, which is based on Nuclear Hormone Receptors (NHRs) that regulate diverse physiological functions, such as homeostasis, reproduction, development, and metabolism to potentially improve retinal health and function.
About Ocugen, Inc. Ocugen, Inc. is a biotechnology company focused on discovering, developing, and commercializing novel gene and cell therapies and vaccines that improve health and offer hope for patients across the globe. We are making an impact on patient’s lives through courageous innovation—forging new scientific paths that harness our unique intellectual and human capital. Our breakthrough modifier gene therapy platform has the potential to treat multiple retinal diseases with a single product, and we are advancing research in infectious diseases to support public health and orthopedic diseases to address unmet medical needs. Discover more at www.ocugen.com and follow us on X and LinkedIn.
Cautionary Note on Forward-Looking Statements This press release contains forward-looking statements within the meaning of The Private Securities Litigation Reform Act of 1995, including, but not limited to, statements regarding qualitative assessments of available data, potential benefits, expectations for ongoing clinical trials, the expected benefits of RMAT designation, and anticipated regulatory interactions, which are subject to risks and uncertainties. We may, in some cases, use terms such as “predicts,” “believes,” “potential,” “proposed,” “continue,” “estimates,” “anticipates,” “expects,” “plans,” “intends,” “may,” “could,” “might,” “will,” “should,” or other words that convey uncertainty of future events or outcomes to identify these forward-looking statements. Such statements are subject to numerous important factors, risks, and uncertainties that may cause actual events or results to differ materially from our current expectations, including, but not limited to, the risks that preliminary, interim and top-line clinical trial results may not be indicative of, and may differ from, final clinical data; that unfavorable new clinical trial data may emerge in ongoing clinical trials or through further analyses of existing clinical trial data; that earlier non-clinical and clinical data and testing of may not be predictive of the results or success of later clinical trials; and that that clinical trial data are subject to differing interpretations and assessments, including by regulatory authorities. These and other risks and uncertainties are more fully described in our periodic filings with the Securities and Exchange Commission (SEC), including the risk factors described in the section entitled “Risk Factors” in the quarterly and annual reports that we file with the SEC. Any forward-looking statements that we make in this press release speak only as of the date of this press release. Except as required by law, we assume no obligation to update forward-looking statements contained in this press release whether as a result of new information, future events, or otherwise, after the date of this press release.