75% of immune checkpoint inhibitor (ICI) naïve patients remain alive at 36 months; published median overall survival (OS) in similar patients is 7-11 months
12-month survival rate in ICI resistant patients is 72%
Median OS in ICI resistant patients is approximately 20 months; published median OS is 3.4 months
PRINCETON, N.J., Nov. 09, 2023 (GLOBE NEWSWIRE) — PDS Biotechnology Corporation (Nasdaq: PDSB) (“PDS Biotech” or the “Company”), a clinical-stage immunotherapy company developing a growing pipeline of targeted cancer immunotherapies and infectious disease vaccines based on the Company’s proprietary T cell activating platforms, today announced updated survival data from the Phase 2 clinical trial investigating the triple combination of PDS0101, PDS0301 (IL-12 antibody-drug conjugate) and an investigational immune checkpoint inhibitor (ICI) in two groups of advanced cancer patients with various types of human papillomavirus (HPV) 16-positive cancers. The ICI naïve group had not responded to standard-of-care treatments but had not yet been treated with an ICI. The ICI resistant group included patients who had not responded to multiple prior treatments, including ICI therapy. Investigators at the National Cancer Institute (NCI), part of the National Institutes of Health, have completed the primary endpoint analysis of the Phase 2 trial.
In the ICI naïve group, final survival data from the trial indicated that 75% (6/8) of these patients were still alive at 36 months, and the median overall survival (OS) has not yet been reached. Published data on standard-of-care ICIs report 30-50% of these patients typically remain alive at 12 months, and less than 30% of the patients remain alive at 24 months.
In the ICI resistant group, the 12-month OS rate was 72% and the triple combination achieved a median OS of approximately 20 months. In addition:
For PDS0101 plus high doses of ICI and PDS0301, the overall response rate (ORR) was 63% (5/8).
For PDS0101 plus low doses of ICI and/or PDS0301, the ORR was 5% (1/21).
The historical median survival for ICI therapy in HPV-positive cancer ICI resistant patients is reported to be 3.4 months.
“We are encouraged by the survival rates for both ICI naïve and ICI resistant patients with HPV16-positive cancers who were treated with the triple combination therapy,” said Frank Bedu-Addo, PhD, Chief Executive Officer of PDS Biotech. “The ICI resistant data from the VERSATILE-002 trial evaluating PDS0101 in combination with KEYTRUDA® (pembrolizumab) that were reported October 3, 2023, further clarify the path forward for a potential registrational clinical trial of PDS0101 and PDS0301 in combination with a commercial ICI. With this exciting information, we will be finalizing the regulatory and clinical pathway for the triple combination with OS as the primary endpoint.”
PDS0101, PDS Biotech’s lead candidate, is a Versamune® based investigational immunotherapy designed to stimulate a potent targeted T cell attack against HPV16-positive cancers. PDS0301 is a novel, proprietary investigational tumor-targeting IL-12 antibody-drug conjugate that enhances the proliferation, potency, and longevity of T cells in the tumor microenvironment formulated to overcome tumor immune suppression utilizing a different mechanism from checkpoint inhibitors. PDS Biotech has patented the combination of Versamune® and IL-12. The investigational ICI used in the triple combination therapy is Bintrafusp alfa, a bifunctional fusion protein targeting two independent immunosuppressive pathways (PD-L1 and TGF-β).
About PDS0101 PDS0101, PDS Biotech’s lead candidate, is a novel investigational human papillomavirus (HPV)-targeted immunotherapy that stimulates a potent targeted T cell attack against HPV-positive cancers. PDS0101 is given by subcutaneous injection alone or in combination with other immunotherapies and cancer treatments. In a Phase 1 study of PDS0101 in monotherapy, the treatment demonstrated the ability to generate multifunctional HPV16-targeted CD8 and CD4 T cells with minimal toxicity. Interim data suggests PDS0101 generates clinically active immune responses, and the combination of PDS0101 with other treatments can demonstrate significant disease control by reducing or shrinking tumors, delaying disease progression and/or prolonging survival. The combination of PDS0101 with other treatments does not appear to compound the toxicity of other agents.
About PDS0301 PDS0301 is a novel investigational tumor-targeting IL-12 antibody-drug conjugate IL-12 that enhances the proliferation, potency and longevity of T cells in the tumor microenvironment. PDS0301 is given by a subcutaneous injection. PDS0301 is designed to improve the safety profile of IL-12 and to enhance the anti-tumor response.
About PDS Biotechnology PDS Biotech is a clinical-stage immunotherapy company developing a growing pipeline of targeted cancer and infectious disease immunotherapies based on our proprietary Versamune®, Versamune® plus PDS0301, and Infectimune® T cell-activating platforms. We believe our targeted immunotherapies have the potential to overcome the limitations of current immunotherapy approaches through the activation of the right type, quantity and potency of T cells. To date, our lead Versamune® clinical candidate, PDS0101, has demonstrated the ability to reduce and shrink tumors and stabilize disease in combination with approved and investigational therapeutics in patients with a broad range of HPV16-associated cancers in multiple Phase 2 clinical trials and will be advancing into a Phase 3 clinical trial in combination with KEYTRUDA® for the treatment of recurrent/metastatic HPV16-positive head and neck cancer in 2023. Our Infectimune® based vaccines have also demonstrated the potential to induce not only robust and durable neutralizing antibody responses, but also powerful T cell responses, including long-lasting memory T cell responses in pre-clinical studies to date. To learn more, please visit www.pdsbiotech.com or follow us on Twitter at @PDSBiotech.
References: Strauss J et al. Journal for ImmunoTherapy of Cancer 2020;8:e001395 Burtness B et al., Lancet. 2019; 394:1915-1928 Ferris RL, et al. NEJM. 2016;375:1856-67
Forward Looking Statements This communication contains forward-looking statements (including within the meaning of Section 21E of the United States Securities Exchange Act of 1934, as amended, and Section 27A of the United States Securities Act of 1933, as amended) concerning PDS Biotechnology Corporation (the “Company”) and other matters. These statements may discuss goals, intentions and expectations as to future plans, trends, events, results of operations or financial condition, or otherwise, based on current beliefs of the Company’s management, as well as assumptions made by, and information currently available to, management. Forward-looking statements generally include statements that are predictive in nature and depend upon or refer to future events or conditions, and include words such as “may,” “will,” “should,” “would,” “expect,” “anticipate,” “plan,” “likely,” “believe,” “estimate,” “project,” “intend,” “forecast,” “guidance”, “outlook” and other similar expressions among others. Forward-looking statements are based on current beliefs and assumptions that are subject to risks and uncertainties and are not guarantees of future performance. Actual results could differ materially from those contained in any forward-looking statement as a result of various factors, including, without limitation: the Company’s ability to protect its intellectual property rights; the Company’s anticipated capital requirements, including the Company’s anticipated cash runway and the Company’s current expectations regarding its plans for future equity financings; the Company’s dependence on additional financing to fund its operations and complete the development and commercialization of its product candidates, and the risks that raising such additional capital may restrict the Company’s operations or require the Company to relinquish rights to the Company’s technologies or product candidates; the Company’s limited operating history in the Company’s current line of business, which makes it difficult to evaluate the Company’s prospects, the Company’s business plan or the likelihood of the Company’s successful implementation of such business plan; the timing for the Company or its partners to initiate the planned clinical trials for PDS0101, PDS0203 and other Versamune® and Infectimune® based product candidates; the future success of such trials; the successful implementation of the Company’s research and development programs and collaborations, including any collaboration studies concerning PDS0101, PDS0203 and other Versamune® and Infectimune® based product candidates and the Company’s interpretation of the results and findings of such programs and collaborations and whether such results are sufficient to support the future success of the Company’s product candidates; the success, timing and cost of the Company’s ongoing clinical trials and anticipated clinical trials for the Company’s current product candidates, including statements regarding the timing of initiation, pace of enrollment and completion of the trials (including the Company’s ability to fully fund its disclosed clinical trials, which assumes no material changes to the Company’s currently projected expenses), futility analyses, presentations at conferences and data reported in an abstract, and receipt of interim or preliminary results (including, without limitation, any preclinical results or data), which are not necessarily indicative of the final results of the Company’s ongoing clinical trials; any Company statements about its understanding of product candidates mechanisms of action and interpretation of preclinical and early clinical results from its clinical development programs and any collaboration studies; and other factors, including legislative, regulatory, political and economic developments not within the Company’s control. The foregoing review of important factors that could cause actual events to differ from expectations should not be construed as exhaustive and should be read in conjunction with statements that are included herein and elsewhere, including the other risks, uncertainties, and other factors described under “Risk Factors,” “Management’s Discussion and Analysis of Financial Condition and Results of Operations” and elsewhere in the documents we file with the U.S. Securities and Exchange Commission. The forward-looking statements are made only as of the date of this press release and, except as required by applicable law, the Company undertakes no obligation to revise or update any forward-looking statement, or to make any other forward-looking statements, whether as a result of new information, future events or otherwise.
Versamune® is a registered trademark and Infectimune® is a trademark of PDS Biotechnology Corporation.
KEYTRUDA® is a registered trademark of Merck Sharp and Dohme LLC, a subsidiary of Merck & Co., Inc., Rahway, N.J., USA.
BOTHELL, Wash., Nov. 09, 2023 (GLOBE NEWSWIRE) — Cocrystal Pharma, Inc. (Nasdaq: COCP) (“Cocrystal” or the “Company”), announces that President and co-CEO Sam Lee, PhD will discuss progress in developing the novel, broad-spectrum PB2 inhibitor CC-42344 in an oral presentation, “Taking a new route: Development of novel inhaled and oral influenza antiviral, CC-42344” at the World Vaccine Congress West Coast on Tuesday, November 28, 2023 at 3:20 p.m. Pacific Time. The conference is being held November 27-30 at the Santa Clara Convention Center in Santa Clara, Calif.
“It is highly gratifying to be selected for an oral presentation at this prestigious gathering to discuss the significant progress we’ve made in developing CC-42344 for the treatment of pandemic and seasonal influenza A,” said Dr. Lee. “We recently announced authorization by the United Kingdom Medicines and Healthcare Products Regulatory Agency (MHRA) to initiate a Phase 2a human challenge trial with orally administered CC-42344 and we expect to begin treating influenza-infected patients later in this quarter. Additionally, preparations are underway to begin a Phase 1 clinical trial in the first half of 2024 with an inhaled CC-42344 formulation as a potential treatment and prophylaxis for influenza A.”
Following the presentation, Cocrystal will issue a press release with highlights from Dr. Lee’s discussion and the slide presentation will be available on the Company’s website.
About CC-42344 CC-42344 is an PB2 inhibitor that blocks an essential step of viral replication and was discovered using Cocrystal’s proprietary structure-based drug discovery platform technology. It is specifically designed to be effective against all significant pandemic and seasonal influenza A strains and to have a high barrier to resistance due to the way the virus’ replication machinery is targeted. CC-42344 targets the influenza polymerase, an essential replication enzyme with several highly essential regions common to multiple influenza strains. In vitro testing showed CC-42344’s excellent antiviral activity against influenza A strains, including pandemic and seasonal strains, as well as against strains resistant to certain approved influenza antivirals, while also demonstrating favorable pharmacokinetic and safety profiles.
About Cocrystal Pharma, Inc. Cocrystal Pharma, Inc. is a clinical-stage biotechnology company discovering and developing novel antiviral therapeutics that target the replication process of influenza viruses, coronaviruses (including SARS-CoV-2) noroviruses and hepatitis C viruses. Cocrystal employs unique structure-based technologies and Nobel Prize-winning expertise to create first- and best-in-class antiviral drugs. For further information about Cocrystal, please visit www.cocrystalpharma.com.
Cautionary Note Regarding Forward-Looking Statements This press release contains forward-looking statements within the meaning of the Private Securities Litigation Reform Act of 1995, including statements regarding the initiation and characteristics of a Phase 2a human challenge trial in 2023 for CC-42344 as a product candidate for oral treatment of influenza A, and a Phase 1 clinical trial in 2024 for CC-42344 as a product candidate for inhaled treatment of influenza A, and the potential efficacy and clinical benefits of, and market for, such product candidate. The words “believe,” “may,” “estimate,” “continue,” “anticipate,” “intend,” “should,” “plan,” “could,” “target,” “potential,” “is likely,” “will,” “expect” and similar expressions, as they relate to us, are intended to identify forward-looking statements. We have based these forward-looking statements largely on our current expectations and projections about future events. Some or all of the events anticipated by these forward-looking statements may not occur. Important factors that could cause actual results to differ from those in the forward-looking statements include, but are not limited to, risks relating to the manufacturing and research delays arising from labor shortages and other factors, the ability of our Clinical Research Organization partners to recruit volunteers for, and to proceed with, clinical trials, and general risks arising from or involved in conducting clinical studies for CC-42344, including the results of such studies. Further information on our risk factors is contained in our filings with the SEC, including our Annual Report on Form 10-K for the year ended December 31, 2022. Any forward-looking statement made by us herein speaks only as of the date on which it is made. Factors or events that could cause our actual results to differ may emerge from time to time, and it is not possible for us to predict all of them. We undertake no obligation to publicly update any forward-looking statement, whether as a result of new information, future developments or otherwise, except as may be required by law.
Inflammatory bowel disease (IBD) is a chronic inflammatory disease of the gastrointestinal tract affecting 1 in 100 Americans (around 2.4 million people) that can lead to disabling bowel symptoms and progressive bowel damage.
Study provides direct evidence that NLRP3 signaling is over-activated in IBD, and that its inhibition attenuates intestinal inflammation and tissue damage, leading to significant improvements in IBD symptoms, and restoration of normal intestinal microbial flora.
ZyVersa is developing Inflammasome ASC Inhibitor IC 100 which can inhibit up to 12 different inflammasomes (including NLRP3 inflammasomes) and their associated ASC specks which perpetuate damaging inflammation.
WESTON, Fla., Nov. 09, 2023 (GLOBE NEWSWIRE) — ZyVersa Therapeutics, Inc. (Nasdaq: ZVSA, or “ZyVersa”), a clinical stage specialty biopharmaceutical company developing first-in-class drugs for treatment of inflammatory and renal diseases, announces publication of an article in the peer-reviewed Biomedical Journal demonstrating that inhibiting NLRP3 inflammasomes in an IBD animal model attenuates intestinal inflammation and tissue damage, leading to significant improvements in IBD symptoms, and restoration of normal intestinal microbial flora.
In the paper titled, “Inhibition of NLRP3 attenuates sodium dextran sulfate-induced inflammatory bowel disease through gut microbiota regulation,” the authors evaluated human colon biopsy samples from patients with IBD and healthy controls, and conducted a study in an IBD mouse model. Following are key findings reported in the paper:
NLRP3 and IL-1β expression is increased in the colon of IBD patients.
NLRP3 inhibition in the IBD animal model:
Inhibited NLRP3 inflammasome signaling in the colon, resulting in significantly reduced levels of the pro-inflammatory cytokines IL-1b, IL-6, and TNF-α.
Alleviated severe diarrhea and significantly improved IBD symptoms, based on the disease activity index score.
Attenuated histopathological changes indicative of tissue damage (goblet cell reduction, crypt destruction, and epithelial barrier disruption).
Restored gut microbiota to normal.
The authors stated, “In conclusion, this study provides direct evidence that NLRP3 signaling is over-activated in IBD patients. The inhibition of NLRP3 reverses the IBD-like symptoms in DSS-induced mice, which the regulatory effects on gut microbiota might mediate. Overall, this present study provides a basis for the clinical application of NLRP3 as a target for IBD treatment.” To read the article, Click Here.
“Restoration of quality of life is the ultimate long-term goal in IBD management. Although disease remission can often be achieved with current therapies, bothersome symptoms can still prevail,” stated Stephen C. Glover, ZyVersa’s Co-founder, Chairman, CEO and President. “The research published in the Biomedical Journal provides support for inflammasome inhibition as a promising treatment option for IBD. ZyVersa is developing Inflammasome ASC inhibitor IC 100. Unlike NLRP3 inhibitors, designed to inhibit formation of one inflammasome to block initiation of the inflammatory cascade, IC 100 was designed to inhibit multiple types of inflammasomes and their associated ASC specks to uniquely block both initiation and perpetuation of damaging inflammation, which we believe is necessary to control chronic inflammation.” To review a white paper summarizing the mechanism of action and preclinical data for IC 100, Click Here.
About Inflammasome ASC Inhibitor IC 100
IC 100 is a novel humanized IgG4 monoclonal antibody that inhibits the inflammasome adaptor protein ASC. IC 100 was designed to attenuate both initiation and perpetuation of the inflammatory response. It does so by binding to a specific region of the ASC component of multiple types of inflammasomes, including NLRP1, NLRP2, NLRP3, NLRC4, AIM2, Pyrin. Intracellularly, IC 100 binds to ASC monomers, inhibiting inflammasome formation, thereby blocking activation of IL-1β early in the inflammatory cascade. IC 100 also binds to ASC in ASC Specks, both intracellularly and extracellularly, further blocking activation of IL-1β and the perpetuation of the inflammatory response that is pathogenic in inflammatory diseases. Because active cytokines amplify adaptive immunity through various mechanisms, IC 100, by attenuating cytokine activation, also attenuates the adaptive immune response.
About ZyVersa Therapeutics, Inc.
ZyVersa (Nasdaq: ZVSA) is a clinical stage specialty biopharmaceutical company leveraging advanced, proprietary technologies to develop first-in-class drugs for patients with renal and inflammatory diseases who have significant unmet medical needs. The Company is currently advancing a therapeutic development pipeline with multiple programs built around its two proprietary technologies – Cholesterol Efflux Mediator™ VAR 200 for treatment of kidney diseases, and Inflammasome ASC Inhibitor IC 100, targeting damaging inflammation associated with numerous CNS and other inflammatory diseases. For more information, please visit www.zyversa.com.
Certain statements contained in this press release regarding matters that are not historical facts, are forward-looking statements within the meaning of Section 21E of the Securities Exchange Act of 1934, as amended, and the Private Securities Litigation Reform Act of 1995. These include statements regarding management’s intentions, plans, beliefs, expectations, or forecasts for the future, and, therefore, you are cautioned not to place undue reliance on them. No forward-looking statement can be guaranteed, and actual results may differ materially from those projected. ZyVersa Therapeutics, Inc (“ZyVersa”) uses words such as “anticipates,” “believes,” “plans,” “expects,” “projects,” “future,” “intends,” “may,” “will,” “should,” “could,” “estimates,” “predicts,” “potential,” “continue,” “guidance,” and similar expressions to identify these forward-looking statements that are intended to be covered by the safe-harbor provisions. Such forward-looking statements are based on ZyVersa’s expectations and involve risks and uncertainties; consequently, actual results may differ materially from those expressed or implied in the statements due to a number of factors, including ZyVersa’s plans to develop and commercialize its product candidates, the timing of initiation of ZyVersa’s planned preclinical and clinical trials; the timing of the availability of data from ZyVersa’s preclinical and clinical trials; the timing of any planned investigational new drug application or new drug application; ZyVersa’s plans to research, develop, and commercialize its current and future product candidates; the clinical utility, potential benefits and market acceptance of ZyVersa’s product candidates; ZyVersa’s commercialization, marketing and manufacturing capabilities and strategy; ZyVersa’s ability to protect its intellectual property position; and ZyVersa’s estimates regarding future revenue, expenses, capital requirements and need for additional financing.
New factors emerge from time-to-time, and it is not possible for ZyVersa to predict all such factors, nor can ZyVersa assess the impact of each such factor on the business or the extent to which any factor, or combination of factors, may cause actual results to differ materially from those contained in any forward-looking statements. Forward-looking statements included in this press release are based on information available to ZyVersa as of the date of this press release. ZyVersa disclaims any obligation to update such forward-looking statements to reflect events or circumstances after the date of this press release, except as required by applicable law.
This press release does not constitute an offer to sell, or the solicitation of an offer to buy, any securities.
Corporate and IR Contact: Karen Cashmere Chief Commercial Officer kcashmere@zyversa.com 786-251-9641
Q3 operating earnings were break-even, or up 60% to $15.5 million on an adjusted basis
Q3 revenue down 4.3%; down 5.8% in constant currency
Q3 adjusted EBITDA margin increased to 2.3% compared to 1.6% in the prior year driven by meaningful reduction in operating expenses resulting from business transformation initiative
Company expects sale of European staffing operations and near-term outcome from growth initiatives to drive further expansion of adjusted EBITDA margin
TROY, Mich., Nov. 9, 2023 /PRNewswire/ — Kelly (Nasdaq: KELYA, KELYB), a leading global specialty talent solutions provider, today announced results for the third quarter of 2023.
Peter Quigley, president and chief executive officer, announced revenue for the third quarter of 2023 totaled $1.1 billion, a 4.3% decrease, or 5.8% decrease in constant currency, compared to the corresponding quarter of 2022. Year-over-year revenue trends were impacted by customers’ more guarded approach to hiring and initiating new projects or capital spending, partially offset by favorable currency impacts.
“In the third quarter, persistent macroeconomic uncertainty continued to temper demand for temporary and permanent staffing services,” said Quigley. “As expected, results in SET and P&I reflected these challenges, while our Education segment and more resilient outcome-based solutions in P&I once again delivered year-over-year growth. We continued to focus on what we can control in this challenging operating environment, driving significant progress in the execution of our transformation initiatives – the benefits of which are evident in our operating results.”
Kelly reported break-even operating earnings in the third quarter of 2023 compared to a loss of $21.4 million reported in the third quarter of 2022. Earnings in the third quarter of 2023 include $15.4 million of transformation-related charges. Excluding the transformation-related charges, adjusted earnings from operations were $15.5 million. Loss from operations in the third quarter of 2022 included a $30.7 million goodwill impairment charge and adjusted earnings were $9.5 million. Adjusted earnings improved 60% year-over-year primarily as a result of lower operating expenses due to our ongoing transformation initiatives.
Earnings per share in the third quarter of 2023 were $0.18 compared to a loss per share of $0.43 in the third quarter of 2022. Included in the earnings per share in the third quarter of 2023 is a $0.32 loss per share related to transformation-related charges, net of tax. Included in the third quarter of 2022 was a $0.67 loss per share, net of tax, from a goodwill impairment charge. On an adjusted basis, earnings per share were $0.50 in the third quarter of 2023, double the $0.25 earnings per share in the corresponding quarter of 2022.
Quigley went on to provide an update on the company’s business transformation initiative.
“Following the implementation of strategic restructuring activities at the outset of the third quarter, we remained focused on sustaining these structural improvements across the enterprise. We also made progress on several initiatives that are positioning Kelly to accelerate profitable growth over the long term. With the efficiency phase of our transformation on-track, our growth initiatives delivering encouraging early results, and the sale of our European staffing business poised to benefit both of these efforts, we remain committed to driving continued improvement of our adjusted EBITDA margin and maximizing value creation.”
In the fourth quarter of 2023, Kelly expects to achieve an adjusted EBITDA margin in the range of 2.8% to 3.0%, reflecting the impact of market conditions that are more challenging than anticipated. Assuming the benefit of a full year of its transformation-related savings, the sale of its European staffing business and current top-line trends, the company would expect to reach a normalized, adjusted EBITDA margin in the range of 3.3 to 3.5%.
Kelly also reported that on November 7, its board of directors declared a dividend of $0.075 per share. The dividend is payable on December 6, 2023, to shareholders of record as of the close of business on November 22, 2023.
In conjunction with its third-quarter earnings release, Kelly has published a financial presentation on the Investor Relations page of its public website and will host a conference call at 9 a.m. ET on November 9 to review the results and answer questions. The call may be accessed in one of the following ways:
Via the Telephone (877) 692-8955 (toll free) or (234) 720-6979 (caller paid) Enter access code 5728672 After the prompt, please enter ”#”
A recording of the conference call will be available after 2:30 p.m. ET on November 9, 2023, at (866) 207-1041 (toll-free) and (402) 970-0847 (caller-paid). The access code is 7027637#. The recording will also be available at kellyservices.com during this period.
This release contains statements that are forward looking in nature and, accordingly, are subject to risks and uncertainties. These statements are made under the “safe harbor” provisions of the U.S. Private Securities Litigation Reform Act of 1995. Statements that are not historical facts, including statements about Kelly’s financial expectations, are forward-looking statements. Factors that could cause actual results to differ materially from those contained in this release include, but are not limited to, (i) changing market and economic conditions, (ii) disruption in the labor market and weakened demand for human capital resulting from technological advances, loss of large corporate customers and government contractor requirements, (iii) the impact of laws and regulations (including federal, state and international tax laws), (iv) unexpected changes in claim trends on workers’ compensation, unemployment, disability and medical benefit plans, (v) litigation and other legal liabilities (including tax liabilities) in excess of our estimates, (vi) our ability to achieve our business’s anticipated growth strategies, (vii) our future business development, results of operations and financial condition, (viii) damage to our brands, (ix) dependency on third parties for the execution of critical functions, (x) conducting business in foreign countries, including foreign currency fluctuations, (xi) availability of temporary workers with appropriate skills required by customers, (xii) cyberattacks or other breaches of network or information technology security, and (xiii) other risks, uncertainties and factors discussed in this release and in the Company’s filings with the Securities and Exchange Commission. In some cases, forward-looking statements can be identified by words or phrases such as “may,” “will,” “expect,” “anticipate,” “target,” “aim,” “estimate,” “intend,” “plan,” “believe,” “potential,” “continue,” “is/are likely to” or other similar expressions. All information provided in this press release is as of the date of this press release and we undertake no duty to update any forward-looking statement to conform the statement to actual results or changes in the Company’s expectations.
About Kelly®
Kelly Services, Inc. (Nasdaq: KELYA, KELYB) helps companies recruit and manage skilled workers and helps job seekers find great work. Since inventing the staffing industry in 1946, we have become experts in the many industries and local and global markets we serve. With a network of suppliers and partners around the world, we connect more than 450,000 people with work every year. Our suite of outsourcing and consulting services ensures companies have the people they need, when and where they are needed most. Headquartered in Troy, Michigan, we empower businesses and individuals to access limitless opportunities in industries such as science, engineering, technology, education, manufacturing, retail, finance, and energy. Revenue in 2022 was $5.0 billion. Learn more at kellyservices.com.
FOR THE 13 WEEKS ENDED OCTOBER 1, 2023 AND OCTOBER 2, 2022
(UNAUDITED)
(In millions of dollars except per share data)
%
CC %
2023
2022
Change
Change
Change
Revenue from services
$
1,118.0
$
1,167.9
$
(49.9)
(4.3)
%
(5.8)
%
Cost of services
889.5
927.3
(37.8)
(4.1)
Gross profit
228.5
240.6
(12.1)
(5.1)
(6.3)
Selling, general and administrative expenses
228.4
231.1
(2.7)
(1.2)
(2.4)
Goodwill impairment charge
—
30.7
(30.7)
NM
Loss on disposal
—
0.2
(0.2)
NM
Earnings (loss) from operations
0.1
(21.4)
21.5
NM
Other income (expense), net
1.6
0.2
1.4
NM
Earnings (loss) before taxes
1.7
(21.2)
22.9
NM
Income tax expense (benefit)
(4.9)
(5.0)
0.1
0.1
Net earnings (loss)
$
6.6
$
(16.2)
$
22.8
NM
Basic earnings (loss) per share
$
0.18
$
(0.43)
$
0.61
NM
Diluted earnings (loss) per share
$
0.18
$
(0.43)
$
0.61
NM
STATISTICS:
Permanent placement revenue (included in revenue from services)
$
14.6
$
19.8
$
(5.2)
(26.3)
%
(28.5)
%
Gross profit rate
20.4
%
20.6
%
(0.2)
pts.
Conversion rate
0.0
%
(8.9)
%
8.9
pts.
Adjusted EBITDA
$
25.5
$
19.1
$
6.4
Adjusted EBITDA margin
2.3
%
1.6
%
0.7
pts.
Effective income tax rate
(299.3)
%
23.4
%
(322.7)
pts.
Average number of shares outstanding (millions):
Basic
35.4
37.9
Diluted
35.8
37.9
KELLY SERVICES, INC. AND SUBSIDIARIES
CONSOLIDATED STATEMENTS OF EARNINGS
FOR THE 39 WEEKS ENDED OCTOBER 1, 2023 AND OCTOBER 2, 2022
(UNAUDITED)
(In millions of dollars except per share data)
%
CC %
2023
2022
Change
Change
Change
Revenue from services
$
3,603.5
$
3,731.6
$
(128.1)
(3.4)
%
(3.8)
%
Cost of services
2,880.3
2,970.0
(89.7)
(3.0)
Gross profit
723.2
761.6
(38.4)
(5.0)
(5.2)
Selling, general and administrative expenses
703.8
707.3
(3.5)
(0.5)
(0.8)
Asset impairment charge
2.4
—
2.4
NM
Goodwill impairment charge
—
30.7
(30.7)
NM
Loss on disposal
—
18.7
(18.7)
NM
Gain on sale of assets
—
(5.3)
5.3
NM
Earnings from operations
17.0
10.2
6.8
67.0
Loss on investment in Persol Holdings
—
(67.2)
67.2
NM
Loss on currency translation from liquidation of subsidiary(1)
—
(20.4)
20.4
NM
Other income (expense), net
3.0
1.9
1.1
55.9
Earnings (loss) before taxes and equity in net earnings of affiliate
20.0
(75.5)
95.5
NM
Income tax expense (benefit)
(5.0)
(13.1)
8.1
61.8
Net earnings (loss) before equity in net earnings of affiliate
25.0
(62.4)
87.4
NM
Equity in net earnings of affiliate
—
0.8
(0.8)
NM
Net earnings (loss)
$
25.0
$
(61.6)
$
86.6
NM
Basic earnings (loss) per share
$
0.68
$
(1.62)
$
2.30
NM
Diluted earnings (loss) per share
$
0.67
$
(1.62)
$
2.29
NM
STATISTICS:
Permanent placement revenue (included in revenue from services)
$
47.8
$
71.2
$
(23.4)
(32.9)
%
(33.3)
%
Gross profit rate
20.1
%
20.4
%
(0.3)
pts.
Conversion rate
2.4
%
1.3
%
1.1
pts.
Adjusted EBITDA
$
76.9
$
81.5
$
(4.6)
Adjusted EBITDA margin
2.1
%
2.2
%
(0.1)
pts.
Effective income tax rate
(25.1)
%
17.4
%
(42.5)
pts.
Average number of shares outstanding (millions):
Basic
36.2
38.2
Diluted
36.5
38.2
(1) Subsequent to the sale of the Persol Holdings investment, the Company commenced the dissolution process of the Kelly Services Japan subsidiary, which was considered substantially liquidated as of the first quarter-end 2022, resulting in the recognition of the $20.4 million loss on currency translation from liquidation of this subsidiary in the first quarter of 2022.
KELLY SERVICES, INC. AND SUBSIDIARIES
RESULTS OF OPERATIONS BY SEGMENT
(UNAUDITED)
(In millions of dollars)
Third Quarter
%
CC %
2023
2022
Change
Change
Professional & Industrial
Revenue from services
$
364.5
$
408.6
(10.8)
%
(10.5)
%
Gross profit
65.5
70.3
(6.9)
(6.5)
SG&A expenses excluding restructuring charges
53.7
65.3
(17.7)
(17.6)
Restructuring charges
4.0
—
NM
NM
Total SG&A expenses
57.7
65.3
(11.6)
(11.4)
Earnings from operations
7.8
5.0
54.2
Earnings from operations excluding restructuring charges
11.8
5.0
133.7
Gross profit rate
17.9
%
17.2
%
0.7
pts.
Science, Engineering & Technology
Revenue from services
$
295.7
$
321.3
(8.0)
%
(8.0)
%
Gross profit
68.0
76.3
(10.8)
(10.9)
Total SG&A expenses
47.8
53.4
(10.4)
(10.5)
Earnings from operations
20.2
22.9
(11.7)
Gross profit rate
23.0
%
23.7
%
(0.7)
pts.
Education
Revenue from services
$
128.1
$
104.3
22.9
%
22.9
%
Gross profit
19.8
16.6
19.2
19.2
Total SG&A expenses
22.4
21.4
5.0
5.0
Earnings (loss) from operations
(2.6)
(4.8)
44.8
Gross profit rate
15.5
%
15.9
%
(0.4)
pts.
Outsourcing & Consulting
Revenue from services
$
114.1
$
118.5
(3.8)
%
(4.0)
%
Gross profit
41.5
44.1
(6.0)
(6.7)
SG&A expenses excluding restructuring charges
37.2
37.7
(1.5)
(2.4)
Restructuring charges
1.8
—
NM
NM
Total SG&A expenses
39.0
37.7
3.3
2.2
Goodwill impairment charge
—
30.7
NM
Earnings (loss) from operations
2.5
(24.3)
NM
Earnings (loss) from operations excluding restructuring charges
4.3
(24.3)
NM
Gross profit rate
36.4
%
37.2
%
(0.8)
pts.
International
Revenue from services
$
220.6
$
215.5
2.4
%
(6.2)
%
Gross profit
33.7
33.3
1.0
(7.6)
Total SG&A expenses
31.2
31.4
(0.7)
(8.7)
Earnings from operations
2.5
1.9
27.5
Gross profit rate
15.3
%
15.5
%
(0.2)
pts.
KELLY SERVICES, INC. AND SUBSIDIARIES
RESULTS OF OPERATIONS BY SEGMENT
(UNAUDITED)
(In millions of dollars)
September Year to Date
%
CC %
2023
2022
Change
Change
Professional & Industrial
Revenue from services
$
1,131.3
$
1,268.7
(10.8)
%
(10.4)
%
Gross profit
200.4
231.2
(13.3)
(12.8)
SG&A expenses excluding restructuring charges
176.5
203.8
(13.4)
(13.1)
Restructuring charges
7.3
0.3
NM
NM
Total SG&A expenses
183.8
204.1
(9.9)
(9.6)
Asset impairment charge
0.3
—
NM
Earnings from operations
16.3
27.1
(40.4)
Earnings from operations excluding restructuring charges
23.6
27.4
(14.4)
Gross profit rate
17.7
%
18.2
%
(0.5)
pts.
Science, Engineering & Technology
Revenue from services
$
903.5
$
962.7
(6.2)
%
(6.1)
%
Gross profit
207.4
225.3
(7.9)
(7.9)
Total SG&A expenses
150.6
161.4
(6.7)
(6.7)
Asset impairment charge
0.1
—
NM
Earnings from operations
56.7
63.9
(11.2)
Gross profit rate
23.0
%
23.4
%
(0.4)
pts.
Education
Revenue from services
$
583.9
$
433.2
34.8
%
34.8
%
Gross profit
91.6
69.2
32.4
32.4
Total SG&A expenses
69.3
60.4
14.8
14.8
Earnings from operations
22.3
8.8
152.7
Gross profit rate
15.7
%
16.0
%
(0.3)
pts.
Outsourcing & Consulting
Revenue from services
$
342.4
$
352.0
(2.7)
%
(2.3)
%
Gross profit
124.4
127.6
(2.5)
(2.0)
SG&A expenses excluding restructuring charges
114.9
111.7
2.8
2.7
Restructuring charges
2.3
0.1
NM
NM
Total SG&A expenses
117.2
111.8
4.7
4.6
Asset impairment charge
2.0
—
NM
Goodwill impairment charge
—
30.7
NM
Earnings from operations
5.2
(14.9)
NM
Earnings from operations excluding restructuring charges
7.5
(14.8)
NM
Gross profit rate
36.3
%
36.3
%
—
pts.
International
Revenue from services
$
657.5
$
715.9
(8.2)
%
(11.2)
%
Gross profit
99.4
108.3
(8.2)
(11.1)
Total SG&A expenses
96.2
99.2
(3.0)
(5.8)
Earnings from operations
3.2
9.1
(64.9)
Gross profit rate
15.1
%
15.1
%
—
pts.
KELLY SERVICES, INC. AND SUBSIDIARIES
CONSOLIDATED BALANCE SHEETS
(UNAUDITED)
(In millions of dollars)
October 1, 2023
January 1, 2023
October 2, 2022
Current Assets
Cash and equivalents
$
117.2
$
153.7
$
122.4
Trade accounts receivable, less allowances of
$11.1, $11.2, and $12.1, respectively
1,388.2
1,491.6
1,519.9
Prepaid expenses and other current assets
86.1
69.9
83.1
Assets held for sale
—
—
4.7
Total current assets
1,591.5
1,715.2
1,730.1
Noncurrent Assets
Property and equipment, net
28.8
27.8
24.9
Operating lease right-of-use assets
59.9
66.8
67.3
Deferred taxes
315.3
299.7
300.7
Goodwill, net
151.1
151.1
161.4
Other assets
403.4
403.2
397.5
Total noncurrent assets
958.5
948.6
951.8
Total Assets
$
2,550.0
$
2,663.8
$
2,681.9
Current Liabilities
Short-term borrowings
$
—
$
0.7
$
0.1
Accounts payable and accrued liabilities
647.5
723.3
735.2
Operating lease liabilities
13.2
14.7
14.4
Accrued payroll and related taxes
287.8
315.8
321.4
Accrued workers’ compensation and other claims
22.8
22.9
24.4
Income and other taxes
54.0
51.4
47.5
Total current liabilities
1,025.3
1,128.8
1,143.0
Noncurrent Liabilities
Operating lease liabilities
51.5
55.0
55.6
Accrued workers’ compensation and other claims
40.5
40.7
43.4
Accrued retirement benefits
185.6
174.1
172.7
Other long-term liabilities
11.4
11.0
14.5
Total noncurrent liabilities
289.0
280.8
286.2
Stockholders’ Equity
Common stock
38.5
38.5
38.5
Treasury stock
(57.4)
(20.1)
(12.4)
Paid-in capital
29.3
28.0
26.6
Earnings invested in the business
1,233.0
1,216.3
1,220.1
Accumulated other comprehensive income (loss)
(7.7)
(8.5)
(20.1)
Total stockholders’ equity
1,235.7
1,254.2
1,252.7
Total Liabilities and Stockholders’ Equity
$
2,550.0
$
2,663.8
$
2,681.9
STATISTICS:
Working Capital
$
566.2
$
586.4
$
587.1
Current Ratio
1.6
1.5
1.5
Debt-to-capital %
0.0
%
0.1
%
0.0
%
Global Days Sales Outstanding
63
61
64
Year-to-Date Free Cash Flow
$
21.0
$
(88.3)
$
(117.3)
KELLY SERVICES, INC. AND SUBSIDIARIES
CONSOLIDATED STATEMENTS OF CASH FLOWS
FOR THE 39 WEEKS ENDED OCTOBER 1, 2023 AND OCTOBER 2, 2022
(UNAUDITED)
(In millions of dollars)
2023
2022
Cash flows from operating activities:
Net earnings (loss)
$
25.0
$
(61.6)
Adjustments to reconcile net earnings (loss) to net cash from operating activities:
Asset impairment charge
2.4
—
Goodwill impairment charge
—
30.7
Deferred income taxes on goodwill impairment charge
—
(5.3)
Loss on disposal
—
18.7
Depreciation and amortization
25.6
24.7
Operating lease asset amortization
12.4
14.2
Provision for credit losses and sales allowances
1.4
1.7
Stock-based compensation
7.9
5.9
Gain on sale of equity securities
(2.0)
—
Loss on investment in Persol Holdings
—
67.2
Loss on currency translation from liquidation of subsidiary
—
20.4
Gain on foreign currency remeasurement
—
(5.5)
Gain on sale of assets
—
(5.3)
Equity in net earnings of PersolKelly Asia Pacific
—
(0.8)
Other, net
0.5
3.5
Changes in operating assets and liabilities, net of acquisition
(39.8)
(220.2)
Net cash from (used in) operating activities
33.4
(111.7)
Cash flows from investing activities:
Capital expenditures
(12.4)
(5.6)
Proceeds from sale of assets
—
4.5
Acquisition of company, net of cash received
—
(143.1)
Cash disposed from sale of Russia, net of proceeds
—
(6.0)
Proceeds from company-owned life insurance
—
1.5
Proceeds from sale of Persol Holdings investment
—
196.9
Proceeds from sale of equity method investment
—
119.5
Proceeds from equity securities
2.0
—
Other investing activities
(0.4)
—
Net cash (used in) from investing activities
(10.8)
167.7
Cash flows from financing activities:
Net change in short-term borrowings
(0.7)
0.2
Financing lease payments
(1.0)
(1.2)
Dividend payments
(8.3)
(7.7)
Payments of tax withholding for stock awards
(1.7)
(0.9)
Buyback of common shares
(42.2)
(27.2)
Contingent consideration payments
(2.5)
(0.7)
Other financing activities
(0.2)
0.1
Net cash used in financing activities
(56.6)
(37.4)
Effect of exchange rates on cash, cash equivalents and restricted cash
(1.9)
(7.4)
Net change in cash, cash equivalents and restricted cash
(35.9)
11.2
Cash, cash equivalents and restricted cash at beginning of period
162.4
119.5
Cash, cash equivalents and restricted cash at end of period
$
126.5
$
130.7
KELLY SERVICES, INC. AND SUBSIDIARIES
REVENUE FROM SERVICES BY GEOGRAPHY
(UNAUDITED)
(In millions of dollars)
Third Quarter
%
CC %
2023
2022
Change
Change
Americas
United States
$
795.5
$
861.0
(7.6)
%
(7.6)
%
Canada
50.9
43.3
17.5
20.7
Puerto Rico
26.5
28.3
(6.2)
(6.2)
Mexico
18.4
10.9
68.4
41.9
Total Americas Region
891.3
943.5
(5.5)
(5.7)
Europe
Switzerland
57.0
55.2
3.3
(5.6)
Portugal
48.6
41.9
15.9
7.2
France
47.0
45.8
2.8
(5.0)
Italy
16.1
16.4
(2.3)
(9.6)
Russia
—
5.0
(100.0)
(100.0)
Other
47.1
49.8
(5.5)
(12.3)
Total Europe Region
215.8
214.1
0.8
(7.0)
Total Asia-Pacific Region
10.9
10.3
5.8
9.7
Total Kelly Services, Inc.
$
1,118.0
$
1,167.9
(4.3)
%
(5.8)
%
KELLY SERVICES, INC. AND SUBSIDIARIES
REVENUE FROM SERVICES BY GEOGRAPHY
(UNAUDITED)
(In millions of dollars)
September Year to Date
%
CC %
2023
2022
Change
Change
Americas
United States
$
2,647.1
$
2,746.5
(3.6)
%
(3.6)
%
Canada
142.2
122.7
15.9
21.4
Puerto Rico
81.1
84.8
(4.3)
(4.3)
Mexico
55.1
32.4
70.0
49.1
Total Americas Region
2,925.5
2,986.4
(2.0)
(2.0)
Europe
Switzerland
165.9
165.5
0.3
(5.0)
France
145.0
150.8
(3.8)
(5.5)
Portugal
142.3
125.8
13.2
10.9
Italy
49.5
54.3
(8.8)
(10.4)
Russia
—
63.4
(100.0)
(100.0)
Other
142.4
152.8
(6.8)
(7.2)
Total Europe Region
645.1
712.6
(9.5)
(11.6)
Total Asia-Pacific Region
32.9
32.6
1.0
5.8
Total Kelly Services, Inc.
$
3,603.5
$
3,731.6
(3.4)
%
(3.8)
%
KELLY SERVICES, INC. AND SUBSIDIARIES
RECONCILIATION OF NON-GAAP MEASURES
THIRD QUARTER
(UNAUDITED)
(In millions of dollars)
2023
2022
SG&A Expenses:
As Reported
Restructuring(7)
Adjusted
As Reported
Professional & Industrial
$ 57.7
$ (4.0)
$ 53.7
$ 65.3
Science, Engineering & Technology
47.8
(0.7)
47.1
53.4
Education
22.4
(0.6)
21.8
21.4
Outsourcing & Consulting
39.0
(1.8)
37.2
37.7
International
31.2
—
31.2
31.4
Corporate
30.3
(8.3)
22.0
21.9
Total Company
$ 228.4
$ (15.4)
$ 213.0
$ 231.1
2023
2022
Earnings from Operations:
As Reported
Restructuring(7)
Adjusted
Adjusted
Professional & Industrial
$ 7.8
$ 4.0
$ 11.8
$ 5.0
Science, Engineering & Technology
20.2
0.7
20.9
22.9
Education
(2.6)
0.6
(2.0)
(4.8)
Outsourcing & Consulting
2.5
1.8
4.3
6.4
International
2.5
—
2.5
1.9
Corporate
(30.3)
8.3
(22.0)
(21.9)
Total Company
$ 0.1
$ 15.4
$ 15.5
$ 9.5
KELLY SERVICES, INC. AND SUBSIDIARIESRECONCILIATION OF NON-GAAP MEASURESTHIRD QUARTER(UNAUDITED)(In millions of dollars)
2022
Earnings from Operations:
As Reported
Loss on disposal(4)
Goodwill impairment charge(6)
Adjusted
Professional & Industrial
$ 5.0
$ —
$ —
$ 5.0
Science, Engineering & Technology
22.9
—
—
22.9
Education
(4.8)
—
—
(4.8)
Outsourcing & Consulting
(24.3)
—
30.7
6.4
International
1.9
—
—
1.9
Corporate
(21.9)
—
—
(21.9)
Loss on disposal
(0.2)
0.2
—
—
Total Company
$ (21.4)
$ 0.2
$ 30.7
$ 9.5
KELLY SERVICES, INC. AND SUBSIDIARIES
RECONCILIATION OF NON-GAAP MEASURES
SEPTEMBER YEAR TO DATE
(UNAUDITED)
(In millions of dollars)
2023
2022
SG&A Expenses:
As Reported
Restructuring(7)
Adjusted
As Reported
Professional & Industrial
$ 183.8
$ (7.3)
$ 176.5
$ 204.1
Science, Engineering & Technology
150.6
(1.2)
149.4
161.4
Education
69.3
(1.0)
68.3
60.4
Outsourcing & Consulting
117.2
(2.3)
114.9
111.8
International
96.2
(0.6)
95.6
99.2
Corporate
86.7
(15.2)
71.5
70.4
Total Company
$ 703.8
$ (27.6)
$ 676.2
$ 707.3
2023
2022
Earnings from Operations:
As Reported
Asset impairment(5)
Restructuring(7)
Adjusted
Adjusted
Professional & Industrial
$ 16.3
$ 0.3
$ 7.3
$ 23.9
$ 27.1
Science, Engineering & Technology
56.7
0.1
1.2
58.0
63.9
Education
22.3
—
1.0
23.3
8.8
Outsourcing & Consulting
5.2
2.0
2.3
9.5
15.8
International
3.2
—
0.6
3.8
9.1
Corporate
(86.7)
—
15.2
(71.5)
(70.4)
Total Company
$ 17.0
$ 2.4
$ 27.6
$ 47.0
$ 54.3
KELLY SERVICES, INC. AND SUBSIDIARIESRECONCILIATION OF NON-GAAP MEASURESSEPTEMBER YEAR TO DATE(UNAUDITED)(In millions of dollars)
2022
Earnings from Operations:
As Reported
Gain on sale of assets(3)
Loss on disposal(4)
Goodwill impairment charge(6)
Adjusted
Professional & Industrial
$ 27.1
$ —
$ —
$ —
$ 27.1
Science, Engineering & Technology
63.9
—
—
—
63.9
Education
8.8
—
—
—
8.8
Outsourcing & Consulting
(14.9)
—
—
30.7
15.8
International
9.1
—
—
—
9.1
Corporate
(70.4)
—
—
—
(70.4)
Loss on disposal
(18.7)
18.7
—
—
Gain on sale of assets
5.3
(5.3)
—
—
—
Total Company
$ 10.2
$ (5.3)
$ 18.7
$ 30.7
$ 54.3
KELLY SERVICES, INC. AND SUBSIDIARIES
RECONCILIATION OF NON-GAAP MEASURES
(UNAUDITED)
(In millions of dollars except per share data)
Third Quarter
September Year to Date
2023
2022
2023
2022
Income tax expense (benefit)
$ (4.9)
$ (5.0)
$ (5.0)
$ (13.1)
Taxes on investment in Persol Holdings(1)
—
—
—
18.4
Taxes on foreign currency matters(2)
—
—
—
(1.5)
Taxes on gain on sale of assets(3)
—
—
—
(1.3)
Taxes on loss on disposal(4)
—
—
—
—
Taxes on asset impairment charge(5)
—
—
0.6
—
Taxes on goodwill impairment charge(6)
—
5.3
—
5.3
Taxes on restructuring charges(7)
3.9
—
6.9
—
Adjusted income tax expense
$ (1.0)
$ 0.3
$ 2.5
$ 7.8
Third Quarter
September Year to Date
2023
2022
2023
2022
Net earnings (loss)
$ 6.6
$ (16.2)
$ 25.0
$ (61.6)
Loss on investment in Persol Holdings, net of taxes(1)
—
—
—
48.8
Loss on foreign currency matters, net of taxes(2)
—
—
—
16.4
Gain on sale of assets, net of taxes(3)
—
—
—
(4.0)
Loss on disposal, net of taxes(4)
—
0.2
—
18.7
Asset impairment charge, net of taxes(5)
—
—
1.8
—
Goodwill impairment charge, net of taxes(6)
—
25.4
—
25.4
Restructuring charges, net of taxes(7)
11.5
—
20.7
—
Adjusted net earnings
$ 18.1
$ 9.4
$ 47.5
$ 43.7
Third Quarter
September Year to Date
2023
2022
2023
2022
Per Share
Per Share
Net earnings (loss)
$ 0.18
$ (0.43)
$ 0.67
$ (1.62)
Loss on investment in Persol Holdings, net of taxes(1)
—
—
—
1.28
Loss on foreign currency matters, net of taxes(2)
—
—
—
0.43
Gain on sale of assets, net of taxes(3)
—
—
—
(0.10)
Loss on disposal, net of taxes(4)
—
0.01
—
0.49
Asset impairment charge, net of taxes(5)
—
—
0.05
—
Goodwill impairment charge, net of taxes(6)
—
0.67
—
0.67
Restructuring charges, net of taxes(7)
0.32
—
0.56
—
Adjusted net earnings
$ 0.50
$ 0.25
$ 1.28
$ 1.15
Note: Earnings per share amounts for each quarter are required to be computed independently and may not equal the amounts computed for the total year.
KELLY SERVICES, INC. AND SUBSIDIARIES
RECONCILIATION OF NON-GAAP MEASURES
(UNAUDITED)
(In millions of dollars)
Third Quarter
September Year to Date
2023
2022
2023
2022
Net earnings (loss)
$ 6.6
$ (16.2)
$ 25.0
$ (61.6)
Other (income) expense, net(2)
(1.6)
(0.2)
(3.0)
(1.9)
Income tax expense (benefit)
(4.9)
(5.0)
(5.0)
(13.1)
Depreciation and amortization
8.4
8.6
25.6
24.7
EBITDA
8.5
(12.8)
42.6
(51.9)
Equity in net earnings of affiliate
—
—
—
(0.8)
Loss on investment in Persol Holdings(1)
—
—
—
67.2
Loss on foreign currency matters(2)
—
—
—
20.4
Gain on sale of assets(3)
—
—
—
(5.3)
Loss on disposal(4)
—
0.2
—
18.7
Asset impairment charge(5)
—
—
2.4
—
Goodwill impairment charge(6)
—
30.7
—
30.7
Restructuring(7)
15.4
—
27.6
—
Other, net(8)
1.6
1.0
4.3
2.5
Adjusted EBITDA
$ 25.5
$ 19.1
$ 76.9
$ 81.5
Adjusted EBITDA margin
2.3 %
1.6 %
2.1 %
2.2 %
KELLY SERVICES, INC. AND SUBSIDIARIES RECONCILIATION OF NON-GAAP MEASURES (UNAUDITED)
Management believes that the non-GAAP (Generally Accepted Accounting Principles) information excluding the 2023 restructuring charges, the 2023 impairment charge, the 2022 sale of the Persol Holdings investment, the 2022 losses on the fair value changes of the investment in Persol Holdings, the 2022 losses on foreign currency matters, the 2022 gain on sale of assets, the 2022 loss on disposal, and the 2022 goodwill impairment charge, are useful to understand the Company’s fiscal 2023 financial performance and increases comparability. Specifically, Management believes that removing the impact of these items allows for a meaningful comparison of current period operating performance with the operating results of prior periods. Management also believes that such measures are used by those analyzing performance of companies in the staffing industry to compare current performance to prior periods and to assess future performance.
Management uses Adjusted EBITDA (adjusted earnings before interest, taxes, depreciation and amortization) and Adjusted EBITDA Margin (percent of total GAAP revenue) which Management believes is useful to compare operating performance compared to prior periods and uses it in conjunction with GAAP measures to assess performance. Our calculation of Adjusted EBITDA may not be consistent with similarly titled measures of other companies and should be used in conjunction with GAAP measurements. Management also uses year-to-date free cash flow (operating cash flows less capital expenditures) to indicate the change in cash balances arising from operating activities, net of working capital needs and expenditures on fixed assets.
These non-GAAP measures may have limitations as analytical tools because they exclude items which can have a material impact on cash flow and earnings per share. As a result, Management considers these measures, along with reported results, when it reviews and evaluates the Company’s financial performance. Management believes that these measures provide greater transparency to investors and provide insight into how Management is evaluating the Company’s financial performance. Non-GAAP measures should not be considered a substitute for, or superior to, measures of financial performance prepared in accordance with GAAP.
(1) In 2022, the loss on the investment in Persol Holdings represents the change in fair value up until the date of the sale of the investment on February 15, 2022 as well as the loss on the sale of the investment during the period presented and the related tax benefit.
(2) In 2022, the loss on foreign currency matters includes a $20.4 million loss on currency translation resulting from the substantially complete liquidation of the Company’s Japan entity, partially offset by a $5.5 million foreign exchange gain on the Japan entity’s USD-denominated cash balance. The foreign exchange gain is included in other (income) expense, net in the EBITDA calculation.
(3) Gain on sale of assets in 2022 is related to the sale of under-utilized real property in the second quarter of 2022 and other real property sold in the first quarter of 2022.
(4) Loss on disposal in 2022 represents the write-off of the net assets of our Russian operations that were sold in the third quarter of 2022.
(5) Asset impairment charge in the second quarter of 2023 represents the impairment of right-of-use assets related to an unoccupied existing office space lease.
(6) Goodwill impairment charge in 2022 is the result of an interim impairment test the Company performed related to RocketPower due to a triggering event caused by changes in market conditions.
(7) Restructuring charges in the second and third quarters of 2023 relate to a comprehensive transformation initiative that includes actions that will further streamline the Company’s operating model to enhance organizational efficiency and effectiveness. These restructuring charges include $10.4 million of severance, $4.5 million of costs to execute the transformation, and $0.5 million of lease termination expenses in the third quarter of 2023 and $4.5 million of costs to execute the transformation and $1.1 million of severance in the second quarter of 2023. Restructuring charges in the first quarter of 2023 represent severance costs and lease and other terminations as a result of management undertaking actions to further our cost management efforts in response to the current demand levels and reflects a repositioning of our P&I staffing business to better capitalize on opportunities in local markets.
(8) Other, net primarily represents amortization of capitalized hosted software implementation costs.
OCU400 demonstrated favorable safety and tolerability profile in retinitis pigmentosa (RP) and Leber congenial amaurosis (LCA) subjects
Completed dosing of three LCA patients including a pediatric patient
OCU400 Phase 1/2 study results suggest stabilization or improvement of Best-Corrected Visual Acuity (BCVA) or Multi-Luminance Mobility Testing (MLMT) or Low-Luminance Visual Acuity (LLVA) in treated eyes of 83% (10/12) subjects
Stabilization or improvement in MLMT scores from baseline in 86% (6/7) of RHO subjects demonstrated gene-agnostic property of OCU400 modifier gene therapy and its potential benefits in broader RP and LCA subjects
Ocugen’s inhaled mucosal vaccine candidate for COVID-19—OCU500—selected by National Institutes of Health (NIH)/National Institute of Allergy and Infectious Diseases’ (NIAID) Project NextGen for inclusion in clinical trials
MALVERN, Pa., Nov. 09, 2023 (GLOBE NEWSWIRE) — Ocugen, Inc. (Ocugen or the Company) (NASDAQ: OCGN), a biotechnology company focused on discovering, developing, and commercializing novel gene and cell therapies, biologics, and vaccines, today reported third quarter 2023 financial results along with a general business update.
“Ocugen has made significant pipeline progress in the third quarter,” said Dr. Shankar Musunuri, Chairman, Chief Executive Officer, and Co-Founder of Ocugen. “In particular, based on the OCU400 data presented in September, I am as enthusiastic as ever regarding the potential for our modifier gene therapy approach to make an important difference in the lives of people living with blindness diseases. OCU400—our lead candidate—has the potential to address multiple genetic mutations with a single product compared to traditional gene therapies that target one gene at a time.”
This clinical efficacy update provided in September 2023 included data for 12 subjects who have completed a minimum of 6 months follow up. 83%, 83%, and 75% of subjects demonstrated stabilization or improvements in OCU400 treated eyes on BCVA, LLVA, and MLMT scores, respectively from baseline. 86% of subjects with the RHO gene mutation experienced either stabilization or increase in MLMT scores from baseline, including a subset of 29% that demonstrated a three Lux luminance level improvement. Preservation of remaining vision, slowing disease progression, or improving the vision can significantly impact patients’ quality of life.
“The improvements in BCVA, LLVA and MLMT in RHO patients—a disease affecting more than 10,000 people in the U.S. alone—supports the gene-agnostic mechanism of action for OCU400,” said Dr. Musunuri.
In October 2023, OCU500, was selected by the NIAID Project NextGen for inclusion in clinical trials. OCU500 will be tested via two different mucosal routes, inhalation into the lungs and as a nasal spray. Currently used injected vaccines, including mRNA vaccines, are not effective in preventing infection and spread although effective against severe infection. Generating mucosal immunity in nasal and respiratory airways could help block the infection at its origin, thus limiting spread.
“NIAID support for our mucosal vaccine platform is the result of many months of hard work and dedicated effort by our Ocugen team and is a first step in potentially expanding the platform to flu and other respiratory viral diseases and infections,” said Dr. Musunuri. “Additionally, this funding makes it possible to focus the majority of Ocugen’s R&D and clinical resources on our first-in-class gene and cell therapies.”
As Ocugen prepares to start Phase 3 for OCU400, begin dosing patients for OCU410 and OCU410ST, and initiate the Phase 1 trial for OCU500 in collaboration with NIAID, the company is making meaningful progress toward its long-term strategy and delivering on each of its scientific platforms in the near-term.
Ophthalmic Gene Therapies—First-in-class
OCU400 – Completed dosing adult RP patients in the dose-escalation and dose-expansion portions of the trial; completed dosing three LCA patients including a pediatric patient. Phase 3 clinical trial for the treatment of RP to be initiated in early 2024 following FDA concurrence on study design. Subsequently, the Company is expecting to expand the OCU400 Phase 3 clinical trial for LCA patients in the second half of 2024 based on Phase 1/2 study results in LCA patients and alignment with the FDA.
OCU410 and OCU410ST – IND applications to initiate Phase 1/2 trials for both OCU410 and OCU410ST were cleared by the FDA and the Company intends to dose patients in Phase 1/2 trials by the end of 2023.
Ophthalmic Biologic Product
OCU200 – Continuing to work on the Company’s response to the FDA regarding the IND application and expect to initiate the Phase 1 clinical trial in the first half of 2024, contingent on the lift of the FDA hold and adequate availability of funding.
Regenerative Cell Therapies—First-in-class
NeoCart® – Ocugen’s autologous regenerative cell therapy (using patients’ own cartilage cells) remains on track to begin its Phase 3 clinical trial in the second half of 2024. A cGMP facility for manufacturing NeoCart is expected to be completed at the end of 2023 and qualification is expected in the first half of 2024.
Vaccines Portfolio—First-in-class
Mucosal Vaccine Platform – The Company is collaborating with NIAID to initiate clinical trials of OCU500 in early 2024.
Third Quarter 2023 Financial Results
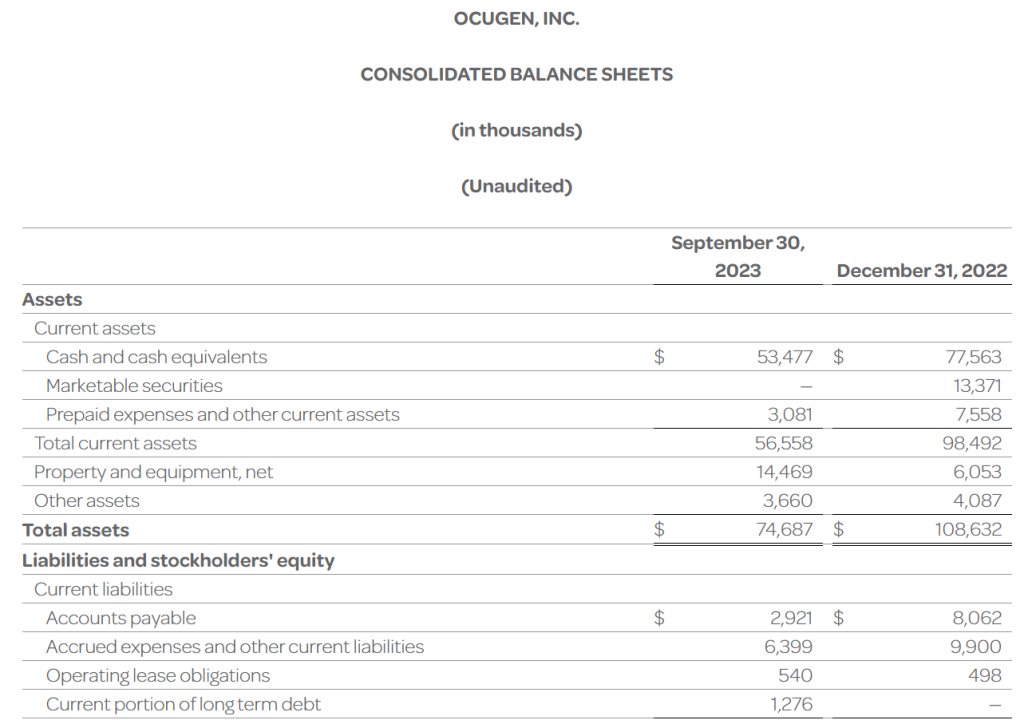
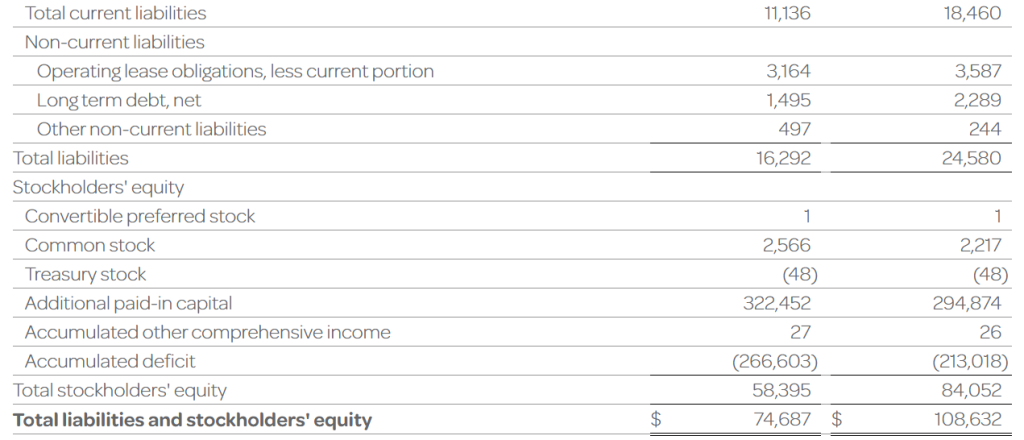
The Company’s cash, cash equivalents, and investments totaled $53.5 million as of September 30, 2023, compared to $90.9 million as of December 31, 2022. The Company had 256.5 million shares of common stock outstanding as of September 30, 2023.
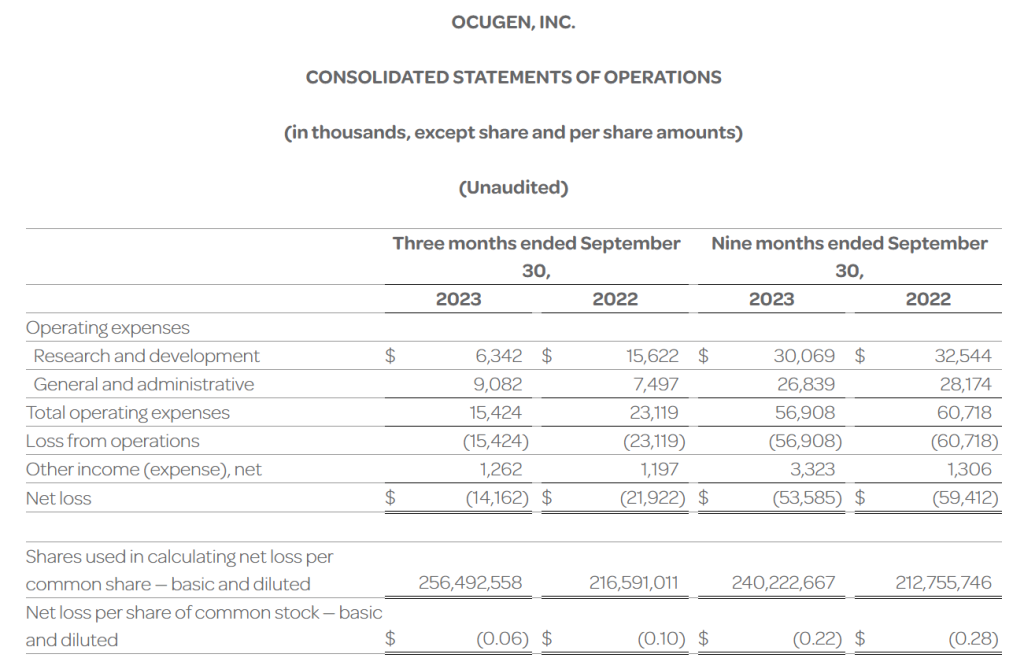
Total operating expenses for the three months ended September 30, 2023 were $15.4 million and included research and development expenses of $6.3 million and general and administrative expenses of $9.1 million. This compares to total operating expenses for the three months ended September 30, 2022 of $23.1 million that included research and development expenses of $15.6 million and general and administrative expenses of $7.5 million.
Ocugen reported a $0.06 net loss per common share for the three months ended September 30, 2023 compared to a $0.10 net loss per common share for the three months ended September 30, 2022.
Conference Call and Webcast Details
Ocugen has scheduled a conference call and webcast for 8:30 a.m. ET today to discuss the financial results and recent business highlights. Ocugen’s senior management team will host the call, which will be open to all listeners. There will also be a question-and-answer session following the prepared remarks.
Attendees are invited to participate on the call or webcast using the following details:
Dial-in Numbers: (800) 715-9871 for U.S. callers and (646) 307-1963 for international callers Conference ID: 1787631 Webcast: Available on the events section of the Ocugen investor site
A replay of the call and archived webcast will be available for approximately 45 days following the event on the Ocugen investor site.
About Ocugen, Inc. Ocugen, Inc. is a biotechnology company focused on discovering, developing, and commercializing novel gene and cell therapies, biologics, and vaccines that improve health and offer hope for patients across the globe. We are making an impact on patient’s lives through courageous innovation—forging new scientific paths that harness our unique intellectual and human capital. Our breakthrough modifier gene therapy platform has the potential to treat multiple retinal diseases with a single product, and we are advancing research in infectious diseases to support public health and orthopedic diseases to address unmet medical needs. Discover more at www.ocugen.com and follow us on X and LinkedIn.
Cautionary Note on Forward-Looking Statements This press release contains forward-looking statements within the meaning of The Private Securities Litigation Reform Act of 1995, which are subject to risks and uncertainties. We may, in some cases, use terms such as “predicts,” “believes,” “potential,” “proposed,” “continue,” “estimates,” “anticipates,” “expects,” “plans,” “intends,” “may,” “could,” “might,” “will,” “should,” or other words that convey uncertainty of future events or outcomes to identify these forward-looking statements. Such statements include, but are not limited to, statements regarding the Company’s clinical development activities and related anticipated timelines;strategy, business plans and objectives for its clinical stage programs; plans and timelines for the preclinical and clinical development of its product candidates, including the therapeutic potential, clinical benefits and safety thereof; expectations regarding timing, success and data announcements of current ongoing preclinical and clinical trials; the ability to initiate new clinical programs; and Ocugen’s financial condition. Such statements are subject to numerous important factors, risks, and uncertainties that may cause actual events or results to differ materially from our current expectations. These and other risks and uncertainties are more fully described in our periodic filings with the Securities and Exchange Commission (SEC), including the risk factors described in the section entitled “Risk Factors” in the quarterly and annual reports that we file with the SEC, as well as discussions of potential risks, uncertainties, and other important factors in Ocugen’s subsequent filings with the SEC. Any forward-looking statements that we make in this press release speak only as of the date of this press release and should not be relied upon as representing its views as of any subsequent date. Except as required by law, we assume no obligation to update forward-looking statements contained in this press release whether as a result of new information, future events, or otherwise, after the date of this press release.
Contact: Tiffany Hamilton Head of Communications IR@ocugen.com
CALGARY, AB, Nov. 8, 2023 /CNW/ – Alvopetro Energy Ltd. (TSXV: ALV) (OTCQX: ALVOF) is pleased to announce financial results for the three and nine months ended September 30, 2023 and an operational update.
All references herein to $ refer to United States dollars, unless otherwise stated and all tabular amounts are in thousands of United States dollars, except as otherwise noted.
President & CEO, Corey C. Ruttan commented:
“While sales volumes were lower in Q3 2023 due to temporary reductions in demand, we were still able to generate record operating netbacks of $70.34/boe and $9.6 million of funds flow from operations. Our production rates in October increased back up to 1,839 boepd. Capital expenditures in Q3 were focused on drilling our 183-A3 well, the first fit-for-purpose development well on our Murucututu natural gas field. The initial results from drilling are promising and we look forward to completing the well and bringing it on production later in the year.”
Operational Update
We completed drilling the 183-A3 well on our 100% owned Murucututu natural gas field in October. The well was drilled to a total measured depth of 3,540 metres and, based on open-hole logs, the well encountered potential net natural gas pay in both the Caruaçu Member of the Maracangalha Formation and the Gomo Member of the Candeias Formation, with an aggregate 127.7 metres total vertical depth of potential natural gas pay, using a 6% porosity cut-off, 50% Vshale cut-off and 50% water saturation cutoff. Subject to equipment availability and regulatory approvals, we expect to commence completion operations on the well later this month. The well will then be put on production directly into the adjacent field production facility.
October sales volumes increased to 1,839 boepd, an 8% increase from Q3 2023. October sales included natural gas sales of 10.6 MMcfpd, associated natural gas liquids sales from condensate of 67 bopd and oil sales of 8 bopd, based on field estimates.
In October we completed the BL-06 well on our Bom Lugar field and brought the well on production. October production volumes are expected to be sold in November. Based on field production data, the well is currently producing at an average of 14 bopd.
Financial and Operating Highlights – Third Quarter of 2023
With reduced offtake from Bahiagás during the quarter following reductions in end user consumption, our average daily sales decreased to 1,696 boepd (-14% from Q2 2023 and -36% from Q3 2022).
Our average realized natural gas price increased to $13.06/Mcf, a 17% increase from Q3 2022 with the 3% increase in our contracted natural gas price, enhanced sales tax credits available in 2023 and a 7% appreciation in the average BRL to USD in Q3 2023 compared to Q3 2022. With the higher natural gas price, our overall realized price per boe increased to $78.90 (+15% from Q3 2022 and +2% from Q2 2023).
Our natural gas, condensate and oil revenue was $12.3 million in Q3 2023, a decrease of $4.4 million (-26%) compared to Q3 2022 and a decrease of $1.6 million (-12%) compared to Q2 2023.
Our operating netback improved to $70.34 per boe (+$10.51 per boe from Q3 2022 and +$0.73 per boe from Q2 2023) with higher realized sales prices, partially offset by the impact of fixed operating costs with lower sales volumes.
We generated funds flows from operations of $9.6 million ($0.26 per basic and $0.25 per diluted share), a decrease of $3.7 million compared to Q3 2022 and $1.4 million compared to Q2 2023.
We reported net income of $5.8 million in Q3 2023, a decrease of $3.0 million (-34%) compared to Q3 2022 and $4.0 million (-41%) compared to Q2 2023.
Capital expenditures totaled $10.7 million, including drilling costs for the 183-A3 well on our Murucututu natural gas field, drilling and completion costs for the BL-06 well on our Bom Lugar field, and long-lead purchases for future capital projects.
Our working capital surplus was $11.4 million as of September 30, 2023, decreasing $6.7 million from June 30, 2023 and $3.3 million from December 31, 2022.
The following table provides a summary of Alvopetro’s financial and operating results for three and nine months ended September 30, 2023 and September 30, 2022. The consolidated financial statements with the Management’s Discussion and Analysis (“MD&A”) are available on our website at www.alvopetro.com and will be available on the SEDAR+ website at www.sedarplus.ca.
As at and Three Months EndedSeptember 30,
As at and Nine Months EndedSeptember 30,
2023
2022
Change (%)
2023
2022
Change (%)
Financial
($000s, except where noted)
Natural gas, oil and condensate sales
12,313
16,672
(26)
44,387
46,431
(4)
Net income
5,819
8,795
(34)
27,873
26,541
5
Per share – basic ($)(1)
0.16
0.26
(38)
0.75
0.78
(4)
Per share – diluted ($)(1)
0.15
0.24
(38)
0.74
0.72
3
Cash flows from operating activities
12,469
13,838
(10)
39,798
35,168
13
Per share – basic ($)(1)
0.34
0.40
(15)
1.07
1.03
4
Per share – diluted ($)(1)
0.33
0.37
(11)
1.05
0.96
9
Funds flow from operations (2)
9,618
13,348
(28)
35,637
36,686
(3)
Per share – basic ($)(1)
0.26
0.39
(33)
0.96
1.08
(11)
Per share – diluted ($)(1)
0.25
0.36
(31)
0.94
1.00
(6)
Dividends declared
5,122
2,896
77
15,335
8,340
84
Per share(1)
0.14
0.08
75
0.42
0.24
75
Capital expenditures
10,703
8,713
23
22,515
18,851
19
Cash and cash equivalents
22,779
17,380
31
22,779
17,380
31
Net working capital surplus(2)
11,392
12,225
(7)
11,392
12,225
(7)
Weighted average shares outstanding
Basic (000s)(1)
37,138
34,434
8
37,086
34,107
9
Diluted (000s)(1)
37,868
36,939
3
37,748
36,693
3
Operations
Natural gas, NGLs and crude oil sales:
Natural gas (Mcfpd), by field:
Caburé (Mcfpd)
8,949
15,139
(41)
11,757
14,344
(18)
Murucututu (Mcfpd)
726
–
–
467
–
–
Total natural gas (Mcfpd)
9,675
15,139
(36)
12,224
14,344
(15)
NGLs – condensate (bopd)
81
117
(31)
101
104
(3)
Oil (bopd)
3
2
50
4
6
(33)
Total (boepd)
1,696
2,642
(36)
2,142
2,501
(14)
Average realized prices(2):
Natural gas ($/Mcf)
13.06
11.18
17
12.57
11.03
14
NGLs – condensate ($/bbl)
89.43
101.57
(12)
85.31
109.38
(22)
Oil ($/bbl)
73.08
80.92
(10)
69.18
83.59
(17)
Total ($/boe)
78.90
68.59
15
75.90
68.00
12
Operating netback ($/boe)(2)
Realized sales price
78.90
68.59
15
75.90
68.00
12
Royalties
(2.04)
(5.42)
(62)
(2.14)
(5.05)
(58)
Production expenses
(6.52)
(3.34)
95
(5.22)
(3.77)
38
Operating netback
70.34
59.83
18
68.54
59.18
16
Operating netback margin(2)
89 %
87 %
2
90 %
87 %
3
Notes:
(1)
Per share amounts are based on weighted average shares outstanding other than dividends per share, which is based on the number of common shares outstanding at each dividend record date. The weighted average number of diluted common shares outstanding in the computation of funds flow from operations and cash flows from operating activities per share is the same as for net income per share.
(2)
See “Non-GAAP and Other Financial Measures” section within this news release.
Q3 2023 Results Webcast
Alvopetro will host a live webcast to discuss our Q3 2023 financial results at 9:00 am Mountain time on Thursday November 9, 2023. Details for joining the event are as follows:
The webcast will include a question and answer period. Online participants will be able to ask questions through the Zoom portal. Dial-in participants can email questions directly to socialmedia@alvopetro.com.
Long-term Incentive Compensation Grants
In connection with our long-term incentive compensation program, Alvopetro’s Board of Directors (the “Board”) has approved the annual rolling grants to officers, directors and certain employees under Alvopetro’s Omnibus Incentive Plan. A total of 638,000 stock options, 107,000 restricted share units (“RSUs”) and 31,000 deferred share units (“DSUs”) were approved by the Board and are expected to be granted on November 17, 2023. Of the total grants, 271,000 stock options, 70,000 RSUs and 31,000 DSUs will be granted to directors and officers. Each stock option, RSU and DSU entitles the holder to purchase one common share. Each stock option granted will have an exercise price based on the volume weighted average trading price of Alvopetro’s shares on the TSX Venture Exchange for the five (5) consecutive trading days up to and including November 17, 2023. All stock options granted expire five (5) years from the date of the grant. All RSUs and DSUs granted expire ten (10) years from the date of the grant.
Alvopetro Energy Ltd.’svision is to become a leading independent upstream and midstream operator in Brazil. Our strategy is to unlock the on-shore natural gas potential in the state of Bahia in Brazil, building off the development of our Caburé and Murucututu natural gas fields and our strategic midstream infrastructure.
Neither the TSX Venture Exchange nor its Regulation Services Provider (as that term is defined in the policies of the TSX Venture Exchange) accepts responsibility for the adequacy or accuracy of this news release.
Abbreviations:
$000s
=
thousands of U.S. dollars
bbls
=
barrels
boepd
=
barrels of oil equivalent (“boe”) per day
bopd
=
barrels of oil and/or natural gas liquids (condensate) per day
BRL
=
Brazilian Real
Mcf
=
thousand cubic feet
Mcfpd
=
thousand cubic feet per day
MMcf
=
million cubic feet
MMcfpd
=
million cubic feet per day
NGLs
=
natural gas liquids
Q2 2023
=
three months ended June 30, 2023
Q3 2022
=
three months ended September 30, 2022
Q3 2023
=
three months ended September 30, 2023
USD
=
United States dollars
Non-GAAP and Other Financial Measures
This news release contains references to various non-GAAP financial measures, non-GAAP ratios, capital management measures and supplementary financial measures as such terms are defined in National Instrument 52-112 Non-GAAP and Other Financial Measures Disclosure. Such measures are not recognized measures under GAAP and do not have a standardized meaning prescribed by IFRS and might not be comparable to similar financial measures disclosed by other issuers. While these measures may be common in the oil and gas industry, the Company’s use of these terms may not be comparable to similarly defined measures presented by other companies. The non-GAAP and other financial measures referred to in this report should not be considered an alternative to, or more meaningful than measures prescribed by IFRS and they are not meant to enhance the Company’s reported financial performance or position. These are complementary measures that are used by management in assessing the Company’s financial performance, efficiency and liquidity and they may be used by investors or other users of this document for the same purpose. Below is a description of the non-GAAP financial measures, non-GAAP ratios, capital management measures and supplementary financial measures used in this news release. For more information with respect to financial measures which have not been defined by GAAP, including reconciliations to the closest comparable GAAP measure, see the “Non-GAAP Measures and Other Financial Measures” section of the Company’s MD&A which may be accessed through the SEDAR+ website at www.sedarplus.ca.
Non-GAAP Financial Measures
Operating netback
Operating netback is calculated as natural gas, oil and condensate revenues less royalties and production expenses. This calculation is provided in the “Operating Netback” section of the Company’s MD&A using our IFRS measures. The Company’s MD&A may be accessed through the SEDAR+ website at www.sedarplus.ca. Operating netback is a common metric used in the oil and gas industry used to demonstrate profitability from operations.
Non-GAAP Financial Ratios
Operating netback per boe
Operating netback is calculated on a per unit basis, which is per barrel of oil equivalent (“boe”). It is a common non-GAAP measure used in the oil and gas industry and management believes this measurement assists in evaluating the operating performance of the Company. It is a measure of the economic quality of the Company’s producing assets and is useful for evaluating variable costs as it provides a reliable measure regardless of fluctuations in production. Alvopetro calculated operating netback per boe as operating netback divided by total sales volumes (barrels of oil equivalent). This calculation is provided in the “Operating Netback” section of the Company’s MD&A using our IFRS measures. The Company’s MD&A may be accessed through the SEDAR+ website at www.sedarplus.ca. Operating netback is a common metric used in the oil and gas industry used to demonstrate profitability from operations on a per unit basis (boe).
Operating netback margin
Operating netback margin is calculated as operating netback per boe divided by the realized sales price per boe. Operating netback margin is a measure of the profitability per boe relative to natural gas, oil and condensate sales revenues per boe and is calculated as follows:
Three Months Ended September 30,
Nine Months EndedSeptember 30,
2023
2022
2023
2022
Operating netback – $ per boe
70.34
59.83
68.54
59.18
Average realized price – $ per boe
78.90
68.59
75.90
68.00
Operating netback margin
89 %
87 %
90 %
87 %
Funds Flow from Operations Per Share
Funds flow from operations per share is a non-GAAP ratio that includes all cash generated from operating activities and is calculated before changes in non-cash working capital, divided by the weighted the weighted average shares outstanding for the respective period. For the periods reported in this news release the cash flows from operating activities per share and funds flow from operations per share is as follows:
Three Months EndedSeptember 30,
Nine Months EndedSeptember 30,
$ per share
2023
2022
2023
2022
Per basic share:
Cash flows from operating activities
0.34
0.40
1.07
1.03
Funds flow from operations
0.26
0.39
0.96
1.08
Per diluted share:
Cash flows from operating activities
0.33
0.37
1.05
0.96
Funds flow from operations
0.25
0.36
0.94
1.00
Capital Management Measures
Funds Flow from Operations
Funds flow from operations is a non-GAAP capital management measure that includes all cash generated from operating activities and is calculated before changes in non-cash working capital. The most comparable GAAP measure to funds flow from operations is cash flows from operating activities. Management considers funds flow from operations important as it helps evaluate financial performance and demonstrates the Company’s ability to generate sufficient cash to fund future growth opportunities. Funds flow from operations should not be considered an alternative to, or more meaningful than, cash flows from operating activities however management finds that the impact of working capital items on the cash flows reduces the comparability of the metric from period to period. A reconciliation of funds flow from operations to cash flows from operating activities is as follows:
Three Months Ended September 30,
Nine Months EndedSeptember 30,
2023
2022
2023
2022
Cash flows from operating activities
12,469
13,838
39,798
35,168
(Deduct) add back changes in non-cash working capital
(2,851)
(490)
(4,161)
1,518
Funds flow from operations
9,618
13,348
35,637
36,686
Net Working Capital
Net working capital is computed as current assets less current liabilities. Net working capital is a measure of liquidity, is used to evaluate financial resources, and is calculated as follows:
As at September 30,
2023
2022
Total current assets
27,354
24,545
Total current liabilities
(15,962)
(12,320)
Net working capital
11,392
12,225
Supplementary Financial Measures
“Average realized natural gas price – $/Mcf” is comprised of natural gas sales as determined in accordance with IFRS, divided by the Company’s natural gas sales volumes.
“Average realized NGL – condensate price – $/bbl” is comprised of condensate sales as determined in accordance with IFRS, divided by the Company’s NGL sales volumes from condensate.
“Average realized oil price – $/bbl” is comprised of oil sales as determined in accordance with IFRS, divided by the Company’s oil sales volumes.
“Average realized price – $/boe” is comprised of natural gas, condensate and oil sales as determined in accordance with IFRS, divided by the Company’s total natural gas, NGL and oil sales volumes (barrels of oil equivalent).
“Dividends per share” is comprised of dividends declared, as determined in accordance with IFRS, divided by the number of shares outstanding at the dividend record date.
“Royalties per boe” is comprised of royalties, as determined in accordance with IFRS, divided by the total natural gas, NGL and oil sales volumes (barrels of oil equivalent).
“Production expenses per boe” is comprised of production expenses, as determined in accordance with IFRS, divided by the total natural gas, NGL and oil sales volumes (barrels of oil equivalent).
BOE Disclosure
The term barrels of oil equivalent (“boe”) may be misleading, particularly if used in isolation. A boe conversion ratio of six thousand cubic feet per barrel (6 Mcf/bbl) of natural gas to barrels of oil equivalence is based on an energy equivalency conversion method primarily applicable at the burner tip and does not represent a value equivalency at the wellhead. All boe conversions in this news release are derived from converting gas to oil in the ratio mix of six thousand cubic feet of gas to one barrel of oil.
Testing and Well Results
Data obtained from the 183-A3 well identified in this press release, including hydrocarbon shows, open-hole logging, net pay and porosities should be considered to be preliminary until testing, detailed analysis and interpretation has been completed. Hydrocarbon shows can be seen during the drilling of a well in numerous circumstances and do not necessarily indicate a commercial discovery or the presence of commercial hydrocarbons in a well. There is no representation by Alvopetro that the data relating to the 183-A3 well contained in this press release is necessarily indicative of long-term performance or ultimate recovery. The reader is cautioned not to unduly rely on such data as such data may not be indicative of future performance of the well or of expected production or operational results for Alvopetro in the future.
Forward-Looking Statements and Cautionary Language
This news release contains forward-looking information within the meaning of applicable securities laws. The use of any of the words “will”, “expect”, “intend” and other similar words or expressions are intended to identify forward-looking information. Forward‐looking statements involve significant risks and uncertainties, should not be read as guarantees of future performance or results, and will not necessarily be accurate indications of whether or not such results will be achieved. A number of factors could cause actual results to vary significantly from the expectations discussed in the forward-looking statements. These forward-looking statements reflect current assumptions and expectations regarding future events. Accordingly, when relying on forward-looking statements to make decisions, Alvopetro cautions readers not to place undue reliance on these statements, as forward-looking statements involve significant risks and uncertainties. More particularly and without limitation, this news release contains forward-looking statements concerning potential net natural gas pay in the 183-A3 well, the timing of competion of the 183-A3 well, anticipated timing of commencing production from the 183-A3 well, expectations regarding future development plans for the Murucututu natural gas field , plans relating to the Company’s operational activities, proposed exploration development activities and the timing for such activities, exploration and development prospects of Alvopetro, capital spending levels, future capital and operating costs, future production and sales volumes, production allocations from the Caburé natural gas field, the expected natural gas price, gas sales and gas deliveries under Alvopetro’s long-term gas sales agreement, anticipated timing for upcoming drilling and testing of other wells, projected financial results, the expected timing and outcomes of certain of Alvopetro’s testing activities, and sources and availability of capital. Forward-looking statements are necessarily based upon assumptions and judgments with respect to the future including, but not limited to, expectations and assumptions concerning the timing of regulatory licenses and approvals, equipment availability, the success of future drilling, completion, testing, recompletion and development activities and the timing of such activities, the performance of producing wells and reservoirs, well development and operating performance, expectations regarding Alvopetro’s working interest and the outcome of any redeterminations, environmental regulation, including regulation relating to hydraulic fracturing and stimulation, the ability to monetize hydrocarbons discovered, the outlook for commodity markets and ability to access capital markets, foreign exchange rates, general economic and business conditions, forecasted demand for oil and natural gas, the impact of global pandemics, weather and access to drilling locations, the availability and cost of labour and services, the regulatory and legal environment and other risks associated with oil and gas operations. The reader is cautioned that assumptions used in the preparation of such information, although considered reasonable at the time of preparation, may prove to be incorrect. Actual results achieved during the forecast period will vary from the information provided herein as a result of numerous known and unknown risks and uncertainties and other factors. In addition, the declaration, timing, amount and payment of future dividends remain at the discretion of the Board of Directors. Although we believe that the expectations and assumptions on which the forward-looking statements are based are reasonable, undue reliance should not be placed on the forward-looking statements because we can give no assurance that they will prove to be correct. Since forward looking statements address future events and conditions, by their very nature they involve inherent risks and uncertainties. Actual results could differ materially from those currently anticipated due to a number of factors and risks. These include, but are not limited to, risks associated with the oil and gas industry in general (e.g., operational risks in development, exploration and production; delays or changes in plans with respect to exploration or development projects or capital expenditures; the uncertainty of reserve estimates; the uncertainty of estimates and projections relating to production, costs and expenses, reliance on industry partners, availability of equipment and personnel, uncertainty surrounding timing for drilling and completion activities resulting from weather and other factors, changes in applicable regulatory regimes and health, safety and environmental risks), commodity price and foreign exchange rate fluctuations, market uncertainty associated with financial institution instability, and general economic conditions. The reader is cautioned that assumptions used in the preparation of such information, although considered reasonable at the time of preparation, may prove to be incorrect. Although Alvopetro believes that the expectations and assumptions on which such forward-looking information is based are reasonable, undue reliance should not be placed on the forward-looking information because Alvopetro can give no assurance that it will prove to be correct. Readers are cautioned that the foregoing list of factors is not exhaustive. Additional information on factors that could affect the operations or financial results of Alvopetro are included in our annual information form which may be accessed on Alvopetro’s SEDAR+ profile at www.sedarplus.ca. The forward-looking information contained in this news release is made as of the date hereof and Alvopetro undertakes no obligation to update publicly or revise any forward-looking information, whether as a result of new information, future events or otherwise, unless so required by applicable securities laws.
All amounts expressed are in U.S. dollars, denominated by “$”
TORONTO–(BUSINESS WIRE)– Largo Inc. (“Largo” or the “Company“) (TSX: LGO) (NASDAQ: LGO) today announces its third quarter 2023 financial results.
Largo Reports Third Quarter 2023 Financial Results; Announces First Commercial Shipment of Ilmenite as By-Product of its Vanadium Operations in Brazil (Photo: Business Wire)
Q3 2023 and Other Highlights
Revenues of $44.0 million vs. revenues of $54.3 million in Q3 2022; Decline driven by lower vanadium prices and lower vanadium sales volumes; Revenues per lb sold3 of V2O5 equivalent of $8.34 vs. $8.80 in Q3 2022
Operating costs of $42.5 million vs. $45.6 million in Q3 2022; Cash operating costs excluding royalties1 per pound sold of $5.44 vs. 4.86 per lb sold in Q3 2022
Net loss of $11.9 million vs. net loss of $2.6 million in Q3 2022; Basic loss per share of $0.19 vs. basic loss per share of $0.04 in Q3 2022
Cash used before working capital items of $4.4 million vs. cash provided before working capital items of $4.3 million in Q3 2022
Cash balance of $39.5 million, net working capital surplus of $91.0 million and debt of $65.0 million exiting Q3 2023
V2O5 equivalent sales of 2,385 tonnes (inclusive of 256 tonnes of purchased material) vs. 2,796 tonnes (inclusive of 351 tonnes of purchased material) sold in Q3 2022
Production of 2,163 tonnes (4.8 million lbs1) of V2O5 vs. 2.906 tonnes in Q3 2022
Largo Clean Energy’s (“LCE”) 6 megawatt-hour (“MWh”) vanadium redox flow battery (“VRFB”) deployment for Enel Green Power España (“EGPE”) was validated to operate on test conditions according to EGPE specifications and LCE test procedures in October
The Company successfully commissioned and is in the process of ramping up production of its new ilmenite concentrate plant with initial production of 350 tonnes in August and 700 tonnes in September; The first commercial shipment of ilmenite is in progress and should contribute to the Company’s revenues in Q4 2023 as a by-product of its vanadium operations
Q3 2023 results conference call: Thursday, November 9th at 1:00 p.m. ET
Vanadium Market Update2
The average benchmark price per lb of V2O5 in Europe was $8.03, a 2.5% decrease from the average of $8.23 seen in Q3 2022
Vanadium spot demand was soft in Q3 2023, primarily due to adverse conditions in the Chinese and European steel industries. However, strong demand growth from the aerospace and energy storage sectors continued
Daniel Tellechea, Director and Interim CEO of Largo commented: “Q3 2023 was a challenging quarter for Largo, primarily due to the tragic accident that occurred at the Company’s chemical plant in July as well as technical delays in commissioning our new crushing plant. The accident at the chemical plant resulted in a capacity bottleneck in the evaporator section of the plant, which resulted in lower overall production rates of vanadium in July and August. In early September, our operating team recommissioned the evaporator circuit, which is now operating at its original capacity. A delay in ramp up of the new magnetic separation crushing plant also temporarily impacted vanadium production in Q3 2023. The new crushing plant was designed to offset the impact of lower mined vanadium grades, as per the Company’s mine plan. The operating team is in the process of resolving these issues, and we are pleased to report that the crushing plant exceeded 1,000 tonnes of contained V2O5 in October, despite additional crushing plant improvements scheduled to be implemented in November and December.”
He continued: “It is our priority to continue to optimize our operations, reduce costs, and achieve production and sales targets safely. In light of this, we maintain our guidance for 2023. Additionally, further measures are being implemented to improve the organization’s performance, including optimizing operational efficiencies through the implementation of the new crushing system, concentrating on increasing production of high purity vanadium, restructuring equipment maintenance processes to further reduce costs, and ramping up ilmenite production starting in the fourth quarter of 2023 to diversify revenues. We are beginning to see a notable reduction in key consumable costs, such as sodium carbonate, as well as ongoing overhead cost reductions through a reduction of the number of contractors at the mine through efficiency improvement programs and further reductions in the headcount at LCE. The Company considers these ongoing initiatives to be a vitally important measures to counter the current decrease in vanadium prices.”
He concluded: “During this past year, we have also made several significant investments that are necessary for the sustainability of our operations in a lower vanadium price environment. Among these investments are an increased waste rock pre-stripping and aggressive infill drilling program to optimize production in the years to come. Our team has successfully built and commissioned an ilmenite plant to diversify future revenues as a by-product of the vanadium mine, built a new magnetic separation crushing plant for the purpose of mining lower-grade material without reducing production levels, and delivered the Company’s first vanadium battery to EGPE, our European energy storage customer. A substantial investment has been made in LCE, which is not yet generating significant revenues, but continues to consume cash. With our current strategic review process in place, Largo expects to optimize the value proposition of LCE and participate in one of the most significant macrotrends, the clean energy transition with vanadium as a critical material. With these investments, we believe that Largo is on the path to a brighter future.”
Financial and Operating Results – Highlights
(thousands of U.S. dollars, except as otherwise stated)
Three months ended
Nine months ended
Sept. 30, 2023
Sept. 30, 2022
Sept. 30, 2023
Sept. 30, 2022
Revenues
43,983
54,258
154,514
181,750
Operating costs
(42,580)
(45,602)
(131,540)
(125,264)
Net income (loss)
(11,884)
(2,601)
(19,057)
13,410
Basic earnings (loss) per share
(0.19)
(0.04)
(0.30)
0.21
Cash (used) provided before working capital items
(4,360)
4,328
7,631
35,479
Cash operating costs excl. royalties3 ($/lb)
5.44
4.86
5.25
4.37
Cash
39,572
62,713
39,572
62,713
Debt
65,000
15,000
65,000
15,000
Total mined – dry basis (tonnes)
6,406,626
4,178,185
11,373,683
7,780,061
Total ore mined (tonnes)
447,165
351,450
1,279,024
1,033,375
Effective grade4 of ore milled (%)
0.94
1.28
1.04
1.32
V2O5 equivalent produced (tonnes)
2,163
2,906
6,913
8,432
Q3 2023 Notes
The decrease in operating costs in Q3 2023 is largely attributable to lower overall sales in the period, which includes a reduction in the sale of purchased products and lower royalties due to lower sales.
V2O5 equivalent production of 2,163 tonnes in Q3 2023 decreased from 2,639 tonnes produced in Q2 2023. Production in July 2023 was 644 tonnes, with 775 tonnes produced in August and 744 tonnes produced in September, for a total of 2,163 tonnes of V2O5 equivalent produced. July and August production were negatively impacted as a result of the chemical plant operating at limited capacity due to the accident in the evaporation section of the plant in July 2023. In addition, September production was negatively impacted by low availability of the crushing circuit, combined with the planned lower vanadium grade of ore mined. V2O5 production in October continued to improve with 866 tonnes produced.
The Company is actively working to achieve higher levels of operational stability to better manage its costs which have increased due in part to lower grades of ore mined as compared with prior quarters. The lower grade of ore mined in Q3 2023 was according to plan, representing a 27% decrease year-over-year. The Company is actively working towards increasing the availability of its new crushing system to offset lowers grades of ore mined and reach production of 1,000 tonnes of V2O5 per month in future months.
Total mined (dry basis) of 6.4 million tonnes increased by 53% and total ore mined of 447,165 tonnes was 27% higher than Q3 2022, respectively. Increased mining rates and higher mining costs impacted the Company’s financial performance in Q3 2023.
As part of its ongoing mitigation efforts, the Company is focused on reducing its fixed cost structure through contract renegotiations and an optimization of key operational areas, including mining, maintenance, equipment rental and consumables.
The commissioning and ramp up of the ilmenite plant commenced in Q3 2023 with production of 350 tonnes in August and 700 tonnes in September. The Company expects the ramp up to conclude in Q2 2024 with revenue expectations in Q4 2023.
Exploration and evaluation costs of $2.3 million increased by $1.8 million from Q3 2022. This was driven by infill drilling and geological model work at the Maracás Menchen Mine and diamond drilling at Campo Alegre de Lourdes to support the maintenance of the Company’s mineral rights. During Q3 2023, the Company completed approximately 9,100 metres of diamond drilling in the near mine deep drilling and exploration program. In the nine months ended September 30, 2023, approximately 19,100 metres of diamond drillholes have been completed in Campo Alegre de Lourdes and Maracas targets. A re-assay program began in Q2 2023 to perform chemical analysis on previously interpreted results. The focus of this program is to increase measured and indicated resources. Approximately 5,000 samples were prepared and sent to the external laboratory for analysis in Q3 2023.
The information provided within this release should be read in conjunction with Largo’s unaudited condensed interim consolidated financial statements for the three and nine months ended September 30, 2023 and 2022 and its management’s discussion and analysis (“MD&A”) for the three and nine months ended September 30, 2023 which are available on our website at www.largoinc.com or on the Company’s respective profiles at www.sedarplus.com and www.sec.gov.
About Largo
Largo is a globally recognized vanadium company known for its high-quality VPURE™ and VPURE+™ products, sourced from its Maracás Menchen Mine in Brazil. The Company is currently focused on implementing an ilmenite concentrate plant and is undertaking a strategic evaluation of its U.S.-based clean energy business, including its advanced VCHARGE vanadium battery technology to maximize the value of the organization. Largo’s strategic business plan centers on maintaining its position as a leading vanadium supplier with a growth strategy to support a low-carbon future.
Largo’s common shares trade on the Nasdaq Stock Market and on the Toronto Stock Exchange under the symbol “LGO”. For more information on the Company, please visit www.largoinc.com.
This press release contains “forward-looking information” and “forward-looking statements” within the meaning of applicable Canadian and United States securities legislation. Forward-looking information in this press release includes, but is not limited to, statements with respect to the timing and amount of estimated future production and sales; the future price of commodities; costs of future activities and operations, including, without limitation, achieving operational stability and managing unit costs; and the expected completion of the ilmenite plan ramp up in Q4 2023.
The following are some of the assumptions upon which forward-looking information is based: that general business and economic conditions will not change in a material adverse manner; demand for, and stable or improving price of V2O5, other vanadium products, ilmenite and titanium dioxide pigment; receipt of regulatory and governmental approvals, permits and renewals in a timely manner; that the Company will not experience any material accident, labour dispute or failure of plant or equipment or other material disruption in the Company’s operations at the Maracás Menchen Mine or relating to Largo Clean Energy; the availability of financing for operations and development; the availability of funding for future capital expenditures; the ability to replace current funding on terms satisfactory to the Company; the ability to mitigate the impact of heavy rainfall; the reliability of production, including, without limitation, access to massive ore, the Company’s ability to procure equipment, services and operating supplies in sufficient quantities and on a timely basis; that the estimates of the resources and reserves at the Maracás Menchen Mine are within reasonable bounds of accuracy (including with respect to size, grade and recovery and the operational and price assumptions on which such estimates are based); the accuracy of the Company’s mine plan at the Maracás Menchen Mine, the competitiveness of the Company’s vanadium redox flow battery (“VRFB“) technology; the ability to obtain funding through government grants and awards for the Green Energy sector, the accuracy of cost estimates and assumptions on future variations of VCHARGE battery system design, that the Company’s current plans for ilmenite and VRFBs can be achieved; the Company’s “two-pillar” business strategy will be successful; the Company’s sales and trading arrangements will not be affected by the evolving sanctions against Russia; and the Company’s ability to attract and retain skilled personnel and directors; the ability of management to execute strategic goals.
Forward-looking statements can be identified by the use of forward-looking terminology such as “plans”, “expects” or “does not expect”, “is expected”, “budget”, “scheduled”, “estimates”, “forecasts”, “intends”, “anticipates” or “does not anticipate”, or “believes”, or variations of such words and phrases or statements that certain actions, events or results “may”, “could”, “would”, “might” or “will be taken”, “occur” or “be achieved”. All information contained in this news release, other than statements of current and historical fact, is forward looking information. Forward-looking statements are subject to known and unknown risks, uncertainties and other factors that may cause the actual results, level of activity, performance or achievements of Largo to be materially different from those expressed or implied by such forward-looking statements, including but not limited to those risks described in the annual information form of Largo and in its public documents filed on www.sedarplus.caand available on www.sec.govfrom time to time. Forward-looking statements are based on the opinions and estimates of management as of the date such statements are made. Although management of Largo has attempted to identify important factors that could cause actual results to differ materially from those contained in forward-looking statements, there may be other factors that cause results not to be as anticipated, estimated or intended. There can be no assurance that such statements will prove to be accurate, as actual results and future events could differ materially from those anticipated in such statements. Accordingly, readers should not place undue reliance on forward-looking statements. Largo does not undertake to update any forward-looking statements, except in accordance with applicable securities laws. Readers should also review the risks and uncertainties sections of Largo’s annual and interim MD&A which also apply.
Trademarks are owned by Largo Inc.
Non-GAAP5 Measures
The Company uses certain non-GAAP measures in this press release, which are described in the following section. Non-GAAP financial measures and non-GAAP ratios are not standardized financial measures under IFRS, the Company’s GAAP, and might not be comparable to similar financial measures disclosed by other issuers. These measures are intended to provide additional information and should not be considered in isolation or as a substitute for measures of performance prepared in accordance with IFRS.
Revenues Per Pound
This press release refers to revenues per pound sold, a non-GAAP performance measure that is used to provide investors with information about a key measure used by management to monitor performance of the Company.
This measure, along with cash operating costs and total cash costs, is considered to be one of the key indicators of the Company’s ability to generate operating earnings and cash flow from its Maracás Menchen Mine and sales activities. This revenues per pound measure does not have any standardized meaning prescribed by IFRS and differs from measures determined in accordance with IFRS. This measure is intended to provide additional information and should not be considered in isolation or as a substitute for measures of performance prepared in accordance with IFRS. This measure is not necessarily indicative of net earnings or cash flow from operating activities as determined under IFRS.
The following table provides a reconciliation of this measure per pound sold to revenues as per the Q3 2022 unaudited condensed interim consolidated financial statements.
Three months ended
Nine months ended
September 30, 2023
September 30, 2022
September 30, 2023
September 30, 2022
Revenues – V2O5 produced1
$
25,268
$
30,831
$
90,352
$
98,621
V2O5 sold – produced (000s lb)
3,017
3,745
9,898
10,824
V2O5 revenues per pound of V2O5 sold – produced ($/lb)
$
8.38
$
8.23
$
9.13
$
9.11
Revenues – V2O5 purchased1
$
2,066
$
1,655
$
7,531
$
3,184
V2O5 sold – purchased (000s lb)
309
207
1,014
339
V2O5 revenues per pound of V2O5 sold – purchased ($/lb)
$
6.69
$
8.00
$
7,43
$
9.39
Revenues – V2O51
$
27,334
$
32,486
$
97,883
$
101,805
V2O5 sold (000s lb)
3,326
3,952
10,912
11,163
V2O5 revenues per pound of V2O5 sold ($/lb)
$
8.22
$
8.22
$
8.97
$
9.12
Revenues – V2O3 produced1
$
3,734
$
3,798
$
7,575
$
3,798
V2O3 sold – produced (000s lb)
308
308
619
308
V2O3 revenues per pound of V2O3 sold – produced ($/lb)
$
12.12
$
12.33
$
12.24
$
12.33
Revenues – V2O3 purchased1
$
—
$
482
$
1,155
$
482
V2O3 sold – purchased (000s lb)
—
43
88
43
V2O3 revenues per pound of V2O3 sold – purchased ($/lb)
$
—
$
11.21
$
13.13
$
11.21
Revenues – V2O31
$
3,734
$
4,280
$
8,730
$
4,280
V2O3 sold (000s lb)
308
350
707
350
V2O3 revenues per pound of V2O3 sold ($/lb)
$
12.12
$
12.23
$
12.35
$
12.23
Revenues – FeV produced1
$
11,750
$
12,756
$
46,408
$
54,667
FeV sold – produced (000s kg)
444
394
1,591
1,576
FeV revenues per kg of FeV sold – produced ($/kg)
$
26.46
$
32.38
$
29.17
$
34.69
Revenues – FeV purchased1
$
1,058
$
4,736
$
1,386
$
20,998
FeV sold – purchased (000s kg)
39
159
50
516
FeV revenues per kg of FeV sold – purchased ($/kg)
$
27.13
$
29.79
$
27.72
$
40.69
Revenues – FeV1
$
12,808
$
17,492
$
47,794
$
75,665
FeV sold (000s kg)
483
553
1,641
2,092
FeV revenues per kg of FeV sold ($/kg)
$
26.52
$
31.63
$
29,12
$
36.17
Revenues1
$
43,876
$
54,258
$
154,407
$
181,750
V2O5 equivalent sold (000s lb)
5,259
6,164
17,177
18,340
Revenues per pound sold ($/lb)
$
8.34
$
8.80
$
8.99
$
9.91
1. As per note 18 of the Company’s Q3 2023 unaudited condensed interim consolidated financial statements.
Cash Operating Costs Per Pound
The Company’s MD&A refers to cash operating costs per pound and cash operating costs excluding royalties per pound, which are non-GAAP ratios based on cash operating costs and cash operating costs excluding royalties, which are non-GAAP financial measures, in order to provide investors with information about a key measure used by management to monitor performance. This information is used to assess how well the Maracás Menchen Mine is performing compared to plan and prior periods, and also to assess its overall effectiveness and efficiency.
Cash operating costs includes mine site operating costs such as mining costs, plant and maintenance costs, sustainability costs, mine and plant administration costs, royalties and sales, general and administrative costs (all for the Mine properties segment), but excludes depreciation and amortization, share-based payments, foreign exchange gains or losses, commissions, reclamation, capital expenditures and exploration and evaluation costs. Operating costs not attributable to the Mine properties segment are also excluded, including conversion costs, product acquisition costs, distribution costs and inventory write-downs.
Cash operating costs excluding royalties is calculated as cash operating costs less royalties. Cash operating costs per pound and cash operating costs excluding royalties per pound are obtained by dividing cash operating costs and cash operating costs excluding royalties, respectively, by the pounds of vanadium equivalent sold that were produced by the Maracás Menchen Mine. Cash operating costs, cash operating costs excluding royalties, cash operating costs per pound and cash operating costs excluding royalties per pound, along with revenues, are considered to be key indicators of the Company’s ability to generate operating earnings and cash flow from its Maracás Menchen Mine. These measures differ from measures determined in accordance with IFRS, and are not necessarily indicative of net earnings or cash flow from operating activities as determined under IFRS.
The following table provides a reconciliation of cash operating costs and cash operating costs excluding royalties, cash operating costs per pound and cash operating costs excluding royalties per pound for the Maracás Menchen Mine to operating costs as per the Q3 2023 unaudited condensed interim consolidated financial statements.
Three months ended
Nine months ended
September 30, 2023
September 30, 2022
September 30, 2023
September 30, 2022
Operating costsi
$
42,580
$
45,602
$
131,540
$
125,264
Professional, consulting and management feesii
747
1,181
2,215
3,784
Other general and administrative expensesiii
408
383
1,032
859
Less: iron ore costsi
(145
)
(200
)
(638
)
(637
)
Less: conversion costsi
(1,413
)
(1,655
)
(5,551
)
(5,839
)
Less: product acquisition costsi
(5,449
)
(7,248
)
(13,380
)
(20,651
)
Less: distribution costsi
(2,202
)
(2,581
)
(6,174
)
(6,887
)
Less: inventory write-downiv
(978
)
(1,655
)
(1,661
)
(1,655
)
Less: depreciation and amortization expensei
(6,003
)
(5,111
)
(19,456
)
(14,923
)
Cash operating costs
27,545
28,716
87,927
79,315
Less: royalties1
(2,024
)
(2,497
)
(6,919
)
(8,264
)
Cash operating costs excluding royalties
25,521
26,219
81,008
71,050
Produced V2O5 sold (000s lb)
4,693
5,390
15,434
16,272
Cash operating costs per pound ($/lb)
$
5.87
$
5.33
$
5.70
$
4.87
Cash operating costs excluding royalties per pound ($/lb)
$
5.44
$
4.86
$
5.25
$
4.37
i. As per note 19 of the Company’s Q3 2023 unaudited condensed interim consolidated financial statements.
ii. As per the Mine properties segment in note 15 of the Company’s Q3 2023 unaudited condensed interim consolidated financial statements.
iii. As per the Mine properties segment in note 15 of the Company’s Q3 2023 unaudited condensed interim consolidated financial statements less the increase in legal provisions of $0.4 million (Q3 2023) and $0.8 million (nine months ended September 30, 2023) as noted in the “other general and administrative expenses” section on page 6 of the Company’s Q3 2023 management discussion and analysis.
iv. As per notes 5 and 19 of the Company’s Q3 2023 unaudited condensed interim consolidated financial statements for purchased finished products.
____________________________ 1 Conversion of tonnes to pounds, 1 tonne = 2,204.62 pounds or lbs. 2 Fastmarkets Metal Bulletin. 3 The cash operating costs excluding royalties and revenues per pound per pound sold are reported on a non-GAAP basis. Refer to the “Non-GAAP Measures” section of this press release. Revenues per pound sold are calculated based on the quantity of V2O5 sold during the stated period. 4 Effective grade represents the percentage of magnetic material mined multiplied by the percentage of V2O5 in the magnetic concentrate 5 GAAP – Generally Accepted Accounting Principles
Investor Relations Alex Guthrie Senior Manager, External Relations +1.416.861.9778 aguthrie@largoinc.com
Significant Progress towards data milestones in Phase 2 Program of GEO-CM04S1, Next-generation COVID-19 vaccine
Gedeptin® clinical data from Phase 1/2 study presented at AACR-AHNS Head and Neck Cancer Conference showing safe administration and tumor reduction
Multi-Product License Secured for ProBioGen’s AGE1.CR.pIX® suspension cell line to enhance manufacturing capabilities of MVA-based vaccine portfolio
Company to host conference call and webcast today at 4:30 p.m. ET
ATLANTA, GA, November 8, 2023 – GeoVax Labs, Inc. (Nasdaq: GOVX), a biotechnology company developing immunotherapies and vaccines against cancers and infectious diseases, today announced financial results for the third quarter ended September 30, 2023 and provided a business update.
“We are thrilled to see material advancements across all aspects of our business. Through the third quarter, we are delivering on our promise to bring transformative change to the treatment of COVID-19 by completing enrollment in our healthy volunteer Phase 2 clinical trial evaluating GEO-CM04S1 as a potentially more robust, more durable booster vaccine. In addition, with two additional Phase 2 trials ongoing in immunocompromised population, and recent publication of positive safety and potent immunogenicity data in this population, we have strengthened our conviction in the potential of our next-generation COVID-19 vaccine (GEO-CM04S1) for immunocompromised patients. We believe the need for new treatment options for immunocompromised patients in the fight against COVID-19 is significant, particularly as we begin to enter the winter surges of this diseases, where these patients will be left most vulnerable,” said David Dodd, Chief Executive Officer of GeoVax.
“We are preparing to announce initial data readouts from two of our Phase 2 GEO-CM04S1 trials as well as updates from our Gedeptin® clinical trial against head and neck cancer in the coming months. Earlier this summer, we were delighted to present clinical data which revealed the safe and feasible administration of Gedeptin®. We believe the Gedeptin mechanism of action to be solid tumor agnostic, and therefore offers the potential as a therapeutic option for multiple cancer types and positions the product for long-term growth. The third quarter of 2023 also saw new patents issued for our Ebola, Marburg, Malaria, and HIV vaccines, demonstrating the strength of our team’s ability to execute on our broader strategy. In addition, we advanced our manufacturing process through the signing of a landmark multi-product commercial license agreement with ProBioGen for the use of their AGE1.CR.PIX®suspension cell line. We believe that these catalysts altogether will have a profound impact on patients in need and all our stakeholders.”
Recent Business Achievements
GEO-CM04S1
Enrollment completed for Phase 2 clinical trial evaluating GEO-CM04S1 as a booster for healthy patients who have previously received the Pfizer or Moderna mRNA vaccine in September of 2023. An initial data readout is expected soon.
GEO-CM04S1 demonstrated potent antibody and cellular immunity in immunocompromised patients in a recent publication in the journal, Vaccines, in August 2023. GeoVax’s Phase 2 clinical trial evaluated the safety and immunogenicity of GEO-CM04S1, compared to either the Pfizer/BioNTech or Moderna mRNA-based vaccine in patients who have previously received an allogeneic hematopoietic cell transplant, an autologous hematopoietic cell transplant or CAR-T cell therapy. Most promising in the results published was the demonstration of the potential of GEO-CM04S1 as a variant agnostic COVID-19 vaccine, providing potent immunity from the Wuhan through Delta and Omicron strains.
In October 2023, GeoVax commenced the planned site expansion for this trial to accelerate patient enrollment. In addition to study enrollments completed at the City of Hope Medical Center (Duarte, California), the trial is now open at Wake Forest Baptist Medical Center (Winston Salem, North Carolina), the University of Massachusetts Medical Center (Worcester, Massachusetts), and Fred Hutchinson Cancer Center (Seattle, Washington).
Commenced investigator-initiated randomized observer-blinded Phase 2 clinical trial of COVID-19 boosters with GEO-CM04S1 or Pfizer-BioNTech bivalent vaccines in patients with chronic lymphocytic leukemia (CLL) in July of 2023. The trial is rapidly enrolling patients and progressing towards an interim data review.
Presented data for GEO-CM02 at the Keystone Symposia Conference in an abstract titled, MVA-vector multi-antigen COVID-19 vaccines induce protective immunity against SARS-CoV-2 variants spanning Alpha to Omicron in preclinical animal models in September of 2023. The data revealed that the GEO-CM02 vaccine induced immune responses that were efficacious against the original Wuhan strain and Omicron variants with a single dose. This effort expands upon GeoVax’s hypothesis that vaccines designed to induce both antibodies and T-cell responses to multiple viral structural proteins can address the issue of viral variation and escape from the immune system without the need for repeated seasonal adjustments.
Gedeptin®
Gedeptin® clinical data presented at the AACR-AHNS Head and Neck Cancer Conference in an abstract titled, Phase 1/2 study of Ad/PNB with Fludarabine for the Treatment of Head and Neck Squamous Cell Carcinoma (HNSCC) in July 2023. The FDA-funded study revealed that the administration of Gedeptin® is safe and feasible.
Advanced Vaccine Manufacturing Process
GeoVax and ProBioGen announced the signing of a landmark multi-product commercial license agreement for ProBioGen’s groundbreaking AGE1.CR.PIX® suspension cell line in September 2023. The agreement enhances the manufacturing capabilities of GeoVax’s entire Modified Vaccinia Ankara (MVA)-based vaccine portfolio with respect to both scale and flexibility. This follows the May 2023 agreement with Advanced Bioscience Laboratories, Inc. (ABL) to support current Good Manufacturing Practices (cGMP) production of the Company’s vaccine candidates. These agreements move the Company toward fully implementing a continuous cell line manufacturing system that will provide lower-cost, scalable versatility for our entire MVA-based vaccine portfolio.
Intellectual Property Developments
GeoVax recently secured multiple positive patent decisions covering notice of allowances for Ebola, Marburg, Malaria and HIV vaccines.
GeoVax announced that the U.S. Patent and Trademark Office has issued a Notice of Allowance for Patent Application No. 17/584,231 titled patent titled “Replication Deficient Modified Vaccina Ankara (MVA) Expressing Marburg Virus Glycoprotein (GP) and Matrix Protein (VP40).”
GeoVax announced that the U.S Patent and Trademark Office has issued a Notice of Allowance for Patent Application No. 17/409,574 titled “Multivalent HIV Vaccine Boost Compositions and Methods of Use.”
GeoVax announced that the U.S. Patent and Trademark Office has issued a Notice of Allowance for Patent Application No. 17/726,254 titled “Compositions and Methods for Generating an Immune Response to Treat or Prevent Malaria.”
GeoVax announced that the U.S. Patent and Trademark Office has issued Patent No. 11,701,418 B2 to GeoVax, pursuant to the Company’s patent application No. 15/543,139 titled “Replication-Deficient Modified Vaccinia Ankara (MVA) and Matrix Protein (VP40).”
Upcoming Events
GeoVax will participate in upcoming conferences and industry events:
Vaccines Summit 2023, November 13-15, 2023, Boston, MA
World Vaccine Congress, West Coast, November 27-30, 2023, Santa Clara, CA
NobleCon19, December 3-5, Boca Raton, FL
Emerging Growth Conference, December 6-7, Virtual
Third Quarter 2023 Financial Results
Net Loss: Net loss for the three months ended September 30, 2023, was $8,408,818 ($0.32 per share) as compared to $3,968,102 ($0.17 per share) for the comparable period in 2022. For the nine months ended September 30, 2023, the Company’s net loss was $18,374,354 ($0.69 per share) as compared to a net loss of $8,637,316 ($0.63 per share) in 2022.
R&D Expenses: Research and development expenses were $6,947,979 and $14,486,896 for the three-month and nine-month periods ended September 30, 2023, compared to $2,721,196 and $5,358,917 for the comparable periods in 2022, with the increase primarily due to the cost of conducting clinical trials for GEO-CM04S1 and Gedeptin, costs of manufacturing materials for use in our clinical trials, additional personnel costs, technology license fees, costs of preclinical research activities and a generally higher level of activity.
G&A Expenses: General and administrative expenses were $1,651,775 and $4,562,293 for the three-month and nine-month periods ended September 30, 2023, compared to $1,249,337 and $3,363,672 for the comparable periods in 2022, with the increase primarily due to higher personnel costs, investor relations consulting costs, patent costs and other expenses supportive of a higher level of activity.
Cash Position: GeoVax reported cash balances of $12,687,041 at September 30, 2023, as compared to $27,612,732 at December 31, 2023.
Further information is included in the Company’s Quarterly Report on Form 10-Q filed with the Securities and Exchange Commission.
Conference Call Details
Management will host a conference call scheduled to begin at 4:30 p.m. ET today, November 8, 2023, to review financial results and provide an update on corporate developments. A question-and-answer session will follow management’s formal remarks.
A webcast replay of the call will be available for three months via the same link as the live webcast approximately two hours after the end of the call.
About GeoVax
GeoVax Labs, Inc. is a clinical-stage biotechnology company developing novel therapies and vaccines for solid tumor cancers and many of the world’s most threatening infectious diseases. The company’s lead program in oncology is a novel oncolytic solid tumor gene-directed therapy, Gedeptin®, presently in a multicenter Phase 1/2 clinical trial for advanced head and neck cancers. GeoVax’s lead infectious disease candidate is GEO-CM04S1, a next-generation COVID-19 vaccine targeting high-risk immunocompromised patient populations. Currently in three Phase 2 clinical trials, GEO-CM04S1 is being evaluated as a primary vaccine for immunocompromised patients such as those suffering from hematologic cancers and other patient populations for whom the current authorized COVID-19 vaccines are insufficient, and as a booster vaccine in patients with chronic lymphocytic leukemia (CLL). In addition, GEO-CM04S1 is in a Phase 2 clinical trial evaluating the vaccine as a more robust, durable COVID-19 booster among healthy patients who previously received the mRNA vaccines. GeoVax has a leadership team who have driven significant value creation across multiple life science companies over the past several decades. For more information, visit our website: www.geovax.com.
Forward-Looking Statements
This release contains forward-looking statements regarding GeoVax’s business plans. The words “believe,” “look forward to,” “may,” “estimate,” “continue,” “anticipate,” “intend,” “should,” “plan,” “could,” “target,” “potential,” “is likely,” “will,” “expect” and similar expressions, as they relate to us, are intended to identify forward-looking statements. We have based these forward-looking statements largely on our current expectations and projections about future events and financial trends that we believe may affect our financial condition, results of operations, business strategy and financial needs. Actual results may differ materially from those included in these statements due to a variety of factors, including whether: GeoVax is able to obtain acceptable results from ongoing or future clinical trials of its investigational products, GeoVax’s immuno-oncology products and preventative vaccines can provoke the desired responses, and those products or vaccines can be used effectively, GeoVax’s viral vector technology adequately amplifies immune responses to cancer antigens, GeoVax can develop and manufacture its immuno-oncology products and preventative vaccines with the desired characteristics in a timely manner, GeoVax’s immuno-oncology products and preventative vaccines will be safe for human use, GeoVax’s vaccines will effectively prevent targeted infections in humans, GeoVax’s immuno-oncology products and preventative vaccines will receive regulatory approvals necessary to be licensed and marketed, GeoVax raises required capital to complete development, there is development of competitive products that may be more effective or easier to use than GeoVax’s products, GeoVax will be able to enter into favorable manufacturing and distribution agreements, and other factors, over which GeoVax has no control.
Further information on our risk factors is contained in our periodic reports on Form 10-Q and Form 10-K that we have filed and will file with the SEC. Any forward-looking statement made by us herein speaks only as of the date on which it is made. Factors or events that could cause our actual results to differ may emerge from time to time, and it is not possible for us to predict all of them. We undertake no obligation to publicly update any forward-looking statement, whether as a result of new information, future developments or otherwise, except as may be required by law.
Low-Cost Business Model and Disciplined Capital Allocation Drive Solid Operating Performance and Strong EPS Growth
Third Quarter Revenue of $2 Billion with GAAP EPS of $1.79; Adjusted EPS of $1.88
GAAP Operating Income of $91 Million; GAAP Net Income of $70 Million; Adjusted EBITDA of $125 Million
Repurchased $32 Million of Shares in the Third Quarter of 2023
Updates Full-Year 2023 Guidance
BOCA RATON, Fla.–(BUSINESS WIRE)–Nov. 8, 2023– The ODP Corporation (“ODP,” or the “Company”) (NASDAQ:ODP), a leading provider of products, services, and technology solutions to businesses and consumers, today announced results for the third quarter ended September 30, 2023.
Consolidated (in millions, except per share amounts)
3Q23
3Q22
YTD23
YTD22
Selected GAAP and Non-GAAP measures:
Sales
$2,009
$2,172
$6,025
$6,385
Sales change from prior year period
(8)%
(6)%
Operating income
$91
$84
$232
$188
Adjusted operating income (1)
$95
$95
$247
$238
Net income from continuing operations
$70
$67
$176
$142
Diluted earnings per share from continuing operations
$1.79
$1.36
$4.38
$2.84
Adjusted net income from continuing operations (1)
$73
$73
$187
$177
Adjusted earnings per share from continuing operations (fully diluted) (1)
$1.88
$1.48
$4.66
$3.54
Adjusted EBITDA (1)
$125
$131
$342
$347
Operating Cash Flow from continuing operations
$112
$163
$261
$79
Free Cash Flow (2)
$86
$138
$183
$11
Adjusted Free Cash Flow (3)
$89
$160
$192
$54
Third Quarter 2023 Summary(1)(2)(3)
Total reported sales of $2.0 billion, down 8% versus the prior year, primarily due to lower sales in its Office Depot consumer division, largely driven by 71 fewer retail locations in service compared to the prior year, as well as lower retail and online consumer traffic and transactions
GAAP operating income of $91 million and net income from continuing operations of $70 million, or $1.79 per diluted share, versus $84 million and $67 million, respectively, or $1.36 per diluted share, in the prior year
Adjusted operating income of $95 million, flat compared to the third quarter of 2022; adjusted EBITDA of $125 million, compared to $131 million in the third quarter of 2022
Adjusted net income from continuing operations of $73 million, or adjusted diluted earnings per share from continuing operations of $1.88, versus $73 million or $1.48, respectively, in the prior year
Operating cash flow from continuing operations of $112 million and adjusted free cash flow of $89 million, versus $163 million and $160 million, respectively, in the prior year
Repurchased 659 thousand shares at a cost of $32 million in the third quarter of 2023
$1.2 billion of total available liquidity including $384 million in cash and cash equivalents at quarter end
“I am extremely impressed seeing the day-to-day commitment and exceptional execution from our team as I fulfill Chief Executive Officer Gerry Smith’s responsibilities while he is on medical leave,” said Joseph Vassalluzzo, ODP’s chairman of the board. “In the quarter, our team delivered strong operating income and earnings per share results against a challenging economic backdrop, reflecting our unwavering commitment to operational excellence and to our low-cost business model approach.
“We continue to make progress across our four business units as we execute our three horizons strategy. This included expanding margins at ODP Business Solutions, new product testing and category expansion at Office Depot, securing new third-party customers at Veyer while remaining on track to more than double third-party EBITDA this year, and enhancing our platform and customer engagement at Varis.
“Our shareholder value creation formula, which integrates operational excellence with a shareholder-focused capital allocation plan, including the repurchase of approximately $32 million of shares during the quarter, contributed to a meaningful year-over-year increase in adjusted earnings per share for the third quarter and revised upward EPS guidance for the full year,” Vassalluzzo added.
“As we look ahead, we anticipate the macroeconomic environment to remain challenging throughout the remainder of the year. However, we are confident in our position of strength and will continue to focus on driving value for shareholders through our low-cost business model, leveraging our multiple routes to market, and continuing with our disciplined capital allocation,” Vassalluzzo concluded.
Consolidated Results
Reported (GAAP) Results
Total reported sales for the third quarter of 2023 were $2 billion, a decrease of 8% compared with the same period last year. This was driven primarily by lower sales in its consumer division, Office Depot, primarily due to 71 fewer stores in service compared to last year related to planned store closures, as well as lower retail and online consumer traffic. Sales at ODP Business Solutions Division were down slightly compared to last year, largely driven by slower return to office trends and lower sales of technology products. Meanwhile, Veyer provided strong logistics support for the ODP Business Solutions and Office Depot Divisions, and continued to capture additional demand for its supply chain and procurement solutions among other third-party customers.
The Company reported operating income of $91 million in the third quarter of 2023, up 8% compared to operating income of $84 million in the prior year period. Operating results in the third quarter of 2023 included $4 million of charges. These charges consisted primarily of $3 million associated with non-cash asset impairments largely related to the operating lease right-of-use (ROU) assets associated with the Company’s retail store locations. Net income from continuing operations was $70 million, or $1.79 per diluted share in the third quarter of 2023, up from $67 million, or $1.36 per diluted share in the third quarter of 2022.
Adjusted (non-GAAP) Results(1)
Adjusted results for the third quarter of 2023 exclude charges and credits totaling $4 million as described above and the associated tax impacts.
Third quarter of 2023 adjusted EBITDA was $125 million compared to $131 million in the prior year period. This included depreciation and amortization of $28 million and $32 million in the third quarters of 2023 and 2022, respectively
Third quarter of 2023 adjusted operating income was $95 million, flat compared to the third quarter of 2022
Third quarter of 2023 adjusted net income from continuing operations was $73 million, or $1.88 per diluted share, compared to $73 million, or $1.48 per diluted share, in the third quarter of 2022, an increase of 27% on a per share basis
Division Results
ODP Business Solutions Division
Leading B2B distribution solutions provider serving small, medium and enterprise level companies with an annual trailing-twelve-month revenue in excess of $4 billion
Reported sales were $1.0 billion in the third quarter of 2023, down approximately 3% compared to the same period last year primarily related to lower sales of technology products and weaker macroeconomic conditions
Stronger sales in cleaning and breakroom supplies were more than offset by lower sales of technology and core supplies
Total adjacency category sales, including cleaning and breakroom, furniture, technology, and copy and print, were 44% of total ODP Business Solutions’ sales
Continued strong pipeline and net new business customer additions
Operating income was $56 million in the third quarter of 2023, up 17% over the same period last year, related primarily to higher gross margins. As a percentage of sales, operating income margin was 6%, up 90 basis points compared to the same period last year
Office Depot Division
Leading provider of retail consumer and small business products and services distributed via Office Depot and OfficeMax retail locations and an award-winning eCommerce presence
Reported sales were $1.0 billion in the third quarter of 2023, down 12% compared to the prior year period partially due to 71 fewer retail outlets in service associated with planned store closures, as well as lower demand relative to last year in certain product categories, softer back-to-school seasonal demand, and lower online sales. The Company closed 14 retail stores in the quarter and had 938 stores at quarter end. Sales were down approximately 6% on a comparable store basis
Stronger sales of copy and print services were more than offset by lower sales in supplies, technology, and other categories
Store and online traffic were lower year over year due to a greater percentage of customers having returned to the office post pandemic, as well as weaker macroeconomic activity
Operating income was $66 million in the third quarter of 2023, compared to operating income of $83 million during the same period last year, driven primarily by the flow through impact from lower sales. As a percentage of sales, operating income was 7%, flat compared to the same period last year.
Veyer Division
Veyer is a supply chain, distribution, procurement and global sourcing operation with over 35 years of experience and proven leadership, supporting Office Depot and ODP Business Solutions, as well as third-party customers. Veyer’s assets and capabilities include 8 million square feet of infrastructure through a nationwide network of distribution centers, cross-docks, and other facilities throughout the United States; a global sourcing presence in Asia; a large private fleet of vehicles; and next-day delivery to 98.5% of US population
In the third quarter of 2023, Veyer provided strong support for its internal customers, ODP Business Solutions and Office Depot, as well as for its third-party customers, generating sales of $1.3 billion
Operating income was $10 million in the third quarter of 2023, up from $9 million in the prior year period related to the favorable impacts of higher sales to external third parties and lower product costing
In the quarter relative to last year, sales and EBITDA generated from third party customers was up 57% and 119% respectively, resulting in sales of approximately $11 million and EBITDA of $3 million in the quarter
Varis Division
Varis is a tech-enabled B2B indirect procurement marketplace launched in the fourth quarter of 2022, which provides buyers and suppliers a seamless way to transact through the platform’s consumer-like buying experience and advanced spend management tools
Successfully launched the platform in the fourth quarter of 2022; adding and on-boarding new customers, incorporating feedback, and adding new features and capabilities to the platform
Varis generated revenues in the third quarter of 2023 of $2 million, flat compared to the third quarter of 2022
Operating loss was $17 million, flat compared to the third quarter of 2022, as the division continued to enhance its platform and onboard new customers
Share Repurchases
The Company continued to execute under its previously announced $1 billion share repurchase authorization, available through year-end 2025. During the third quarter of 2023, the Company repurchased 659 thousand shares at a cost of $32 million. Since the inception of the authorization beginning in November 2022, the Company has repurchased 9 million shares for approximately $420 million.
The number of shares to be repurchased in the future and the timing of such transactions will depend on a variety of factors, including market conditions, regulatory requirements, and other corporate considerations. The current authorization could be suspended or discontinued at any time as determined by the Board of Directors.
Balance Sheet and Cash Flow
As of September 30, 2023, ODP had total available liquidity of approximately $1.2 billion, consisting of $384 million in cash and cash equivalents and $771 million of available credit under the Third Amended Credit Agreement. Total debt was $173 million.
For the third quarter of 2023, cash generated by operating activities of continuing operations was $112 million, which included $3 million in restructuring and other spend, compared to cash provided by operating activities of continuing operations of $163 million in the third quarter of the prior year, which included $22 million in restructuring and other spend. The year-over-year change in operating cash flow is largely related to the timing of certain working capital items.
Capital expenditures in the third quarter of 2023 and 2022 were $25 million, reflecting continued growth investments in the Company’s digital transformation, distribution network, and eCommerce capabilities. Adjusted Free Cash Flow(3) was $89 million in the third quarter of 2023, compared to $160 million in the prior year period.
“I would like to recognize our entire team for their commitment and dedication in managing inventory and working capital, which has resulted in another quarter of strong cash flow generation,” said Anthony Scaglione, executive vice president and chief financial officer of The ODP Corporation. “As we work to close out the year, we maintain our disciplined approach, focusing on managing costs, maximizing cash flow, and executing our capital allocation plan,” Scaglione added.
Updated 2023 Expectations
“Our team’s unwavering commitment to delivering value is evident in our compelling customer proposition, strong free cash flow generation, and strategic capital allocation for the benefit of our shareholders,” highlighted Vassalluzzo. “While we acknowledge the influence of the challenging macroeconomic environment on consumer and business activity, we remain steadfast in our dedication to driving long-term value within our business through effective execution of our three horizons strategy.”
The Company’s full year guidance for 2023 included in this release includes non-GAAP measures, such as Adjusted EBITDA, Adjusted Operating Income, Adjusted Earnings per Share and Adjusted Free Cash Flow. These measures exclude charges or credits not indicative of core operations, which may include but not be limited to merger integration expenses, restructuring charges, acquisition-related costs, executive transition costs, asset impairments and other significant items that currently cannot be predicted without unreasonable efforts. The exact amount of these charges or credits are not currently determinable but may be significant. Accordingly, the Company is unable to provide equivalent GAAP measures or reconciliations from GAAP to non-GAAP for these financial measures without unreasonable effort.
The Company is updating its full year guidance for 2023 as follows:
Previous 2023 Guidance
Updated 2023 Guidance
Sales
Approximately $8 billion
Revised to $7.8 – $7.9 billion
Adjusted EBITDA
$400 – $430 million
Affirmed
Adjusted Operating Income
$270 – $300 million
Revised to $280 – $310 million
Adjusted Earnings per Share(*)
$5.00 – $5.30 per share
Revised to $5.30 – $5.60 per share
Adjusted Free Cash Flow(**)
$200 – $230 million
Affirmed
Capital Expenditures
$100 – $120 million
Affirmed
*Adjusted Earnings per Share (EPS) guidance for 2023 includes tax benefits related to R&D and employee-related tax credits and includes expected impact from share repurchases
**Adjusted Free Cash Flow is defined as cash flows from operating activities less capital expenditures excluding cash charges associated with the Company’s Maximize B2B Restructuring and expenses incurred in connection with our previously planned separation of the consumer business and re-alignment
“Our year-to-date performance speaks to the resilience of our team and the strength of our low-cost business model and capital allocation approach,” said Scaglione. “While the weaker macroeconomic conditions have impacted the level of consumer and business activity creating top-line headwinds, our continued focus on operational excellence has us well positioned to continue driving strong operating results as we close out the year. Our updated guidance assumes a consistent overall macroeconomic environment and reflects our year-to-date revenue trends, while increasing our outlook for adjusted operating income and adjusted EPS.
Our increased adjusted EPS outlook also assumes a lower full-year effective tax rate driven by the execution of certain tax credits, lower than anticipated interest expense associated with projected intra-quarter ABL borrowings, and the impact from our continued share buyback activity,” Scaglione added.
The ODP Corporation will webcast a call with financial analysts and investors on November 8, 2023, at 9:00 am Eastern Time, which will be accessible to the media and the general public. To listen to the conference call via webcast, please visit The ODP Corporation’s Investor Relations website at investor.theodpcorp.com. A replay of the webcast will be available approximately two hours following the event.
(1)
As presented throughout this release, adjusted results represent non-GAAP financial measures and exclude charges or credits not indicative of core operations and the tax effect of these items, which may include but not be limited to merger integration, restructuring, acquisition costs, and asset impairments. Reconciliations from GAAP to non-GAAP financial measures can be found in this release as well as on the Company’s Investor Relations website at investor.theodpcorp.com.
(2)
As used in this release, Free Cash Flow is defined as cash flows from operating activities less capital expenditures. Free Cash Flow is a non-GAAP financial measure and reconciliations from GAAP financial measures can be found in this release as well as on the Company’s Investor Relations website at investor.theodpcorp.com.
(3)
As used in this release, Adjusted Free Cash Flow is defined as Free Cash Flow excluding cash charges associated with the Company’s Maximize B2B Restructuring, and expenses incurred in connection with our previously planned separation of the consumer business and re-alignment. Adjusted Free Cash Flow is a non-GAAP financial measure and reconciliations from GAAP financial measures can be found in this release as well as on the Company’s Investor Relations website at investor.theodpcorp.com.
About The ODP Corporation
The ODP Corporation (NASDAQ:ODP) is a leading provider of products, services, and technology solutions through an integrated business-to-business (B2B) distribution platform and omni-channel presence, which includes supply chain and distribution operations, dedicated sales professionals, a B2B digital procurement solution, online presence, and a network of Office Depot and OfficeMax retail stores. Through its operating companies ODP Business Solutions, LLC; Office Depot, LLC; Veyer, LLC; and Varis, Inc, The ODP Corporation empowers every business, professional, and consumer to achieve more every day. For more information, visit theodpcorp.com.
This communication may contain forward-looking statements within the meaning of the Private Securities Litigation Reform Act of 1995. These statements or disclosures may discuss goals, intentions and expectations as to future trends, plans, events, results of operations, cash flow or financial condition, the potential impacts on our business due to the unknown severity and duration of the COVID-19 pandemic, or state other information relating to, among other things, the Company, based on current beliefs and assumptions made by, and information currently available to, management. Forward-looking statements generally will be accompanied by words such as “anticipate,” “believe,” “plan,” “could,” “estimate,” “expect,” “forecast,” “guidance,” “expectations”, “outlook,” “intend,” “may,” “possible,” “potential,” “predict,” “project,” “propose” or other similar words, phrases or expressions, or other variations of such words. These forward-looking statements are subject to various risks and uncertainties, many of which are outside of the Company’s control. There can be no assurances that the Company will realize these expectations or that these beliefs will prove correct, and therefore investors and stakeholders should not place undue reliance on such statements.
Factors that could cause actual results to differ materially from those in the forward-looking statements include, among other things, highly competitive office products market and failure to differentiate the Company from other office supply resellers or respond to decline in general office supplies sales or to shifting consumer demands; competitive pressures on the Company’s sales and pricing; the risk that the Company is unable to transform the business into a service-driven, B2B platform that such a strategy will not result in the benefits anticipated; the risk that the Company will not be able to achieve the expected benefits of its strategic plans, including its strategic shift to maintain all of its businesses under common ownership; the risk that the Company may not be able to realize the anticipated benefits of acquisitions due to unforeseen liabilities, future capital expenditures, expenses, indebtedness and the unanticipated loss of key customers or the inability to achieve expected revenues, synergies, cost savings or financial performance; the risk that the Company is unable to successfully maintain a relevant omni-channel experience for its customers; the risk that the Company is unable to execute the Maximize B2B Restructuring Plan successfully or that such plan will not result in the benefits anticipated; failure to effectively manage the Company’s real estate portfolio; loss of business with government entities, purchasing consortiums, and sole- or limited-source distribution arrangements; failure to attract and retain qualified personnel, including employees in stores, service centers, distribution centers, field and corporate offices and executive management, and the inability to keep supply of skills and resources in balance with customer demand; failure to execute effective advertising efforts and maintain the Company’s reputation and brand at a high level; disruptions in computer systems, including delivery of technology services; breach of information technology systems affecting reputation, business partner and customer relationships and operations and resulting in high costs and lost revenue; unanticipated downturns in business relationships with customers or terms with the suppliers, third-party vendors and business partners; disruption of global sourcing activities, evolving foreign trade policy (including tariffs imposed on certain foreign made goods); exclusive Office Depot branded products are subject to additional product, supply chain and legal risks; product safety and quality concerns of manufacturers’ branded products and services and Office Depot private branded products; covenants in the credit facility; general disruption in the credit markets; incurrence of significant impairment charges; retained responsibility for liabilities of acquired companies; fluctuation in quarterly operating results due to seasonality of the Company’s business; changes in tax laws in jurisdictions where the Company operates; increases in wage and benefit costs and changes in labor regulations; changes in the regulatory environment, legal compliance risks and violations of the U.S. Foreign Corrupt Practices Act and other worldwide anti-bribery laws; volatility in the Company’s common stock price; changes in or the elimination of the payment of cash dividends on Company common stock; macroeconomic conditions such as higher interest rates and future declines in business or consumer spending; increases in fuel and other commodity prices and the cost of material, energy and other production costs, or unexpected costs that cannot be recouped in product pricing; unexpected claims, charges, litigation, dispute resolutions or settlement expenses; catastrophic events, including the impact of weather events on the Company’s business; the discouragement of lawsuits by shareholders against the Company and its directors and officers as a result of the exclusive forum selection of the Court of Chancery, the federal district court for the District of Delaware or other Delaware state courts by the Company as the sole and exclusive forum for such lawsuits; and the impact of the COVID-19 pandemic on the Company’s business. The foregoing list of factors is not exhaustive. Investors and shareholders should carefully consider the foregoing factors and the other risks and uncertainties described in the Company’s Annual Reports on Form 10-K, Quarterly Reports on Form 10-Q, and Current Reports on Form 8-K filed with the U.S. Securities and Exchange Commission. The Company does not assume any obligation to update or revise any forward-looking statements.
ATLANTA, November 8, 2023 — Gray Television, Inc. (“Gray”) (NYSE: GTN) announced today that its Board of Directors has authorized a quarterly cash dividend of $0.08 per share of its common stock and Class A common stock. The dividend is payable on December 29, 2023, to shareholders of record at the close of business on December 15, 2023.
About Gray Television:
We are a multimedia company headquartered in Atlanta, Georgia. We are the nation’s largest owner of top-rated local television stations and digital assets. Our television stations serve 113 television markets that collectively reach approximately 36 percent of US television households. This portfolio includes 80 markets with the top-rated television station and 102 markets with the first and/or second highest rated television station in 2022. We also own video program companies Raycom Sports, Tupelo Media Group, and PowerNation Studios, as well as the studio production facilities Assembly Atlanta and Third Rail Studios. We own a majority interest in Swirl Films. For more information, please visit www.gray.tv.
Forward-Looking Statements:
This press release contains certain forward-looking statements that are based largely on Gray’s current expectations and reflect various estimates and assumptions by Gray. These statements are statements other than those of historical fact and may be identified by words such as “estimates”, “expect,” “anticipate,” “will,” “implied,” “assume” and similar expressions. Forward-looking statements are subject to certain risks, trends and uncertainties that could cause actual results and achievements to differ materially from those expressed in such forward-looking statements. Such risks, trends and uncertainties, which in some instances are beyond Gray’s control include Gray’s inability to provide expected future payment of dividends, and other future events. Gray is subject to additional risks and uncertainties described in Gray’s quarterly and annual reports filed with the Securities and Exchange Commission from time to time, including in the “Risk Factors,” and management’s discussion and analysis of financial condition and results of operations sections contained therein, which reports are made publicly available via its website, www.gray.tv. Any forward-looking statements in this communication should be evaluated in light of these important risk factors. This press release reflects management’s views as of the date hereof. Except to the extent required by applicable law, Gray undertakes no obligation to update or revise any information contained in this communication beyond the date hereof, whether as a result of new information, future events or otherwise.
# # #
Gray Contacts:
www.gray.tv.
Jim Ryan, Executive Vice President and Chief Financial Officer, (404) 504-9828
Kevin P. Latek, Executive Vice President, Chief Legal and Development Officer, (404) 266-8333
BY THE COMTECH EDITORIAL TEAM – NOV 7, 2023 | 3 MIN READ
TORRANCE, Calif. & MELVILLE, N.Y. — Nov. 7, 2023 — Stellant Systems, Inc. (Stellant) and Comtech (NASDAQ: CMTL), both global technology leaders, announced today that the companies have closed, effective November 7, 2023, on the previously announced sale of Comtech’s Power Systems Technology (PST) product line. Stellant is a portfolio company of Arlington Capital Partners, a Washington D.C.-area private equity firm with extensive experience investing in regulated industries.
Net cash proceeds received at closing by Comtech approximated $32.5 million and were used in part by Comtech to pay down outstanding debt on its existing Credit Facility. In connection with the consummation of the closing of the transaction, Comtech entered into a Third Amended and Restated Credit Agreement with its existing lenders and a Second Amended and Restated Certificate of Designations with its existing Series A convertible preferred shareholders, who both consented to the transaction. Comtech will provide financial and other information concerning the impact of the PST transaction during its next regularly scheduled quarterly earnings conference call to review the results of its fiscal quarter ended October 31, 2023, the exact date and time of which will be announced in advance.
About Stellant Systems, Inc.
Stellant Systems is a premier manufacturer of critical spectrum and RF power amplification systems to the space, defense, medical, science and industrial markets for both domestic and international customers. Stellant has three domestic manufacturing facilities and nearly 1,000 employees. For more information, visit www.Stellantsystems.com.
About Comtech
Comtech Telecommunications Corp. is a leading global technology company providing terrestrial and wireless network solutions, next-generation 9-1-1 emergency services, satellite and space communications technologies, and cloud native capabilities to commercial and government customers around the world. Our unique culture of innovation and employee empowerment unleashes a relentless passion for customer success. With multiple facilities located in technology corridors throughout the United States and around the world, Comtech leverages our global presence, technology leadership, and decades of experience to create the world’s most innovative communications solutions.For more information, please visit www.comtech.com.
About Arlington Capital Partners
Arlington Capital Partners is a Washington, DC-based private equity firm that has managed approximately $7 billion in capital commitments. Arlington is focused on middle market investment opportunities in growth industries including government services and technology, aerospace & defense, healthcare, and business services and software. The firm’s professionals and network have a unique combination of operating and private equity experience that enable Arlington to be a value-added investor. Arlington invests in companies in partnership with high quality management teams that are motivated to establish and/or advance their company’s position as leading competitors in their field. For more information, visit Arlington Capital’s website at arlingtoncap.com and follow Arlington on LinkedIn.
Forward-Looking Statements
Certain information in this press release contains forward-looking statements. Forward-looking statements can be identified by words such as: “will,” “intend,” “expect,” and similar references to future periods. Forward-looking statements by their nature address matters that are, to different degrees, uncertain, such as statements about the consummation of the transaction and the anticipated benefits thereof. All such forward-looking statements are based upon current plans, estimates, expectations and ambitions that are subject to risks, uncertainties and assumptions, many of which are beyond the control of Stellant and Comtech, that could cause actual results to differ materially from those expressed in such forward-looking statements. Important risk factors that may cause such a difference include, but are not limited to: anticipated tax treatment, unforeseen liabilities, the possibility that any of the anticipated benefits of the transaction will not be realized or will not be realized within the expected time period, and other factors as described in Comtech’s filings with the Securities and Exchange Commission, including those under the heading “Risk Factors” in Comtech’s most recent Annual Report on Form 10-K. Stellant and Comtech do not intend to update or revise publicly any forward-looking statements, whether because of new information, future events, or otherwise, except as required by law.
PRINCETON, N.J., Nov. 07, 2023 (GLOBE NEWSWIRE) — PDS Biotechnology Corporation (Nasdaq: PDSB) (PDS Biotech or the Company), a clinical-stage immunotherapy company developing a growing pipeline of targeted cancer immunotherapies and infectious disease vaccines based on the Company’s proprietary T cell activating platforms, today announced that the Company will release financial results for the third quarter of 2023 on Tuesday, November 14, 2023, before the market opens. Following the release, management will host a conference call to review the financial results and provide a business update.
Tuesday, November 14, 2023, 8:00 AM ET Domestic: 877-407-3088 International: 201-389-0927 Conference ID: 13741454
After the live webcast, the event will be archived on PDS Biotech’s website for six months.
About PDS Biotechnology
PDS Biotech is a clinical-stage immunotherapy company developing a growing pipeline of targeted cancer and infectious disease immunotherapies based on our proprietary Versamune®, Versamune® plus PDS0301, and Infectimune® T cell-activating platforms. We believe our targeted immunotherapies have the potential to overcome the limitations of current immunotherapy approaches through the activation of the right type, quantity and potency of T cells. To date, our lead Versamune® clinical candidate, PDS0101, has demonstrated the ability to reduce and shrink tumors and stabilize disease in combination with approved and investigational therapeutics in patients with a broad range of HPV16-associated cancers in multiple Phase 2 clinical trials and will be advancing into a Phase 3 clinical trial in combination with KEYTRUDA® for the treatment of recurrent/metastatic HPV16-positive head and neck cancer in 2023. Our Infectimune® based vaccines have also demonstrated the potential to induce not only robust and durable neutralizing antibody responses, but also powerful T cell responses, including long-lasting memory T cell responses in pre-clinical studies to date. To learn more, please visit www.pdsbiotech.com or follow us on Twitter at @PDSBiotech.
Forward Looking Statements
This communication contains forward-looking statements (including within the meaning of Section 21E of the United States Securities Exchange Act of 1934, as amended, and Section 27A of the United States Securities Act of 1933, as amended) concerning PDS Biotechnology Corporation (the “Company”) and other matters. These statements may discuss goals, intentions and expectations as to future plans, trends, events, results of operations or financial condition, or otherwise, based on current beliefs of the Company’s management, as well as assumptions made by, and information currently available to, management. Forward-looking statements generally include statements that are predictive in nature and depend upon or refer to future events or conditions, and include words such as “may,” “will,” “should,” “would,” “expect,” “anticipate,” “plan,” “likely,” “believe,” “estimate,” “project,” “intend,” “forecast,” “guidance”, “outlook” and other similar expressions among others. Forward-looking statements are based on current beliefs and assumptions that are subject to risks and uncertainties and are not guarantees of future performance. Actual results could differ materially from those contained in any forward-looking statement as a result of various factors, including, without limitation: the Company’s ability to protect its intellectual property rights; the Company’s anticipated capital requirements, including the Company’s anticipated cash runway and the Company’s current expectations regarding its plans for future equity financings; the Company’s dependence on additional financing to fund its operations and complete the development and commercialization of its product candidates, and the risks that raising such additional capital may restrict the Company’s operations or require the Company to relinquish rights to the Company’s technologies or product candidates; the Company’s limited operating history in the Company’s current line of business, which makes it difficult to evaluate the Company’s prospects, the Company’s business plan or the likelihood of the Company’s successful implementation of such business plan; the timing for the Company or its partners to initiate the planned clinical trials for PDS0101, PDS0203 and other Versamune® and Infectimune® based product candidates; the future success of such trials; the successful implementation of the Company’s research and development programs and collaborations, including any collaboration studies concerning PDS0101, PDS0203 and other Versamune® and Infectimune® based product candidates and the Company’s interpretation of the results and findings of such programs and collaborations and whether such results are sufficient to support the future success of the Company’s product candidates; the success, timing and cost of the Company’s ongoing clinical trials and anticipated clinical trials for the Company’s current product candidates, including statements regarding the timing of initiation, pace of enrollment and completion of the trials (including the Company’s ability to fully fund its disclosed clinical trials, which assumes no material changes to the Company’s currently projected expenses), futility analyses, presentations at conferences and data reported in an abstract, and receipt of interim or preliminary results (including, without limitation, any preclinical results or data), which are not necessarily indicative of the final results of the Company’s ongoing clinical trials; any Company statements about its understanding of product candidates mechanisms of action and interpretation of preclinical and early clinical results from its clinical development programs and any collaboration studies; and other factors, including legislative, regulatory, political and economic developments not within the Company’s control. The foregoing review of important factors that could cause actual events to differ from expectations should not be construed as exhaustive and should be read in conjunction with statements that are included herein and elsewhere, including the other risks, uncertainties, and other factors described under “Risk Factors,” “Management’s Discussion and Analysis of Financial Condition and Results of Operations” and elsewhere in the documents we file with the U.S. Securities and Exchange Commission. The forward-looking statements are made only as of the date of this press release and, except as required by applicable law, the Company undertakes no obligation to revise or update any forward-looking statement, or to make any other forward-looking statements, whether as a result of new information, future events or otherwise.
Versamune® and Infectimune® are registered trademarks of PDS Biotechnology Corporation. KEYTRUDA® is a registered trademark of Merck Sharp and Dohme LLC, a subsidiary of Merck & Co., Inc., Rahway, N.J., USA.
Substantial THIO program progress including unprecedented disease control rate (DCR) of 100% in second-line non-small cell lung cancer (NSCLC)
Key THIO findings in gliomas, pediatric brain cancer, and second generation THIO-derived cancer therapies
Strong pace of enrollment in THIO-101 Phase 2 trial exceeds average enrollment pace in similar NSCLC trials
CHICAGO–(BUSINESS WIRE)– MAIA Biotechnology, Inc., (NYSE American: MAIA) (“MAIA” or the “Company”), a clinical-stage biopharmaceutical company developing telomere-targeting immunotherapies for cancer, today reported financial results for the third quarter ended September 30, 2023 and key operational updates.
“Our successful and productive third quarter was punctuated by the outstanding data on our lead asset THIO that we recently revealed, and an accelerating pace of enrollment in our THIO-101 Phase 2 trial,” said Vlad Vitoc, M.D., MAIA’s Chairman and Chief Executive Officer. “We are expanding our trial in Europe, and with the FDA’s recent clearance for THIO studies in the U.S. as part of THIO-101, we have reached an essential milestone in the clinical development of THIO. Preliminary efficacy data from the trial is excellent and includes an unprecedented disease control rate (DCR) of 100% in second-line NSCLC treatment, far surpassing the standard of care DCR of 53-64%. We achieved the pre-determined statistical requirements to proceed to the next stage of the trial earlier than expected, and we look forward to sharing our continuing progress in the coming months and into 2024.”
Third Quarter Business Highlights and Recent Developments
THIO Program
Announced 100% Disease Control in Second-Line Non-Small Cell Lung Cancer Demonstrating Impressive Positive Preliminary Efficacy Data: 100% preliminary DCR was observed in second-line and 88% in third-line, in highly difficult-to-treat patients who already progressed through previous lines of treatment. DCRs across all dose levels met the pre-determined statistical requirements earlier than expected to proceed to next stage of the THIO-101 Phase 2 trial.
Highly Potent Anticancer Activity in Gliomas: MAIA’slead asset THIO showed highly potent anticancer activity in models of glioma, an aggressive type of brain tumor that originates from glial cells and is among the most difficult-to-treat cancers. As a monotherapy, THIO demonstrated efficacy in multiple glioma cell lines that had acquired resistance to the current state-of-the-art care temozolomide (TMZ).
THIO as Potential Therapy for Pediatric Brain Cancer: Study data showed THIO’s potent anticancer activity in diffuse intrinsic pontine glioma (DIPG), one of the most aggressive tumors affecting the central nervous system in children. The treatment resulted in noticeably increased tumor sensitivity to immune or ionizing radiation therapies.
Higher Anticancer Potency of Next Generation THIO Conjugates: Positive Investigational New Drug-enabling study data on telomere-targeting agents derived from lipid-modified THIO molecules warrant further in vivo in-depth investigation of THIO-like agents as second generation cancer therapies.
THIO-101 Phase 2 Clinical Trial
U.S. FDA Clearance of THIO IND Application: TheU.S. Food and Drug Administration (FDA) cleared an Investigational New Drug (IND) application enabling THIO to be evaluated in the U.S. as part of THIO-101, the Company’s ongoing global phase 2 clinical study in patients with advanced non-small cell lung cancer (NSCLC). THIO is being tested in sequential combination with a checkpoint inhibitor (CPI) to evaluate anti-tumor activity and immune response in NSCLC patients.
Strong Pace of Enrollment in THIO-101: 49 patients have been dosed to date at a pace of enrollment that is currently exceeding the average enrollment pace in similar NSCLC trials. Out of the 49 patients dosed, 37 have already completed at least one post baseline assessment.
Continuing Positive Preliminary Survival Data: The first 2 subjects dosed on trial (both receiving 3rd line of treatment) reported long term survival of 14.6 and 12.5 months, respectively, at the latest post baseline assessment with no new anti-cancer treatment initiated. Follow up was ongoing for the first subject at the time of data cut-off.
Third Quarter 2023 Financial Results
Cash Position: Cash totaled approximately $6.1 million as of September 30, 2023, compared to $10.9 million in cash as of December 31, 2022.
Research and Development (R&D) Expenses: R&D expenses were approximately $2.6 million for the quarter ended September 30, 2023, compared to approximately $2.3 million for quarter ended September 30, 2022. The increase was primarily related to an increase in scientific research expenses.
General and Administrative (G&A) Expenses: G&A expenses were approximately $2.4 million for the quarter ended September 30, 2023, compared to approximately $1.7 million for the quarter ended September 30, 2022. The increase for the quarter was primarily related to an increase in professional fees related to the write-off of deferred offering costs and an increase in investor relations costs.
Other Income, Net: Other income was approximately $0.08 million for the quarter ended September 30, 2023, compared to other income, net of $0.19 million for the quarter ended September 30, 2022, primarily related to a change in the fair value of warrant liability.
Net Loss: Net loss was approximately $4.9 million, or $0.36 per share, for the quarter ended September 30, 2023, as compared to net loss of approximately $4.9 million, or $0.48 per share, for the quarter ended September 30, 2022. Weighted average shares outstanding were 13,675,802 in the third quarter of 2023, compared to 10,165,622 in the third quarter of 2022.
For additional information on the Company’s financial results for the quarter ended September 30, 2023, please refer to the Form 10-Q filed with the SEC.
About THIO
THIO (6-thio-dG or 6-thio-2’-deoxyguanosine) is a first-in-class investigational telomere-targeting agent currently in clinical development to evaluate its activity in Non-Small Cell Lung Cancer (NSCLC). Telomeres, along with the enzyme telomerase, play a fundamental role in the survival of cancer cells and their resistance to current therapies. The modified nucleotide 6-thio-2’-deoxyguanosine (THIO) induces telomerase-dependent telomeric DNA modification, DNA damage responses, and selective cancer cell death. THIO-damaged telomeric fragments accumulate in cytosolic micronuclei and activates both innate (cGAS/STING) and adaptive (T-cell) immune responses. The sequential treatment with THIO followed by PD-(L)1 inhibitors resulted in profound and persistent tumor regression in advanced, in vivo cancer models by induction of cancer type–specific immune memory. THIO is presently developed as a second or later line of treatment for NSCLC for patients that have progressed beyond the standard-of-care regimen of existing checkpoint inhibitors.
About THIO-101, Phase 2 Clinical Trial
THIO-101 is a multicenter, open-label, dose finding Phase 2 clinical trial. It is the first trial designed to evaluate THIO’s anti-tumor activity when followed by PD-(L)1 inhibition. The trial is testing the hypothesis that low doses of THIO administered prior to an anti-PD-1 agent will enhance and prolong immune response in patients with advanced NSCLC who previously did not respond or developed resistance and progressed after first-line treatment regimen containing another checkpoint inhibitor. The trial design has two primary objectives: (1) to evaluate the safety and tolerability of THIO administered as an anticancer compound and a priming immune activator (2) to assess the clinical efficacy of THIO using Overall Response Rate (ORR) as the primary clinical endpoint. For more information on this Phase II trial, please visit ClinicalTrials.gov using the identifier NCT05208944.
About MAIA Biotechnology, Inc.
MAIA is a targeted therapy, immuno-oncology company focused on the development and commercialization of potential first-in-class drugs with novel mechanisms of action that are intended to meaningfully improve and extend the lives of people with cancer. Our lead program is THIO, a potential first-in-class cancer telomere targeting agent in clinical development for the treatment of NSCLC patients with telomerase-positive cancer cells. For more information, please visit www.maiabiotech.com.
Forward Looking Statements
MAIA cautions that all statements, other than statements of historical facts contained in this press release, are forward-looking statements. Forward-looking statements are subject to known and unknown risks, uncertainties, and other factors that may cause our or our industry’s actual results, levels or activity, performance or achievements to be materially different from those anticipated by such statements. The use of words such as “may,” “might,” “will,” “should,” “could,” “expect,” “plan,” “anticipate,” “believe,” “estimate,” “project,” “intend,” “future,” “potential,” or “continue,” and other similar expressions are intended to identify forward looking statements. However, the absence of these words does not mean that statements are not forward-looking. All forward-looking statements are based on current estimates, assumptions and expectations by our management that, although we believe to be reasonable, are inherently uncertain. Any forward-looking statement expressing an expectation or belief as to future events is expressed in good faith and believed to be reasonable at the time such forward-looking statement is made. These forward-looking statements are only predictions and may differ materially from actual results due to a variety of factors including: (i) lower than anticipated rate of patient enrollment, (ii) the initiation, timing, cost, progress and results of our preclinical and clinical studies and our research and development programs, (iii) our ability to advance product candidates into, and successfully complete, clinical studies, (iv) the timing or likelihood of regulatory filings and approvals, (v) our ability to develop, manufacture and commercialize our product candidates and to improve the manufacturing process, (vi) the rate and degree of market acceptance of our product candidates, (vii) the size and growth potential of the markets for our product candidates and our ability to serve those markets, (viii) our ability to obtain and maintain intellectual property protection for our product candidates and (ix) other risks and uncertainties detailed from time to time in our filings with the Securities and Exchange Commission, including without limitation our periodic reports on Form 10-K and 10-Q, each as amended and supplemented from time to time. Any forward-looking statement speaks only as of the date on which it was made. We undertake no obligation to publicly update or revise any forward-looking statement, whether as a result of new information, future events or otherwise, except as required by law. In this release, unless the context requires otherwise, “MAIA,” “Company,” “we,” “our,” and “us” refers to MAIA Biotechnology, Inc. and its subsidiaries.