LOS ALTOS, Calif., Sept. 03, 2024 (GLOBE NEWSWIRE) — Unicycive Therapeutics, Inc. (Nasdaq: UNCY), a clinical-stage biotechnology company developing therapies for patients with kidney disease (the “Company” or “Unicycive”), today announced that the Company has submitted a New Drug Application (NDA) to the U.S. Food and Drug Administration (FDA) for Oxylanthanum Carbonate (OLC) for the treatment of hyperphosphatemia in patients with chronic kidney disease (CKD) on dialysis. Unicycive is seeking FDA approval of OLC via the 505(b)(2) regulatory pathway.
“With this NDA submission, we are excited to be one step closer to our goal of bringing OLC to patients with chronic kidney disease who are living with hyperphosphatemia,” said Shalabh Gupta, MD, Chief Executive Officer of Unicycive. “We believe our data support a differentiated and best-in-class therapy that will maintain phosphate control while reducing the onerous pill burden patients currently have to manage. Over the last several months, our team has worked diligently to reach this milestone, and we are now preparing to launch OLC, if approved. We are also pleased to report that the FDA granted a waiver for the NDA application Prescription Drug User Fee Act (PDUFA) fees which is a significant savings of approximately $4 million.”
The NDA submission package is based on data from three clinical studies (a Phase 1 study in healthy volunteers, a bioequivalence study in healthy volunteers, and a tolerability study of OLC in CKD patients on dialysis), multiple preclinical studies, and the specifications and practices related to chemistry, manufacturing and controls (CMC).
About Oxylanthanum Carbonate (OLC)
Oxylanthanum carbonate is a next-generation lanthanum-based phosphate binding agent utilizing proprietary nanoparticle technology being developed for the treatment of hyperphosphatemia in patients with chronic kidney disease (CKD) on dialysis. OLC has over forty issued and granted patents globally. Its potential best-in-class profile may have meaningful patient adherence benefits over currently available treatment options as it requires a lower pill burden for patients in terms of number and size of pills per dose that are swallowed instead of chewed. Based on a survey conducted in 2022, Nephrologists stated that the greatest unmet need in the treatment of hyperphosphatemia with phosphate binders is a lower pill burden and better patient compliance.1 The global market opportunity for treating hyperphosphatemia is expected to exceed $2.5 billion, with the United States accounting for more than $1 billion of that total2. Despite the availability of several FDA-cleared medications, 75 percent of U.S. dialysis patients fail to achieve the target phosphorus levels recommended by published medical guidelines.
Fosrenol® is a registered trademark of Shire International Licensing BV. 1Reason Research, LLC 2022 survey. Results here. 2Fortune Business InsightsTM, Hyperphosphatemia Treatment Market, 2021-2028
About Hyperphosphatemia
Hyperphosphatemia is a serious medical condition that occurs in nearly all patients with End Stage Renal Disease (ESRD). If left untreated, hyperphosphatemia leads to secondary hyperparathyroidism (SHPT), which then results in renal osteodystrophy (a condition similar to osteoporosis and associated with significant bone disease, fractures and bone pain); cardiovascular disease with associated hardening of arteries and atherosclerosis (due to deposition of excess calcium-phosphorus complexes in soft tissue). Importantly, hyperphosphatemia is independently associated with increased mortality for patients with chronic kidney disease on dialysis. Based on available clinical data to date, over 80% of patients show signs of cardiovascular calcification by the time they become dependent on dialysis.
Dialysis patients are already at an increased risk for cardiovascular disease (because of underlying diseases such as diabetes and hypertension), and hyperphosphatemia further exacerbates this. Treatment of hyperphosphatemia is aimed at lowering serum phosphate levels via two means: (1) restricting dietary phosphorus intake; and (2) using, on a daily basis, and with each meal, oral phosphate binding drugs that facilitate fecal elimination of dietary phosphate rather than its absorption from the gastrointestinal tract into the bloodstream.
About Unicycive Therapeutics
Unicycive Therapeutics is a biotechnology company developing novel treatments for kidney diseases. Unicycive’s lead drug candidate, oxylanthanum carbonate (OLC), is a novel investigational phosphate binding agent being developed for the treatment of hyperphosphatemia in chronic kidney disease patients on dialysis. UNI-494 is a patent-protected new chemical entity in clinical development for the treatment of conditions related to acute kidney injury. For more information, please visit Unicycive.com and follow us on LinkedIn, X, and YouTube.
Forward-looking statements
Certain statements in this press release are forward-looking within the meaning of the Private Securities Litigation Reform Act of 1995. These statements may be identified using words such as “anticipate,” “believe,” “forecast,” “estimated” and “intend” or other similar terms or expressions that concern Unicycive’s expectations, strategy, plans or intentions. These forward-looking statements are based on Unicycive’s current expectations and actual results could differ materially. There are several factors that could cause actual events to differ materially from those indicated by such forward-looking statements. These factors include, but are not limited to, clinical trials involve a lengthy and expensive process with an uncertain outcome, and results of earlier studies and trials may not be predictive of future trial results; our clinical trials may be suspended or discontinued due to unexpected side effects or other safety risks that could preclude approval of our product candidates; risks related to business interruptions, which could seriously harm our financial condition and increase our costs and expenses; dependence on key personnel; substantial competition; uncertainties of patent protection and litigation; dependence upon third parties; and risks related to failure to obtain FDA clearances or approvals and noncompliance with FDA regulations. Actual results may differ materially from those indicated by such forward-looking statements as a result of various important factors, including: the uncertainties related to market conditions and other factors described more fully in the section entitled ‘Risk Factors’ in Unicycive’s Annual Report on Form 10-K for the year ended December 31, 2023, and other periodic reports filed with the Securities and Exchange Commission. Any forward-looking statements contained in this press release speak only as of the date hereof, and Unicycive specifically disclaims any obligation to update any forward-looking statement, whether as a result of new information, future events or otherwise.
Investigator-initiated Phase 2 trial to evaluate TNX-102 SL’s potential to reduce severity of acute stress reaction (ASR) and frequency of acute stress disorder (ASD) and posttraumatic stress disorder (PTSD) expected to begin third quarter 2024
Currently, no medication approved at or near point-of-care to treat patients suffering from traumatic events and support their long-term health
CHATHAM, N.J., Aug. 29, 2024 (GLOBE NEWSWIRE) — Tonix Pharmaceuticals Holding Corp. (Nasdaq: TNXP) (Tonix or the Company), a fully-integrated biopharmaceutical company with marketed products and a pipeline of development candidates, presented clinical data on? acute stress reaction and prevention of PTSD data of TNX-102 SL in two poster presentations and presented preclinical data demonstrating automated high-throughput assay enabling screening for therapeutics to accelerate wound healing in a third poster presentation at the 2024 Military Health System Research Symposium (MHSRS), held August 26-29, 2024, in Kissimmee, Fla. Copies of the Company’s posters, titled:
“Two Clinical Trials of Bedtime Sublingual Cyclobenzaprine (TNX-102 SL) in Military-Related Posttraumatic Stress Disorder (PTSD) Provide Rationale to Study TNX-102 SL in the Aftermath of Trauma to Reduce Acute Stress Disorder (ASD) and Prevent PTSD”;
“Development of the AURORA Platform Trial Network to Test Interventions to Reduce Acute Stress Reaction Symptoms, and Illustration of Use Testing Sublingual Cyclobenzaprine TNX-102 SL”;
“Integrating Automated High-Throughput Scratch Assay and Cell Painting for Comprehensive Analysis of Cell Migration and Wound Healing”, are available under the Scientific Presentations tab of the Tonix website at www.tonixpharma.com.
TNX-102 SL is being evaluated for the reduction in severity of acute stress reaction (ASR) and the frequency of acute stress disorder (ASD) and posttraumatic stress disorder (PTSD) when administered within 24 hours of trauma event. In two double-blind, randomized clinical trials of military-related PTSD, TNX-102 SL showed effects on sleep and PTSD symptoms in two and four weeks of treatment1. Supportive data on the effects of TNX-102 SL on reducing PTSD symptoms suggest early intervention immediately after trauma using TNX-102 SL has the potential to reduce ASR/ASD symptoms which are similar to those of PTSD2,3. TNX-102 SL has been well-tolerated with no recognized liability for tolerance or abuse. Data from these trials support testing of TNX-102 SL within 24 hours of index trauma for effects on acute stress reaction (ASR) symptoms and the incidence of PTSD. In the U.S. Department of Defense-funded Optimizing Acute Stress Reaction Interventions (OASIS) trial conducted by the University of North Carolina under an investigator-initiated investigational new drug (IND) application, 14 days of bedtime TNX-102 SL will be dosed and tested in the immediate aftermath of motor vehicle collision. The study will test the potential for TNX-102 SL to target trauma-related sleep disturbance and its ability to facilitate recovery from ASR and to prevent PTSD. The results may ultimately provide military personnel with a new treatment option that, when administered in the early aftermath of a traumatic event to individuals with ASR symptoms, improves warfighter function.
“In previous trials, TNX-102 SL has been shown to improve sleep quality in PTSD and increased activity on sleep and stress-related symptoms in the first several weeks of treatment after a trauma event”, said Seth Lederman, M.D., Chief Executive Officer of Tonix Pharmaceuticals. “Since sleep disturbance plays a critical role in the development and maintenance of PTSD, sleep improvements may reorient the trajectory of posttraumatic pathology from acute trauma towards early recovery. The OASIS study is driven by the observation that the symptoms of ASR and PTSD are similar and by the hypothesis that TNX-102 SL’s effect on sleep quality may reduce ASR symptoms, potentially providing military personnel, veterans, and civilians with a new treatment option that, when administered in the early aftermath of a traumatic event, improves recovery, job performance, and quality of life.”
The investigator-initiated OASIS trial will examine the safety and efficacy of TNX-102 SL to reduce adverse posttraumatic neuropsychiatric sequelae among patients presenting to the emergency department (ED) after a motor vehicle collision. The trial plans to enroll approximately 180 trauma survivors at ED study sites around the U.S. Participants will be randomized in the ED to receive a two-week course of either TNX-102 SL 5.6 mg or placebo. The first participant for the OASIS trial is expected to enroll in the third quarter of 2024.
The OASIS trial will build upon a foundation of knowledge and infrastructure developed through the UNC-led, $40 million AURORA initiative. AURORA is a major national research initiative to improve the understanding, prevention and recovery of individuals who experience a traumatic event. AURORA is supported by funding from the National Institutes of Health (NIH), leading brain health nonprofit One Mind, private foundations, and partnerships with leading tech companies, such as Mindstrong Health and Verily Life Sciences, the healthcare arm of Alphabet, the parent company of Google.
Acute and chronic stress disorders can affect both civilian and military populations. According to the National Center for PTSD, in the U.S. about 60% of men and 50% of women experience at least one trauma in their lives.4 In the U.S. alone, one-third of ED visits (40-50 million patients per year) involve evaluation after trauma exposures, and in a 2014 study involving 3,157 US veterans, 87% reported exposure to at least one potentially traumatic event during their service.5 Moreover, as many as 500,000 U.S. troops who served in wars between 2001 and 2015 were diagnosed with PTSD.6
The third poster, titled “Integrating Automated High-Throughput Scratch Assay and Cell Painting for Comprehensive Analysis of Cell Migration and Wound Healing”, demonstrated optimization of a highly efficient scratch-wound assay development method. The scratch-wound assay, commonly used to study wound healing, has limitations that the study addresses by introducing an automated miniaturized high-throughput wound healing assay, enabling mass screening and identification of novel therapies for wound-healing. The screening technology was merged with cell-painting to allow discovery of morphological characteristics to identify mechanism of action of drugs for wound healing.
Tonix Pharmaceuticals Holding Corp.* Tonix is a fully-integrated biopharmaceutical company focused on developing, licensing and commercializing therapeutics to treat and prevent human disease and alleviate suffering. Tonix recently announced the U.S. Department of Defense (DoD), Defense Threat Reduction Agency (DTRA) awarded it a contract for up to $34 million over five years in an Other Transaction Agreement (OTA) to develop TNX-4200 small molecule broad-spectrum antiviral agents targeting CD45 for the prevention or treatment of infections to improve the medical readiness of military personnel in biological threat environments. Tonix owns and operates a state-of-the art infectious disease research facility in Frederick, MD. The company’s Good Manufacutring Practice (GMP)-capable advanced manufacturing facility in Dartmouth, MA was purpose-built to manufacture TNX-801 and the GMP suites are ready to be reactivated in case of a national or international emergency. Tonix’s development portfolio is focused on central nervous system (CNS) disorders. Tonix’s priority is to submit a New Drug Application (NDA) to the FDA in the second half of 2024 for TNX-102 SL, a product candidate for which two statistically significant Phase 3 studies have been completed for the management of fibromyalgia. The FDA has granted Fast Track designation to TNX-102 SL for the management of fibromyalgia. TNX-102 SL is also being developed to treat acute stress reaction. Tonix’s CNS portfolio includes TNX-1300 (cocaine esterase), a biologic designed to treat cocaine intoxication that has Breakthrough Therapy designation. Tonix’s immunology development portfolio consists of biologics to address organ transplant rejection, autoimmunity and cancer, including TNX-1500, which is a humanized monoclonal antibody targeting CD40-ligand (CD40L or CD154) being developed for the prevention of allograft rejection and for the treatment of autoimmune diseases. Tonix also has product candidates in development in the areas of rare disease and infectious disease. Tonix Medicines, our commercial subsidiary, markets Zembrace® SymTouch® (sumatriptan injection) 3 mg and Tosymra® (sumatriptan nasal spray) 10 mg for the treatment of acute migraine with or without aura in adults.
*Tonix’s product development candidates are investigational new drugs or biologics and have not been approved for any indication.
Zembrace SymTouch and Tosymra are registered trademarks of Tonix Medicines. All other marks are property of their respective owners.
This press release and further information about Tonix can be found at www.tonixpharma.com.
TNX-102 SL (cyclobenzaprine HCl sublingual tablets) has not been approved for any indication; (Tonmya™ is conditionally approved by FDA for the management of fibromyalgia)
Sullivan GM, et al. Randomized clinical trial of bedtime sublingual cyclobenzaprine (TNX-102 SL) in military-related PTSD and the role of sleep quality in treatment response. Psychiatry Res. 2021 Jul;301:113974.
Parmenter ME, et al. A phase 3, randomized, placebo-controlled, trial to evaluate the efficacy and safety of bedtime sublingual cyclobenzaprine (TNX-102 SL) in military-related posttraumatic stress disorder. Psychiatry Res. 2024 (In Press). https://doi.org/10.1016/j.psychres.2024.115764
Goldstein RB, et al. Soc Psychiatry Psychiatr Epidemiol. 2016. 51(8):1137-48
Wisco BE, et al. J Clin Psychiatry. 2014. 75(12):1338-46
Thompson M. Time. 2015;185(12):40-3
Forward Looking Statements Certain statements in this press release are forward-looking within the meaning of the Private Securities Litigation Reform Act of 1995. These statements may be identified by the use of forward-looking words such as “anticipate,” “believe,” “forecast,” “estimate,” “expect,” and “intend,” among others. These forward-looking statements are based on Tonix’s current expectations and actual results could differ materially. There are a number of factors that could cause actual events to differ materially from those indicated by such forward-looking statements. These factors include, but are not limited to, risks related to the failure to obtain FDA clearances or approvals and noncompliance with FDA regulations; risks related to the failure to successfully market any of our products; risks related to the timing and progress of clinical development of our product candidates; our need for additional financing; uncertainties of patent protection and litigation; uncertainties of government or third party payor reimbursement; limited research and development efforts and dependence upon third parties; and substantial competition. As with any pharmaceutical under development, there are significant risks in the development, regulatory approval and commercialization of new products. Tonix does not undertake an obligation to update or revise any forward-looking statement. Investors should read the risk factors set forth in the Annual Report on Form 10-K for the year ended December 31, 2023, as filed with the Securities and Exchange Commission (the “SEC”) on April 1, 2024, and periodic reports filed with the SEC on or after the date thereof. All of Tonix’s forward-looking statements are expressly qualified by all such risk factors and other cautionary statements. The information set forth herein speaks only as of the date thereof.
JERICHO, N.Y.–(BUSINESS WIRE)– 1-800-FLOWERS.COM, Inc. (NASDAQ: FLWS), a leading provider of gifts designed to help inspire customers to give more, connect more, and build more and better relationships, today announced that Bill Shea has confirmed his intention to retire as Chief Financial Officer, effective December 29, 2024. The Board of Directors has appointed James Langrock as Chief Financial Officer, effective December 29, 2024.
“I want to take this opportunity to congratulate Bill on his upcoming retirement and to thank him for his three decades of tireless commitment to our company,” said Jim McCann, Chairman and Chief Executive Officer of 1-800-FLOWERS.COM, Inc. “Bill has been a terrific partner to me and a tremendous asset to our company during a period of tremendous growth and transformation. We wish Bill all the best upon his retirement.”
“I also want to congratulate James on his appointment to Chief Financial Officer upon Bill’s retirement,” Mr. McCann continued. “James has been a great addition to our leadership team since joining the Company and brings a great wealth of financial expertise to our company.”
Mr. Langrock joined 1-800-FLOWERS.COM, Inc. in April as Chief Administrative Officer, bringing a broad range of finance experience to the Company. Prior to joining the Company, Mr. Langrock held the position of Chief Financial Officer at several public and privately held companies, including Charcuterie Artisans, The Hain Celestial Group, and Monster Worldwide, Inc.
About 1-800-FLOWERS.COM, Inc.
1-800-FLOWERS.COM, Inc. is a leading provider of gifts designed to help inspire customers to give more, connect more, and build more and better relationships. The Company’s e-commerce business platform features an all-star family of brands, including: 1-800-Flowers.com®, 1-800-Baskets.com®, Cheryl’s Cookies®, Harry & David®, PersonalizationMall.com®, Shari’s Berries®, FruitBouquets.com®, Things Remembered®, Moose Munch®, The Popcorn Factory®, Wolferman’s Bakery®, Vital Choice®, and Simply Chocolate®. Through the Celebrations Passport® loyalty program, which provides members with free standard shipping and no service charge on eligible products across our portfolio of brands, 1-800-FLOWERS.COM, Inc. strives to deepen relationships with customers. The Company also operates BloomNet®, an international floral and gift industry service provider offering a broad-range of products and services designed to help members grow their businesses profitably; Napco℠, a resource for floral gifts and seasonal décor; DesignPac Gifts, LLC, a manufacturer of gift baskets and towers; and Alice’s Table®, a lifestyle business offering fully digital livestreaming and on demand floral, culinary and other experiences to guests across the country. 1-800-FLOWERS.COM, Inc. was recognized among America’s Most Trustworthy Companies by Newsweek. 1-800-FLOWERS.COM, Inc. was also recognized among the top 5 on the National Retail Federation’s 2021 Hot 25 Retailers list, which ranks the nation’s fastest-growing retail companies, and was named to the Fortune 1000 list in 2022. Shares in 1-800-FLOWERS.COM, Inc. are traded on the NASDAQ Global Select Market, ticker symbol: FLWS. For more information, visit 1800flowersinc.com.
FLWS–COMP FLWS-FN
Special Note Regarding Forward Looking Statements:
This press release contains forward-looking statements within the meaning of the Private Securities Litigation Reform Act of 1995. These forward-looking statements represent the Company’s current expectations or beliefs concerning future events and can generally be identified using statements that include words such as “estimate,” “expects,” “project,” “believe,” “anticipate,” “intend,” “plan,” “foresee,” “forecast,” “likely,” “should,” “will,” “target” or similar words or phrases. These forward-looking statements are subject to risks, uncertainties, and other factors, many of which are outside of the Company’s control, which could cause actual results to differ materially from the results expressed or implied in the forward-looking statements, including, but not limited to, statements regarding the Company’s ability to achieve its guidance for the full Fiscal year; the Company’s ability to leverage its operating platform and reduce its operating expense ratio; its ability to successfully integrate acquired businesses and assets; its ability to successfully execute its strategic initiatives; its ability to cost effectively acquire and retain customers; the outcome of contingencies, including legal proceedings in the normal course of business; its ability to compete against existing and new competitors; its ability to manage expenses associated with sales and marketing and necessary general and administrative and technology investments; its ability to reduce promotional activities and achieve more efficient marketing programs; and general consumer sentiment and industry and economic conditions that may affect levels of discretionary customer purchases of the Company’s products. The Company undertakes no obligation to publicly update any of the forward-looking statements, whether because of new information, future events or otherwise, made in this release or in any of its SEC filings. Consequently, you should not consider any such list to be a complete set of all potential risks and uncertainties. For a more detailed description of these and other risk factors, refer to the Company’s SEC filings, including the Company’s Annual Reports on Form 10-K and its Quarterly Reports on Form 10-Q.
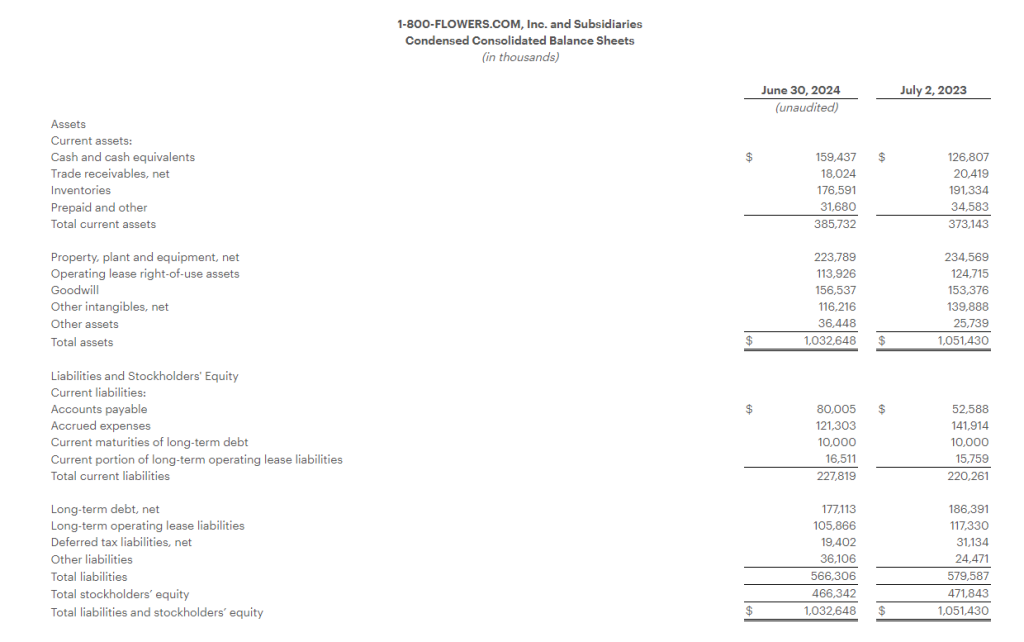
Reports Fiscal Year 2024 Revenue of $1.83 Billion and a Net Loss of $6.1 Million, which Includes a Non-Cash Impairment Charge of $19.8 million Recorded in the Second Quarter
Fiscal Year 2024 Gross Profit Margin Increased 260 Basis Points to 40.1%
Fiscal Year 2024 Adjusted EBITDA1 Increased to $93.1 million
Issues Fiscal Year 2025 Outlook
(1) Refer to “Definitions of Non-GAAP Financial Measures” and the tables attached at the end of this press release for reconciliation of non-GAAP results to applicable GAAP results.)
JERICHO, N.Y.–(BUSINESS WIRE)– 1-800-FLOWERS.COM, Inc. (NASDAQ: FLWS), a leading provider of gifts designed to help inspire customers to give more, connect more, and build more and better relationships, today reported results for its Fiscal 2024 fourth quarter and year ended June 30, 2024.
“In a dynamic consumer environment that impacted discretionary consumer spending, especially amongst lower income households, our organization was able to grow year-over-year adjusted EBITDA, which benefitted from our significant gross margin recovery and our expense optimization efforts that more than offset the top line decline,” said Jim McCann, Chairman and Chief Executive Officer of 1-800-FLOWERS.COM, Inc. “During Fiscal 2024, through our Relationship Innovation initiatives, we significantly enhanced our gifting platform, including category expansion, broadening our price points, increasing our assortment of gifts available for same-day delivery, and enhancing the user experience. We also experienced a significant recovery in our gross profit margin, which benefitted from a reversion to the mean on a number of commodity costs combined with our Work Smarter initiatives to operate more efficiently.”
“As we turn to Fiscal 2025, with our gross margin recovery well underway, our organization continues to be keenly focused on improving our sales trends by leveraging our Relationship Innovation initiatives. Acknowledging the uncertain consumer environment, we anticipate revenue trends improving as the fiscal year progresses as consumers respond to our newer offerings and services. We are confident in our strategic direction to be the gifting destination of choice for thoughtful and expressive gift-giving occasions and remain focused on delivering long-term value to our shareholders,” Mr. McCann continued.
Fiscal 2024 Fourth Quarter Highlights
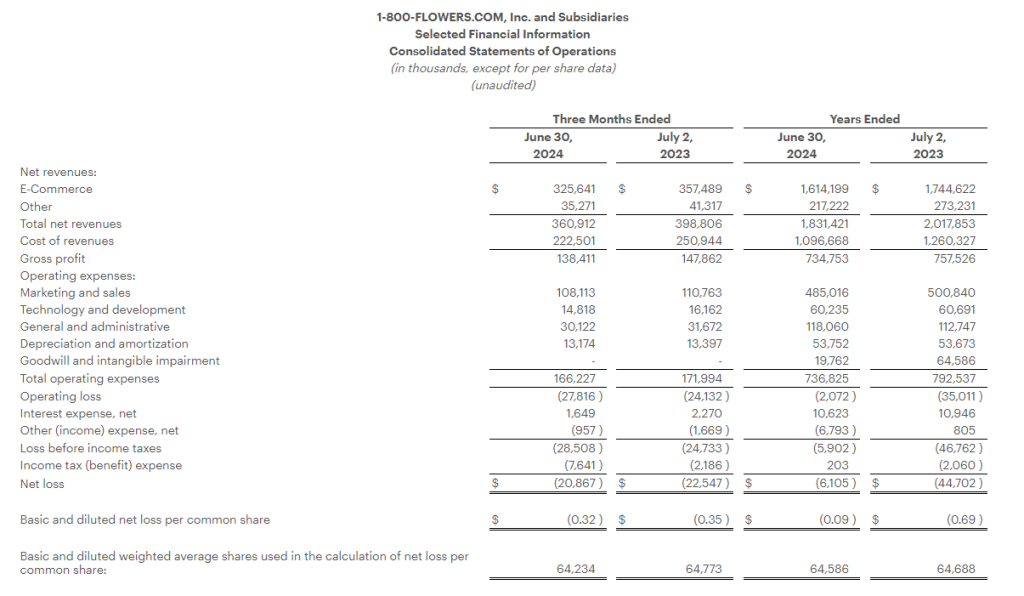
Total consolidated revenues decreased 9.5% to $360.9 million, compared with total consolidated revenues of $398.8 million in the prior year period.
Gross profit margin increased 130 basis points to 38.4%, compared with 37.1% in the prior year period. The gross profit margin improved on lower freight costs, a decline in certain commodity costs, and the Company’s logistics optimization efforts.
Operating expenses declined $5.8 million to $166.2 million, as compared with the prior year period.
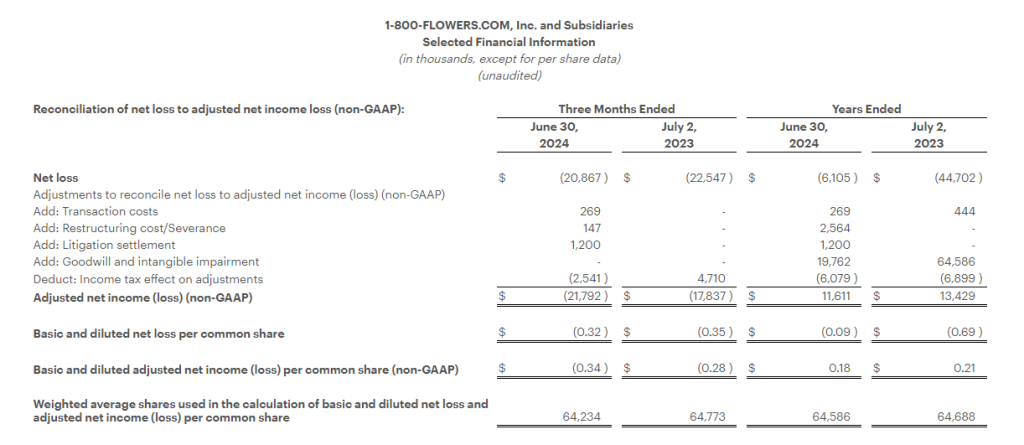
Net loss for the quarter was $20.9 million, or ($0.32) per share, as compared to a net loss of $22.5 million, or ($0.35) per share in the prior year period.
Adjusted Net Loss1 was $21.8 million, or ($0.34) per share, compared with an Adjusted Net Loss1 of $17.8 million, or ($0.28) per share, in the prior year period.
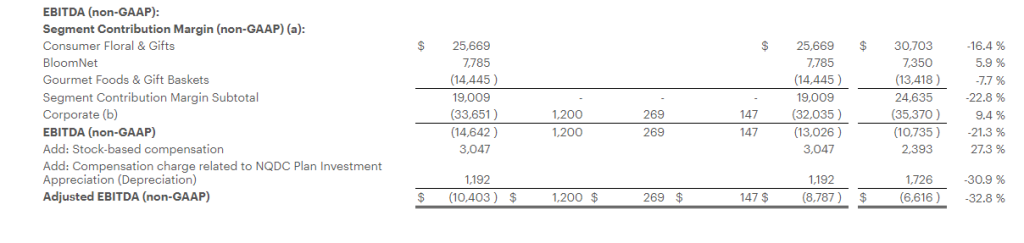
Adjusted EBITDA1 loss for the quarter was $8.8 million, as compared with an Adjusted EBITDA1 loss of $6.6 million in the prior year period.
Acquired Scharffen Berger Chocolate Maker, a high-end producer of extraordinary craft chocolates, that enhances and expands the Company’s chocolate offerings within its gourmet food and gift basket business. The acquisition closed after the fourth quarter ended.
Fiscal Year 2024 Highlights
Total consolidated revenues decreased 9.2% to $1.83 billion, compared with total consolidated revenues of $2.02 billion in the prior year period.
Gross profit margin increased 260 basis points to 40.1%, compared with 37.5% in the prior year period. The gross profit margin improved on lower freight costs, improved commodity costs, and the Company’s logistics optimization efforts.
Operating expenses declined $55.7 million to $736.8 million, as compared with the prior year period. Excluding impairment and other non-recurring charges in both periods, as well as the impact of the Company’s non-qualified deferred compensation plan in both periods, operating expenses declined by $22.2 million to $706.1 million, as compared with the prior year.
Net loss for the fiscal year was $6.1 million, or ($0.09) per share, compared with $44.7 million, or ($0.69) per share, in the prior year period. Both periods include impairment charges as outlined in the financial tables.
Adjusted Net Income1 was $11.6 million, or $0.18 per share, compared with Adjusted Net Income1 of $13.4 million, or $0.21 per share, in the prior year period.
Adjusted EBITDA1 for the fiscal year was $93.1 million, as compared with $91.2 million in the prior year period.
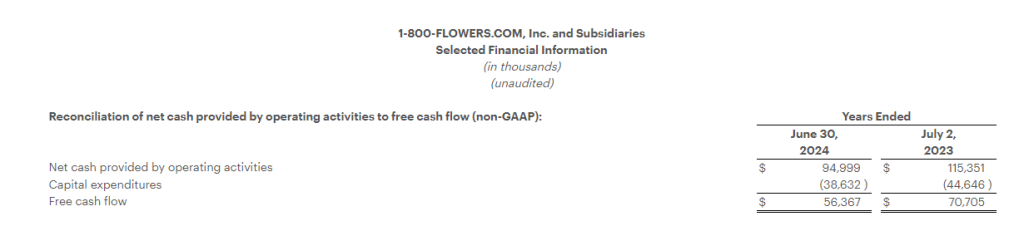
Net cash provided by operating activities was $95.0 million.
Generated Free Cash Flow1 of $56.4 million.
Segment Results
The Company provides Fiscal 2024 fourth quarter and full year selected financial results for its Gourmet Foods and Gift Baskets, Consumer Floral and Gifts, and BloomNet segments in the tables attached to this release and as follows:
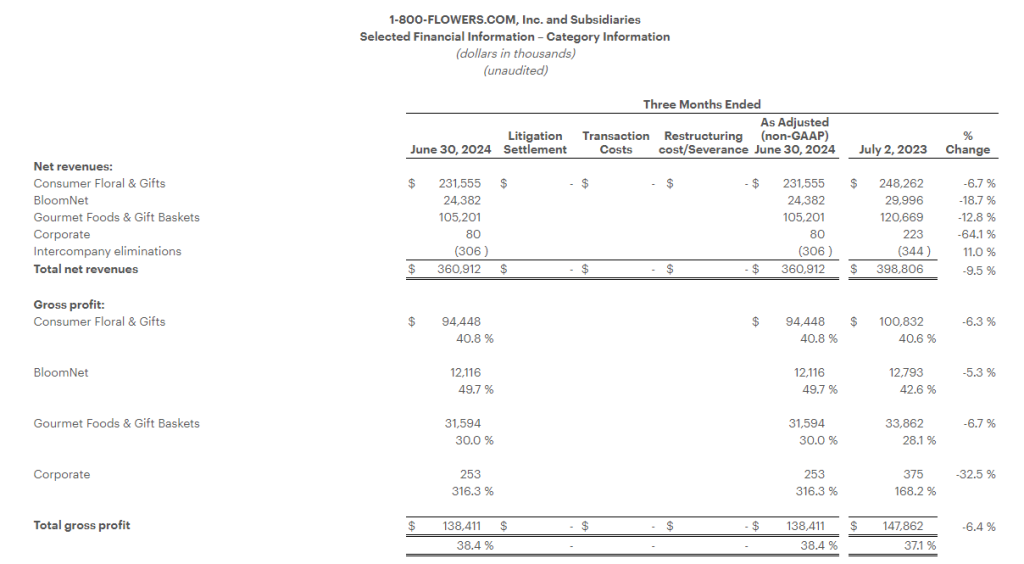
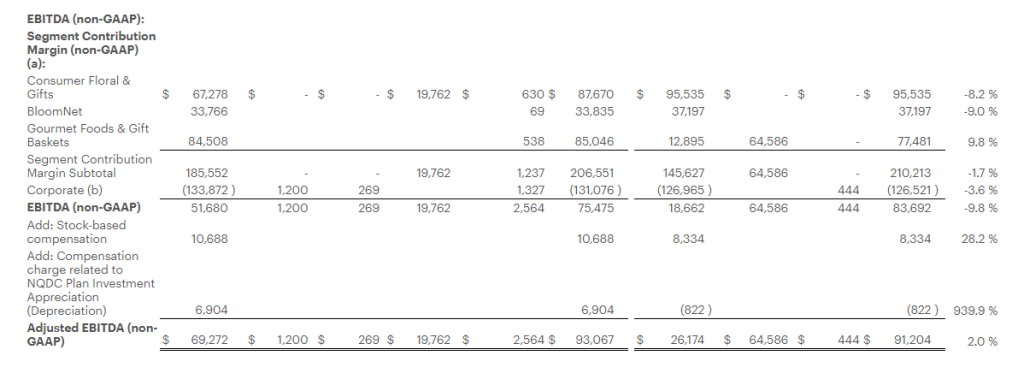
Gourmet Foods and Gift Baskets: Revenues for the quarter declined 12.8% to $105.2 million, as compared with the prior year period. Gross profit margin increased 190 basis points from the prior year period to 30.0%, benefiting from lower freight costs, the Company’s inventory and labor optimization efforts, as well as a decline in certain commodity costs. Segment contribution margin1 loss was $14.4 million, compared with a loss of $13.4 million in the prior year period.
For the full fiscal year, revenue decreased 9.4% to $874.3 million. Gross profit margin increased 340 basis points to 38.3%, benefiting from lower freight costs, the Company’s inventory and labor optimization efforts, as well as a decline in certain commodity costs. Excluding the impact of the severance charge in the current year and the impairment charge a year ago, segment contribution margin1 for the year was $85.0 million, compared with $77.5 million in the prior year.
Consumer Floral & Gifts: Revenues for the quarter declined 6.7% to $231.6 million, as compared with the prior year period. Gross profit margin increased 20 basis points from the prior year period to 40.8%. Segment contribution margin1 was $25.7 million, compared with $30.7 million in the prior year period.
For the full fiscal year, revenues decreased 7.7% to $849.8 million, as compared with the prior year period. Gross profit margin increased 130 basis points from the prior year period to 40.8%, improving on lower fulfillment costs and the Company’s logistics optimization efforts. Excluding the impact of the severance and impairment charges in the current year, segment contribution margin1 was $87.7 million, compared with $95.5 million in the prior year.
BloomNet: Revenues for the quarter declined 18.7% to $24.4 million, as compared with the prior year period. Revenue and gross margin were impacted by the lower volume of lower margin orders processed by BloomNet. Gross profit margin increased 710 basis points from the prior year period to 49.7%, also benefitting from lower ocean freight costs as well as product mix. Segment contribution margin1 was $7.8 million, compared with $7.4 million in the prior year period.
For the year, revenues decreased 19.1% to $107.8 million, as compared with the prior year period. Gross profit margin increased 550 basis points from the prior year period to 48.2% due to lower volume of lower margin orders, lower ocean freight costs, as well as product mix. Excluding the impact of the severance charge in the current year, segment contribution margin1 for the year was $33.8 million, compared with $37.2 million in the prior year.
Company Guidance
For Fiscal 2025, with a sustained challenging consumer environment, the Company expects revenue trends to improve as the fiscal year progresses benefitting from the company’s Relationship Innovation initiatives that have expanded the Company’s product offerings, broadened price points, and enhanced the user experience, combined with increased marketing spend. Additionally, the guidance assumes increased incentive compensation expense.
As a result, for Fiscal Year 2025 the Company expects:
total revenues on a percentage basis to be in a range of flat to a decrease in the low-single digits, as compared with the prior year;
Adjusted EBITDA1 to be in a range of $85 million to $95 million; and
Free Cash Flow1 to be in a range of $45 million to $55 million.
Conference Call
The Company will conduct a conference call to discuss the above details and attached financial results today, August 29, 2024, at 8:00 a.m. (ET). The conference call will be webcast from the Investors section of the Company’s website at www.1800flowersinc.com. A recording of the call will be posted on the Investors section of the Company’s website within two hours of the call’s completion. A telephonic replay of the call can be accessed beginning at 2:00 p.m. (ET) today through September 5, 2024, at: (US) 1-877-344-7529; (Canada) 855-669-9658; (International) 1-412-317-0088; enter conference ID #: 5141252.
Definitions of non-GAAP Financial Measures:
We sometimes use financial measures derived from consolidated financial information, but not presented in our financial statements prepared in accordance with U.S. generally accepted accounting principles (“GAAP”). Certain of these are considered “non-GAAP financial measures” under the U.S. Securities and Exchange Commission rules. Non-GAAP financial measures referred to in this document are either labeled as “non-GAAP” or designated as such with a “1”. See below for definitions and the reasons why we use these non-GAAP financial measures. Where applicable, see the Selected Financial Information below for reconciliations of these non-GAAP measures to their most directly comparable GAAP financial measures. Reconciliations for forward-looking figures would require unreasonable efforts at this time because of the uncertainty and variability of the nature and amount of certain components of various necessary GAAP components, including, for example, those related to compensation, tax items, amortization or others that may arise during the year, and the Company’s management believes such reconciliations would imply a degree of precision that would be confusing or misleading to investors. For the same reasons, the Company is unable to address the probable significance of the unavailable information. The lack of such reconciling information should be considered when assessing the impact of such disclosures.
EBITDA and Adjusted EBITDA:
We define EBITDA as net income (loss) before interest, taxes, depreciation, and amortization. Adjusted EBITDA is defined as EBITDA adjusted for the impact of stock-based compensation, Non-Qualified Plan Investment appreciation/depreciation, and for certain items affecting period-to-period comparability. See Selected Financial Information for details on how EBITDA and Adjusted EBITDA were calculated for each period presented. The Company presents EBITDA and Adjusted EBITDA because it considers such information meaningful supplemental measures of its performance and believes such information is frequently used by the investment community in the evaluation of similarly situated companies. The Company uses EBITDA and Adjusted EBITDA as factors to determine the total amount of incentive compensation available to be awarded to executive officers and other employees. The Company’s credit agreement uses EBITDA and Adjusted EBITDA to determine its interest rate and to measure compliance with certain covenants. EBITDA and Adjusted EBITDA are also used by the Company to evaluate and price potential acquisition candidates. EBITDA and Adjusted EBITDA have limitations as analytical tools and should not be considered in isolation or as a substitute for analysis of the Company’s results as reported under GAAP. Some of the limitations are: (a) EBITDA and Adjusted EBITDA do not reflect changes in, or cash requirements for, the Company’s working capital needs; (b) EBITDA and Adjusted EBITDA do not reflect the significant interest expense, or the cash requirements necessary to service interest or principal payments, on the Company’s debts; and (c) although depreciation and amortization are non-cash charges, the assets being depreciated and amortized may have to be replaced in the future and EBITDA does not reflect any cash requirements for such capital expenditures. EBITDA and Adjusted EBITDA should only be used on a supplemental basis combined with GAAP results when evaluating the Company’s performance.
Segment Contribution Margin and Adjusted Segment Contribution Margin
We define Segment Contribution Margin as earnings before interest, taxes, depreciation, and amortization, before the allocation of corporate overhead expenses. Adjusted Segment Contribution Margin is defined as Segment Contribution Margin adjusted for certain items affecting period-to-period comparability. See Selected Financial Information for details on how Segment Contribution Margin and Adjusted Segment Contribution Margin were calculated for each period presented. When viewed together with our GAAP results, we believe Segment Contribution Margin and Adjusted Segment Contribution Margin provide management and users of the financial statements meaningful information about the performance of our business segments. Segment Contribution Margin and Adjusted Segment Contribution Margin are used in addition to and in conjunction with results presented in accordance with GAAP and should not be relied upon to the exclusion of GAAP financial measures. The material limitation associated with the use of Segment Contribution Margin and Adjusted Segment Contribution Margin is that they are an incomplete measure of profitability as they do not include all operating expenses or non-operating income and expenses. Management compensates for this limitation when using these measures by looking at other GAAP measures, such as Operating Income and Net Income.
Adjusted Net Income (Loss) and Adjusted or Comparable Net Income (Loss) Per Common Share:
We define Adjusted Net Income (Loss) and Adjusted or Comparable Net Income (Loss) Per Common Share as Net Income (Loss) and Net Income (Loss) Per Common Share adjusted for certain items affecting period-to-period comparability. See Selected Financial Information below for details on how Adjusted Net Income (Loss) Per Common Share and Adjusted or Comparable Net Income (Loss) Per Common Share were calculated for each period presented. We believe that Adjusted Net Income (Loss) and Adjusted or Comparable Net Income (Loss) Per Common Share are meaningful measures because they increase the comparability of period-to-period results. Since these are not measures of performance calculated in accordance with GAAP, they should not be considered in isolation of, or as a substitute for, GAAP Net Income (Loss) and Net Income (Loss) Per Common share, as indicators of operating performance and they may not be comparable to similarly titled measures employed by other companies.
Free Cash Flow:
We define Free Cash Flow as net cash provided by operating activities less capital expenditures. The Company considers Free Cash Flow to be a liquidity measure that provides useful information to management and investors about the amount of cash generated by the business after the purchases of fixed assets, which can then be used to, among other things, invest in the Company’s business, make strategic acquisitions, strengthen the balance sheet, and repurchase stock or retire debt. Free Cash Flow is a liquidity measure that is frequently used by the investment community in the evaluation of similarly situated companies. Since Free Cash Flow is not a measure of performance calculated in accordance with GAAP, it should not be considered in isolation or as a substitute for analysis of the Company’s results as reported under GAAP. A limitation of the utility of Free Cash Flow as a measure of financial performance is that it does not represent the total increase or decrease in the Company’s cash balance for the period.
About 1-800-FLOWERS.COM, Inc.
1-800-FLOWERS.COM, Inc. is a leading provider of gifts designed to help inspire customers to give more, connect more, and build more and better relationships. The Company’s e-commerce business platform features an all-star family of brands, including: 1-800-Flowers.com®, 1-800-Baskets.com®, Cheryl’s Cookies®, Harry & David®, PersonalizationMall.com®, Shari’s Berries®, FruitBouquets.com®, Things Remembered®, Moose Munch®, The Popcorn Factory®, Wolferman’s Bakery®, Vital Choice®, and Simply Chocolate®. Through the Celebrations Passport® loyalty program, which provides members with free standard shipping and no service charge on eligible products across our portfolio of brands, 1-800-FLOWERS.COM, Inc. strives to deepen relationships with customers. The Company also operates BloomNet®, an international floral and gift industry service provider offering a broad-range of products and services designed to help members grow their businesses profitably; Napco℠, a resource for floral gifts and seasonal décor; DesignPac Gifts, LLC, a manufacturer of gift baskets and towers; and Alice’s Table®, a lifestyle business offering fully digital livestreaming and on demand floral, culinary and other experiences to guests across the country. 1-800-FLOWERS.COM, Inc. was recognized among America’s Most Trustworthy Companies by Newsweek. 1-800-FLOWERS.COM, Inc. was also recognized among the top 5 on the National Retail Federation’s 2021 Hot 25 Retailers list, which ranks the nation’s fastest-growing retail companies, and was named to the Fortune 1000 list in 2022. Shares in 1-800-FLOWERS.COM, Inc. are traded on the NASDAQ Global Select Market, ticker symbol: FLWS. For more information, visit 1800flowersinc.com or follow @1800FLOWERSInc on Twitter.
FLWS–COMP FLWS-FN
Special Note Regarding Forward Looking Statements:
This press release contains forward-looking statements within the meaning of the Private Securities Litigation Reform Act of 1995. These forward-looking statements represent the Company’s current expectations or beliefs concerning future events and can generally be identified using statements that include words such as “estimate,” “expects,” “project,” “believe,” “anticipate,” “intend,” “plan,” “foresee,” “forecast,” “likely,” “should,” “will,” “target” or similar words or phrases. These forward-looking statements are subject to risks, uncertainties, and other factors, many of which are outside of the Company’s control, which could cause actual results to differ materially from the results expressed or implied in the forward-looking statements, including, but not limited to, statements regarding the Company’s ability to achieve its guidance for the full Fiscal year; the Company’s ability to leverage its operating platform and reduce its operating expense ratio; its ability to successfully integrate acquired businesses and assets; its ability to successfully execute its strategic initiatives; its ability to cost effectively acquire and retain customers; the outcome of contingencies, including legal proceedings in the normal course of business; its ability to compete against existing and new competitors; its ability to manage expenses associated with sales and marketing and necessary general and administrative and technology investments; its ability to reduce promotional activities and achieve more efficient marketing programs; and general consumer sentiment and industry and economic conditions that may affect levels of discretionary customer purchases of the Company’s products. The Company undertakes no obligation to publicly update any of the forward-looking statements, whether because of new information, future events or otherwise, made in this release or in any of its SEC filings. Consequently, you should not consider any such list to be a complete set of all potential risks and uncertainties. For a more detailed description of these and other risk factors, refer to the Company’s SEC filings, including the Company’s Annual Reports on Form 10-K and its Quarterly Reports on Form 10-Q.
Note: The following tables are an integral part of this press release without which the information presented in this press release should be considered incomplete.
LIMASSOL, Cyprus, Aug. 28, 2024 (GLOBE NEWSWIRE) — GDEV Inc. (NASDAQ: GDEV), an international gaming and entertainment company (“GDEV” or the “Company”), announces that its financial results for the second quarter ended June 30, 2024 will be released at 8:00 a.m. (Eastern Time) on Wednesday, September 4, 2024.
GDEV will host a conference call and webcast to discuss its results at 09:00 a.m. U.S. Eastern Time the same day.
The press release, as well as supplementary slides will be available at gdev.inc. To listen to the audio webcast please follow this link. To participate in the conference call, please use the following details:
US toll-free dial: +1 844-543-0451 US local: +1 864-991-4103 United Kingdom toll-free: +44 808 175 1536 United Kingdom local: +44 1400 220156 Conference ID: 886570
For additional dial-in options, please use this link.
ABOUT GDEV GDEV is a hub of gaming studios, focused on development and growth of its franchise portfolio across various genres and platforms. With a diverse range of subsidiaries including Nexters and Cubic Games among others, GDEV strives to create games that will inspire and engage millions of players for years to come. Its franchises, such as Hero Wars, Island Hoppers, Pixel Gun 3D and others have accumulated hundreds of millions of installs worldwide. For more information, please visit gdev.inc
CONTACTS: Investor Relations Roman Safiyulin | Chief Corporate Development Officer investor@gdev.inc
CAUTIONARY STATEMENT REGARDING FORWARD-LOOKING STATEMENTS Certain statements in this press release may constitute “forward-looking statements” for purposes of the federal securities laws. Such statements are based on current expectations that are subject to risks and uncertainties. In addition, any statements that refer to projections, forecasts or other characterizations of future events or circumstances, including any underlying assumptions, are forward-looking statements.
The forward-looking statements contained in this press release are based on the Company’s current expectations and beliefs concerning future developments and their potential effects on the Company. There can be no assurance that future developments affecting the Company will be those that the Company has anticipated. Forward-looking statements involve a number of risks, uncertainties (some of which are beyond the Company’s control) or other assumptions. You should carefully consider the risks and uncertainties described in the “Risk Factors” section of the Company’s 2023 Annual Report on Form 20-F, filed by the Company on April 29, 2024, and other documents filed by the Company from time to time with the Securities and Exchange Commission. Should one or more of these risks or uncertainties materialize, or should any of the Company’s assumptions prove incorrect, actual results may vary in material respects from those projected in these forward-looking statements. Forward-looking statements speak only as of the date they are made. Readers are cautioned not to put undue reliance on forward-looking statements, and the Company undertakes no obligation to update or revise any forward-looking statements, whether as a result of new information, future events or otherwise, except as may be required under applicable securities laws.
Oral presentation highlighted results from confirmatory Phase 3 RESILIENT study of TNX-102 SL (sublingual cyclobenzaprine HCl) treatment demonstrating statistically significant improvement in primary endpoint of fibromyalgia nociplastic pain and in all six key secondary endpoints, including sleep quality
NDA submission on track for second half 2024; Fast Track designation granted by FDA; FDA decision expected 2025
TNX-102 SL is a potential non-opiod analgesic targeting non-restorative sleep in fibromyalgia: Post hoc analyses highlight strong correlations between improvements in nociplastic pain and sleep quality
Nociplastic pain originates from altered pain perception in the brain and is the type of pain that manifests in fibromyalgia and other chronic overlapping pain conditions (COPCs)
CHATHAM, N.J., Aug. 28, 2024 (GLOBE NEWSWIRE) — Tonix Pharmaceuticals Holding Corp. (Nasdaq: TNXP) (Tonix or the Company), a fully-integrated biopharmaceutical company with marketed products and a pipeline of development candidates, presented data in an oral presentation at the 2024 Military Health System Research Symposium (MHSRS), held August 26-29, 2024, in Kissimmee, Fla. A copy of the Company’s presentation, titled “Assuaging Agony: Novel Pain Therapeutics”, is available under the Scientific Presentations tab of the Tonix website at www.tonixpharma.com.
In the Phase 3 RESILIENT study, TNX-102 SL met the pre-specified primary endpoint of significantly reducing daily pain compared to placebo (p-value=0.00005) in participants with fibromyalgia. TNX-102 SL demonstrated broad syndromal benefits with statistically significant improvement in all six pre-specified key secondary endpoints including those related to improving sleep quality, reducing fatigue, and improving patient global ratings and overall fibromyalgia symptoms and function. A post hoc analysis showed strong correlations between improvements in pain and sleep quality at Week 14, supporting the concept that targeting sleep quality has the potential to achieve syndromal improvement in fibromyalgia. TNX-102 SL was well tolerated with an adverse event profile comparable to prior studies and no new safety signals observed.
“Traditional analgesics like NSAIDs or opioids often prove ineffective, if not deleterious, as strategies for treating fibromyalgia,” said Seth Lederman, M.D., Chief Executive Officer of Tonix Pharmaceuticals. “In contrast, TNX-102 SL provided broad-spectrum symptom relief in the Phase 3 RESILIENT study and was designed as a bedtime treatment to target non-restorative sleep and improve sleep quality. With the statistically significant results of two positive Phase 3 studies of TNX-102 SL in fibromyalgia we believe TNX-102 SL has the potential to be the first new treatment option for fibromyalgia patients in 15 years.”
Dr. Lederman continued, “Fibromyalgia is the prototypic nociplastic syndrome and chronic overlapping pain condition (COPC)3,4,5. Our results in fibromyalgia suggest potential for TNX-102 SL in treating other COPCs like post-concussive syndrome6, in which sleep disturbances correlate with persistence and severity. In addition, we expect to begin enrolling this quarter in a trial of TNX-102 SL for acute stress disorder/acute stress reaction in the immediate aftermath of motor vehicle collision in the U.S. Department of Defense (DoD)-funded Optimizing Acute Stress Reaction Interventions (OASIS) trial conducted by the University of North Carolina under an investigator-initiated investigational new drug (IND) application.
Tonix remains on track to submit a new drug application (NDA) to the FDA in the second half of 2024 for TNX-102 SL for the management of fibromyalgia. A decision on approval is expected in 2025.
1Moldofsky H, et al. Psychosom Med. 1975;37:341-51
2Moldofsky H, Scarisbrick P. Psychosom Med. 1976;38:35-44
3Fitzcharles MA, et al. Lancet. 2021;397:2098-110
4Clauw DJ. Ann Rheum Dis. Published Online First: 2024
5Kaplan CM, et al. Nat Rev Neurol. 2024;20, 347–363
6Kureshi S et al. Healthcare (Basel) 2024 12(3): 289.
About Fibromyalgia
Fibromyalgia is a chronic pain disorder that is understood to result from amplified sensory and pain signaling within the central nervous system. Fibromyalgia afflicts more than 10 million adults in the U.S., the majority of whom are women. Symptoms of fibromyalgia include chronic widespread pain, non-restorative sleep, fatigue, and brain fog (or cognitive dysfunction). Other associated symptoms include mood disturbances, including anxiety and depression, headaches, and abdominal pain or cramps. Individuals suffering from fibromyalgia struggle with their daily activities, have impaired quality of life, and frequently are disabled. Physicians and patients report common dissatisfaction with currently marketed products. According to the recent report from the U.S. National Academies of Sciences, fibromyalgia is a diagnosable condition that may also occur in the context of Long COVID
About TNX-102 SL
TNX-102 SL is a centrally acting, non-opioid, non-addictive, bedtime investigational drug. The tablet is a patented sublingual formulation of cyclobenzaprine hydrochloride developed for the management of fibromyalgia. In December 2023, the company announced highly statistically significant and clinically meaningful topline results in RESILIENT, the second pivotal Phase 3 clinical trial of TNX-102 SL for the management of fibromyalgia. In the study, TNX-102 SL met its pre-specified primary endpoint, significantly reducing daily pain compared to placebo (p=0.00005) in participants with fibromyalgia. Statistically significant and clinically meaningful results were also seen in all six key secondary endpoints related to improving sleep quality, reducing fatigue and improving overall fibromyalgia symptoms and function. RELIEF, the first statistically significant Phase 3 trial of TNX-102 SL in fibromyalgia, was completed in December 2020. It met its pre-specified primary endpoint of daily pain reduction compared to placebo (p=0.010) and showed activity in key secondary endpoints. In both pivotal studies, the most common treatment-emergent adverse event was tongue or mouth numbness at the administration site, which was temporally related to dosing, self-limited, never rated as severe, and rarely led to study discontinuation (one participant in each study). TNX-102 SL was recently granted Fast Track Designation by the FDA for the management of fibromyalgia and remains on track to submit an NDA to FDA in the second half of 2024.
About Nociplastic Pain
Nociplastic pain is the third category of pain distinct from nociceptive pain and neuropathic pain. Nociplastic pain is characterized by pain arising from altered nociception despite no evidence of actual or threatened tissue damage causing activation of peripheral nociceptors or somatosensory system disease or lesion. Its underlying pathophysiology involves altered pain processing by the central nervous system (CNS). Nociplastic syndromes, officially recognized by the International Association for the Study of Pain (IASP) in 2017, also include several other chronic overlapping pain conditions: myalgic encephalomyelitis/chronic fatigue syndrome, irritable bowel syndrome, temporomandibular disorders, forms of chronic back pain and chronic headache. The pathophysiology of nociplastic pain involves central sensitization (CS), where neurons of the CNS become hyperexcitable, amplifying pain signals. CS can be triggered by peripheral pain stimuli, emotional stress, or other factors, leading to persistent pain despite no peripheral nociceptive input.
Tonix Pharmaceuticals Holding Corp.*
Tonix is a fully-integrated biopharmaceutical company focused on developing, licensing and commercializing therapeutics to treat and prevent human disease and alleviate suffering. Tonix recently announced the U.S. DoD, Defense Threat Reduction Agency (DTRA) awarded it a contract for up to $34 million over five years to develop TNX-4200 small molecule broad-spectrum antiviral agents targeting CD45 for the prevention or treatment of infections to improve the medical readiness of military personnel in biological threat environments. Tonix owns and operates a state-of-the art infectious disease research facility in Frederick, MD. The company also owns a Good Manufacutring Practice (GMP)-capable advanced manufacturing facility in Dartmouth, MA, which was purpose-built to manufacture TNX-801, a potential mpox vaccine, and the GMP suites are ready to be reactivated in case of a national emergency. Tonix’s development portfolio is focused on CNS disorders. Tonix’s priority is to submit an NDA to the FDA in the second half of 2024 for TNX-102 SL, a product candidate for which two statistically significant Phase 3 studies have been completed for the management of fibromyalgia. The FDA has granted Fast Track designation to TNX-102 SL for the management of fibromyalgia. TNX-102 SL is also being developed to treat acute stress reaction. Tonix’s CNS portfolio includes TNX-1300 (cocaine esterase), a biologic designed to treat cocaine intoxication that has Breakthrough Therapy designation, which is enrolling in a potential pivotal Phase 2 trial. Tonix’s immunology development portfolio consists of biologics to address organ transplant rejection, autoimmunity and cancer, including TNX-1500, which is a humanized monoclonal antibody targeting CD40-ligand (CD40L or CD154) being developed for the prevention of allograft rejection and for the treatment of autoimmune diseases. Tonix also has product candidates in development in the areas of rare disease and infectious disease. Tonix Medicines, our commercial subsidiary, markets Zembrace® SymTouch® (sumatriptan injection) 3 mg and Tosymra® (sumatriptan nasal spray) 10 mg for the treatment of acute migraine with or without aura in adults.
*Tonix’s product development candidates are investigational new drugs or biologics and have not been approved for any indication.
Zembrace SymTouch and Tosymra are registered trademarks of Tonix Medicines. All other marks are property of their respective owners.
This press release and further information about Tonix can be found at www.tonixpharma.com.
Forward Looking Statements
Certain statements in this press release are forward-looking within the meaning of the Private Securities Litigation Reform Act of 1995. These statements may be identified by the use of forward-looking words such as “anticipate,” “believe,” “forecast,” “estimate,” “expect,” and “intend,” among others. These forward-looking statements are based on Tonix’s current expectations and actual results could differ materially. There are a number of factors that could cause actual events to differ materially from those indicated by such forward-looking statements. These factors include, but are not limited to, risks related to the failure to obtain FDA clearances or approvals and noncompliance with FDA regulations; risks related to the failure to successfully market any of our products; risks related to the timing and progress of clinical development of our product candidates; our need for additional financing; uncertainties of patent protection and litigation; uncertainties of government or third party payor reimbursement; limited research and development efforts and dependence upon third parties; and substantial competition. As with any pharmaceutical under development, there are significant risks in the development, regulatory approval and commercialization of new products. Tonix does not undertake an obligation to update or revise any forward-looking statement. Investors should read the risk factors set forth in the Annual Report on Form 10-K for the year ended December 31, 2023, as filed with the Securities and Exchange Commission (the “SEC”) on April 1, 2024, and periodic reports filed with the SEC on or after the date thereof. All of Tonix’s forward-looking statements are expressly qualified by all such risk factors and other cautionary statements. The information set forth herein speaks only as of the date thereof.
MALVERN, Pa., Aug. 28, 2024 (GLOBE NEWSWIRE) — Ocugen, Inc. (“Ocugen” or the “Company”) (NASDAQ: OCGN), a biotechnology company focused on discovering, developing, and commercializing novel gene and cell therapies and vaccines, today announced that dosing is complete in the third cohort of its Phase 1/2 GARDian clinical trial for OCU410ST (AAV-hRORA)—a modifier gene therapy candidate being developed for Stargardt disease. Stargardt disease affects approximately 100,000 people in the United States (U.S.) and Europe.
“With all patients dosed in cohort 3 (high dose), Phase 1 of the dose-escalation portion of the trial is complete,” said Dr. Huma Qamar, Chief Medical Officer of Ocugen. “We will continue to advance the trial as efficiently as possible, and work toward fulfilling an unmet medical need for Stargardt patients.”
Three subjects received a single subretinal injection of the highest dose (2.25×10¹¹ vg/mL) being tested. The GARDian clinical trial is being performed at six leading retinal surgery centers across the U.S.
“OCU410ST is a novel modifier gene therapy that has the potential to be a one-time treatment given by subretinal injection in the operating room,” said Charles Wykoff, MD, PhD, Director of Research, Retina Consultants of Texas, lead investigator in the study. “The safety and tolerability profile of OCU410ST remains encouraging as the clinical trial progresses and brings hope to patients with Stargardt disease, who have no FDA-approved treatment options.”
The GARDian clinical trial will assess the safety and efficacy of unilateral subretinal administration of OCU410ST in subjects with Stargardt disease and will be conducted in two phases. Phase 1 is a multicenter, open-label, dose-ranging study consisting of three dose levels [low dose (3.75×10¹⁰ vg/mL), medium dose (7.5×10¹⁰ vg/mL), and high dose (2.25×10¹¹ vg/mL)].
Ocugen remains committed to advancing treatments for blindness, focusing on innovative gene therapy solutions that aim to provide lasting benefits to patients.
The Company will continue to provide clinical updates on a periodic basis.
About Stargardt Disease Stargardt disease is a genetic eye disorder that causes retinal degeneration and vision loss. Stargardt disease is the most common form of inherited macular degeneration. The progressive vision loss associated with Stargardt disease is caused by the degeneration of photoreceptor cells in the central portion of the retina called the macula.
Decreased central vision due to loss of photoreceptors in the macula is the hallmark of Stargardt disease. Some peripheral vision is usually preserved. Stargardt disease typically develops during childhood or adolescence, but the age of onset and rate of progression can vary. The retinal pigment epithelium (RPE), a layer of cells supporting photoreceptors, is also affected in people with Stargardt disease.
About OCU410ST OCU410ST utilizes an AAV delivery platform for the retinal delivery of the RORA (RAR Related Orphan Receptor A) gene. It represents Ocugen’s modifier gene therapy approach, which is based on Nuclear Hormone Receptor (NHR) RORA that regulates pathway links to Stargardt disease such as lipofuscin formation, oxidative stress, compliment formation, inflammation, and cell survival networks.
About Ocugen, Inc. Ocugen, Inc. is a biotechnology company focused on discovering, developing, and commercializing novel gene and cell therapies and vaccines that improve health and offer hope for patients across the globe. We are making an impact on patients’ lives through courageous innovation—forging new scientific paths that harness our unique intellectual and human capital. Our breakthrough modifier gene therapy platform has the potential to treat multiple retinal diseases with a single product, and we are advancing research in infectious diseases to support public health and orthopedic diseases to address unmet medical needs. Discover more at www.ocugen.com and follow us on X and LinkedIn.
Forward-Looking Statements This press release contains forward-looking statements within the meaning of The Private Securities Litigation Reform Act of 1995, including, but not limited to, statements regarding qualitative assessments of available data, potential benefits, expectations for ongoing clinical trials, anticipated regulatory filings and anticipated development timelines, which are subject to risks and uncertainties. We may, in some cases, use terms such as “predicts,” “believes,” “potential,” “proposed,” “continue,” “estimates,” “anticipates,” “expects,” “plans,” “intends,” “may,” “could,” “might,” “will,” “should,” or other words that convey uncertainty of future events or outcomes to identify these forward-looking statements. Such statements are subject to numerous important factors, risks, and uncertainties that may cause actual events or results to differ materially from our current expectations, including, but not limited to, the risks that preliminary, interim and top-line clinical trial results may not be indicative of, and may differ from, final clinical data; that unfavorable new clinical trial data may emerge in ongoing clinical trials or through further analyses of existing clinical trial data; that earlier non-clinical and clinical data and testing of may not be predictive of the results or success of later clinical trials; and that that clinical trial data are subject to differing interpretations and assessments, including by regulatory authorities. These and other risks and uncertainties are more fully described in our periodic filings with the Securities and Exchange Commission (SEC), including the risk factors described in the section entitled “Risk Factors” in the quarterly and annual reports that we file with the SEC. Any forward-looking statements that we make in this press release speak only as of the date of this press release. Except as required by law, we assume no obligation to update forward-looking statements contained in this press release whether as a result of new information, future events, or otherwise, after the date of this press release.
RICHMOND, Va.–(BUSINESS WIRE)– Bowlero Corp. (NYSE: BOWL) (“Bowlero” or the “Company”), one of the world’s premier operators of location-based entertainment, will report financial results for the fourth quarter and full year fiscal 2024 on Thursday, September 5, 2024, after the U.S. stock market closes. Management will discuss the results via webcast at 4:30 PM ET on the same day.
The live webcast, replay, and results presentation will be available in the Events & Presentations section of the Bowlero Investor Relations website at https://ir.bowlerocorp.com/ .
About Bowlero Corp.
Bowlero Corporation is one of the world’s premier operators of location-based entertainment. With approximately 350 locations across North America, the Company serves more than 40 million guest visits annually through a family of brands that include Lucky Strike, Bowlero and AMF. In 2019, Bowlero acquired the Professional Bowlers Association, the major league of bowling and a growing media property that boasts millions of fans around the globe. For more information on Bowlero, please visit BowleroCorp.com.
MALVERN, Pa., Aug. 26, 2024 (GLOBE NEWSWIRE) — Ocugen, Inc. (“Ocugen” or the “Company”) (NASDAQ: OCGN), a biotechnology company focused on discovering, developing, and commercializing novel gene and cell therapies and vaccines, today announced that Health Canada provided a “No Objection Letter” to initiate the OCU400 Phase 3 liMeliGhT (pronounced “limelight”) clinical trial in Canada. OCU400 is a modifier gene therapy product candidate being developed for retinitis pigmentosa (RP).
“Expanding the clinical trial to Canada is significant as it will provide an opportunity to reach a broader patient population encompassing many gene mutations associated with RP,” said Dr. Shankar Musunuri, Chairman, CEO, and Co-Founder of Ocugen. “The Health Canada trial will run in parallel with the U.S. FDA trial, expediting the ability to potentially provide a gene-agnostic treatment option to approximately 110,000 patients in the United States (U.S.) and Canada.”
Currently there are approximately 10,000 patients in Canada with RP and 1.6 million patients globally. The Phase 3 study in Canada will enroll up to 50 subjects across a maximum of 5 sites for the liMeliGhT clinical trial.
Over 200 mutations in more than 100 genes have been linked to RP. The Phase 3 study, spanning one year, will enroll 150 participants divided into two study arms: 75 participants with RHO gene mutations and 75 participants who are gene agnostic. In each arm, participants will be randomized in a 2:1 ratio to receive either treatment (2.5 x 10¹⁰ vg/eye of OCU400) or remain in an untreated control group, respectively. The liMeliGhT study is recruiting patients aged eight and older, covering the full spectrum from early to late stages of RP progression.
An enhanced sensitive and specific measurement of functional vision test—Luminance Dependent Navigation Assessment (LDNA)—is the primary endpoint for the study. Specifically, the primary endpoint is a measurement of the change in functional vision from baseline to week 52 as measured by the ability of a study participant to navigate through a maze (the LDNA). Those who demonstrate an improved ability to navigate the maze in dimmer light (i.e., by ≥2 Lux levels) compared to baseline will be classified as “responders” to the therapy. The liMeliGhT study will focus on the proportion of responders in both the treated and untreated eyes.
“Establishing clinical sites in Canada may expedite recruitment and open doors for broader commercialization with the U.S. and Europe,” said Dr. Huma Qamar, Chief Medical Officer at Ocugen. “With only one currently approved treatment targeting a single mutation associated with RP, there remains a significant unmet medical need, and patients worldwide are eager for new therapeutic options. It is highly rewarding to extend our efforts into a new region and offer hope to Canadian patients with RP.”
Ocugen previously announced that OCU400 has received orphan drug and RMAT designations from the FDA. OCU400 remains on track for the 2026 BLA and MAA approval targets.
About OCU400
OCU400 is the Company’s modifier gene therapy product based on a nuclear hormone receptor gene called NR2E3. This gene regulates diverse physiological functions within the retina, such as photoreceptor development and maintenance, metabolism, phototransduction, inflammation, and cell survival. Retinal cells in RP patients have a dysfunctional gene network, and OCU400 resets this network to reestablish a healthy cellular homeostasis—which has the potential to improve vision in patients with RP.
About RP
RP is a group of rare genetic disorders that cause a breakdown in the cells of the retina, leading to vision loss and blindness. RP is associated with mutations in more than 100 genes.
There are no approved treatment options that slow or stop the progression of multiple forms of RP. Proposed treatments for RP include gene replacement therapy, retinal implant devices, retinal transplantation, stem cells, vitamin therapy, and other pharmacological treatments. Current gene replacement therapies are promising but are limited to treating just a single mutation. In addition, while gene therapies may provide a new functional gene, they do not necessarily eliminate the underlying genetic defect, which may still cause stress and toxic effects leading to retinal degeneration. Therefore, the development of gene-specific replacement therapy will not address all forms of RP, especially when multiple and unknown genes are involved. Thus, novel therapeutic approaches targeting the broader RP disease in a gene-agnostic manner offer greater hope for patients.
About Ocugen, Inc.
Ocugen, Inc. is a biotechnology company focused on discovering, developing, and commercializing novel gene and cell therapies, biologics, and vaccines that improve health and offer hope for patients across the globe. We are making an impact on patients’ lives through courageous innovation—forging new scientific paths that harness our unique intellectual and human capital. Our breakthrough modifier gene therapy platform has the potential to treat multiple retinal diseases with a single product, and we are advancing research in infectious diseases to support public health and orthopedic diseases to address unmet medical needs. Discover more at www.ocugen.com and follow us on X and LinkedIn.
Forward-Looking Statements
This press release contains forward-looking statements within the meaning of The Private Securities Litigation Reform Act of 1995, including, but not limited to, statements regarding qualitative assessments of available data, potential benefits, expectations for ongoing clinical trials, anticipated regulatory filings and anticipated development timelines, which are subject to risks and uncertainties. We may, in some cases, use terms such as “predicts,” “believes,” “potential,” “proposed,” “continue,” “estimates,” “anticipates,” “expects,” “plans,” “intends,” “may,” “could,” “might,” “will,” “should,” or other words that convey uncertainty of future events or outcomes to identify these forward-looking statements. Such statements are subject to numerous important factors, risks, and uncertainties that may cause actual events or results to differ materially from our current expectations, including, but not limited to, the risks that preliminary, interim and top-line clinical trial results may not be indicative of, and may differ from, final clinical data; that unfavorable new clinical trial data may emerge in ongoing clinical trials or through further analyses of existing clinical trial data; that earlier non-clinical and clinical data and testing of may not be predictive of the results or success of later clinical trials; and that that clinical trial data are subject to differing interpretations and assessments, including by regulatory authorities. These and other risks and uncertainties are more fully described in our periodic filings with the Securities and Exchange Commission (SEC), including the risk factors described in the section entitled “Risk Factors” in the quarterly and annual reports that we file with the SEC. Any forward-looking statements that we make in this press release speak only as of the date of this press release. Except as required by law, we assume no obligation to update forward-looking statements contained in this press release whether as a result of new information, future events, or otherwise, after the date of this press release.
LOS ALTOS, Calif., Aug. 26, 2024 (GLOBE NEWSWIRE) — Unicycive Therapeutics, Inc. (Nasdaq: UNCY), a clinical-stage biotechnology company developing therapies for patients with kidney disease (the “Company” or “Unicycive”), today announced that three poster presentations will be delivered on the Company’s product candidates at the American Society of Nephrology (ASN) Kidney Week 2024 taking place October 24-27, 2024 in San Diego, CA.
“Data from both oxylanthanum carbonate (OLC) and UNI-494 continue to garner strong interest from the medical community, and we look forward to presenting our data at Kidney Week, one of the most prominent meetings in our field,” said Shalabh Gupta, MD, Chief Executive Officer of Unicycive.
Title:
Intravenous UNI-494 Slows the Progression or Halts/Reverses Acute Kidney Injury When Administered After Ischemia/Reperfusion in Rats
Saturday, October 26, 2024 from 10:00 a.m. – 12:00 p.m. PT
Title:
UNI-494 Phase I Safety, Tolerability, and Pharmacokinetics
Lead Author:
Guru Reddy, PH.D., Vice President of Preclinical R&D, Unicycive
Session Title:
AKI: Clinical, Outcomes, and Trials – Management
Poster Board:
#SA-PO036
Date/Time:
Saturday, October 26, 2024 from 10:00 a.m. – 12:00 p.m. PT
About Oxylanthanum Carbonate (OLC)
Oxylanthanum carbonate is a next-generation lanthanum-based phosphate binding agent utilizing proprietary nanoparticle technology being developed for the treatment of hyperphosphatemia in patients with chronic kidney disease (CKD). OLC has over forty issued and granted patents globally. Its potential best-in-class profile may have meaningful patient adherence benefits over currently available treatment options as it requires a lower pill burden for patients in terms of number and size of pills per dose that are swallowed instead of chewed. Based on a survey conducted in 2022, Nephrologists stated that the greatest unmet need in the treatment of hyperphosphatemia with phosphate binders is a lower pill burden and better patient compliance.1 The global market opportunity for treating hyperphosphatemia is projected to be in excess of $2.5 billion in 2023, with the United States accounting for more than $1 billion of that total. Despite the availability of several FDA-cleared medications, 75 percent of U.S. dialysis patients fail to achieve the target phosphorus levels recommended by published medical guidelines.
Unicycive is seeking FDA approval of OLC via the 505(b)(2) regulatory pathway. As part of the clinical development program, two clinical studies were conducted in over 100 healthy volunteers. The first study was a dose-ranging Phase I study to determine safety and tolerability. The second study was a randomized, open-label, two-way crossover bioequivalence study to establish pharmacodynamic bioequivalence between OLC and Fosrenol. Based on the results of the bioequivalence study, pharmacodynamic (PD) bioequivalence of OLC to Fosrenol was established. A pivotal clinical trial was also conducted in CKD patients on hemodialysis that achieved the study objective and established favorable tolerability of OLC at clinically effective doses.
Fosrenol® is a registered trademark of Shire International Licensing BV. 1Reason Research, LLC 2022 survey. Results here.
About Hyperphosphatemia
Hyperphosphatemia is a serious medical condition that occurs in nearly all patients with End Stage Renal Disease (ESRD). If left untreated, hyperphosphatemia leads to secondary hyperparathyroidism (SHPT), which then results in renal osteodystrophy (a condition similar to osteoporosis and associated with significant bone disease, fractures and bone pain); cardiovascular disease with associated hardening of arteries and atherosclerosis (due to deposition of excess calcium-phosphorus complexes in soft tissue). Importantly, hyperphosphatemia is independently associated with increased mortality for patients with chronic kidney disease on dialysis. Based on available clinical data to date, over 80% of patients show signs of cardiovascular calcification by the time they become dependent on dialysis.
Dialysis patients are already at an increased risk for cardiovascular disease (because of underlying diseases such as diabetes and hypertension), and hyperphosphatemia further exacerbates this. Treatment of hyperphosphatemia is aimed at lowering serum phosphate levels via two means: (1) restricting dietary phosphorus intake; and (2) using, on a daily basis, and with each meal, oral phosphate binding drugs that facilitate fecal elimination of dietary phosphate rather than its absorption from the gastrointestinal tract into the bloodstream.
About UNI-494
UNI-494 is a novel nicotinamide ester derivative and a selective ATP-sensitive mitochondrial potassium channel activator. Mitochondrial dysfunction plays a critical role in the progression of acute kidney injury and chronic kidney disease. UNI-494 has a novel mechanism of action that restores mitochondrial function and may be beneficial for the treatment of several diseases including kidney disease. Unicycive has completed enrollment in the UNI-494 Phase 1 dose-ranging safety study in healthy volunteers in the United Kingdom, and expects to report results in the third quarter of 2024. UNI-494 is protected by issued patent(s) in the U.S. and Europe and a wide range of patent applications worldwide. UNI-494 has been granted orphan drug designation (ODD) by the U.S. Food and Drug Administration (FDA) for the prevention of Delayed Graft Function (DGF) in kidney transplant patients.
About Acute Kidney Injury
Acute kidney injury (AKI) is defined as a sudden loss of kidney function that is determined based on increased serum creatinine levels and decreased urine output and is limited to a duration of 7 days. The primary causes of AKI include sepsis, ischemia, hypoxia, and drug-induced nephrotoxicity. Delayed Graft Function is a type of acute kidney injury that occurs in the first week after kidney transplantation. AKI is estimated to occur in 20-200 per million population in the community, 7-18% of patients in the hospital, and approximately 50% of patients admitted to the intensive care unit. Importantly, AKI is associated with morbidity and mortality; an estimated 2 million people die of AKI worldwide every year whereas survivors of AKI are at increased risk of chronic kidney disease and end stage renal disease.
About Delayed Graft Function
Delayed Graft Function (DGF) refers to the acute kidney injury (AKI) that occurs in the first week after kidney transplantation, which necessitates dialysis intervention. As the name indicates, DGF can result in sub-optimal or impaired graft function and is one of the most common and serious complications of kidney transplantation. Poor kidney function in the first week of graft life is detrimental to the longevity of the allograft. DGF is also associated with higher rates of tissue rejection and decreased patient survival. Currently, there are no FDA approved drugs for the treatment of DGF.
Ischemia/reperfusion injury (IRI) is known to be a major causative factor for the AKI that results in DGF during kidney transplantation. Ischemic preconditioning, that works by activating KATP channels in mitochondria, is a natural endogenous mechanism which protects cells from IRI in the heart, kidney, liver, and other organs. UNI-494 is a pharmacological approach that emulates and enhances this natural phenomenon of ischemic preconditioning.
About Unicycive Therapeutics
Unicycive Therapeutics is a biotechnology company developing novel treatments for kidney diseases. Unicycive’s lead drug candidate, oxylanthanum carbonate (OLC), is a novel investigational phosphate binding agent being developed for the treatment of hyperphosphatemia in chronic kidney disease patients on dialysis. UNI-494 is a patent-protected new chemical entity in clinical development for the treatment of conditions related to acute kidney injury. For more information, please visit Unicycive.com and follow us on LinkedIn, X, and YouTube.
Forward-looking statements
Certain statements in this press release are forward-looking within the meaning of the Private Securities Litigation Reform Act of 1995. These statements may be identified using words such as “anticipate,” “believe,” “forecast,” “estimated” and “intend” or other similar terms or expressions that concern Unicycive’s expectations, strategy, plans or intentions. These forward-looking statements are based on Unicycive’s current expectations and actual results could differ materially. There are several factors that could cause actual events to differ materially from those indicated by such forward-looking statements. These factors include, but are not limited to, clinical trials involve a lengthy and expensive process with an uncertain outcome, and results of earlier studies and trials may not be predictive of future trial results; our clinical trials may be suspended or discontinued due to unexpected side effects or other safety risks that could preclude approval of our product candidates; risks related to business interruptions, which could seriously harm our financial condition and increase our costs and expenses; dependence on key personnel; substantial competition; uncertainties of patent protection and litigation; dependence upon third parties; and risks related to failure to obtain FDA clearances or approvals and noncompliance with FDA regulations. Actual results may differ materially from those indicated by such forward-looking statements as a result of various important factors, including: the uncertainties related to market conditions and other factors described more fully in the section entitled ‘Risk Factors’ in Unicycive’s Annual Report on Form 10-K for the year ended December 31, 2023, and other periodic reports filed with the Securities and Exchange Commission. Any forward-looking statements contained in this press release speak only as of the date hereof, and Unicycive specifically disclaims any obligation to update any forward-looking statement, whether as a result of new information, future events or otherwise.
World Health Organization declared spread of mpox in multiple African countries a public health emergency of international concern (PHEIC) for the second time in two years
Worldwide availability and affordability of single-dose mpox vaccine with durable protection will be required to address global health emergency
The newest Clade 1 strain represents a new global threat with mortality up to 10%
Bilthoven Biologicals to develop manufacturing processes in preparation for potential GMP manufacturing
CHATHAM, N.J., Aug. 26, 2024 (GLOBE NEWSWIRE) — Tonix Pharmaceuticals Holding Corp. (Nasdaq: TNXP) (Tonix), a fully-integrated biopharmaceutical company with marketed products and a pipeline of development candidates, and Bilthoven Biologicals (BBio), part of the world’s largest vaccine manufacturer the Cyrus Poonawalla Group, which includes the Serum Institute of India, today announced a collaboration to advance TNX-801, Tonix’s mpox vaccine candidate. TNX-801 (recombinant horsepox virus) is a live replicating, attenuated virus vaccine based on horsepox in preclinical development to prevent mpox and smallpox.
TNX-801 is based on technology that has the potential to be used as a viral vector platform from which recombinant versions can be developed to protect against other infectious diseases. BBio is a global vaccine company, producing prophylactic vaccines as well as vaccines for therapeutic use. BBio has been selected by the European Union for its pandemic preparedness program of ‘ever warm’ vaccine manufacturing companies.
TNX-801 has demonstrated in animal models to provide immune protection with better tolerability than vaccines based on 20th century vaccinia viruses. Preclinical studies have shown positive efficacy data, demonstrating that TNX-801 protected non-human primates against lethal challenge with intratracheal Clade 1 monkeypox virus. After a single dose vaccination, TNX-801 prevented clinical disease and lesions and decreased shedding in the mouth and lungs of non-human primates. These findings are consistent with mucosal immunity and suggest the ability to block forward transmission.
On August 14, 2024, the World Health Organization (WHO) determined that the upsurge of mpox in a growing number of countries in Africa constitutes a public health emergency of international concern, the second such declaration in the past two years called in response to an mpox outbreak. The current outbreak was caused by Clade 1 monkeypox virus, while the 2022 outbreak was caused by Clade 2 monkeypox virus. The global mpox outbreak from Clade 2, which commenced in 2022, has affected over 90,000 persons in countries where mpox had previously not been endemic, including Europe and the U.S. The spread of Clade 2b mpox in 2022 underscores the pandemic potential of the disease. In several Central African countries, including the Democratic Republic of the Congo, mpox is currently endemic, with the Clade 1 showing a mortality rate of up to 10%.
“The recent mpox outbreak exemplifies precisely why we built the pandemic preparedness facility at BBio,” said Jurgen Kwik, Chief Executive Officer of Bilthoven Biologicals. “The establishment of the ‘ever-warm’ facility for pandemic preparedness underscores the critical importance of readiness in the face of global health emergencies, such as mpox. This collaboration encapsulates the essential role of the facility in bolstering pandemic preparedness and response capabilities.”
“We look forward to collaborating with BBio and to accelerating the development of our vaccine candidate to prevent mpox,” said Seth Lederman, M.D., Chief Executive Officer of Tonix Pharmaceuticals. “TNX-801 is administered with a single dose, which we believe will improve acceptance and eliminate partial vaccination compared to the current two-dose regimens. We believe TNX-801 can be rapidly scaled up for manufacturing and can be distributed and stored without a costly and cumbersome ultra-cold supply chain. TNX-801 has the potential to make a global impact on mpox and the risk of smallpox because of its durable T-cell immune response, the potential to manufacture at scale, and the use of a lower dose than non-replicating vaccines.”
Dr. Lederman added, “The worldwide availability of an affordable, safe and effective single dose mpox vaccine is essential given the pandemic potential of the disease. Successful development of TNX-801 will establish the foundation for potentially expanding the viral vector platform, for which recombinant versions can be developed to protect against other infectious diseases and future outbreaks. Our TNX-1800 vaccine (recombinant horsepox virus expressing SARS-CoV-2 spike) in development to protect against COVID-19 was selected by the U.S. National Institutes of Health for Project NextGen.”
About TNX-801 TNX-801 (recombinant horsepox virus) is a live virus vaccine based on horsepox in pre-clinical development to prevent mpox and smallpox. Tonix reported positive preclinical efficacy data, demonstrating that TNX-801 vaccination protected non-human primates against lethal challenge with monkeypox.1 Tonix has received official written response from a Type B pre-Investigational New Drug Application (IND) meeting with the U.S. Food and Drug Administration (FDA) to develop TNX-801 as a potential vaccine to protect against mpox disease and smallpox.2 Tonix believes the FDA feedback provides a path to agreement on the design of a Phase 1 /2 study and the overall clinical development plan. More than 90,000 people contracted mpox globally. during the 2022-23 epidemic.3 The June 2023 cluster of mpox in Chicago revealed breakthrough cases of the disease in individuals who had been vaccinated with the currently authorized non-replicating vaccine, which is administered in two doses.4 In contrast, TNX-801 is delivered percutaneously with only one dose and therefore may achieve higher rates of community protection by eliminating drop-out between doses and limiting forward transmission. Moreover, relying on only one approved mpox vaccine at present is a risk for the global supply chain that has already led to insufficient availability of vaccines to meet global health needs, especially in Africa. TNX-801 has the potential to make a global impact on mpox and the risk of smallpox because of its durable T-cell immune response, the potential to manufacture at scale, and the use of a lower dose than non-replicating vaccines.
BBio is a Netherlands-based end-to-end vaccine manufacturer of viral and bacterial vaccines. The company has a long-standing track record in supplying vaccines to European markets and global health partners such as UNICEF, PAHO and WHO/GAVI. With the manufacturing of polio vaccines, BBio is key contributor to the worldwide program to eradicate polio. BBio is also acting as contract manufacturer of vaccines used as cancer treatment, which is registered and supplied to the European market for the treatment of bladder cancer.
BBio is a carve-out of the former Netherlands Vaccine Institute and was acquired by Serum Institute of India in 2012 and employs a little over 500 people. BBio is covering the full vaccine manufacturing value chain with its facilities in Bilthoven on Utrecht Science Park Bilthoven.
Tonix is a fully-integrated biopharmaceutical company focused on developing, licensing and commercializing therapeutics to treat and prevent human disease and alleviate suffering. Tonix recently announced the U.S. Department of Defense (DoD), Defense Threat Reduction Agency (DTRA) awarded it a contract for up to $34 million over five years to develop TNX-4200 small molecule broad-spectrum antiviral agents targeting CD45 for the prevention or treatment of infections to improve the medical readiness of military personnel in biological threat environments. Tonix owns and operates a state-of-the art infectious disease research facility in Frederick, MD. The company’s Good Manufacturing Practice (GMP)-capable advanced manufacturing facility in Dartmouth, MA was purpose-built to manufacture TNX-801 and the GMP suites are ready to be reactivated in case of a national or international emergency. Tonix’s development portfolio is focused on central nervous system (CNS) disorders. Tonix’s priority is to submit a New Drug Application (NDA) to the FDA in the second half of 2024 for TNX-102 SL, a product candidate for which two statistically significant Phase 3 studies have been completed for the management of fibromyalgia. The FDA has granted Fast Track designation to TNX-102 SL for the management of fibromyalgia. TNX-102 SL is also being developed to treat acute stress reaction. Tonix’s CNS portfolio includes TNX-1300 (cocaine esterase), a biologic in Phase 2 development, designed to treat cocaine intoxication that has Breakthrough Therapy designation. Tonix’s immunology development portfolio consists of biologics to address organ transplant rejection, autoimmunity and cancer, including TNX-1500, which is a humanized monoclonal antibody targeting CD40-ligand (CD40L or CD154) being developed for the prevention of allograft rejection and for the treatment of autoimmune diseases. Tonix also has product candidates in development in the areas of rare disease and infectious disease, including a vaccine for mpox, TNX-801. Tonix Medicines, our commercial subsidiary, markets Zembrace® SymTouch® (sumatriptan injection) 3 mg and Tosymra® (sumatriptan nasal spray) 10 mg for the treatment of acute migraine with or without aura in adults.
*Tonix’s product development candidates are investigational new drugs or biologics and have not been approved for any indication.
Zembrace SymTouch and Tosymra are registered trademarks of Tonix Medicines. All other marks are property of their respective owners.
This press release and further information about Tonix can be found at www.tonixpharma.com.
Forward Looking Statements
Certain statements in this press release are forward-looking within the meaning of the Private Securities Litigation Reform Act of 1995. These statements may be identified by the use of forward-looking words such as “anticipate,” “believe,” “forecast,” “estimate,” “expect,” and “intend,” among others. These forward-looking statements are based on Tonix’s current expectations and actual results could differ materially. There are a number of factors that could cause actual events to differ materially from those indicated by such forward-looking statements. These factors include, but are not limited to, risks related to the failure to obtain FDA clearances or approvals and noncompliance with FDA regulations; risks related to the failure to successfully market any of our products; risks related to the timing and progress of clinical development of our product candidates; our need for additional financing; uncertainties of patent protection and litigation; uncertainties of government or third party payor reimbursement; limited research and development efforts and dependence upon third parties; and substantial competition. As with any pharmaceutical under development, there are significant risks in the development, regulatory approval and commercialization of new products. Tonix does not undertake an obligation to update or revise any forward-looking statement. Investors should read the risk factors set forth in the Annual Report on Form 10-K for the year ended December 31, 2023, as filed with the Securities and Exchange Commission (the “SEC”) on April 1, 2024, and periodic reports filed with the SEC on or after the date thereof. All of Tonix’s forward-looking statements are expressly qualified by all such risk factors and other cautionary statements. The information set forth herein speaks only as of the date thereof.
PRINCETON, N.J., Aug. 13, 2024 (GLOBE NEWSWIRE) — PDS Biotechnology Corporation (Nasdaq: PDSB) (“PDS Biotech” or the “Company”), a late-stage immunotherapy company focused on transforming how the immune system targets and kills cancers and the development of infectious disease vaccines, today provided a business update and reported financial results for the second quarter of 2024.
“We are exiting the second quarter with momentum. We have aligned with the FDA on the design of the Phase 3 registrational trial of Versamune® HPV + pembrolizumab compared to pembrolizumab as a potential treatment for first-line recurrent/metastatic HPV16-positive head and neck squamous cell carcinoma (“HNSCC”),” said Frank Bedu-Addo, PhD, President and Chief Executive Officer of PDS Biotech. “This clinical trial is supported by the maturing data from our VERSATILE-002 Phase 2 trial, including encouraging survival, disease control response rates and safety data. We look forward to the presentation of updated data from the VERSATILE-002 trial at the European Society for Medical Oncology (ESMO) 2024 Congress in September.”
Kirk Shepard, M.D., Chief Medical Officer stated, “As a result of the recent VERSATILE-002 trial results, we have revised the statistical endpoints of the VERSATILE-003 Phase 3 trial to provide additional robustness to our trial design. Our goal now is to work with our clinical research organization to initiate the trial of the combination, which we believe has potential as the first targeted immunotherapy for HPV16-positive HNSCC. We anticipate that future studies of PDS01ADC have the potential to provide additional clinical benefit to an effective targeted immunotherapy.”
Recent Developments
Announced alignment with FDA to initiate Phase 3 VERSATILE-003 trial in HPV16-positive first-line recurrent or metastatic HNSCC.
This trial will be designed to investigate the combination of Versamune® HPV + pembrolizumab compared to pembrolizumab, and this design reflects updated statistical endpoints based on recent and more mature survival data from the VERSATILE-002 trial.
PDS Biotech has initiated preparatory activities in connection with the planned start of the Phase 3 VERSATILE-003 trial in Q4 2024.
Abstract by Jared Weiss, M.D., UNC Lineberger Cancer Center (Lead Investigator), presenting updated data from the VERSATILE-002 trial evaluating first-line treatment with Versamune® HPV in combination with KEYTRUDA® (pembrolizumab) in patients with HPV16-positive recurrent/metastatic HNSCC accepted for presentation at the ESMO Congress 2024.
Provided a survival data update from the ongoing VERSATILE-002 trial in HPV16-positive HNSCC based on data cut from May 17, 2024.
Median overall survival is 30 months, consistent with data cut as of November 30, 2023.
Abstract by Adam Grippin, M.D., Ph.D., of the University of Texas MD Anderson Cancer Center presenting updated results from the IMMUNOCERV trial evaluating treatment of high-risk locally advanced cervical cancer with Versamune® HPV in combination with chemoradiotherapy accepted for oral presentation at the American Society for Radiation Oncology (ASTRO) Annual Meeting 2024.
Abstract by Renee Donahue, Ph.D., of the National Cancer Institute presenting preliminary biomarker results from a Phase 2 trial evaluating treatment of biochemically recurrent prostate cancer with PDS01ADC in combination with enzalutamide accepted for oral presentation at the 12th Annual Meeting of the International Cytokine and Interferon Society 2024.
Second Quarter 2024 Financial Results Reported net loss was approximately $8.3 million, or $0.23 per basic share and diluted share, for the three months ended June 30, 2024, compared to a net loss of $11.5 million, or $0.37 per basic share and diluted share, for the three months ended June 30, 2023. The decrease was due to lower operating expenses.
Research and development expenses decreased to approximately $4.5 million for the three months ended June 30, 2024, from $8.0 million for the three months ended June 30, 2023. The decrease of $3.5 million was primarily attributable to lower clinical trial and manufacturing costs.
General and administrative expenses decreased to approximately $4.2 million for the three months ended June 30, 2024, from approximately $4.7 million for the three months ended June 30, 2023. The decrease of $0.5 million was primarily attributable to lower personnel costs and professional fees.
Total operating expenses decreased to approximately $8.7 million for the three months ended June 30, 2024, from $12.7 million for the three months ended June 30, 2023.
Net interest expenses increased to approximately $0.5 million for the three months ended June 30, 2024, from $0.2 million for the three months ended June 30, 2023.
Cash and cash equivalents as of June 30, 2024, totaled approximately $57.7 million.
About PDS Biotechnology PDS Biotechnology is a late-stage immunotherapy company focused on transforming how the immune system targets and kills cancers and the development of infectious disease vaccines. The Company plans to initiate a pivotal clinical trial in 2024 to advance its lead program in advanced HPV16-positive head and neck squamous cell cancers. PDS Biotech’s lead investigational targeted immunotherapy Versamune® HPV is being developed in combination with a standard-of-care immune checkpoint inhibitor, and also in a triple combination including PDS01ADC, an IL-12 fused antibody drug conjugate (ADC), and a standard-of-care immune checkpoint inhibitor.
Forward Looking Statements This communication contains forward-looking statements (including within the meaning of Section 21E of the United States Securities Exchange Act of 1934, as amended, and Section 27A of the United States Securities Act of 1933, as amended) concerning PDS Biotechnology Corporation (the “Company”) and other matters. These statements may discuss goals, intentions and expectations as to future plans, trends, events, results of operations or financial condition, or otherwise, based on current beliefs of the Company’s management, as well as assumptions made by, and information currently available to, management. Forward-looking statements generally include statements that are predictive in nature and depend upon or refer to future events or conditions, and include words such as “may,” “will,” “should,” “would,” “expect,” “anticipate,” “plan,” “likely,” “believe,” “estimate,” “project,” “intend,” “forecast,” “guidance”, “outlook” and other similar expressions among others. Forward-looking statements are based on current beliefs and assumptions that are subject to risks and uncertainties and are not guarantees of future performance. Actual results could differ materially from those contained in any forward-looking statement as a result of various factors, including, without limitation: the Company’s ability to protect its intellectual property rights; the Company’s anticipated capital requirements, including the Company’s anticipated cash runway and the Company’s current expectations regarding its plans for future equity financings; the Company’s dependence on additional financing to fund its operations and complete the development and commercialization of its product candidates, and the risks that raising such additional capital may restrict the Company’s operations or require the Company to relinquish rights to the Company’s technologies or product candidates; the Company’s limited operating history in the Company’s current line of business, which makes it difficult to evaluate the Company’s prospects, the Company’s business plan or the likelihood of the Company’s successful implementation of such business plan; the timing for the Company or its partners to initiate the planned clinical trials for PDS01ADC, PDS0101, PDS0203 and other Versamune® and Infectimune® based product candidates; the future success of such trials; the successful implementation of the Company’s research and development programs and collaborations, including any collaboration studies concerning PDS01ADC, PDS0101, PDS0203 and other Versamune® and Infectimune® based product candidates and the Company’s interpretation of the results and findings of such programs and collaborations and whether such results are sufficient to support the future success of the Company’s product candidates; the success, timing and cost of the Company’s ongoing clinical trials and anticipated clinical trials for the Company’s current product candidates, including statements regarding the timing of initiation, pace of enrollment and completion of the trials (including the Company’s ability to fully fund its disclosed clinical trials, which assumes no material changes to the Company’s currently projected expenses), futility analyses, presentations at conferences and data reported in an abstract, and receipt of interim or preliminary results (including, without limitation, any preclinical results or data), which are not necessarily indicative of the final results of the Company’s ongoing clinical trials; any Company statements about its understanding of product candidates mechanisms of action and interpretation of preclinical and early clinical results from its clinical development programs and any collaboration studies; the Company’s ability to continue as a going concern; and other factors, including legislative, regulatory, political and economic developments not within the Company’s control. The foregoing review of important factors that could cause actual events to differ from expectations should not be construed as exhaustive and should be read in conjunction with statements that are included herein and elsewhere, including the other risks, uncertainties, and other factors described under “Risk Factors,” “Management’s Discussion and Analysis of Financial Condition and Results of Operations” and elsewhere in the documents we file with the U.S. Securities and Exchange Commission. The forward-looking statements are made only as of the date of this press release and, except as required by applicable law, the Company undertakes no obligation to revise or update any forward-looking statement, or to make any other forward-looking statements, whether as a result of new information, future events or otherwise.
Versamune® and Infectimune® are registered trademarks of PDS Biotechnology Corporation.
Keytruda® is a registered trademark of Merck Sharp and Dohme LLC, a subsidiary of Merck & Co., Inc., Rahway, N.J., USA.
Revenue of $163.1 Million With a Significant Expansion in Net Income to $4.4 Million Compared to Q1 2024
Exceeded Goal of Having Over 8,000 Active Bitcoin ATMs Five Months Ahead of Schedule
ATLANTA, Aug. 13, 2024 (GLOBE NEWSWIRE) — Bitcoin Depot Inc. (“Bitcoin Depot” or the “Company”), a U.S.-based Bitcoin ATM operator and leading fintech company, today reported financial results for the second quarter ended June 30, 2024. Bitcoin Depot will host a conference call and webcast at 10:00 a.m. ET today. An earnings presentation and link to the webcast will be made available at ir.bitcoindepot.com.
“We continued to build on our momentum in the second quarter, achieving notable sequential growth in revenue, net income, and Adjusted EBITDA,” said Brandon Mintz, CEO and Founder of Bitcoin Depot. “Our success of having over 8,000 active Bitcoin ATMs five months ahead of schedule underscores our robust execution and positions us well for sustained growth. This achievement not only enhances our market presence but also drives our cash flow dynamics, as evidenced by the $10.1 million in operational cash flow generated during the second quarter. With this strong foundation, we are well-positioned to expand our world-leading kiosk footprint and maximize profits for our shareholders.”
Second Quarter 2024 Financial Results
Revenue in the second quarter of 2024 was $163.1 million, down 17% from $197.5 million in the second quarter of 2023. Revenue in the second quarter of 2024 was up $24.5 million or 18% from the first quarter of 2024.
Total operating expenses were $18.8 million for the second quarter of 2024, compared to $19.7 million for the second quarter of 2023.
Net income for the second quarter of 2024 was $4.4 million, compared to a net loss of $4.0 million for the second quarter of 2023. Net income in the second quarter of 2024 was up $8.6 million or 203% from a net loss of $4.2 million in the first quarter of 2024.
Adjusted gross profit in the second quarter of 2024 was $26.4 million, down 13% from $30.2 million for the second quarter of 2023. Adjusted gross profit margin (non-GAAP) in the second quarter of 2024 increased approximately 90 basis points to 16.2% compared to 15.3% in the second quarter of 2023. Please see “Explanation and Reconciliation of Non-GAAP Financial Measures” below.
Adjusted EBITDA, a non-GAAP measure, in the second quarter of 2024 decreased 36% to $12.7 million, compared to Adjusted EBITDA of $19.8 million for the second quarter of 2023. Adjusted EBITDA in the second quarter of 2024 was up $7.8 million or 159% from the first quarter of 2024. Please see “Explanation and Reconciliation of Non-GAAP Financial Measures” below.
Cash and cash equivalents were $43.9 million as of the end of the second quarter of 2024. The Company generated $10.1 million in cash flows from operations in the second quarter and $11.5 million for the first six months of 2024.
Recent Business Highlights
Achieved and exceeded its goal of having over 8,000 active Bitcoin ATMs five months ahead of schedule, with 8,180 kiosks. This milestone reinforces Bitcoin Depot’s abiding market dominance and showcases its rapid growth trajectory.
Partnered with New England-Based convenience retailer Nouria Energy, a leading convenience store brand based in the northeastern U.S. with robust operations across 175 company owned c-stores and fuel retailers.
Announced Bitcoin treasury strategy, demonstrating the Company’s confidence in the future of Bitcoin by strategically allocating a portion of cash reserves to Bitcoin.
Announced sale of 200 additional BTM kiosks to Sopris Capital, a 20-year-old multi-strategy investment firm as part of the Company’s profit-sharing program.
Conference Call
Bitcoin Depot will hold a conference call at 10:00 a.m., Eastern time (7:00 a.m. Pacific time), today to discuss its financial results for the second quarter ended June 30, 2024.
Call Date: Tuesday, August 13, 2024 Time: 10:00 a.m. Eastern time (7:00 a.m. Pacific time) U.S. dial-in: 646-968-2525 International dial-in: 888-596-4144 Conference ID: 4727212
The conference call will broadcast live and be available for replay here following the call.
Please call the conference telephone number approximately 10 minutes before the start time. An operator will register your name and organization. If you have any difficulty connecting with the conference call, please contact Bitcoin Depot’s investor relations team at 1-949-574-3860.
A replay of the call will be available beginning after 2:00 p.m. Eastern time on August 13, 2024, through August 20, 2024.
U.S. replay number: 609-800-9909 International replay number: 800-770-2030 Conference ID: 4727212
About Bitcoin Depot
Bitcoin Depot Inc. (Nasdaq: BTM) was founded in 2016 with the mission to connect those who prefer to use cash to the broader, digital financial system. Bitcoin Depot provides its users with simple, efficient and intuitive means of converting cash into Bitcoin, which users can deploy in the payments, spending and investing space. Users can convert cash to bitcoin at Bitcoin Depot kiosks in 48 states and at thousands of name-brand retail locations in 29 states through its BDCheckout product. The Company has the largest market share in North America with approximately 8,000 kiosk locations as of July 1, 2024. Learn more at www.bitcoindepot.com.
This press release and any oral statements made in connection herewith include “forward-looking statements” within the meaning of Section 27A of the Securities Act of 1933, as amended, and Section 21E of the Exchange Act of 1934, as amended. Forward-looking statements are any statements other than statements of historical fact, and include, but are not limited to, statements regarding the expectations of plans, business strategies, objectives and growth and anticipated financial and operational performance, including our growth strategy and ability to increase deployment of our products and services, our ability to strengthen our financial profile, and worldwide growth in the adoption and use of cryptocurrencies,. These forward-looking statements are based on management’s current beliefs, based on currently available information, as to the outcome and timing of future events. Forward-looking statements are often identified by words such as “anticipate,” “appears,” “approximately,” “believe,” “continue,” “could,” “designed,” “effect,” “estimate,” “evaluate,” “expect,” “forecast,” “goal,” “initiative,” “intend,” “may,” “objective,” “outlook,“ ”plan,“ ”potential,“ ”priorities,“ ”project,“ ”pursue,“ ”seek,“ ”should,“ ”target,“ ”when,“ ”will,“ ”would,” or the negative of any of those words or similar expressions that predict or indicate future events or trends or that are not statements of historical matters, although not all forward-looking statements contain such identifying words. In making these statements, we rely upon assumptions and analysis based on our experience and perception of historical trends, current conditions, and expected future developments, as well as other factors we consider appropriate under the circumstances. We believe these judgments are reasonable, but these statements are not guarantees of any future events or financial results. These forward-looking statements are provided for illustrative purposes only and are not intended to serve as, and must not be relied on by any investor as, a guarantee, an assurance, a prediction or a definitive statement of fact or probability. Actual events and circumstances are difficult or impossible to predict and will differ from assumptions. Many actual events and circumstances are beyond our control.
These forward-looking statements are subject to a number of risks and uncertainties, including changes in domestic and foreign business, market, financial, political and legal conditions; failure to realize the anticipated benefits of the business combination; risks relating to the uncertainty of our projected financial information; future global, regional or local economic and market conditions; the development, effects and enforcement of laws and regulations; our ability to manage future growth; our ability to develop new products and services, bring them to market in a timely manner and make enhancements to our platform; the effects of competition on our future business; our ability to issue equity or equity-linked securities; the outcome of any potential litigation, government and regulatory proceedings, investigations and inquiries; and those factors described or referenced in filings with the Securities and Exchange Commission. If any of these risks materialize or our assumptions prove incorrect, actual results could differ materially from the results implied by these forward-looking statements. There may be additional risks that we do not presently know or that we currently believe are immaterial that could also cause actual results to differ from those contained in the forward-looking statements. In addition, forward-looking statements reflect our expectations, plans or forecasts of future events and views as of the date of this press release. We anticipate that subsequent events and developments will cause our assessments to change.
We caution readers not to place undue reliance on forward-looking statements. Forward-looking statements speak only as of the date they are made, and we undertake no obligation to update publicly or otherwise revise any forward-looking statements, whether as a result of new information, future events, or other factors that affect the subject of these statements, except where we are expressly required to do so by law. All written and oral forward-looking statements attributable to us are expressly qualified in their entirety by this cautionary statement.