TROY, Mich., Feb. 05, 2026 (GLOBE NEWSWIRE) — Kelly, a leading global specialty talent solutions provider, will release its fourth-quarter and full-year earnings before the market opens on Thursday, February 12, 2026. In conjunction with its earnings release, Kelly will publish a financial presentation and host a live webcast of a conference call with financial analysts at 9 a.m. ET on February 12 to review the results from the quarter and answer questions.
The presentation and a link to the live webcast will be accessible through the Company’s public website on the Investor Relations page under Events & Presentations. The webcast will be recorded, and a replay will be available within one hour of completion of the event through the same link as the live webcast.
About Kelly
Kelly Services, Inc. (Nasdaq: KELYA, KELYB) helps companies recruit and manage skilled workers and helps job seekers find great work. Since inventing the staffing industry in 1946, we have become experts in the many industries and local and global markets we serve. With a network of suppliers and partners around the world, we connect more than 400,000 people with work every year. Our suite of outsourcing and consulting services and solutions ensures companies have the people they need, when and where they are needed most. Headquartered in Troy, Michigan, we empower businesses and individuals to access limitless opportunities in industries such as science, engineering, technology, education, manufacturing, retail, finance, and energy. Revenue in 2024 was $4.3 billion. Learn more at kellyservices.com.
Ultimate Objective is High Quantity Fleet of Mighty Hornet IV Systems Ready in Taiwan – Affordable Mass
SAN DIEGO, Feb. 05, 2026 (GLOBE NEWSWIRE) — Kratos Defense & Security Solutions, Inc. (NASDAQ: KTOS), a leader in defense, national security and global markets, and the National Chung-Shan Institute of Science and Technology (NCSIST) today announced the successful test of the integrated Mighty Hornet IV Attack UAV, a revolutionary transformation of the MQM-178 Firejet target drone.
Following the months of planning, design, and subsystem tests in their respective facilities, the team successfully tested and validated the NCSIST-provided payload/mission system to confirm its operational capability with the Mighty Hornet IV aircraft without revisions to the design. This milestone established the baseline for flight testing later this year, for which the NCSIST technical team traveled to Kratos’ Oklahoma City design and production facility to finalize the requirement set and design this week.
Steve Fendley, President of Kratos Unmanned Systems Division, said, “The success of this testing by the two organizations represents a significant milestone which enables progression to flight testing. It validates the technical approach, and possibly even more significantly, validates the value of collaborative effort of the technical organizations working together to realize the new system. This is a springboard for not only the Mighty Hornet IV effort, but also potential additional collaborative efforts with other Kratos aircraft and NCSIST systems and technologies.”
Kratos and NCSIST Team with the new Mighty Hornet IV in the foreground, and Valkyrie behind
Kratos and NCSIST Team with the new Mighty Hornet IV in the foreground, and Valkyrie behind
The modified MQM-178’s high-speed capabilities, including a speed of Mach 0.8, high G maneuvering, and a service ceiling of greater than 35,000 feet, make it an ideal base platform for this transformation. The Mighty Hornet IV not only embodies cutting-edge technology but also benefits from proven performance in collaborative exercises. Recent demonstrations showcased the MQM-178’s reliability and adaptability, reinforcing its role in Manned-Unmanned Teaming (MUM-T) and loitering munition scenarios and validating its impressive flight characteristics.
Ultimately, the objective is to have a large quantity of Mighty Hornet IV systems in Taiwan, delivering affordable mass, both as a deterrent, and ready for operational deployment. The collaboration and combination of the U.S. baseline uncrewed aircraft system, the Kratos Firejet, with the Taiwan NCSIST payload marks the collaboration between the two nations and organizations. By taking advantage of mature Kratos technologies, the timeline from concept to functional system has been unconventionally short; establishing this strategy as a key enabler for realization of practical near term tactical UAS and affordable mass.
About Kratos Defense & Security Solutions Kratos Defense & Security Solutions, Inc. (NASDAQ: KTOS) is a technology, products, system and software company addressing the defense, national security, and commercial markets. Kratos makes true internally funded research, development, capital and other investments, to rapidly develop, produce and field solutions that address our customers’ mission critical needs and requirements. At Kratos, affordability is a technology, and we seek to utilize proven, leading edge approaches and technology, not unproven bleeding edge approaches or technology, with Kratos’ approach designed to reduce cost, schedule and risk, enabling us to be first to market with cost effective solutions. We believe that Kratos is known as an innovative disruptive change agent in the industry, a company that is an expert in designing products and systems up front for successful rapid, large quantity, low-cost future manufacturing which is a value add competitive differentiator for our large traditional prime system integrator partners and also to our government and commercial customers. Kratos intends to pursue program and contract opportunities as the prime or lead contractor when we believe that our probability of win (PWin) is high and any investment required by Kratos is within our capital resource comfort level. We intend to partner and team with a large, traditional system integrator when our assessment of PWin is greater or required investment is beyond Kratos’ comfort level. Kratos’ primary business areas include virtualized ground systems for satellites and space vehicles including software for command & control (C2) and telemetry, tracking and control (TT&C), jet powered unmanned aerial drone systems, advanced vehicles and rocket systems, propulsion systems for drones, missiles, loitering munitions, supersonic systems, space craft and launch systems, C5ISR and microwave electronic products for missile, radar, missile defense, space, satellite, counter UAS, directed energy, communication and other systems, and virtual & augmented reality training systems for the warfighter. For more information, visit www.KratosDefense.com.
Notice Regarding Forward-Looking Statements Certain statements in this press release may constitute “forward-looking statements” within the meaning of the Private Securities Litigation Reform Act of 1995. These forward-looking statements are made on the basis of the current beliefs, expectations and assumptions of the management of Kratos and are subject to significant risks and uncertainty. Investors are cautioned not to place undue reliance on any such forward-looking statements. All such forward-looking statements speak only as of the date they are made, and Kratos undertakes no obligation to update or revise these statements, whether as a result of new information, future events or otherwise. Although Kratos believes that the expectations reflected in these forward-looking statements are reasonable, these statements involve many risks and uncertainties that may cause actual results to differ materially from what may be expressed or implied in these forward-looking statements. For a further discussion of risks and uncertainties that could cause actual results to differ from those expressed in these forward-looking statements, as well as risks relating to the business of Kratos in general, see the risk disclosures in the Annual Report on Form 10-K of Kratos for the year ended December 29, 2024, and in subsequent reports on Forms 10-Q and 8-K and other filings made with the SEC by Kratos.
Second Quarter of Fiscal Year 2026 – Consolidated Earnings Highlights
Revenue of $537.1 million
Net income of $69.3 million
Adjusted EBITDA* of $84.7 million
Fiscal Year 2026 Guidance Ranges:
Revenue expected in a range of $1.61 billion to $1.71 billion
Adjusted EBITDA* expected in a range of $90 million to $100 million
Second Quarter Fiscal Year 2026 – Segment Highlights
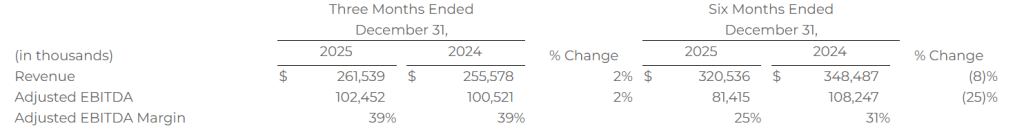
Senior
Revenue of $261.5 million
Adjusted EBITDA of $102.5 million
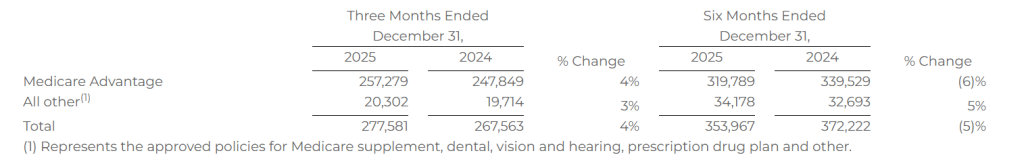
Approved Medicare Advantage policies of 257,279
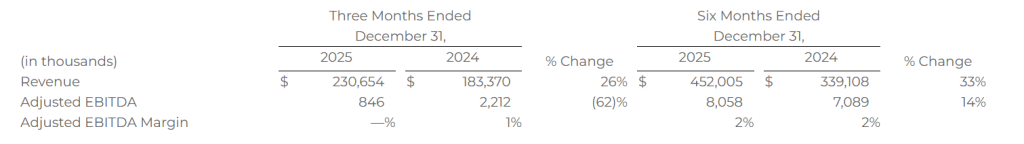
Healthcare Services
Revenue of $230.7 million
Adjusted EBITDA of $0.8 million
113,483 SelectRx members
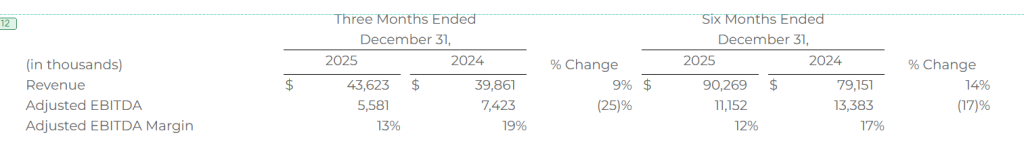
Life
Revenue of $43.6 million
Adjusted EBITDA of $5.6 million
OVERLAND PARK, Kan.–(BUSINESS WIRE)– SelectQuote, Inc. (NYSE: SLQT) reported consolidated revenue for the second quarter of fiscal year 2026 of $537.1 million compared to consolidated revenue for the second quarter of fiscal year 2025 of $481.1 million. Consolidated net income for the second quarter of fiscal year 2026 was $69.3 million compared to consolidated net income for the second quarter of fiscal year 2025 of $53.2 million. Finally, consolidated Adjusted EBITDA* for the second quarter of fiscal year 2026 was $84.7 million compared to consolidated Adjusted EBITDA* for the second quarter of fiscal year 2025 of $87.5 million.
Tim Danker, SelectQuote Chief Executive Officer, “This year’s AEP again highlighted the strength and consistency of SelectQuote’s operating model. Despite continued volatility in Medicare Advantage benefit structures, our team delivered another season of high‑quality execution, with strong agent productivity and marketing efficiency driving 39% Adjusted EBITDA* margins for our Senior business. At the same time, our rapidly growing Healthcare Services segment, led by SelectRx, continues to provide meaningful clinical value for members and attractive long‑term economics for our platform. The combination of improved medication adherence, lower waste, and better patient outcomes reinforces SelectRx as an increasingly important driver of value creation for the company and broader pharmacy ecosystem.
Our revised fiscal 2026 guidance reflects two discrete, partner‑driven headwinds: a national carrier’s decision to constrain additional MA policy volume by curtailing strategic marketing spend across all channels, and the previously communicated PBM reimbursement changes. Neither impact related to our internal performance, which remained strong. While these developments are frustrating, they do not alter our conviction in the long‑term earnings power of SelectQuote’s comprehensive healthcare platform.
What continues to give us confidence is the consistency of our underlying operational execution. Regardless of the market backdrop, our teams have demonstrated the ability to drive efficiency, deliver value for partners and beneficiaries, and maintain strong margin discipline. Coupled with our improved balance sheet flexibility, we believe this operational consistency positions SelectQuote to deliver meaningful cash‑flow generation for shareholders in the quarters and years ahead.”
* See “Non-GAAP Financial Measures” below.
Segment Results
We currently have three reportable segments: 1) Senior, 2) Healthcare Services and 3) Life. The performance measures of the segments include total revenue and adjusted EBITDA. Costs of commissions and other services revenue, cost of goods sold-pharmacy revenue, marketing and advertising, selling, general, and administrative, and technical development operating expenses that are directly attributable to a segment are reported within the applicable segment. Indirect costs of revenue, marketing and advertising, selling, general, and administrative, and technical development operating expenses are allocated to each segment based on varying metrics such as headcount.
Senior
Financial Results
The following table provides the financial results for the Senior segment for the periods presented:
Operating Metrics
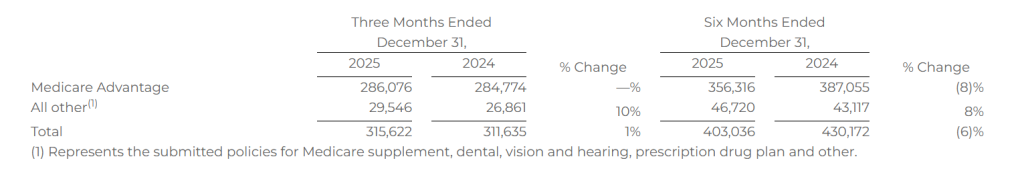
Submitted Policies
Submitted policies are counted when an individual completes an application with our licensed agent and provides authorization to the agent to submit the application to the insurance carrier partner. The applicant may have additional actions to take before the application will be reviewed by the insurance carrier.
The following table shows the number of submitted policies for the periods presented:
Approved Policies
Approved policies represents the number of submitted policies that were approved by our insurance carrier partners for the identified product during the indicated period. Not all approved policies will go in force.
The following table shows the number of approved policies for the periods presented:
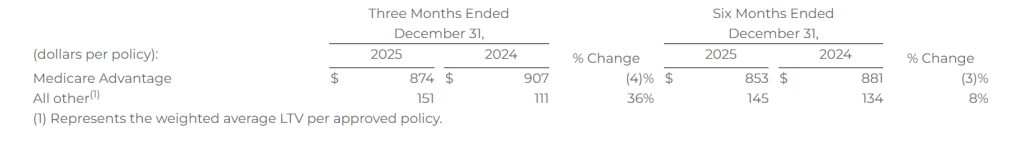
Lifetime Value of Commissions per Approved Policy
Lifetime value of commissions per approved policy represents commissions estimated to be collected over the estimated life of an approved policy based on multiple factors, including but not limited to, contracted commission rates, carrier mix and expected policy persistency with applied constraints. The lifetime value of commissions per approved policy is equal to the sum of the commission revenue due upon the initial sale of a policy, and when applicable, an estimate of future renewal commissions.
The following table shows the lifetime value of commissions per approved policy for the periods presented:
Healthcare Services
Financial Results
The following table provides the financial results for the Healthcare Services segment for the periods presented:
Operating Metrics
Members
The total number of SelectRx members represents the amount of active customers to which an order has been shipped and the prescriptions per day represents the total average prescriptions shipped per business day. These two metrics are the primary drivers of revenue for Healthcare Services.
The following table shows the total number of SelectRx members as of the periods presented:
The total number of SelectRx members increased by 17% as of December 31, 2025, compared to December 31, 2024, due to our strategy to grow SelectRx membership.
The following table shows the average prescriptions shipped per day for the periods presented:
Combined Senior and Healthcare Services – Consumer Per Unit Economics
Combined Senior and Healthcare Services consumer per unit economics represents total MA and MS commissions; other product commissions; other revenues, including revenues from Healthcare Services; and operating expenses associated with Senior and Healthcare Services, each shown per number of approved MA and MS policies over a given time period. Management assesses the business on a per-unit basis to help ensure that the revenue opportunity associated with a successful policy sale is attractive relative to the marketing acquisition cost. Because not all acquired leads result in a successful policy sale, all per-policy metrics are based on approved policies, which is the measure that triggers revenue recognition.
The MA and MS commission per MA/MS policy represents the LTV for policies sold in the period. Other commission per MA/MS policy represents the LTV for other products sold in the period, including DVH prescription drug plan, and other products, which management views as additional commission revenue on our agents’ core function of MA/MS policy sales. Pharmacy revenue per MA/MS policy represents revenue from SelectRx, and other revenue per MA/MS policy represents revenue from Population Health, production bonuses, marketing development funds, lead generation revenue, and adjustments from the Company’s reassessment of its cohorts’ transaction prices. Total operating expenses per MA/MS policy represents all of the operating expenses within Senior and Healthcare Services. The revenue to customer acquisition cost (“CAC”) multiple represents total revenue as a multiple of total marketing acquisition cost, which represents the direct costs of acquiring leads. These costs are included in marketing and advertising expense within the total operating expenses per MA/MS policy.
The following table shows combined Senior and Healthcare Services consumer per unit economics for the periods presented. Based on the seasonality of Senior and the fluctuations between quarters, we believe that the most relevant view of per unit economics is on a rolling 12-month basis. All per MA/MS policy metrics below are based on the sum of approved MA/MS policies, as both products have similar commission profiles.
Total revenue per MA/MS policy increased 23% for the twelve months ended December 31, 2025, compared to the twelve months ended December 31, 2024, primarily due to the increase in pharmacy revenue. Total operating expenses per MA/MS policy increased 31% for the twelve months ended December 31, 2025, compared to the twelve months ended December 31, 2024, driven by an increase in cost of goods sold-pharmacy revenue for Healthcare Services due to the growth of the business.
Life
Financial Results
The following table provides the financial results for the Life segment for the periods presented:
Operating Metrics
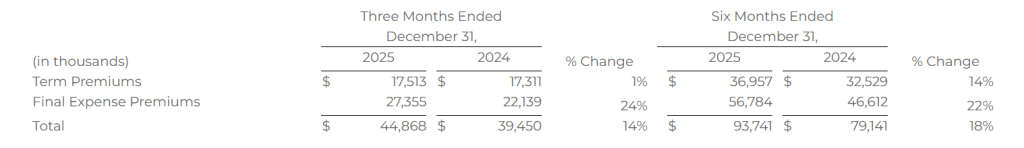
Life premium represents the total premium value for all policies that were approved by the relevant insurance carrier partner and for which the policy document was sent to the policyholder and payment information was received by the relevant insurance carrier partner during the indicated period. Because our commissions are earned based on a percentage of total premium, total premium volume for a given period is the key driver of revenue for our Life segment.
The following table shows term and final expense premiums for the periods presented:
Earnings Conference Call
SelectQuote, Inc. will host a conference call with the investment community on February 5, 2025 beginning at 8:00 a.m. ET. To register for this conference call, please use this link: https://events.q4inc.com/analyst/199368355?pwd=c0a3KINj. After registering, a confirmation will be sent via email, including dial-in details and unique conference call codes for entry. Registration is open through the live call, but to ensure you are connected for the full call we suggest registering at least 10 minutes before the start of the call. The event will also be webcasted live via our investor relations website https://ir.selectquote.com/investor-home/default.aspx.
Non-GAAP Financial Measures
This release includes certain non-GAAP financial measures intended to supplement, not substitute for, comparable GAAP measures. To supplement our financial statements presented in accordance with GAAP and to provide investors with additional information regarding our GAAP financial results, we have presented in this release Adjusted EBITDA, which, when presented on a consolidated basis, is a non-GAAP financial measure. This non-GAAP financial measure is not based on any standardized methodology prescribed by GAAP and is not necessarily comparable to any similarly titled measure presented by other companies. We define Adjusted EBITDA as net income (loss) plus interest expense, income taxes, depreciation and amortization, changes in fair value of warrant liabilities, and certain add-backs for non-cash or non-recurring expenses, including restructuring and share-based compensation expenses. The most directly comparable GAAP measure is net income (loss). We monitor and have presented in this release Adjusted EBITDA because it is a key measure used by our management and Board of Directors to understand and evaluate our operating performance, establish budgets, and develop operational goals for managing our business. In particular, we believe that excluding the impact of these expenses in calculating Adjusted EBITDA can provide a useful measure for period-to-period comparisons of our core operating performance.
A reconciliation of the differences between Adjusted EBITDA and its most directly comparable GAAP measure, net income (loss), is presented below on page 15. The Company is unable to provide a quantitative reconciliation of forward-looking Adjusted EBITDA to its most directly comparable GAAP measure without unreasonable effort because it is not possible to predict certain information included in the calculation of such GAAP measure, including the fair value of outstanding warrants to purchase shares of the Company’s common stock. The unavailable information could have a significant impact on the Company’s GAAP financial results.
Forward Looking Statements
This release contains forward-looking statements. These forward-looking statements reflect our current views with respect to, among other things, future events and our financial performance. These statements are often, but not always, made through the use of words or phrases such as “may,” “should,” “could,” “predict,” “potential,” “believe,” “will likely result,” “expect,” “continue,” “will,” “anticipate,” “seek,” “estimate,” “intend,” “plan,” “projection,” “would” and “outlook,” or the negative version of those words or other comparable words or phrases of a future or forward-looking nature. These forward-looking statements are not historical facts, and are based on current expectations, estimates and projections about our industry, management’s beliefs and certain assumptions made by management, many of which, by their nature, are inherently uncertain and beyond our control. Accordingly, we caution you that any such forward-looking statements are not guarantees of future performance and are subject to risks, assumptions and uncertainties that are difficult to predict. Although we believe that the expectations reflected in these forward-looking statements are reasonable as of the date made, actual results may prove to be materially different from the results expressed or implied by the forward-looking statements. There are or will be important factors that could cause our actual results to differ materially from those indicated in these forward-looking statements, including, but not limited to, the following: our reliance on a limited number of insurance carrier partners and any potential termination of those relationships or failure to develop new relationships; existing and future laws and regulations affecting the health insurance market; changes in health insurance products offered by our insurance carrier partners and the health insurance market generally; insurance carriers offering products and services directly to consumers; changes to commissions paid by insurance carriers and underwriting practices; competition with brokers, exclusively online brokers and carriers who opt to sell policies directly to consumers; competition from government-run health insurance exchanges; developments in the U.S. health insurance system; our dependence on revenue from carriers in our senior segment and downturns in the senior health as well as life, automotive and home insurance industries; our ability to develop new offerings and penetrate new vertical markets; risks from third-party products; failure to enroll individuals during the Medicare annual enrollment period; our ability to attract, integrate and retain qualified personnel; our dependence on lead providers and ability to compete for leads; failure to obtain and/or convert sales leads to actual sales of insurance policies; access to data from consumers and insurance carriers; accuracy of information provided from and to consumers during the insurance shopping process; cost-effective advertisement through internet search engines; ability to contact consumers and market products by telephone; global economic conditions, including inflation; disruption to operations as a result of future acquisitions; significant estimates and assumptions in the preparation of our financial statements; impairment of goodwill; potential litigation and other legal proceedings or inquiries; our existing and future indebtedness; our ability to maintain compliance with our debt covenants; access to additional capital; failure to protect our intellectual property and our brand; fluctuations in our financial results caused by seasonality; accuracy and timeliness of commissions reports from insurance carriers; timing of insurance carriers’ approval and payment practices; factors that impact our estimate of the constrained lifetime value of commissions per policyholder; changes in accounting rules, tax legislation and other legislation; disruptions or failures of our technological infrastructure and platform; failure to maintain relationships with third-party service providers; cybersecurity breaches or other attacks involving our systems or those of our insurance carrier partners or third-party service providers; our ability to protect consumer information and other data; failure to market and sell Medicare plans effectively or in compliance with laws; and other factors related to our pharmacy business, including manufacturing or supply chain disruptions, access to and demand for prescription drugs, changes in reimbursement rates under our contracts with pharmacy benefit managers, and regulatory changes or other industry developments that may affect our pharmacy operations. For a further discussion of these and other risk factors that could impact our future results and performance, see the section entitled “Risk Factors” in the most recent Annual Report on Form 10-K (the “Annual Report”) and subsequent periodic reports filed by us with the Securities and Exchange Commission. Accordingly, you should not place undue reliance on any such forward-looking statements. Any forward-looking statement speaks only as of the date on which it is made, and, except as otherwise required by law, we do not undertake any obligation to publicly update or review any forward-looking statement, whether as a result of new information, future developments or otherwise.
About SelectQuote:
Founded in 1985, SelectQuote (NYSE: SLQT) pioneered the model of providing unbiased comparisons from multiple, highly-rated insurance companies, allowing consumers to choose the policy and terms that best meet their unique needs. Two foundational pillars underpin SelectQuote’s success: a strong force of highly-trained and skilled agents who provide a consultative needs analysis for every consumer, and proprietary technology that sources and routes high-quality leads. Today, the Company operates an ecosystem offering high touchpoints for consumers across insurance, pharmacy, and virtual care.
With an ecosystem offering engagement points for consumers across insurance, Medicare, pharmacy, and value-based care, the company now has three core business lines: SelectQuote Senior, SelectQuote Healthcare Services, and SelectQuote Life. SelectQuote Senior serves the needs of a demographic that sees around 10,000 people turn 65 each day with a range of Medicare Advantage and Medicare Supplement plans. SelectQuote Healthcare Services is comprised of the SelectRx Pharmacy, a Patient-Centered Pharmacy Home™ (PCPH) accredited pharmacy, SelectPatient Management, a provider of chronic care management services, and Healthcare Select which proactively connects consumers with a wide breadth of healthcare services supporting their needs.
FORT WORTH, Texas, Feb. 05, 2026 (GLOBE NEWSWIRE) — Sports Entertainment Gaming Global Corporation (“SEGG Media” or the “Company”) (NASDAQ: SEGG, LTRYW), a global sports, entertainment, and gaming group, today announced that Simon Lewis has been appointed Executive Vice President of Entertainment for SEGG Media and Chief Executive Officer of DotCom Ventures Inc., the subsidiary which is doing business as both Concerts.com and TicketStub.com, as the Company advances Concerts.com and TicketStub.com from development into commercial execution.
Lewis previously served as an advisor to the Company and now assumes expanded operational responsibility across SEGG Media’s entertainment portfolio, including the strategic development and execution of both Concerts.com and TicketStub.com. This reflects the Board’s focus on accelerating commercialization and disciplined platform launches.
A respected figure in the global live entertainment industry, Lewis is best known for his tenure as President of Live Nation Europe, where he played a key role in scaling the company’s international concert, sponsorship, and venue businesses. Across his career, he has worked extensively in establishing highly valuable and commercially successful platforms and long-term industry partnerships.
Marc Bircham, Chairman of the SEGG Media Board of Directors, said: “Simon brings rare, firsthand experience in building live entertainment businesses at scale. As we move Concerts.com, TicketStub.com and our broader entertainment assets from development into execution, his leadership, relationships, and operational discipline will be critical.”
As EVP of Entertainment, Lewis will oversee SEGG Media’s live entertainment strategy, partnerships, and platform growth. In his role as CEO of DotCom Ventures, he will lead the build-out and launch of Concerts.com and TicketStub.com as fan-focused destinations for concert discovery, ticketing, and engagement.
Simon Lewis said: “Alongside the Board of Directors, I have been profoundly stimulated in the process of analyzing and strategizing the significant infrastructure capabilities of the entire SEGG Media portfolio. I am ready to fully embrace the opportunity, and ability, to now implement a highly valuable and immediate commercial future for the businesses within concerts and ticketing alongside the entirety of the SEGG Media portfolio
“In particular, we’ll focus on the market position and diversified commercial opportunities for concerts and ticketing with fans and artists leading the way which has demonstrated the clear capability and future of this sector to evolve at pace and beyond traditional models.”
About SEGG Media Corporation SEGG Media (Nasdaq: SEGG, LTRYW) is a global sports, entertainment and gaming group operating a portfolio of digital assets including Sports.com, Concerts.com, TicketStub.com, and Lottery.com. Focused on immersive fan engagement, ethical gaming and AI-driven live experiences, SEGG Media is redefining how global audiences interact with the content they love.
ST. PETERSBURG, Fla., Feb. 05, 2026 (GLOBE NEWSWIRE) — The Board of Directors of Superior Group of Companies, Inc. (NASDAQ: SGC) today announced that it has declared a quarterly dividend of $0.14 per share, payable February 27, 2026, to shareholders of record as of February 16, 2026.
About Superior Group of Companies, Inc. (SGC): Established in 1920, Superior Group of Companies is comprised of three attractive business segments each serving large, fragmented and growing addressable markets. Across Healthcare Apparel, Branded Products and Contact Centers, each segment enables businesses to create extraordinary brand engagement experiences for their customers and employees. SGC’s commitment to service, quality, advanced technology, and omnichannel commerce provides unparalleled competitive advantages. We are committed to enhancing shareholder value by continuing to pursue a combination of organic growth and strategic acquisitions. For more information visit www.superiorgroupofcompanies.com.
Genius Sports Limited (NYSE: GENI) has entered into a definitive agreement to acquire Legend, a global digital sports and gaming media network, in a transaction valued at up to $1.2 billion. The deal, announced on February 5, 2026, marks a significant strategic step for Genius Sports as it expands beyond official sports data into a fully integrated media, advertising, and fan activation ecosystem.
Under the terms of the agreement, Genius Sports will pay $900 million at closing—comprised of $800 million in cash and $100 million in stock—along with a potential earnout of up to $300 million tied to profitability and cash flow targets over the two years following closing. The acquisition is expected to close in the second quarter of 2026, subject to customary regulatory and closing conditions.
Legend brings to the table a scaled and highly engaged media platform that monetizes sports fan attention through owned and operated digital properties, advanced marketing technology, and syndication partnerships with major publishers such as Sports Illustrated and Yahoo Sports. In 2025 alone, Legend generated approximately 320 million annual visits from 118 million unique users, with more than two-thirds returning regularly—providing Genius Sports with a predictable, high-quality audience base.
Strategically, the acquisition positions Genius Sports as the only company operating two synergistic businesses across official sports data and media and advertising. By combining Legend’s media reach with Genius Sports’ proprietary data, betting, and advertising infrastructure, the company expects to unlock greater scale, stronger margins, and higher cash conversion than previously outlined at its Investor Day.
Financially, the transaction is expected to be immediately accretive to Group Adjusted EBITDA margins and free cash flow conversion. On a 2026 annualized pro forma basis, the combined company is expected to generate approximately $1.1 billion in group revenue and $320–330 million in Group Adjusted EBITDA, with roughly 50% free cash flow conversion. Genius Sports reiterated its expectation to maintain at least a 20% compound annual revenue growth rate through 2028.
The integration of Legend into Genius Sports’ ecosystem will be powered by FANHub, the company’s sports fan activation platform. FANHub will connect Legend’s global audience and marketing technology with Genius Sports’ network of more than 2,000 sports, media, and betting partners through a single, integrated platform—enhancing monetization opportunities at moments when fans are most engaged and likely to act.
Genius Sports also provided preliminary unaudited results for fiscal year 2025, reporting group revenue of $669 million, up 31% year-over-year, and Group Adjusted EBITDA of $136 million, representing 59% growth and a 20% margin. Looking ahead, the company expects standalone 2026 revenue of $810–820 million and Adjusted EBITDA of $180–190 million, before factoring in the Legend acquisition.
Funding for the transaction will include an $850 million Term Loan B, with pro forma leverage expected to remain below 3.0x and decline significantly by 2028. With this acquisition, Genius Sports aims to redefine the digital sports and gaming media landscape—combining data, audience, and technology at unprecedented scale.
Lucky Strike Entertainment is one of the world’s premier location-based entertainment platforms. With over 360 locations across North America, Lucky Strike Entertainment provides experiential offerings in bowling, amusements, water parks, and family entertainment centers. The company also owns the Professional Bowlers Association, the major league of bowling and a growing media property that boasts millions of fans around the globe. For more information on Lucky Strike Entertainment, please visit ir.luckystrikeent.com.
Michael Kupinski, Director of Research, Equity Research Analyst, Digital, Media & Technology , Noble Capital Markets, Inc.
Jacob Mutchler, Research Associate, Noble Capital Markets, Inc.
Refer to the full report for the price target, fundamental analysis, and rating.
Q2 Results. The company reported revenue of $306.9 million, largely in line with our estimate of $310.0 million, while adj. EBITDA of $77.5 million, missed our estimate of $97.3 million by roughly 20%. Notably, the quarter was driven by increased investment, largely related to marketing, which supported top-line results while pressuring adj. EBITDA in the quarter.
Clear inflection point. The company reported same-store sales growth of 0.3%, while this figure may seem modest, we view it as a favorable development. Notably, the events business, which has been the primary drag on same-store sales in recent periods, improved significantly during the quarter and was roughly flat y-o-y. Furthermore, in January, the event business experienced double-digit growth before being impacted by a major snowstorm.
Equity Research is available at no cost to Registered users of Channelchek. Not a Member? Click ‘Join’ to join the Channelchek Community. There is no cost to register, and we never collect credit card information.
This Company Sponsored Research is provided by Noble Capital Markets, Inc., a FINRA and S.E.C. registered broker-dealer (B/D).
*Analyst certification and important disclosures included in the full report. NOTE: investment decisions should not be based upon the content of this research summary. Proper due diligence is required before making any investment decision.
RESTON, Va., Feb. 4, 2026 /PRNewswire/ — V2X, Inc., (NYSE: VVX), a leading provider of global mission solutions, will report fourth quarter and full year 2025 financial results on Monday, February 23, 2026, after market close. Senior management will conduct a conference call at 4:30 p.m. ET that same day.
U.S.-based participants may dial in to the conference call at 877-300-8521, while international participants may dial 412-317-6026. A live webcast of the conference call as well as an accompanying slide presentation will be available at https://app.webinar.net/3do4py9pnRx and on the Investors section of the V2X website at https://gov2x.com/.
A replay of the conference call will be posted on the V2X website shortly after completion of the call and will be available for one year. A telephonic replay will also be available through March 9, 2026, at 844-512-2921 (domestic) or 412-317-6671 (international) with passcode 10206521.
About V2X V2X builds innovative solutions that integrate physical and digital environments by aligning people, actions, and technology. V2X is embedded in all elements of a critical mission’s lifecycle to enhance readiness, optimize resource management, and boost security. The company provides innovation spanning national security, defense, civilian, and international markets. With a global team of approximately 16,000 professionals, V2X enables mission success by injecting AI and machine learning capabilities to meet today’s toughest challenges across all operational domains.
Investor Contact Mike Smith, CFA Vice President, Treasury, Corporate Development and Investor Relations IR@goV2X.com 719-637-5773
Media Contact Angelica Spanos Deoudes Director, Corporate Communications Angelica.Deoudes@goV2X.com 571-338-5195
RICHMOND, Va.–(BUSINESS WIRE)– Lucky Strike Entertainment (NYSE: LUCK), one of the world’s premier owner/operators of location-based entertainment, today declared a regular quarterly cash dividend of $0.06 per common share. The dividend is payable on March 6, 2026, to stockholders of record on February 20, 2026.
About Lucky Strike Entertainment
Lucky Strike Entertainment is one of the world’s premier location-based entertainment platforms. With over 360 locations across North America, Lucky Strike Entertainment provides experiential offerings in bowling, amusements, water parks, and family entertainment centers. The Company also owns the Professional Bowlers Association, the major league of bowling and a growing media property that boasts millions of fans around the globe. For more information on Lucky Strike Entertainment, please visit IR.LuckyStrikeEnt.com.
Forward Looking Statements
Some of the statements contained in this press release are forward-looking statements within the meaning of Section 27A of the Securities Act of 1933, as amended, and Section 21E of the Securities Exchange Act of 1934, as amended, that involve risk, assumptions, and uncertainties, such as statements of our plans, objectives, expectations, intentions, and forecasts. These forward-looking statements reflect our views with respect to future events as of the date of this release and are based on our management’s current expectations, estimates, forecasts, projections, assumptions, beliefs, and information. Although management believes that the expectations reflected in these forward-looking statements are reasonable, it can give no assurance that these expectations will prove to have been correct. All such forward-looking statements are subject to risks and uncertainties, many of which are outside of our control, and could cause future events or results to be materially different from those stated or implied in this document. It is not possible to predict or identify all such risks. These risks include, but are not limited to: our ability to design and execute our business strategy; changes in consumer preferences and buying patterns; our ability to compete in our markets; the occurrence of unfavorable publicity; risks associated with long-term non-cancellable leases for our locations; our ability to retain key managers; risks associated with our substantial indebtedness and limitations on future sources of liquidity; our ability to carry out our expansion plans; our ability to successfully defend litigation brought against us; failure to hire and retain qualified employees and personnel; cybersecurity breaches, cyber-attacks and other interruptions to our and our third-party service providers’ technological and physical infrastructures; catastrophic events, including war, terrorism and other conflicts; public health emergencies and pandemics, such as the COVID-19 pandemic, or natural catastrophes and accidents; fluctuations in our operating results; economic conditions, including the impact of increasing interest rates, inflation and recession; and other factors described under the section titled “Risk Factors” in the Company’s Annual Report on Form 10-K filed with the U.S. Securities and Exchange Commission (the “SEC”) by the Company on August 28, 2025, as well as other filings that the Company will make, or has made, with the SEC, such as Quarterly Reports on Form 10-Q and Current Reports on Form 8-K. These factors should not be construed as exhaustive and should be read in conjunction with the other cautionary statements that are included in this press release and in other filings. We expressly disclaim any obligation to publicly update or review any forward-looking statements, except as required by applicable law.
Lucky Strike Entertainment Corporation Investor Relations IR@LSEnt.com
Texas Instruments (Nasdaq: TXN) announced on February 4, 2026, that it has entered into a definitive agreement to acquire Silicon Labs (Nasdaq: SLAB) in an all-cash transaction valued at approximately $7.5 billion. Under the terms of the deal, Silicon Labs shareholders will receive $231.00 per share, positioning the acquisition as a major consolidation move in the fast-growing embedded wireless connectivity market.
The transaction brings together Texas Instruments’ strength in analog and embedded processing with Silicon Labs’ leadership in secure, intelligent wireless technology. The combined company is expected to emerge as a global leader in embedded wireless connectivity solutions, a segment benefiting from long-term secular trends such as the Internet of Things (IoT), industrial automation, smart infrastructure, and connected consumer devices.
Strategically, the acquisition expands Texas Instruments’ embedded portfolio with approximately 1,200 Silicon Labs products supporting a wide range of wireless standards and protocols. Silicon Labs’ mixed-signal and wireless expertise complements Texas Instruments’ existing analog and embedded processing capabilities, allowing the combined company to deliver more comprehensive and integrated solutions to customers across industrial, automotive, and consumer end markets.
A central pillar of the deal is manufacturing integration. Texas Instruments plans to leverage its industry-leading, internally owned manufacturing footprint to reshore Silicon Labs’ production, which currently relies heavily on external foundries. Texas Instruments operates 300mm wafer fabrication facilities in the United States, along with internal assembly and test operations, providing dependable, low-cost capacity at scale. Management expects this integration to improve supply reliability for customers while reducing costs and shortening development cycles, particularly as Texas Instruments’ 28nm and other defined process technologies are well suited to Silicon Labs’ wireless product portfolio.
The financial rationale is equally compelling. Texas Instruments expects the transaction to generate approximately $450 million in annual manufacturing and operational synergies within three years of closing. These efficiencies are expected to come from manufacturing optimization, operational scale, and streamlined processes across design, production, and distribution. The company also expects the acquisition to be accretive to earnings per share in the first full year after closing, excluding transaction-related costs.
Beyond cost synergies, Texas Instruments sees significant growth opportunities through expanded customer reach and cross-selling. Its global sales force, direct customer relationships, and robust e-commerce platform are expected to deepen engagement with Silicon Labs’ existing customers while introducing its wireless solutions to new markets. Silicon Labs has delivered roughly 15% compound annual revenue growth since 2014, driven by increasing demand for connected devices, and Texas Instruments aims to build on this momentum with greater scale and market access.
The acquisition has been unanimously approved by the boards of both companies. Texas Instruments plans to fund the transaction using a combination of cash on hand and debt financing, with no financing contingency. The deal is expected to close in the first half of 2027, subject to regulatory approvals and approval by Silicon Labs shareholders.
Following the acquisition, Texas Instruments reiterated its commitment to returning 100% of free cash flow to shareholders over time through dividends and share repurchases, signaling confidence that the transaction will enhance long-term shareholder value while strengthening its position in embedded wireless connectivity.
Comstock (NYSE: LODE) innovates technologies that contribute to global decarbonization and circularity by efficiently converting under-utilized natural resources into renewable fuels and electrification products that contribute to balancing global uses and emissions of carbon. The Company intends to achieve exponential growth and extraordinary financial, natural, and social gains by building, owning, and operating a fleet of advanced carbon neutral extraction and refining facilities, by selling an array of complimentary process solutions and related services, and by licensing selected technologies to qualified strategic partners. To learn more, please visit www.comstock.inc.
Mark Reichman, Managing Director, Equity Research Analyst, Natural Resources, Noble Capital Markets, Inc.
Hans Baldau, Associate Analyst, Noble Capital Markets, Inc.
Refer to the full report for the price target, fundamental analysis, and rating.
Industry-scale facility fully permitted. Comstock has received all required regulatory approvals for its first industry-scale solar recycling facility in Silver Springs, Nevada, including the Written Determination Permit and the Air Quality Permit from the Nevada Division of Environmental Protection. The permits cover the full scope required to commission a facility designed to process more than 3.0 million panels per year, representing up to 100 thousand tons of end-of-life solar materials. Installation, testing, and commissioning are expected to occur during the first quarter of 2026.
Unit economics. Comstock’s recycling process is certified as a zero-landfill solution and designed to handle all major solar panel types, eliminating contaminants and recovering aluminum, glass, and metal-rich tailings. Comstock estimates that facility-level economics reflect a combination of upfront processing fees and proceeds from recovered materials, resulting in revenue of ~$750 per ton against all-in operating costs of roughly $150 per ton. Based on current operating data, profitability is achievable at relatively low utilization levels.
Equity Research is available at no cost to Registered users of Channelchek. Not a Member? Click ‘Join’ to join the Channelchek Community. There is no cost to register, and we never collect credit card information.
This Company Sponsored Research is provided by Noble Capital Markets, Inc., a FINRA and S.E.C. registered broker-dealer (B/D).
*Analyst certification and important disclosures included in the full report. NOTE: investment decisions should not be based upon the content of this research summary. Proper due diligence is required before making any investment decision.
ARLP is a diversified natural resource company that generates operating and royalty income from coal produced by its mining complexes and royalty income from mineral interests it owns in strategic oil & gas producing regions in the United States, primarily the Permian, Anadarko and Williston basins. ARLP currently produces coal from seven mining complexes its subsidiaries operate in Illinois, Indiana, Kentucky, Maryland and West Virginia. ARLP also operates a coal loading terminal on the Ohio River at Mount Vernon, Indiana. ARLP markets its coal production to major domestic and international utilities and industrial users and is currently the second largest coal producer in the eastern United States. In addition, ARLP is positioning itself as an energy provider for the future by leveraging its core technology and operating competencies to make strategic investments in the fast growing energy and infrastructure transition.
Mark Reichman, Managing Director, Equity Research Analyst, Natural Resources, Noble Capital Markets, Inc.
Hans Baldau, Associate Analyst, Noble Capital Markets, Inc.
Refer to the full report for the price target, fundamental analysis, and rating.
Fourth quarter and full year 2025 financial results. Alliance reported adjusted fourth quarter revenue, adj. EBITDA and earnings per unit (EPU) of $535.5 million, $191.1 million, and $0.64, respectively, compared to $590.1 million, $124.0 million, and $0.12 during the prior year period. We had forecast revenue, adj. EBITDA and EPU of $560.1 million, $182.9 million, and $0.57, respectively. While the quarter was impacted by lower coal sales, which impacted revenue, operating expenses were lower, and net income on equity method investments exceeded our estimate. Full year 2025 adj. EBITDA and EPU of $698.7 million and $2.40, respectively, were above our estimates of $690.5 million and $2.33, respectively.
Management guidance for 2026. Total coal sales are expected to be in the range of 33.75 million to 35.25 million tons, while the sales price of coal per ton is expected to be in the range of $54.00 to $56.00. Segmented adjusted EBITDA expense per ton sold is expected to be $37.00 to $39.00. ARLP has committed and priced 32.2 million tons of its 2026 sales volume, including 30.5 million tons for the domestic market and 1.7 million tons for the export market.
Equity Research is available at no cost to Registered users of Channelchek. Not a Member? Click ‘Join’ to join the Channelchek Community. There is no cost to register, and we never collect credit card information.
This Company Sponsored Research is provided by Noble Capital Markets, Inc., a FINRA and S.E.C. registered broker-dealer (B/D).
*Analyst certification and important disclosures included in the full report. NOTE: investment decisions should not be based upon the content of this research summary. Proper due diligence is required before making any investment decision.
Patrick McCann, CFA, Research Analyst, Noble Capital Markets, Inc.
Michael Kupinski, Director of Research, Equity Research Analyst, Digital, Media & Technology , Noble Capital Markets, Inc.
Refer to the full report for the price target, fundamental analysis, and rating.
Pricing announced for upcoming bond issuance. Sky Harbour priced $150 million of Series 2026 private activity tax-exempt bonds at par to yield 6.0%, with a mandatory tender on January 1, 2031, and an expected closing on or about February 12, 2026. The transaction is another example of the company’s tax-advantaged financing toolkit and deepens its access to institutional municipal investors.
Deal upsized on strong investor demand. The transaction was initially marketed at $100 million but was upsized to $150 million after receiving approximately $450 million of orders from 18 institutional investors. In our view, the oversubscription supports growing investor comfort in the asset base, the cash flow ramp, and the repeatable development playbook.
Equity Research is available at no cost to Registered users of Channelchek. Not a Member? Click ‘Join’ to join the Channelchek Community. There is no cost to register, and we never collect credit card information.
This Company Sponsored Research is provided by Noble Capital Markets, Inc., a FINRA and S.E.C. registered broker-dealer (B/D).
*Analyst certification and important disclosures included in the full report. NOTE: investment decisions should not be based upon the content of this research summary. Proper due diligence is required before making any investment decision.