Lee Enterprises, Incorporated provides local news, information, and advertising primarily in midsize markets in the United States. It publishes 49 daily newspapers, as well as offers 300 weekly newspapers and specialty publications in 23 states. The company also provides online advertising and services; and online infrastructure and online publishing services for approximately 1,500 daily and weekly newspapers and shoppers. In addition, it offers commercial printing services. The company has a strategic alliance with Yahoo!, Inc. to provide its classified employment advertising customer base the opportunity to post job listings and other employment products on Yahoo!�s HotJobs national platform. Lee Enterprises, Incorporated was founded in 1890 and is based in Davenport, Iowa.
Michael Kupinski, Director of Research, Equity Research Analyst, Digital, Media & Technology , Noble Capital Markets, Inc.
Patrick McCann, CFA, Research Analyst, Noble Capital Markets, Inc.
Refer to the full report for the price target, fundamental analysis, and rating.
Solid Q3 results. The company reported fiscal Q3 revenue and adj. EBITDA slightly below our expectations. Revenue was $171.3 million and adj. EBITDA was $23.2 million, compared with our estimates of $174.0 million and $25.6 million, respectively. Revenue was impacted by self induced cuts in its print business, the savings of which will flow through fiscal 2024 as well. While Q3 results were slightly lower than our estimates, we view the quarter favorably given strong digital revenue growth of 14.8% and improved print margins.
Strong digital growth. The company’s digital business had another strong quarter, with total digital revenue growing a strong 14.8%, comprising 41% of total company revenues. Notably, the company has been leading the industry in digital subscriber growth for the last 14 quarters, growing at a CAGR of 44%. Digital subscribers reached 606,000 and subscription revenue grew 43% from the prior year period. In our view, its goals of 900,000 Digital subscribers and $100 million in Digital subscription revenue by 2026 appears well within its reach.
Equity Research is available at no cost to Registered users of Channelchek. Not a Member? Click ‘Join’ to join the Channelchek Community. There is no cost to register, and we never collect credit card information.
This Company Sponsored Research is provided by Noble Capital Markets, Inc., a FINRA and S.E.C. registered broker-dealer (B/D).
*Analyst certification and important disclosures included in the full report. NOTE: investment decisions should not be based upon the content of this research summary. Proper due diligence is required before making any investment decision.
ISG (Information Services Group) (Nasdaq: III) is a leading global technology research and advisory firm. A trusted business partner to more than 700 clients, including more than 75 of the world’s top 100 enterprises, ISG is committed to helping corporations, public sector organizations, and service and technology providers achieve operational excellence and faster growth. The firm specializes in digital transformation services, including automation, cloud and data analytics; sourcing advisory; managed governance and risk services; network carrier services; strategy and operations design; change management; market intelligence and technology research and analysis. Founded in 2006, and based in Stamford, Conn., ISG employs more than 1,300 digital-ready professionals operating in more than 20 countries—a global team known for its innovative thinking, market influence, deep industry and technology expertise, and world-class research and analytical capabilities based on the industry’s most comprehensive marketplace data. For additional information, visit www.ISG-One.com
Joe Gomes, Managing Director, Equity Research Analyst, Generalist , Noble Capital Markets, Inc.
Joshua Zoepfel, Research Associate, Noble Capital Markets, Inc.
Refer to the full report for the price target, fundamental analysis, and rating.
Record 2Q23 Top Line. Record 2Q revenueof $74.6 million, up 5.5% y-o-y. Currency translation negatively impacted reported revenue by $0.1 million. By geography, Americas revenue rose 7% to $42.3 million, Europe was up 5% on a reported basis to $24.4 million, and Asia-Pacific revenue of $8 million was flat to the prior year. We were at $75 million.
Increasing Recurring Revenues. Strong demand for research and platform services in the second quarter led to 21% growth in recurring revenues, which now represent more than 40% of Company revenue. ISG’s mix of portfolio solutions and services around cost optimization and digital transformation continues to resonate with clients.
Equity Research is available at no cost to Registered users of Channelchek. Not a Member? Click ‘Join’ to join the Channelchek Community. There is no cost to register, and we never collect credit card information.
This Company Sponsored Research is provided by Noble Capital Markets, Inc., a FINRA and S.E.C. registered broker-dealer (B/D).
*Analyst certification and important disclosures included in the full report. NOTE: investment decisions should not be based upon the content of this research summary. Proper due diligence is required before making any investment decision.
Haynes International, Inc. is a leading developer, manufacturer and marketer of technologically advanced, nickel and cobalt-based high-performance alloys, primarily for use in the aerospace, industrial gas turbine and chemical processing industries.
Mark Reichman, Managing Director, Equity Research Analyst, Natural Resources, Noble Capital Markets, Inc.
Refer to the full report for the price target, fundamental analysis, and rating.
Third quarter financial results. Haynes International reported third quarter fiscal 2023 net income of $8.8 million or $0.68 per share compared to $15.6 million or $1.24 per share during the prior year period and $12.3 million or $0.96 per share during the prior quarter. We had forecast net income of $8.5 million or $0.67 per share. Revenues of $143.9 million increased 10.6% on a year-over-year basis but declined 5.8% compared to the prior quarter. A June cybersecurity incident negatively impacted net revenues by an estimated $18 to $20 million and earnings per share by $0.40 to $0.45. Earnings were also negatively impacted by raw material fluctuations, primarily for cobalt, which resulted in a $0.09 per share impact. The prior year period benefited from a raw material tailwind of $0.25 per diluted share.
Growing order backlog. Orders during the quarter resulted in a record backlog of $468.1 million as of June 30th and represented a 4.8% increase compared to the prior quarter and a 38.4% increase on a year-over-year basis. Backlog pounds increased 3.2% during the third quarter to approximately 14.6 million pounds and increased 20.7% compared to the prior year period driven by strong demand in the aerospace and industrial gas turbine markets.
Equity Research is available at no cost to Registered users of Channelchek. Not a Member? Click ‘Join’ to join the Channelchek Community. There is no cost to register, and we never collect credit card information.
This Company Sponsored Research is provided by Noble Capital Markets, Inc., a FINRA and S.E.C. registered broker-dealer (B/D).
Entravision Communications Corporation is a diversified Spanish-language media company utilizing a combination of television and radio operations to reach Hispanic consumers across the United States, as well as the border markets of Mexico. Entravision owns and/or operates 53 primary television stations and is the largest affiliate group of both the top-ranked Univision television network and Univision’s TeleFutura network, with television stations in 20 of the nation’s top 50 Hispanic markets. The Company also operates one of the nation’s largest groups of primarily Spanish-language radio stations, consisting of 48 owned and operated radio stations.
Michael Kupinski, Director of Research, Equity Research Analyst, Digital, Media & Technology , Noble Capital Markets, Inc.
Patrick McCann, CFA, Research Analyst, Noble Capital Markets, Inc.
Refer to the full report for the price target, fundamental analysis, and rating.
Mixed Q2 results. While revenues beat expectations ($273.4 million versus our $262.9 million estimate), adj. EBITDA was 13% lower than expected ($14.2 million versus our $16.4 million estimate). The revenue variance was due to its Digital revenue, $10 million above our expectations. Notably, the biggest adj. EBITDA variance was due to lower margins in its Digital Media segment.
A Facebook faceplant. The company’s Digital Media margins going forward will be adversely affected by Meta (Facebook) is reducing Entravision’s commission revenue, from 10% to 7%. We estimate that this will adversely affect the company by over $8 million in adj. EBITDA in the second half 2023. While margins will take a hit, the company’s Digital Media revenue growth appears favorable and adj. EBITDA is expected to grow strong double digits in 2024.
Equity Research is available at no cost to Registered users of Channelchek. Not a Member? Click ‘Join’ to join the Channelchek Community. There is no cost to register, and we never collect credit card information.
This Company Sponsored Research is provided by Noble Capital Markets, Inc., a FINRA and S.E.C. registered broker-dealer (B/D).
*Analyst certification and important disclosures included in the full report. NOTE: investment decisions should not be based upon the content of this research summary. Proper due diligence is required before making any investment decision.
FAT Brands (NASDAQ: FAT) is a leading global franchising company that strategically acquires, markets, and develops fast casual, quick-service, casual dining, and polished casual dining concepts around the world. The Company currently owns 17 restaurant brands: Round Table Pizza, Fatburger, Marble Slab Creamery, Johnny Rockets, Fazoli’s, Twin Peaks, Great American Cookies, Hot Dog on a Stick, Buffalo’s Cafe & Express, Hurricane Grill & Wings, Pretzelmaker, Elevation Burger, Native Grill & Wings, Yalla Mediterranean and Ponderosa and Bonanza Steakhouses, and franchises and owns over 2,300 units worldwide. For more information on FAT Brands, please visit www.fatbrands.com.
Joe Gomes, Managing Director, Equity Research Analyst, Generalist , Noble Capital Markets, Inc.
Joshua Zoepfel, Research Associate, Noble Capital Markets, Inc.
Refer to the full report for the price target, fundamental analysis, and rating.
2Q23 Results. FAT Brands reported 2Q23 revenue of $106.8 million, up 3.9% y-o-y from $102.8 million in the year ago quarter. System-wide sales growth was 1.7%. Same Store Sales were up 1.9%. FAT reported adjusted EBITDA of $23.1 million in the quarter, compared to $29.5 million in 2Q22. Net loss for the quarter was $7.1 million, or $0.53/sh, compared to a net loss of $9.8 million, or $0.60/sh last year. Adjusted net income for the quarter was $3.0 million, or EPS of $0.08/sh, compared to a net loss of $3.1 million, or a loss of $0.29/sh, last year. We had projected revenue of $106.8 million and a net loss of $26 million, or a loss of $1.57/sh.
Development Continues. YTD, FAT has opened 66 restaurants, including 25 in 2Q and the Company remains on track to open 175 locations in 2023. YTD, over 150 new franchise agreements have been signed, bringing the total pipeline to over 1,100 signed agreements.
Equity Research is available at no cost to Registered users of Channelchek. Not a Member? Click ‘Join’ to join the Channelchek Community. There is no cost to register, and we never collect credit card information.
This Company Sponsored Research is provided by Noble Capital Markets, Inc., a FINRA and S.E.C. registered broker-dealer (B/D).
*Analyst certification and important disclosures included in the full report. NOTE: investment decisions should not be based upon the content of this research summary. Proper due diligence is required before making any investment decision.
DLH delivers improved health and readiness solutions for federal programs through research, development, and innovative care processes. The Company’s experts in public health, performance evaluation, and health operations solve the complex problems faced by civilian and military customers alike, leveraging digital transformation, artificial intelligence, advanced analytics, cloud-based applications, telehealth systems, and more. With over 2,300 employees dedicated to the idea that “Your Mission is Our Passion,” DLH brings a unique combination of government sector experience, proven methodology, and unwavering commitment to public health to improve the lives of millions. For more information, visit www.DLHcorp.com.
Joe Gomes, Managing Director, Equity Research Analyst, Generalist , Noble Capital Markets, Inc.
Joshua Zoepfel, Research Associate, Noble Capital Markets, Inc.
Refer to the full report for the price target, fundamental analysis, and rating.
Standing Ready. With its acquisitions of S3, IBA, and, most recently GRSi, DLH has truly morphed into a one stop shop platform to address a broader range of client’s solution needs with expertise in science, research and development, systems engineering, and integration.
Promising Pipeline. Although the contract award environment continues to experience some headwinds, there does appear to be some movement both with anticipated proposals from previously won ID/IQ contracts as well as normal ongoing business. Overall, we believe there is significant demand from its clients for the services DLH provides.
Equity Research is available at no cost to Registered users of Channelchek. Not a Member? Click ‘Join’ to join the Channelchek Community. There is no cost to register, and we never collect credit card information.
This Company Sponsored Research is provided by Noble Capital Markets, Inc., a FINRA and S.E.C. registered broker-dealer (B/D).
*Analyst certification and important disclosures included in the full report. NOTE: investment decisions should not be based upon the content of this research summary. Proper due diligence is required before making any investment decision.
Beasley Broadcast Group, Inc. owns and operates 61 stations (47 FM and 14 AM) in 15 large- and mid-size markets in the United States. Approximately 20 million consumers listen to the Company’s radio stations weekly over-the-air, online and on smartphones and tablets, and millions regularly engage with the Company’s brands and personalities through digital platforms such as Facebook, Twitter, text messaging, digital and web applications and email. The Overwatch League’s Houston Outlaws esports team is a wholly owned subsidiary. The Company also owns BeasleyXP, a national esports content hub, and AXLR-R8, a Rocket League Championship Series team, in its esports portfolio. For more information, please visit www.bbgi.com.
Michael Kupinski, Director of Research, Equity Research Analyst, Digital, Media & Technology , Noble Capital Markets, Inc.
Jacob Mutchler, Research Associate, Noble Capital Markets, Inc.
Refer to the full report for the price target, fundamental analysis, and rating.
Solid Q2 results. The company reported revenue of $63.5 million, in-line with our estimate of $63.7 million. Adj. EBITDA of $7.7 million, beat our estimate of $6.5 million by 18.2%. Notably, the quarter was driven by strong digital revenue growth of14.8% and cash flow was supported by meaningful cost reductions and permanently reduced headcount.
Strong digital growth. The bulk of digital revenue growth in the quarter came from high margin content creation on the company’s owned and operated platforms. Importantly, Q2 digital accounted for 19.4% of total revenue, only slightly below management’s target of 20% to 30% for full year 2023.
Equity Research is available at no cost to Registered users of Channelchek. Not a Member? Click ‘Join’ to join the Channelchek Community. There is no cost to register, and we never collect credit card information.
This Company Sponsored Research is provided by Noble Capital Markets, Inc., a FINRA and S.E.C. registered broker-dealer (B/D).
*Analyst certification and important disclosures included in the full report. NOTE: investment decisions should not be based upon the content of this research summary. Proper due diligence is required before making any investment decision.
DeSantis Thinks the Federal Reserve, Elitists, and China, Should all Have Less Power in Our Financial Lives
Federal Reserve Chairman Jerome Powell, appointed by President Trump, then reappointed by President Biden recently got a lot of attention from Florida governor and presidential hopeful Ron DeSantis – and it wasn’t the kind of attention someone in Powell’s position would welcome. This week, in his first big speech on the economy, DeSantis separated himself from the top candidates from each political party by vowing to “rein in” the Fed.
The platform DeSantis unveiled this week helps establish his position and puts a face on his campaign that is decidedly above the culture wars of other political campaigns. It also creates a clear difference in economic issues between himself and his party’s frontrunner, also from Florida, Donald Trump.
In a campaign speech in New Hampshire, DeSantis blamed the US central bank for high inflation, and its dipping a toe into social policy. He was also very critical of the Fed considering a digital dollar that would compete with private crypto, which the candidate does not oppose.
The overall tone as he began to lay out his economic agencda, was one of looking to curb the power of large corporations, limit ties to China, and stand against powerful elites. “We need to rein in the Federal Reserve. It is not designed or supposed to be an economic central planner. It is not supposed to be indulging in social justice or social engineering,” the governor said. He continued, “It’s got one job, maintaining stable prices, and it has departed from that with what it’s done over the past many years.”
Coming to Florida this December is the premier investor conference, NobleCon19. You’re invited to join over 100 company executives and investors from around the globe as they seek better understanding of opportunities direct from senior management, then network in an environment that fosters making great contacts.
As statements that could be taken as a shot at the current Fed chairman, DeSantis said he would not likely support another term for Powell. “I will appoint a Chair of the Federal Reserve who understands the limited role that it has and focuses on making sure that prices are stable for American businesses and consumers, said DeSantis.
What seemed to be his biggest gripe with how the Federal Reserve has been run is with monetary policy. He believes that policy was kept too easy for too long after the financial crisis and pandemic. He believes this contributed to the high inflation, which forced a rapid tightening from policy makers.
The popular governor of the third most populace state, also railed against the Fed’s steps toward creating a central bank digital currency (CBDC), saying it was trying to crush financial liberty and seize more control over financial transactions.
“Why did they want this? They want to go to a cashless society. They want to eliminate cryptocurrency and they want all the transactions to go through this central bank digital currency,” DeSantis proclaimed.
The DeSantis economic vision, as described, was consistent with his reputation as Florida’s executive which is one that stands against the abuses of government power and big business. “We cannot have policy that kowtows to the largest corporations and Wall Street at the expense of small businesses and average Amerricans.” He continued, “There is a difference between a free-market economy, which we want, and corporatism in which the rules are jiggered to be able to help incumbent companies.”
He also expressed concern over loss of economic sovereignty sharply saying, “We have to restore the economic sovereignty of this country and take back control of our economy from China. This abusive relationship between two countries, must come to an end.”
Take Away
DeSantis is on the road, both showing he has an understanding of economics and unveiling a plan that is distinct from the top two candidates, both of which have already occupied the White House. DeSantis is being watched very closely by both political parties as he is a very popular governor with a lot of admiration and a large following. Florida remains a beneficiary of the large migration of businesses and families out of other states looking for a more innovative, fiscally responsible, less constricting place to live and do business.
Plans for the Platform Formerly Known as “Twitter”
Elon Musk, who counts the old Twitter among the companies he oversees, has plans for a mega-financial component to the social media platform that has been rebranded as X. The serial entrepreneur has in the past discussed the “everything” app WeChat as a model for X’s direction. WeChat is a product available to banking clients in China, as a useful do-it-all tool chest. Musk says it has no equal in the U.S. Part of what is expected from Elon’s team is enabling users of X to trade stock and cryptocurrencies and also perform all that fintech companies like PayPal provide.
Embracing a New Direction
Molding X into the ultimate multi-functional app may be beginning to take shape and gain momentum. Musk may not have invented Twitter, but he plans on reinventing it with some very aggressive plans under the new name.
Evidence of this comes from Musk and his team’s discussions with a prominent financial data powerhouse to establish a trading hub within the X platform, including real-time market data. Leaked documents, as reported by the news source Semafor, and conversations with insiders have revealed the huge initiative. It is unclear whether X has secured partnerships for its additional direction at this point.
Fuzzy Business Benefit to Partnerships
X’s outreach to potential partners highlights the company’s promise of access to a massive social media user base numbering in the hundreds of millions. The proposal requests don’t mention compensation for the project, according to Liz Hoffman at Semafor.
Plans of incorporating a trading hub within the X platform have been brought up in the past. Not long ago eTORO, a unique social investment platform, had unveiled plans to facilitate the trading of various assets, including cryptocurrencies, directly to users, through a strategic partnership of what was then Twitter.
If the plans for an in-app trading hub materialize, given Musk’s evident familiarity with Dogecoin and other digital assets, X could potentially become a hub for cryptocurrency trading. Much of the the crypto regulatory world is still being written on a battlefield by various parties with different interests. This prospect might extend to established cryptocurrencies like bitcoin (BTC), which could be perceived as a relatively secure asset within some regulatory frameworks.
Elon Musk’s innovative drive is propelling X towards uncharted territory. As the app evolves, the prospect of a comprehensive trading hub integrated seamlessly within the platform could redefine the way users engage with their finances and investments. While details are understandably not public, knowledge that this may be unfolding and the potential power and disruption it may create are undeniable.
In a reply to a social post on X by @unusual_whales which read, “Twitter/X is planning to launch its own stock trading platform, per XNewsDaily,” Musk did not completely dismiss the existence of any plans but did not in any way confirm that there has been any real movement in this direction.
Company to host conference call and webcast at 4:30 p.m. ET on Thursday, August 10, 2023
NEWTOWN, Pa., Aug. 03, 2023 (GLOBE NEWSWIRE) — Onconova Therapeutics, Inc. (NASDAQ: ONTX), (“Onconova” or “the Company”), a clinical-stage biopharmaceutical company focused on discovering and developing novel products for patients with cancer, today announced that the Company intends to release its second quarter 2023 financial results on Thursday, August 10, 2023. Management plans to host a conference call and live webcast at 4:30 p.m. ET on the same day to discuss these results and provide an update on its pipeline programs.
Conference Call and Webcast Information
Interested parties who wish to participate in the conference call may do so by dialing:
(800) 715-9871 for domestic and
(646) 307-1963 for international callers and
Using conference ID 9506701.
Those interested in listening to the conference call via the internet may do so by visiting the investors and media page on the Company’s website at www.onconova.com and clicking on the webcast link. In addition to the live webcast, a replay will be available on the Onconova website for 90 days following the call.
About Onconova Therapeutics, Inc. Onconova Therapeutics is a clinical-stage biopharmaceutical company focused on discovering and developing novel products for patients with cancer. The Company has proprietary targeted anti-cancer agents designed to disrupt specific cellular pathways that are important for cancer cell proliferation.
Onconova’s novel, proprietary multi-kinase inhibitor narazaciclib (formerly ON 123300) is being evaluated in a Phase 1/2 combination trial with the estrogen blocker, letrozole, in advanced low grade endometrial cancer (NCT05705505). Based on preclinical and clinical studies of CDK 4/6 inhibitors, Onconova is also evaluating opportunities for combination studies with narazaciclib in additional indications.
Onconova’s product candidate rigosertib is being studied in multiple investigator-sponsored studies. These studies include a dose-escalation and expansion Phase 1/2a study of oral rigosertib in combination with nivolumab in patients with KRAS+ non-small cell lung cancer (NCT04263090), a Phase 2 program evaluating oral or IV rigosertib monotherapy in advanced squamous cell carcinoma complicating recessive dystrophic epidermolysis bullosa (RDEB-associated SCC (NCT03786237, NCT04177498), and a Phase 2 trial evaluating rigosertib in combination with pembrolizumab in patients with metastatic melanoma(NCT05764395).
Forward Looking Statements Some of the statements in this release are forward-looking statements within the meaning of Section 27A of the Securities Act of 1933, as amended, Section 21E of the Securities Exchange Act of 1934, as amended, and the Private Securities Litigation Reform Act of 1995, and involve risks and uncertainties. These statements relate to Onconova’s expectations regarding its clinical development and trials, its product candidates and its business and financial position. Onconova has attempted to identify forward-looking statements by terminology including “believes,” “estimates,” “anticipates,” “expects,” “plans,” “intends,” “may,” “could,” “might,” “will,” “should,” “preliminary,” “encouraging,” “approximately” or other words that convey uncertainty of future events or outcomes. Although Onconova believes that the expectations reflected in such forward-looking statements are reasonable as of the date made, expectations may prove to have been materially different from the results expressed or implied by such forward-looking statements. These statements are only predictions and involve known and unknown risks, uncertainties, and other factors, including the success and timing of Onconova’s clinical trials, investigator-sponsored trials, regulatory agency and institutional review board approvals of protocols, Onconova’s collaborations, market conditions and those discussed under the heading “Risk Factors” in Onconova’s most recent Annual Report on Form 10-K and quarterly reports on Form 10-Q. Any forward-looking statements contained in this release speak only as of its date. Onconova undertakes no obligation to update any forward-looking statements contained in this release to reflect events or circumstances occurring after its date or to reflect the occurrence of unanticipated events.
SANTA MONICA, Calif.–(BUSINESS WIRE)– Entravision Communications Corporation (NYSE: EVC), a leading global advertising solutions, media and technology company, today announced financial results for the three- and six-month periods ended June 30, 2023.
Second Quarter 2023 Highlights
Record quarterly advertising revenue
Net revenue up 23% over the prior-year quarter
Net loss attributable to common stockholders of $2.0 million compared to net income attributable to common stockholders of $8.5 million in the prior-year quarter
Consolidated EBITDA down 37% compared to the prior-year quarter
Operating cash flow up 7% over the prior-year quarter
Free cash flow down 89% compared to the prior-year quarter
Quarterly cash dividend of $0.05 per share
“We delivered another strong quarter at Entravision with record quarterly revenue of $273.4 million, increasing 23% year-over-year,” said Chris Young, Chief Financial Officer. “While elevated operating expenses led to a decline in adjusted EBITDA, we remain focused on managing expenses and leveraging our strong balance sheet to ensure we are well-positioned to grow in the current macroeconomic environment. We were also excited to welcome Michael Christenson as our new CEO at the beginning of July. We look forward to continuing to drive growth under his leadership.”
Quarterly Cash Dividend
The Company announced today that its Board of Directors approved a quarterly cash dividend to shareholders of $0.05 per share on the Company’s Class A and Class U common stock, in an aggregate amount of $4.4 million. The quarterly dividend will be payable on September 29, 2023 to shareholders of record as of the close of business on September 15, 2023, and the common stock will trade ex-dividend on September 14, 2023. The Company currently anticipates that future cash dividends will be paid on a quarterly basis; however, any decision to pay future cash dividends will be subject to approval by the Board.
Non-GAAP Financial Measures
This press release contains certain non-GAAP financial measures as defined by SEC Regulation G. The GAAP financial measure most directly comparable to each of these non-GAAP financial measures, and a table reconciling each of these non-GAAP financial measures to its most directly comparable GAAP financial measure is included beginning on page 10.
Net revenue in the second quarter of 2023 totaled $273.4 million, up 23% from $221.7 million in the prior-year period. Of the overall increase, $55.5 million was attributable to our digital segment and was primarily due to advertising revenue growth from our digital commercial partnerships business, and due to various acquisitions, which did not contribute to our financial results in our digital segment in the comparable period. The overall increase was partially offset by a decrease of $2.5 million attributable to our television segment, primarily due to decreases in political advertising revenue and national advertising revenue, partially offset by increases in local advertising revenue, spectrum usage rights revenue and retransmission consent revenue. In addition, the overall increase was partially offset by a decrease of $1.4 million attributable to our audio segment, primarily due to a decrease in political advertising revenue, and decreases in local and national advertising revenue.
Cost of revenue in the second quarter of 2023 totaled $195.8 million, up 35% from $145.0 million in the prior-year period. The increase was primarily due to increased cost of revenue related to advertising revenue growth from our digital commercial partnerships business, and due to various acquisitions, which did not contribute to our financial results in our digital segment in the comparable period.
Operating expenses in the second quarter of 2023 totaled $56.6 million, up 20% from $47.4 million in the prior-year period. Of the overall increase, $7.8 million was attributable to our digital segment and was primarily due to an increase in non-cash stock-based compensation, which is mainly a result of the timing of the 2023 annual restricted stock unit (“RSU”) grant to certain employees, which was made in February 2023 compared to the 2022 annual grant, which was made in December 2022, and due to an increase in expenses associated with the increase in digital advertising revenue, an increase in salary expense, and due to various acquisitions, which did not contribute to our financial results in our digital segment in the comparable period. Additionally, of the overall increase in operating expenses, $0.1 million was attributable to our television segment primarily due to an increase in non-cash stock-based compensation, which is mainly a result of the 2023 annual RSU grant timing mentioned above, partially offset by a decrease in bad debt expense. In addition, of the overall increase in operating expenses, $1.3 million was attributable to our audio segment primarily due to an increase in non-cash stock-based compensation, which is mainly a result of the 2023 annual RSU grant timing mentioned above, and due to an increase in salaries and increased rent expense in the temporary office space until the move to our new permanent offices, which was completed in June 2023.
Corporate expenses in the second quarter of 2023 totaled $12.0 million, up 41% from $8.5 million in the prior-year period. The increase was primarily due to an increase in non-cash stock-based compensation, which is mainly a result of the 2023 annual RSU grant timing mentioned above, and increases in professional service fees.
Net revenue for the six-month period of 2023 totaled $512.4 million, up 22% from $418.9 million in the prior-year period. Of the overall increase, $98.3 million was attributable to our digital segment and was primarily due to advertising revenue growth from our digital commercial partnerships business, and due to various acquisitions, which did not contribute to our financial results in our digital segment in the comparable period. The overall increase was partially offset by a decrease of $2.9 million attributable to our television segment, primarily due to decreases in political advertising revenue and national advertising revenue, partially offset by increases in local advertising revenue, spectrum usage rights revenue and retransmission consent revenue. In addition, the overall increase was partially offset by a decrease of $1.7 million attributable to our audio segment, primarily due to a decrease in political advertising revenue, and decreases in local and national advertising revenue.
Cost of revenue for the six-month period of 2023 totaled $363.6 million, up 32% from $274.9 million in the prior-year period. The increase was primarily due to increased cost of revenue related to advertising revenue growth from our digital commercial partnerships business, and due to various acquisitions, which did not contribute to our financial results in our digital segment in the comparable period.
Operating expenses for the six-month period of 2023 totaled $109.3 million, up 20% from $91.2 million in the prior-year period. Of the overall increase, $14.1 million was attributable to our digital segment and was primarily due to an increase in non-cash stock-based compensation, which is mainly a result of the 2023 annual RSU grant timing mentioned above, and due to an increase in expenses associated with the increase in digital advertising revenue, an increase in salary expense, and due to various acquisitions, which did not contribute to our financial results in our digital segment in the comparable period. Additionally, of the overall increase in operating expenses, $1.0 million was attributable to our television segment primarily due to an increase in non-cash stock-based compensation, which is mainly a result of the 2023 annual RSU grant timing mentioned above. In addition, of the overall increase in operating expenses, $2.9 million was attributable to our audio segment primarily due to an increase in non-cash stock-based compensation, which is mainly a result of the 2023 annual RSU grant timing mentioned above, and due to an increase in salaries and increased rent expense in the temporary office space until the move to our new permanent offices, which was completed in June 2023.
Corporate expenses for the six-month period of 2023 totaled $22.5 million, up 31% from $17.2 million in the prior-year period. The increase was primarily due to an increase in non-cash stock-based compensation, which is mainly a result of the 2023 annual RSU grant timing mentioned above, and increases in professional service fees, audit fees and rent expense.
Balance Sheet and Related Metrics
Cash and marketable securities as of June 30, 2023 totaled $126.5 million. Total debt under the Company’s credit agreement was $210.3 million. Net of $50 million of cash and marketable securities, total leverage as defined in the Company’s credit agreement was 1.8 times as of June 30, 2023. Net of total cash and marketable securities, total leverage was 1.0 times.
Notice of Conference Call
Entravision Communications Corporation will hold a conference call to discuss its second quarter 2023 results on Thursday, August 3, 2023 at 5:00 p.m. Eastern Time. To access the conference call, please dial (844) 836-8739 (U.S.) or (412) 317-5440 (Int’l) ten minutes prior to the start time and reference Conference ID number 10180063. The call will also be available via live webcast on the investor relations portion of the Company’s website located at www.entravision.com.
About Entravision Communications Corporation
Entravision is a global advertising solutions, media and technology company. Over the past three decades, we have strategically evolved into a digital powerhouse, expertly connecting brands to consumers in the U.S., Latin America, Europe, Asia and Africa. Our digital segment, the company’s largest by revenue, offers a full suite of end-to-end advertising services in 40 countries. We have commercial partnerships with Meta, X Corp. (formerly known as Twitter), TikTok, and Spotify, and marketers can use our Smadex and other platforms to deliver targeted advertising to audiences around the globe. In the U.S., we maintain a diversified portfolio of television and radio stations that target Hispanic audiences and complement our global digital services. Entravision remains the largest affiliate group of the Univision and UniMás television networks. Shares of Entravision Class A Common Stock trade on the NYSE under ticker: EVC. Learn more about our offerings at entravision.com or connect with us on LinkedIn and Facebook.
Forward-Looking Statements
This press release contains certain forward-looking statements. These forward-looking statements, which are included in accordance with the safe harbor provisions of the Private Securities Litigation Reform Act of 1995, may involve known and unknown risks, uncertainties and other factors that may cause the Company’s actual results and performance in future periods to be materially different from any future results or performance suggested by the forward-looking statements in this press release. Although the Company believes the expectations reflected in such forward-looking statements are based upon reasonable assumptions, it can give no assurance that actual results will not differ materially from these expectations, and the Company disclaims any duty to update any forward-looking statements made by the Company. From time to time, these risks, uncertainties and other factors are discussed in the Company’s filings with the Securities and Exchange Commission.
Christopher T. Young Chief Financial Officer and Treasurer Entravision Communications Corporation 310-447-3870
Second Quarter 2023 Revenues of $256.9 Million Increased 14.6 Percent Over Second Quarter 2022 Revenues of $224.2 Million, Including 17.1 Percent Organic Growth in Kratos Government Solutions Segment
Second Quarter 2023 and Last Twelve Months Ended June 25, 2023 Consolidated Book to Bill Ratio of 1.1 to 1
Affirms Full Year 2023 Financial Forecast
SAN DIEGO, Aug. 03, 2023 (GLOBE NEWSWIRE) — Kratos Defense & Security Solutions, Inc. (Nasdaq: KTOS), a Technology Company in the Defense, National Security and Global Markets, today reported its second quarter 2023 financial results. For the second quarter of 2023, Kratos reported Revenues of $256.9 million, Operating Income of $6.7 million, Net Loss of $2.7 million, Adjusted EBITDA of $21.6 million and a consolidated book to bill ratio of 1.1 to 1.0.
Included in second quarter 2023 Net Loss and Operating Income is non-cash stock compensation expense of $6.0 million and Company-funded Research and Development (R&D) expense of $9.9 million, primarily reflecting significant ongoing development efforts being made, including in our Space and Satellite business to develop our virtual, software-based OpenSpace command & control (C2), telemetry tracking & control (TT&C) and other ground system solutions. The second quarter 2023 Net Loss includes a $2.3 million loss attributable to a non-controlling interest, which includes a $2.0 million adjustment recorded to reflect the estimated increase in the value of the redeemable non-controlling interest to the estimated redemption amount by Kratos based upon current forecasted financial performance.
Kratos reported a second quarter 2023 GAAP Net Loss of $2.7 million and a GAAP Net Loss per share of $0.02, compared to a GAAP Net Loss of $4.7 million and a GAAP Net Loss per share of $0.04 for the second quarter of 2022. Adjusted earnings per share (EPS) was $0.09 for the second quarter of 2023, compared to $0.07 for the second quarter of 2022.
Second quarter 2023 Revenues of $256.9 million increased $32.7 million, or 14.6 percent, from second quarter 2022 Revenues of $224.2 million. Second quarter 2023 Revenues include contribution of $13.1 million of Revenue from the acquisition of the Engineering Division of Southern Research Institute (SRE), consolidated organic Revenue growth of 10.7 percent and organic Revenue growth of 17.1 percent in our KGS Segment, reflecting organic growth in each of the KGS businesses, with the most notable increases in our Space, Satellite and Cyber, C5ISR, and Turbine Technologies businesses.
Second quarter 2023 Cash Flow Generated from Operations was $23.6 million, reflecting the achievement of favorable billing milestones on certain contracts, offset partially by working capital requirements related to revenue growth and continued advanced inventory purchases in an effort to mitigate supply chain disruptions. Free Cash Flow Generated from Operations was $20.7 million after funding of $11.2 million of capital expenditures and receipt of $8.3 million of proceeds for sale of Valkyries that were built as Kratos capital assets.
For the second quarter of 2023, Kratos’ Unmanned Systems Segment (KUS) generated Revenues of $52.1 million, as compared to $56.4 million in the second quarter of 2022, primarily reflecting reduced tactical drone related activity as compared to 2022. KUS’s Operating Income was $1.2 million in the second quarter of 2023 compared to Operating Loss of $5.0 million in the second quarter of 2022, which included a litigation related settlement charge of $5.5 million.
KUS’s Adjusted EBITDA for the second quarter of 2023 was $3.6 million, compared to second quarter 2022 KUS Adjusted EBITDA of $2.9 million, reflecting a more favorable mix.
KUS’s book-to-bill ratio for the second quarter of 2023 was 1.2 to 1.0 and 1.3 to 1.0 for the last twelve months ended June 25, 2023, with bookings of $64.7 million for the three months ended June 25, 2023, and bookings of $266.2 million for the last twelve months ended June 25, 2023. Total backlog for KUS at the end of the second quarter of 2023 was $256.7 million compared to $244.1 million at the end of the first quarter of 2023.
For the second quarter of 2023, Kratos’ Government Solutions Segment (KGS) Revenues of $204.8 million increased 22.1 percent from Revenues of $167.8 million in the second quarter of 2022. The increased Revenues includes the contribution of approximately $13.1 million of Revenues from the SRE acquisition, and organic revenue growth in our Space, Satellite and Cyber, Turbine Technologies, C5ISR, Microwave Products and Defense Rocket Systems businesses. Excluding the SRE acquisition, KGS revenues grew organically 17.1 percent in the second quarter of 2023 as compared to the second quarter of 2022.
KGS reported operating income of $11.6 million in the second quarter of 2023 compared to $9.5 million in the second quarter of 2022, primarily reflecting the increased revenue volume. Second quarter 2023 KGS Adjusted EBITDA was $18.0 million, compared to second quarter 2022 KGS Adjusted EBITDA of $14.8 million, primarily reflecting the increased revenue volume.
Kratos’ Space, Satellite and Cyber business generated Revenues of $98.4 million in the second quarter of 2023 compared to $88.5 million in the second quarter of 2022, reflecting a 11.2 percent organic growth rate.
For the second quarter of 2023, KGS reported a book-to-bill ratio of 1.1 to 1.0, a book to bill ratio of 1.1 to 1.0 for the last twelve months ended June 25, 2023 and bookings of $217.1 million and $807.4 million for the three and last twelve months ended June 25, 2023, respectively. KGS includes Kratos’ Space, Training and Cyber business, which reported a book to bill ratio of 0.9 to 1.0 for the second quarter of 2023 and a book to bill ratio of 1.1 to 1.0 for the last twelve months ended June 25, 2023. Bookings for Kratos’ Space, Training and Cyber business for the three months and last twelve months ended June 25, 2023 were $95.6 million and $412.0 million, respectively. KGS’s total backlog at the end of the second quarter of 2023 was $900.6 million, as compared to $888.3 million at the end of the first quarter of 2023.
For the second quarter of 2023, Kratos reported consolidated bookings of $281.9 million and a book-to-bill ratio of 1.1 to 1.0, with consolidated bookings of $1.07 billion and a book-to-bill ratio of 1.1 to 1.0 for the last twelve months ended June 25, 2023. Consolidated backlog was $1.16 billion on June 25, 2023 and $1.13 billion on March 26, 2023. Kratos’ bid and proposal pipeline was $10 billion at June 25, 2023 and March 26, 2023. Backlog at June 25, 2023 was comprised of funded backlog of $863.9 million and unfunded backlog of $293.4 million.
Eric DeMarco, Kratos’ President and CEO, said, “For Q2, Kratos generated consolidated organic revenue growth of 10.7%, Adjusted EBITDA of $21.6 million, cash flow from operations of $23.6 million and free cash flow from operations of $20.7 million. Kratos’ Unmanned Systems book to bill ratio for Q2 was 1.2 to 1.0 and Kratos’ overall book to bill ratio both for the second quarter and year to date was 1.1 to 1.0. Additionally, we have a record backlog and a bid and proposal pipeline of approximately $10 billion, including hypersonic, space, propulsion system, satellite communications and drone opportunities, with several where multiple Kratos business units are collaborating in a company-wide Kratos cross-divisional pursuit.”
Mr. DeMarco continued, “Since our last quarterly report, we have successfully launched a customer’s new hypersonic system, ground tested Kratos’ new Zeus 1 solid rocket motor, including as related to Kratos’ Erinyes and Dark Fury hypersonic vehicles, received new space and satellite system program awards, including Kratos’ OpenSpace virtualized software C2 and TT&C System, reached customer agreement on a significant propulsion system program award and received a $95 million target drone system award. Kratos’ Tactical drone business also continues to progress, with multiple initiatives and customers, including bringing artificial intelligence driven combat drones to the warfighter.”
Mr. DeMarco concluded, “Kratos is a product, technology, system and software company. Kratos’ priorities include winning new program awards where Kratos offerings are disruptive differentiators, operational execution, organic growth and continued year over year increased revenue, profitability and cash flow. We will make certain, targeted investments, in areas where Kratos can be disruptive and first to market, with no significant acquisitions planned. A primary operational challenge remains obtaining and retaining qualified personnel to execute existing and expected program awards, including individuals willing and able to obtain National Security Clearances, and the significantly increased cost of these individuals, all of which every Kratos business is collaborating and working closely together to address.”
Financial Guidance
We are providing our initial 2023 third quarter financial guidance and affirming our full year 2023 guidance today, which includes our current forecasted business mix, and our assumptions, including as related to: employee sourcing, hiring and retention; manufacturing, production and supply chain disruptions; parts shortages and related continued potential significant cost and price increases, including for employees, materials and components that are impacting the industry and Kratos. The range of our expected third quarter 2023 revenues includes assumptions of forecasted execution, including the number of qualified personnel expected to be obtained and retained to successfully execute on our programs and contracts, as well as expected contract awards.
Our third quarter and full year 2023 guidance ranges are as follows:
Current Guidance Range
$M
Q323
FY23
Revenues
$240 – $260
$980 – $1,000
R&D
$9 – $10
$38 – $39
Operating Income
$3 – $6
$24 – $28
Depreciation
$7 – $8
$27 – $28
Amortization
$2 – $3
$8 – $10
Stock Based Compensation
$6 – $7
$24 – $26
Adjusted EBITDA
$18 – $22
$85 – $89
Operating Cash Flow
$55 – $65
Capital Expenditures
$45 – $50
Free Cash Flow Generation
$10 – $20
Management will discuss the Company’s financial results, on a conference call beginning at 2:00 p.m. Pacific (5:00 p.m. Eastern) today. The call will be available at www.kratosdefense.com. Participants may register for the call using this Online Form. Upon registration, all telephone participants will receive the dial-in number along with a unique PIN that can be used to access the call. For those who cannot access the live broadcast, a replay will be available on Kratos’ website.
About Kratos Defense & Security Solutions Kratos Defense & Security Solutions, Inc. (NASDAQ: KTOS) is a Technology Company that develops and fields transformative, affordable systems, products and solutions for United States National Security, our allies and global commercial enterprises. At Kratos, Affordability is a Technology, and Kratos is changing the way breakthrough technology is rapidly brought to market – at a low cost – with actual products, systems, and technologies rather than slide decks or renderings. Through proven commercial and venture capital backed approaches, including proactive, internally funded research and streamlined development processes, Kratos is focused on being First to Market with our solutions, well in advance of competition. Kratos is the recognized Technology Disruptor in our core market areas, including Space and Satellite Communications, Cyber Security and Warfare, Unmanned Systems, Rocket and Hypersonic Systems, Next-Generation Jet Engines and Propulsion Systems, Microwave Electronics, C5ISR and Virtual and Augmented Reality Training Systems. For more information, visit www.KratosDefense.com.
Notice RegardingForward-LookingStatements This news release contains certain forward-looking statements that involve risks and uncertainties, including, without limitation, express or implied statements concerning the Company’s expectations regarding its future financial performance, including the Company’s expectations for its third quarter and full year 2023 revenues, R&D, operating income (loss), depreciation, amortization, stock based compensation expense, and Adjusted EBITDA, and full year 2023 operating cash flow, capital expenditures and other investments, and free cash flow, the Company’s future growth trajectory and ability to achieve improved revenue mix and profit in certain of its business segments and the expected timing of such improved revenue mix and profit, including the Company’s ability to achieve sustained year over year increasing revenues, profitability and cash flow, the Company’s expectation of ramp on projects and that investments in its business, including Company funded R&D expenses and ongoing development efforts, will result in an increase in the Company’s market share and total addressable market and position the Company for significant future organic growth, profitability, cash flow and an increase in shareholder value, the Company’s bid and proposal pipeline and backlog, including the Company’s ability to timely execute on its backlog, demand for its products and services, including the Company’s alignment with today’s National Security requirements and the positioning of its C5ISR and other businesses, ability to successfully compete and expected new customer awards, including the magnitude and timing of funding and the future opportunity associated with such awards, including in the target and tactical drone and satellite communication areas, performance of key contracts and programs, including the timing of production and demonstration related to certain of the Company’s contracts and product offerings, the impact of the Company’s restructuring efforts and cost reduction measures, including its ability to improve profitability and cash flow in certain business units as a result of these actions and to achieve financial leverage on fixed administrative costs, the ability of the Company’s advanced purchases of inventory to mitigate supply chain disruptions and the timing of converting these investments to cash through the sales process, benefits to be realized from the Company’s net operating loss carry forwards, the availability and timing of government funding for the Company’s offerings, including the strength of the future funding environment, the short-term delays that may occur as a result of Continuing Resolutions or delays in DoD budget approvals, timing of LRIP and full rate production related to the Company’s unmanned aerial target system offerings, as well as the level of recurring revenues expected to be generated by these programs once they achieve full rate production, market and industry developments, and the current estimated impact of COVID-19 and employee absenteeism, supply chain disruptions, availability of an experienced skilled workforce, inflation and increased costs, and delays in our financial projections, industry, business and operations, including projected growth. Such statements are only predictions, and the Company’s actual results may differ materially from the results expressed or implied by these statements. Investors are cautioned not to place undue reliance on any such forward-looking statements. All such forward-looking statements speak only as of the date they are made, and the Company undertakes no obligation to update or revise these statements, whether as a result of new information, future events or otherwise. Factors that may cause the Company’s results to differ include, but are not limited to: risks to our business and financial results related to the reductions and other spending constraints imposed on the U.S. Government and our other customers, including as a result of sequestration and extended continuing resolutions, the Federal budget deficit and Federal government shut-downs; risks of adverse regulatory action or litigation; risks associated with debt leverage and cost savings and cash flow improvements expected as a result of the refinancing of our Senior Notes; risks that our cost-cutting initiatives will not provide the anticipated benefits; risks that changes, cutbacks or delays in spending by the U.S. Department of Defense, or DoD, may occur, which could cause delays or cancellations of key government contracts; risks of delays to or the cancellation of our projects as a result of protest actions submitted by our competitors; risks that changes may occur in Federal government (or other applicable) procurement laws, regulations, policies and budgets; risks of the availability of government funding for the Company’s products and services due to performance, cost growth, or other factors, changes in government and customer priorities and requirements (including cost-cutting initiatives, the potential deferral of awards, terminations or reduction of expenditures to respond to the priorities of Congress and the Administration, or budgetary cuts resulting from Congressional committee recommendations or automatic sequestration under the Budget Control Act of 2011, as amended); risks that the unmanned aerial systems and unmanned ground sensor markets do not experience significant growth; risks that products we have developed or will develop will become programs of record; risks that we cannot expand our customer base or that our products do not achieve broad acceptance which could impact our ability to achieve our anticipated level of growth; risks of increases in the Federal government initiatives related to in-sourcing; risks related to security breaches, including cyber security attacks and threats or other significant disruptions of our information systems, facilities and infrastructures; risks related to our compliance with applicable contracting and procurement laws, regulations and standards; risks related to the new DoD Cybersecurity Maturity Model Certification; risks relating to the ongoing conflict in Ukraine; risks related to contract performance; risks related to failure of our products or services; risks associated with our subcontractors’ or suppliers’ failure to perform their contractual obligations, including the appearance of counterfeit or corrupt parts in our products; changes in the competitive environment (including as a result of bid protests); failure to successfully integrate acquired operations and compete in the marketplace, which could reduce revenues and profit margins; risks that potential future goodwill impairments will adversely affect our operating results; risks that anticipated tax benefits will not be realized in accordance with our expectations; risks that a change in ownership of our stock could cause further limitation to the future utilization of our net operating losses; risks that we may be required to record valuation allowances on our net operating losses which could adversely impact our profitability and financial condition; risks that the current economic environment will adversely impact our business, including with respect to our ability to recruit and retain sufficient numbers of qualified personnel to execute on our programs and contracts, as well as expected contract awards and risks related to increasing interest rates and risks related to the interest rate swap contract to hedge Term SOFR associated with the Company’s Term Loan A; currently unforeseen risks associated with COVID-19 and risks related to natural disasters or severe weather. These and other risk factors are more fully discussed in the Company’s Annual Report on Form 10-K for the period ended December 25, 2022, and in our other filings made with the Securities and Exchange Commission.
Note Regarding Use of Non-GAAP Financial Measures and Other Performance Metrics This news release contains non-GAAP financial measures, including Adjusted EPS (computed using income from continuing operations before income taxes, excluding income (loss) from discontinued operations, excluding income (loss) attributable to non-controlling interest, excluding depreciation, amortization of intangible assets, amortization of capitalized contract and development costs, stock-based compensation expense, acquisition and restructuring related items and other, which includes, but is not limited to, legal related items, non-recoverable rates and costs, and foreign transaction gains and losses, less the estimated impact to income taxes) and Adjusted EBITDA (which includes net income (loss) attributable to noncontrolling interest and excludes, among other things, losses and gains from discontinued operations, acquisition and restructuring related items, stock compensation expense, foreign transaction gains and losses, and the associated margin rates). Additional non-GAAP financial measures include Free Cash Flow from Operations computed as Cash Flow from Operations less Capital Expenditures plus proceeds from sale of assets and Adjusted EBITDA related to our KUS and KGS businesses. Kratos believes this information is useful to investors because it provides a basis for measuring the Company’s available capital resources, the actual and forecasted operating performance of the Company’s business and the Company’s cash flow, excluding non-recurring items and non-cash items that would normally be included in the most directly comparable measures calculated and presented in accordance with GAAP. The Company’s management uses these non-GAAP financial measures, along with the most directly comparable GAAP financial measures, in evaluating the Company’s actual and forecasted operating performance, capital resources and cash flow. Non-GAAP financial measures should not be considered in isolation from, or as a substitute for, financial information presented in compliance with GAAP, and investors should carefully evaluate the Company’s financial results calculated in accordance with GAAP and reconciliations to those financial results. In addition, non-GAAP financial measures as reported by the Company may not be comparable to similarly titled amounts reported by other companies. As appropriate, the most directly comparable GAAP financial measures and information reconciling these non-GAAP financial measures to the Company’s financial results prepared in accordance with GAAP are included in this news release.
Another Performance Metric the Company believes is a key performance indicator in our industry is our Book to Bill Ratio as it provides investors with a measure of the amount of bookings or contract awards as compared to the amount of revenues that have been recorded during the period and provides an indicator of how much of the Company’s backlog is being burned or utilized in a certain period. The Book to Bill Ratio is computed as the number of bookings or contract awards in the period divided by the revenues recorded for the same period. The Company believes that the rolling or last twelve months’ Book to Bill Ratio is meaningful since the timing of quarter-to-quarter bookings can vary.
Unaudited Reconciliation of GAAP to Non-GAAP Measures
Note: (1) Adjusted EBITDA is a non-GAAP measure defined as GAAP net loss attributable to Kratos adjusted for net income attributable to noncontrolling interest, income from discontinued operations, net interest expense, provision (benefit) for income taxes, depreciation and amortization expense of intangible assets, amortization of capitalized contract and development costs, stock-based compensation, acquisition and restructuring related items and other, and foreign transaction loss.
Adjusted EBITDA as calculated by us may be calculated differently than Adjusted EBITDA for other companies. We have provided Adjusted EBITDA because we believe it is a commonly used measure of financial performance in comparable companies and is provided to help investors evaluate companies on a consistent basis, as well as to enhance understanding of our operating results. Adjusted EBITDA should not be construed as either an alternative to net income (loss) or as an indicator of our operating performance or an alternative to cash flows as a measure of liquidity. The adjustments to calculate this non-GAAP financial measure and the basis for such adjustments are outlined below. Please refer to the following table below that reconciles GAAP net loss to Adjusted EBITDA.
The adjustments to calculate this non-GAAP financial measure, and the basis for such adjustments, are outlined below:
Interest income and interest expense, net. The Company receives interest income on investments and incurs interest expense on loans, capital leases and other financing arrangements, including the amortization of issue discounts and deferred financing costs. These amounts may vary from period to period due to changes in cash and debt balances.
Income taxes. The Company’s tax expense can fluctuate materially from period to period due to tax adjustments that may not be directly related to underlying operating performance or to the current period of operations and may not necessarily reflect the impact of utilization of our NOLs.
Depreciation. The Company incurs depreciation expense (recorded in cost of revenues and in operating expenses) related to capital assets purchased, leased or constructed to support the ongoing operations of the business. The assets are recorded at cost or fair value and are depreciated over the estimated useful lives of individual assets.
Amortization of intangible assets. The Company incurs amortization of intangible expense related to acquisitions it has made. These intangible assets are valued at the time of acquisition and are amortized over the estimated useful lives.
Amortization of capitalized contract and development costs. The Company incurs amortization of previously capitalized software development and non-recurring engineering costs related to certain targets in its Unmanned Systems and ballistic missile target businesses as these units are sold.
Stock-based compensation expense. The Company incurs expense related to stock-based compensation included in its GAAP presentation of selling, general and administrative expense. Although stock-based compensation is an expense of the Company and viewed as a form of compensation, these expenses vary in amount from period to period, and are affected by market forces that are difficult to predict and are not within the control of management, such as the market price and volatility of the Company’s shares, risk-free interest rates and the expected term and forfeiture rates of the awards. Management believes that exclusion of these expenses allows comparison of operating results to those of other companies that disclose non-GAAP financial measures that exclude stock-based compensation.
Foreign transaction (gain) loss. The Company incurs transaction gains and losses related to transactions with foreign customers in currencies other than the U.S. dollar. In addition, certain intercompany transactions can give rise to realized and unrealized foreign currency gains and losses.
Acquisition and transaction related items. The Company incurs transaction related costs, such as legal and accounting fees and other expenses, related to acquisitions and divestiture activities. Management believes these items are outside the normal operations of the Company’s business and are not indicative of ongoing operating results.
Restructuring costs. The Company incurs restructuring costs for cost reduction actions which include employee termination costs, facility shut-down related costs and lease commitment costs for unused, excess or exited facilities. Management believes that these costs are not indicative of ongoing operating results as they are either non-recurring and/or not expected when full capacity and volumes are achieved.
Non-recoverable rates and costs. In fiscal 2022, the Company incurred non-recoverable rates and costs as a result of its inability to hire the required direct labor base to execute on its backlog due to a challenging environment in hiring and retaining skilled personnel. In addition, in 2022 the Company incurred non-recoverable rate growth resulting from a smaller than planned direct labor base due to delays in customer program execution and awards.
Legal related items. The Company incurs costs related to pending legal settlements and other legal related matters. Management believes these items are outside the normal operations of the Company’s business and are not indicative of ongoing operating results.
Adjusted EBITDA is a non-GAAP financial measure and should not be considered in isolation or as a substitute for financial information provided in accordance with GAAP. This non-GAAP financial measure may not be computed in the same manner as similarly titled measures used by other companies. The Company expects to continue to incur expenses similar to the Adjusted EBITDA financial adjustments described above, and investors should not infer from the Company’s presentation of this non-GAAP financial measure that these costs are unusual, infrequent, or non-recurring.
Note: Unallocated corporate expense, net includes costs for certain stock-based compensation programs (including stock-based compensation costs for stock options, employee stock purchase plan and restricted stock units), the effects of items not considered part of management’s evaluation of segment operating performance, and acquisition and restructuring related items, corporate costs not allocated to the segments, legal related items, and other miscellaneous corporate activities.
Vancouver, British Columbia–(Newsfile Corp. – August 3, 2023) – Maple Gold Mines Ltd. (TSXV: MGM) (OTCQB: MGMLF) (FSE: M3G) (“Maple Gold” or the “Company“) is pleased to report complete gold assay results from the first phase of deep drilling at the Douay Gold Project (“Douay”) located in Québec, Canada, which is held by a 50/50 joint venture (the “JV”) between the Company and Agnico Eagle Mines Limited. The Company is also pleased to announce the appointment of Jocelyn (Josh) Pelletier, M.Sc., P.geo. as its Chief Geologist. Mr. Pelletier is both a structural geologist and a specialist in metallogeny who brings more than 20 years of progressive exploration experience primarily focused on the formation of gold deposits and porphyry copper-gold systems. The Company also announces that Joness Lang and Fred Speidel have left the Company to pursue other opportunities.
At Douay, the JV completed a total of 5,793 metres (“m”) in three new holes and two extension holes during the first half of 2023. Four drill holes were designed as deep conceptual exploration holes to test for mineralization extensions at greater depths (up to ~1,600 m vertical depth) beneath Douay’s currently defined Mineral Resources, and the fifth drill hole was a shallower step-out hole to the east of the NW Zone (see Figure 1 for a plan view map depicting drill hole locations and key results, Figure 2 for a composite longitudinal section and Table 1 for a detailed summary of assay results). This first phase of widely spaced (from ~500 m to ~3,000 m between holes) deep drilling returned 10 separate intercepts >2.5 gold grams per tonne (“g/t Au”) and four broad intervals (from ~59 to ~221 m in length) of low-grade (mostly >0.1 g/t Au) gold mineralization, demonstrating that a deep-rooted gold system is present to the current limits of drilling. Pending multi-element assays from the first phase of deep drilling will be incorporated into ongoing vectoring efforts to develop follow up targets to continue testing the depth potential at Douay from successful proof-of-concept towards potentially economic gold intercepts in undrilled zones over more than six kilometers of strike length.
Highlighted Results and Key Takeaways:
All five drill holes intersected gold mineralization >1 g/t Au, with 10 intercepts >2.5 g/t Au and several broad (from ~59 m to ~221 m in length) low-grade intervals (averaging 0.1 to 0.3 g/t Au), demonstrating continuity of the gold system down to at least ~1,600 m vertical depth.
DO-23-332 and DO-23-326X both tested beneath the Porphyry Zone and returned the most compelling visual core observations with broad intervals of alteration and elevated fine grained pyrite mineralization. Such broad low-grade haloes, with multiple >1 g/t Au intercepts, are typical of the more peripheral parts of the Porphyry Zone.
DO-23-332 intersected 10 distinct intercepts of >1 g/t Au over at least 1.0 m. A broad (121 m) mineralized envelope with anomalous gold (0.31 g/t Au average) included intercepts of 3.6 g/t Au over 1 m, and 1.2 g/t Au over 10 m, including 3.3 g/t Au over 2 m. Additional 4.9 and 2.5 g/t Au intercepts over 1 m were obtained further up hole.
DO-23-326X returned eight intercepts grading >1 g/t Au over at least 1 m. Furthermore, this hole did not appear to intersect the full width of the potential zone and, importantly, bottomed in mineralization (see cross section in Figure 3). Visible gold was also identified at 1,826 m down-hole.
DO-23-331 was collared ~500 m south of the 531 Zone conceptual pit and returned 2.85 g/t Au over 1.6 m, including 6.2 g/t Au over 0.7 m, with a broader interval of 0.25 g/t Au over 50.8 m further up-hole.
“This deep drilling program was developed to test the potential for a much larger gold system at Douay while also demonstrating continuity of mineralization beneath currently defined Mineral Resources,” stated Matthew Hornor, President and CEO of Maple Gold. “The average vertical depth of all previous drilling at Douay is roughly 300 m, with limited data below 500 m, so this first pass of deeper drilling was discovery-focused with the aim of bringing us one step closer to uncovering a new zone at depth. The program was successful from a proof-of-concept standpoint in demonstrating mineralization continuity up to four times deeper than Douay’s currently defined Mineral Resources. Given what we’ve encountered in the JV’s first deep drill holes, the Company remains highly encouraged and confident that our detailed interpretation and vectoring work will lead to promising follow-up targets to incorporate into future drill campaigns at Douay. To support these ongoing initiatives, I am delighted to welcome Josh Pelletier as the Company’s new Chief Geologist and believe that his strong structural geology and metallogeny background will help unlock value at our strategically located and district-scale project portfolio within Quebec’s Abitibi greenstone belt.”
Technical Observations, Key Takeaways and Next Steps
The JV’s first phase deep drilling program delivered several key geological findings related to the potential depth continuity of gold mineralization at Douay:
From top-to-bottom (~2,000 m vertical depth), gold mineralization appears to be spatially associated with a porphyry-style intrusive complex and also appears in quartz-carbonate veins associated with shearing in the Casa Berardi Deformation Zone (“CBDZ”) that may be related to a separate orogenic gold system along this E-W regional structure.
Gold mineralization was identified within the contact zone between the two main lithologic sequences (Cartwright Hills Grp. volcanic sequences and Taibi Grp. sedimentary rocks) located along the crustal-scale CBDZ North structural corridor.
There are key structural corridors that appear to crosscut the auriferous porphyry-style mineralization, which provides potential for gold remobilization and reconcentration.
At Douay, two types of gold mineralization have been recognized: 1) gold that is spatially associated with porphyritic intrusive phases and 2) gold that is spatially associated with shear zones in the CBDZ. Both styles of mineralization may have formed in different conditions and time frames. The porphyry-style gold displays similarities to low-grade gold zones formed in magmatic-hydrothermal systems, while the gold related to shear zones is similar to other orogenic gold deposits that represent the majority of gold mines in the Abitibi gold belt. Therefore, it is important to distinguish both mineralization events, and to define their spatial distributions and orientations. The JV will be completing additional metallogenic interpretations and analysis to generate optimal targeting at Douay for future drill testing.
Figure 1: Plan view showing completed 2023 drill traces at Douay. Note DO-23-332 was drilled to 1,453 m but appears shorter due to subvertical inclination.
Multi-element analysis to define geochemical zonation and possible tracers to gold mineralization in order to improve vectoring within the mineralized system.
Paragenesis of gold mineralization based on mineralogical studies of the alteration patterns, gold deposition phases and other hydrothermal events.
Structural controls study to better constrain the geometry of known zones and improve targeting of structural traps.
Lithological studies to distinguish the different intrusive phases and evaluate their relationship with gold mineralization.
The Company will continue its vectoring work to refine the next set of priority drill targets at Douay, including follow-up on the first phase of deep drilling, as well as revisiting areas where the JV previously had successes (e.g. 531 and Western Porphyry zones). The Company is concurrently refining targets along its 100%-controlled Eagle Mine Project and in the Telbel Mine area within the JV’s Joutel Gold Project in preparation for anticipated fall and winter drilling campaigns, which are expected to be announced in the coming weeks. The Company’s VMS-focused exploration work is also ongoing with the aim of defining new drill targets, which are anticipated to be tested in early 2024.
Table 1: Complete Assay Results from the First Phase of Deep Drilling at Douay
Hole
UTME
UTMN
Azimuth
Plunge
Length (m)
From
To
Interval
Au g/t
DO-23-324X
704278
5490900
32
-66.5
779
1385.6
1397.0
11.4
0.28
including
1389.0
1391.0
2.0
0.95
DO-23-324X
1455.3
1457.5
2.2
0.74
DO-23-324X
1560.0
1568.3
8.3
0.83
including
1561.0
1561.9
0.9
2.76
including
1561.0
1565.9
4.9
1.28
including
1564.0
1565.9
1.9
1.50
DO-22-326
706400
5491650
172
-54
98
Master hole – reported on 11/30/22
DO-23-326XW1
706400
5491650
176.92
-50
1111
869.0
874.0
5.0
0.21
DO-23-326XW1
973.0
974.0
1.0
3.55
DO-23-326XW1
1213.0
1214.0
1.0
4.85
DO-23-326XW1
1276.0
1277.0
1.0
0.62
DO-23-326XW1
1641.0
1642.0
1.0
0.58
DO-23-326XW1
1664.8
1885.9
221.1
0.16
including
1670.0
1672.0
2.0
0.76
including
1695.0
1697.0
2.0
0.66
including
1706.0
1714.0
8.0
0.81
including
1711.0
1713.0
2.0
1.28
including
1739.0
1781.0
42.0
0.17
including
1790.0
1791.0
1.0
0.51
including
1826.0
1827.0
1.0
1.78
including
1833.3
1834.2
0.9
2.12
including
1850.5
1853.0
2.5
1.46
including
1852.0
1853.0
1.0
2.86
including
1861.0
1876.0
15.0
0.18
DO-23-326XW1
1945.4
1959.2
13.8
0.23
DO-23-331
706400
5491650
172
-54
2044
1869.0
1870.0
1.0
1.04
DO-23-331
1901.0
1951.8
50.8
0.25
including
1901.0
1902.0
1.0
1.15
including
1925.4
1927.0
1.6
2.85
including
1925.4
1926.1
0.7
6.17
including
1950.3
1950.8
0.5
2.96
DO-23-332
706820
5489915
340
-79.5
1453
135.0
136.0
1.0
1.10
DO-23-332
498.7
499.7
1.0
4.94
DO-23-332
653.7
664.7
11.0
0.29
including
657.0
659.0
2.0
0.74
DO-23-332
789.0
809.0
20.0
0.18
including
805.0
805.5
0.5
2.11
DO-23-332
845.2
852.0
6.8
0.29
DO-23-332
864.2
865.2
1.0
2.53
DO-23-332
953.0
953.5
0.5
1.26
DO-23-332
991.0
1112.0
121.0
0.31
including
1020.0
1021.0
1.0
3.61
including
1034.0
1044.0
10.0
1.16
including
1035.0
1037.0
2.0
3.31
including
1043.0
1044.0
1.0
1.01
including
1058.0
1059.0
1.0
1.25
including
1075.0
1077.0
2.0
1.12
including
1075.0
1076.0
1.0
1.49
including
1111.0
1112.0
1.0
1.07
DO-23-332
1205.0
1329.0
124.0
0.13
including
1295.0
1297.0
2.0
0.61
DO-23-333
705950
5492140.3
360
-55
297
248.0
252.8
4.8
0.69
including
251.3
252.8
1.5
1.55
Note: All reported intercepts are downhole core lengths. Estimated true widths are unknown at this time due to the limited data at the depths drilled.
Corporate Updates
Maple Gold is pleased to announce the appointment of Jocelyn (Josh) Pelletier as the Company’s new Chief Geologist. Mr. Pelletier is a structural geologist and a specialist in metallogeny with over 20 years of exploration experience primarily focused on the formation of gold deposits and porphyry copper-gold systems. He holds an M.Sc. degree in geology (UQAM – Montreal), a BSc in management and is a Fellow of the SEG as a Professional Geologist (OGQ). Mr. Pelletier has significant experience exploring Canada’s greenstone belts, including the Abitibi, Timmins, Red Lake, Beardmore and Rankin Inlet. He will work closely with the Company’s geological team, highly experienced Technical Committee and the JV to support the next phase of drill targets across the Company’s project portfolio.
The Company also announces that Joness Lang and Fred Speidel have left the Company to pursue other opportunities. The Company wishes both Mr. Lang and Mr. Speidel every success in their future endeavors.
Option Issuance
The Company has approved the grant to an employee and officer of stock options (“Options”) to purchase an aggregate of 400,000 common shares of the Company at an exercise price of $0.17 per common share. The Options have a 5-year term and vest 1/3 immediately, 1/3 in 12 months and 1/3 in 24 months from the date of grant until fully vested.
Qualified Person
The scientific and technical data contained in this press release was reviewed and prepared under the supervision of Jocelyn Pelletier, M.Sc., P.geo., Chief Geologist of Maple Gold. Mr. Pelletier has verified the data related to the exploration information disclosed in this press release through his direct participation in the work performed. Mr. Pelletier is a Qualified Person under National Instrument 43-101 Standards of Disclosure for Mineral Projects.
Quality Assurance (QA) and Quality Control (QC)
The Company implements strict Quality Assurance (“QA”) and Quality Control (“QC”) protocols at Douay and Telbel covering the planning and placing of drill holes in the field; drilling and retrieving the NQ-sized drill core; drill hole surveying; core transport; core logging by qualified personnel; sampling and bagging of core for analysis; transport of core from site to the Val d’Or, Québec ALS laboratory; sample preparation for assaying; and analysis, recording and final statistical vetting of results. Check assays for gold will be done on a sample subset at AGAT laboratory in Val d’Or. For a complete description of protocols, please visit the Company’s QA/QC webpage at www.maplegoldmines.com.
About Maple Gold
Maple Gold Mines Ltd. is a Canadian advanced exploration company in a 50/50 joint venture with Agnico Eagle Mines Limited to jointly advance the district-scale Douay and Joutel gold projects located in Québec’s prolific Abitibi Greenstone Gold Belt. The projects benefit from exceptional infrastructure access and boast ~400 km2 of highly prospective ground including an established gold resource at Douay (SLR 2022) that holds significant expansion potential as well as the past-producing Eagle, Telbel and Eagle West mines at Joutel. In addition, the Company holds an exclusive option to acquire 100% of the Eagle Mine Property.
The district-scale property package also hosts a significant number of regional exploration targets along a 55 km strike length of the Casa Berardi Deformation Zone that have yet to be tested through drilling, making the project ripe for new gold and polymetallic discoveries. The Company is well capitalized and is currently focused on carrying out exploration and drill programs to grow resources and make new discoveries to establish an exciting new gold district in the heart of the Abitibi. For more information, please visit www.maplegoldmines.com.
NEITHER THE TSX VENTURE EXCHANGE NOR ITS REGULATION SERVICES PROVIDER (AS THAT TERM IS DEFINED IN THE POLICIES OF THE TSX VENTURE EXCHANGE) ACCEPTS RESPONSIBILITY FOR THE ADEQUACY OR ACCURACY OF THIS PRESS RELEASE.
Forward Looking Statements:
This press release contains “forward-looking information” and “forward-looking statements” (collectively referred to as “forward-looking statements”) within the meaning of applicable Canadian securities legislation in Canada, including statements about exploration work and results from current and future work programs. Forward-looking statements are based on assumptions, uncertainties and management’s best estimate of future events. Actual events or results could differ materially from the Company’s expectations and projections. Investors are cautioned that forward-looking statements involve risks and uncertainties. Accordingly, readers should not place undue reliance on forward-looking statements. For a more detailed discussion of such risks and other factors that could cause actual results to differ materially from those expressed or implied by such forward-looking statements, refer to Maple Gold Mines Ltd.’s filings with Canadian securities regulators available on www.sedar.com or the Company’s website at www.maplegoldmines.com. The Company does not intend, and expressly disclaims any intention or obligation to, update or revise any forward-looking statements whether as a result of new information, future events or otherwise, except as required by law.


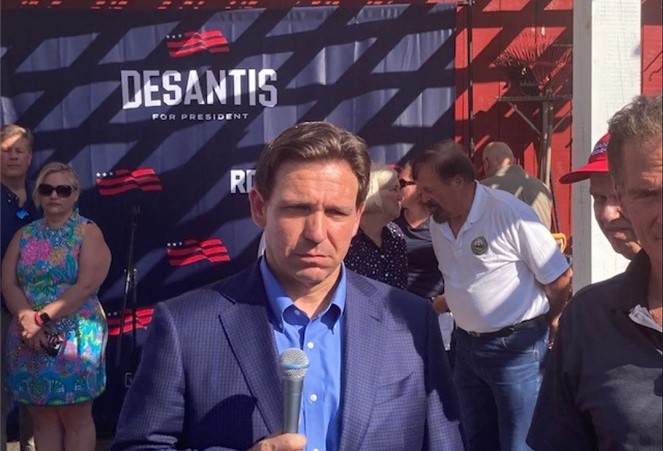


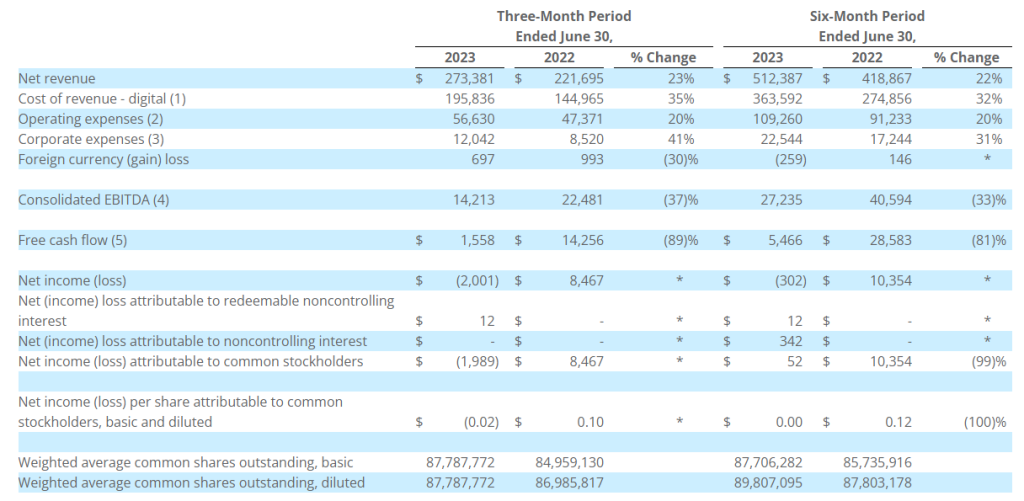
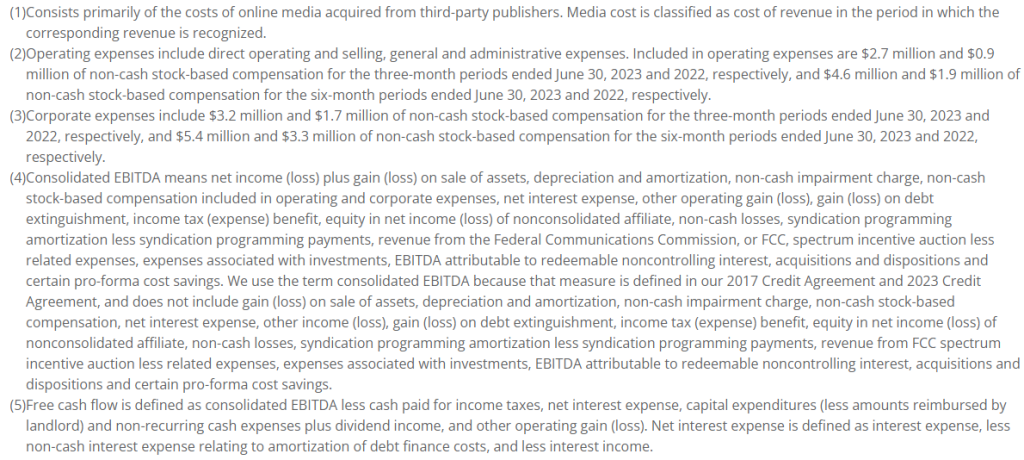
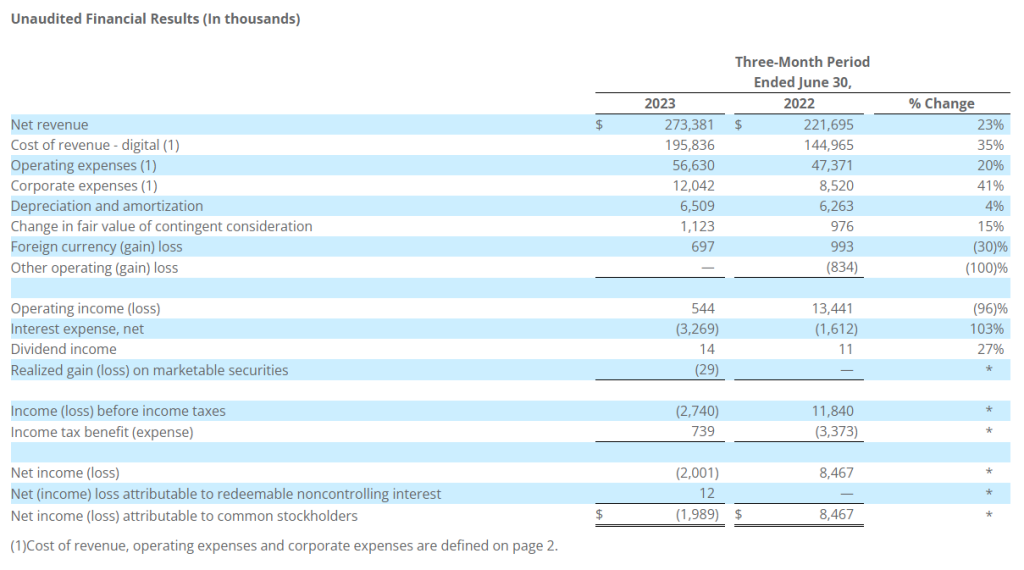
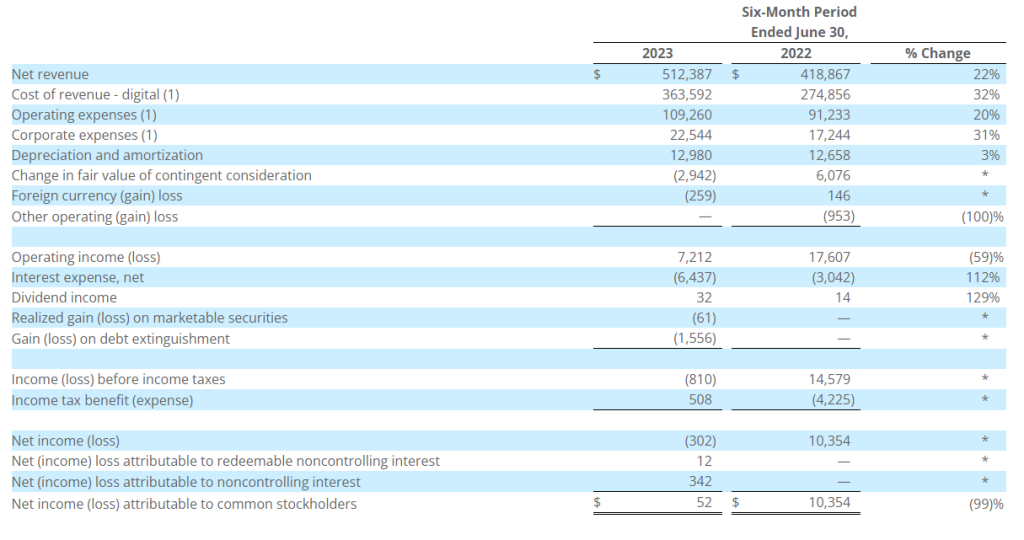
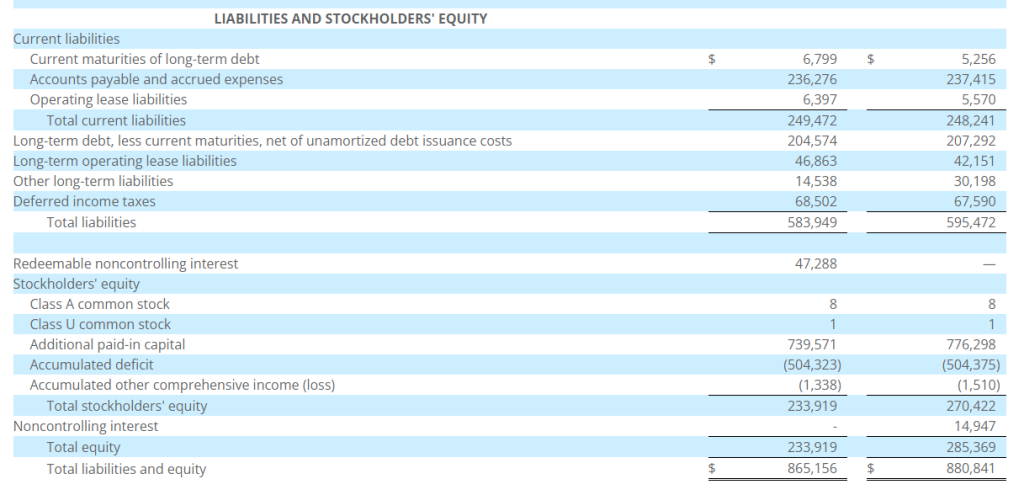
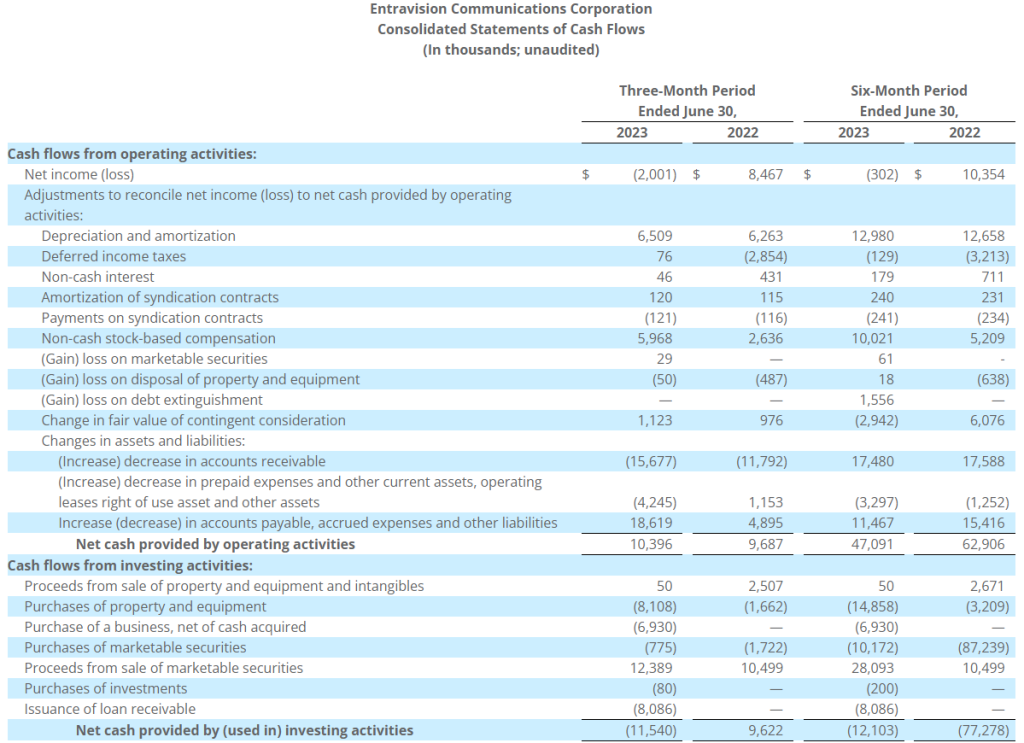
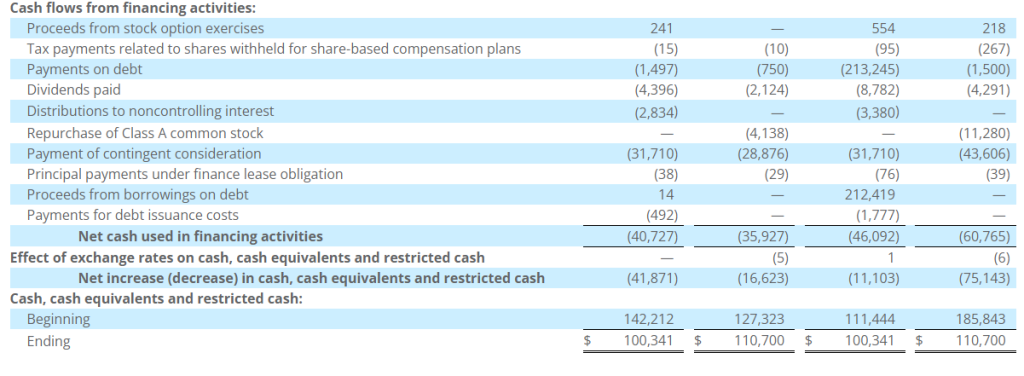
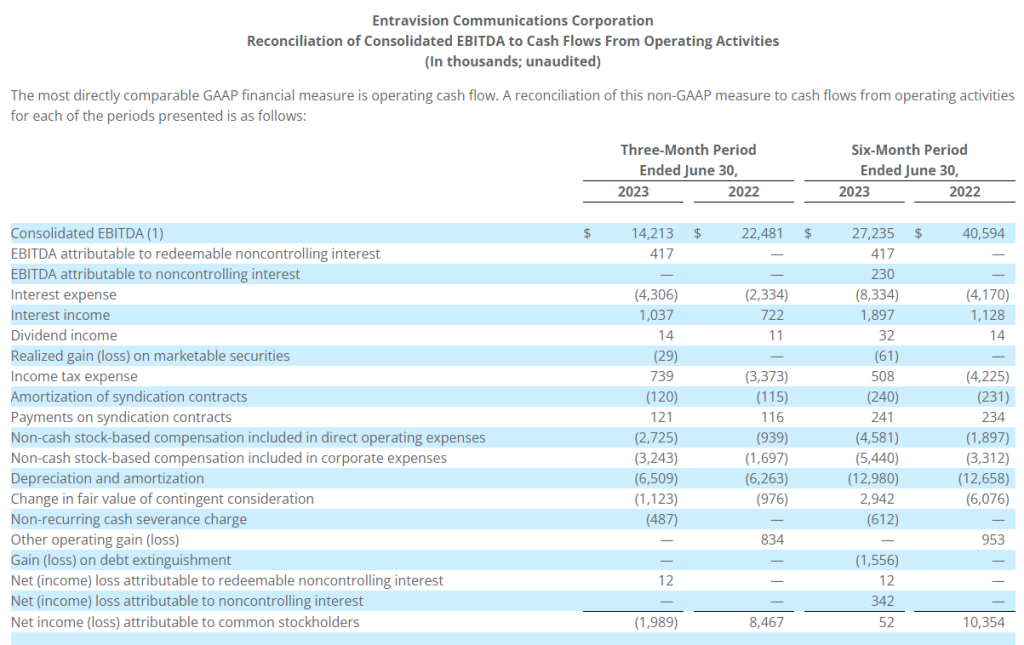
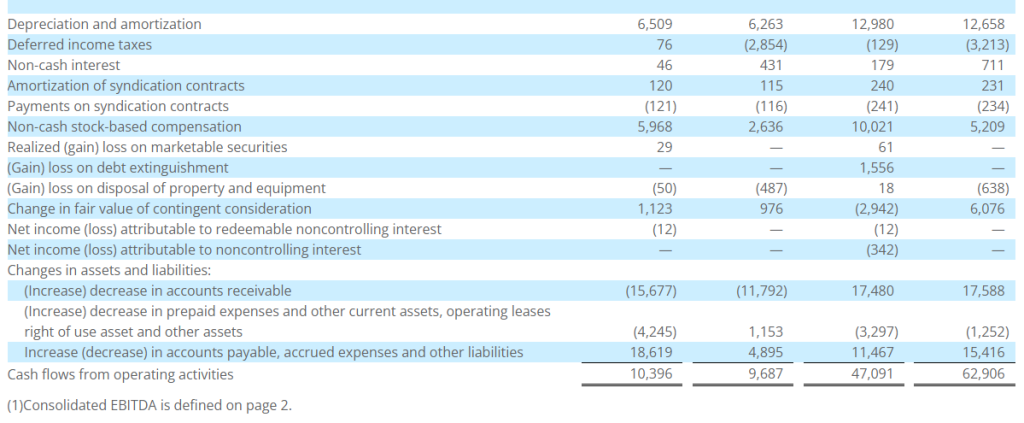
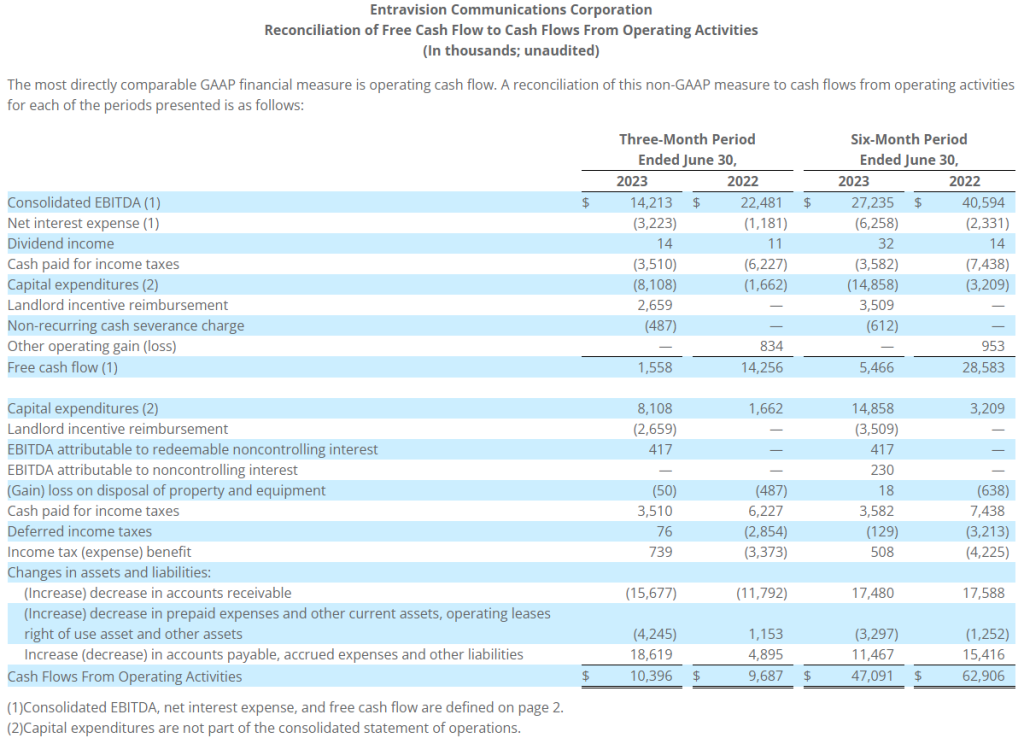
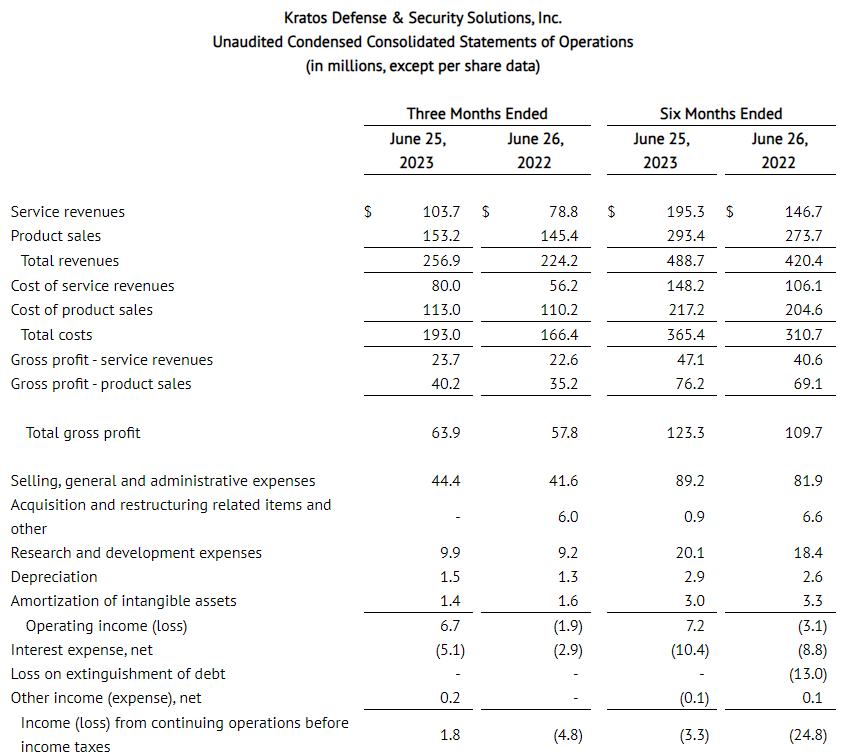

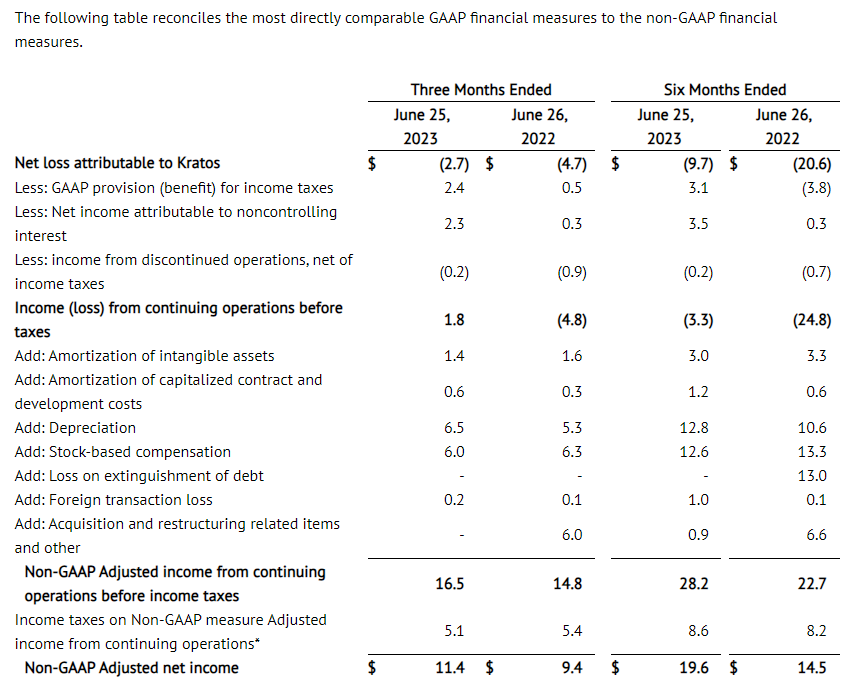
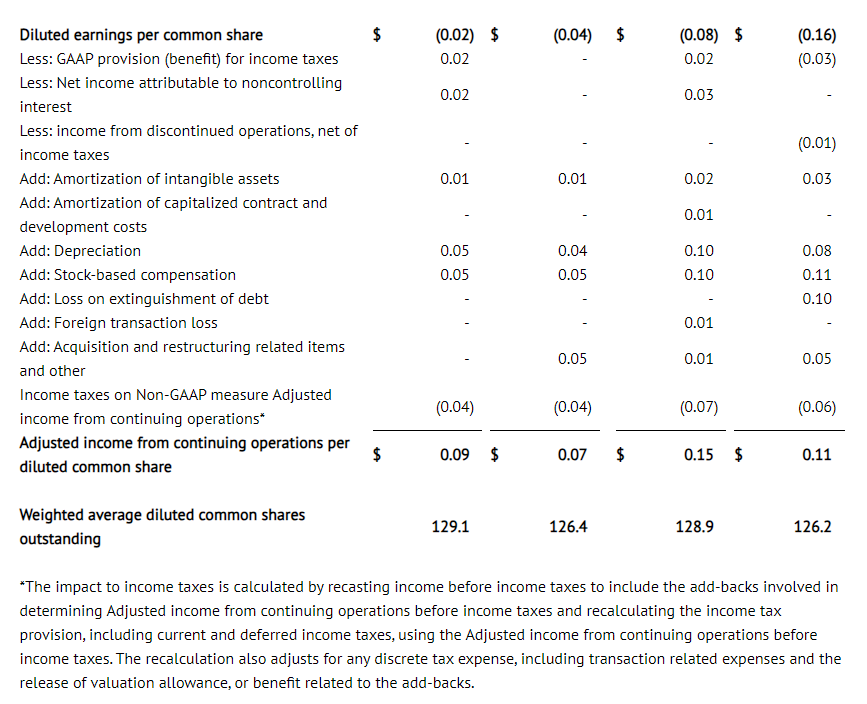

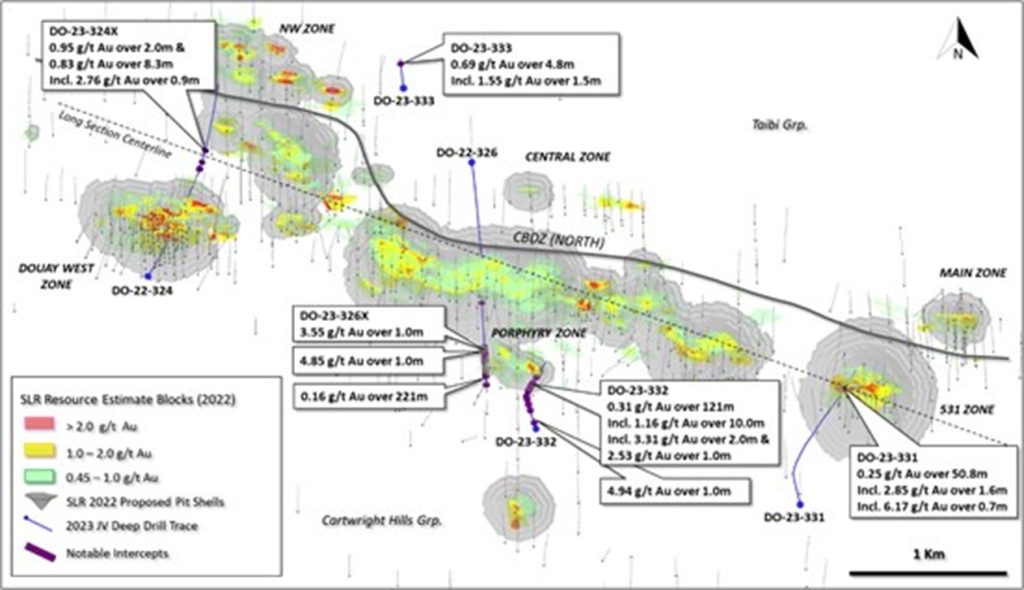
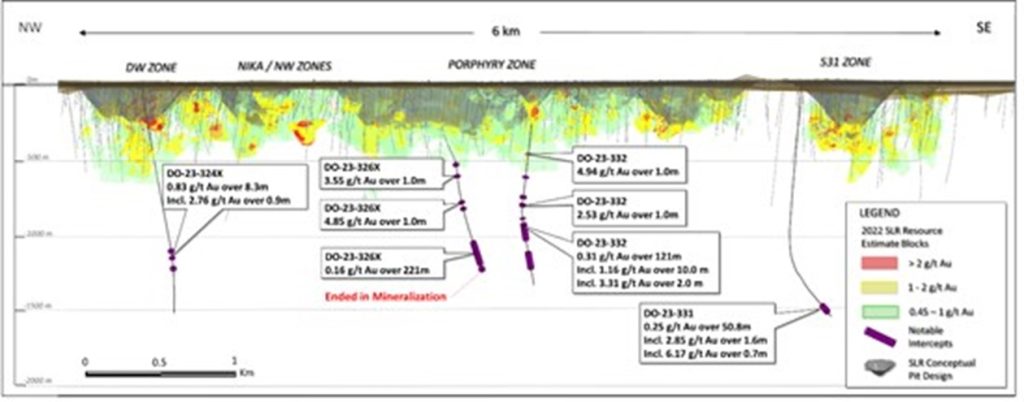
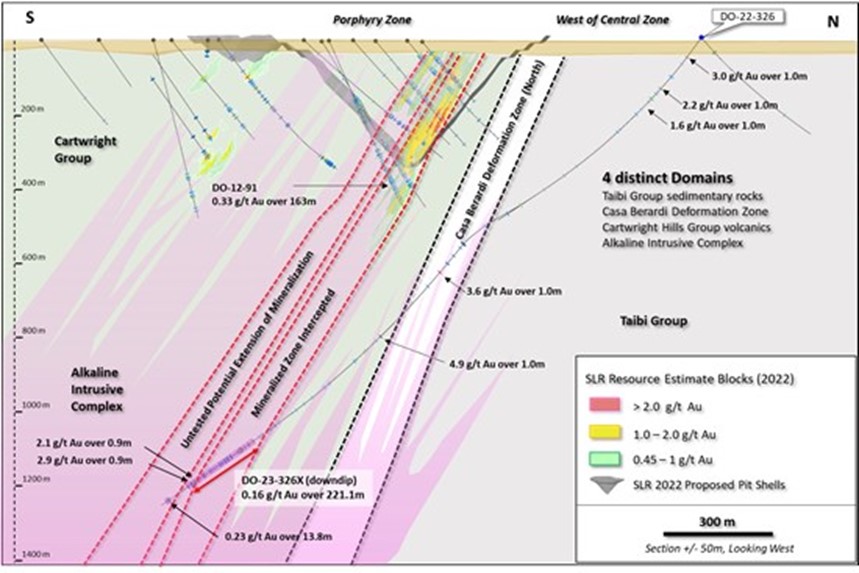