Largo has a long and successful history as one of the world’s preferred vanadium companies through the supply of its VPURE™ and VPURE+™ products, which are sourced from one of the world’s highest-grade vanadium deposits at the Company’s Maracás Menchen Mine in Brazil. Aiming to enhance value creation at Largo, the Company is in the process of implementing a titanium dioxide pigment plant using feedstock sourced from its existing operations in addition to advancing its U.S.-based clean energy division with its VCHARGE vanadium batteries. Largo’s VCHARGE vanadium batteries contain a variety of innovations, enabling an efficient, safe and ESG-aligned long duration solution that is fully recyclable at the end of its 25+ year lifespan. Producing some of the world’s highest quality vanadium, Largo’s strategic business plan is based on two pillars: 1.) leading vanadium supplier with an outlined growth plan and 2.) U.S.-based energy storage business support a low carbon future.
Michael Heim, Senior Vice President, Equity Research Analyst, Energy & Transportation, Noble Capital Markets, Inc.
Refer to the full report for the price target, fundamental analysis, and rating.
Largo reported 2023-1Q results generally in line with our recently-revised estimates. Revenues were a few million higher than expected, but so were operating costs, leading to operating income near expectations. Income tax expenses of $1.8 million on $0.7 million of pretax income were unexpected causing a $1.2 million net loss ($0.02 p/s) versus our expectations for breakeven results. We will seek clarification on the 268% tax rate during the upcoming conference call (5/11 at 1:00 pm EST, 1-416-764-8650).
Production and sales numbers lowered for the rest of the year. Management lowered annual production guidance to 9,000-11,000 tonnes from 11,000-13,000 tonnes. It also lowered sales to 8,700-10,700 tonnes from 10,300-11,300 tonnes and raised the upper range of its operating costs per unit sold projections. The declines were split across the second, third, and fourth quarters implying that the heavy rainfall in December that affected inventory may continue longer than expected. We have adjusted the numbers in our models to reflect updated guidance.
Equity Research is available at no cost to Registered users of Channelchek. Not a Member? Click ‘Join’ to join the Channelchek Community. There is no cost to register, and we never collect credit card information.
This Company Sponsored Research is provided by Noble Capital Markets, Inc., a FINRA and S.E.C. registered broker-dealer (B/D).
*Analyst certification and important disclosures included in the full report. NOTE: investment decisions should not be based upon the content of this research summary. Proper due diligence is required before making any investment decision.
Mark Reichman, Managing Director, Equity Research Analyst, Natural Resources, Noble Capital Markets, Inc.
Refer to the full report for the price target, fundamental analysis, and rating.
First quarter 2023 financial results. First quarter revenue totaled $187.3 million compared to $210.1 million in the prior period and $188.4 million in the first quarter of 2022. Coeur reported an adjusted first quarter loss of $33.1 million or $(0.11) per share compared to our first quarter loss estimate of $33.8 million or $(0.11) per share and the median loss estimate of $30.7 million or $(0.10) per share. On a GAAP basis, the first quarter loss was $24.6 million or $(0.08) per share. First quarter adjusted EBITDA amounted to $25.1 million. Free cash flow during the first quarter amounted to $(109.0) million, inclusive of capital expenditures totaling $74 million.
Guidance reaffirmed. First quarter gold and silver ounces produced were 69.0 thousand and 2.5 million, respectively, while gold and silver ounces sold were 70.9 thousand and 2.6 million. We had forecast gold and silver production of 69.2 thousand and 2.3 million ounces, respectively. Silver production at the Rochester mine was ahead of our estimate. Coeur reaffirmed its 2023 gold and silver production guidance of 320.0 to 370.0 thousand ounces and 10.0 to 12.0 million ounces, respectively. Production is weighted toward the second half of the year due to mine plan sequencing and the anticipated ramp-up and commissioning of the Rochester expansion. Operationally, we expect the third quarter to be the company’s strongest based on the Rochester mine’s production profile.
Equity Research is available at no cost to Registered users of Channelchek. Not a Member? Click ‘Join’ to join the Channelchek Community. There is no cost to register, and we never collect credit card information.
This Research is provided by Noble Capital Markets, Inc., a FINRA and S.E.C. registered broker-dealer (B/D).
*Analyst certification and important disclosures included in the full report. NOTE: investment decisions should not be based upon the content of this research summary. Proper due diligence is required before making any investment decision.
Alvopetro Energy Ltd.’s vision is to become a leading independent upstream and midstream operator in Brazil. Our strategy is to unlock the on-shore natural gas potential in the state of Bahia in Brazil, building off the development of our Caburé natural gas field and our strategic midstream infrastructure.
Michael Heim, Senior Vice President, Equity Research Analyst, Energy & Transportation, Noble Capital Markets, Inc.
Refer to the full report for the price target, fundamental analysis, and rating.
Production growth combined with price increases is leading to rising revenues. 2023-1Q production rose to 2,767 boepd (up 11% annually and 2% sequentially). Monthly production had been reported, so results were in line with expectations. Realized gas prices were $12.06/mcf (up 20% annually and 8% sequentially). A biannual price adjustment in February resulted in higher rates. This was also disclosed previously, so pricing was in line with our expectations. Energy sales revenues were $18.2 million slightly below our $18.8 million estimate due to lower-than-expected oil and NGL sales.
Top line growth is flowing through to the bottom line. The company reported record Funds Flow From Operations of $15.0 million versus $10.9 million for the same period last year and above our $11.4 million estimate. Net income was $12.8 million ($0.33 per diluted share) versus $15.1 million ($0.30) also above our $9.1 million ($0.24) estimate.
Equity Research is available at no cost to Registered users of Channelchek. Not a Member? Click ‘Join’ to join the Channelchek Community. There is no cost to register, and we never collect credit card information.
This Company Sponsored Research is provided by Noble Capital Markets, Inc., a FINRA and S.E.C. registered broker-dealer (B/D).
*Analyst certification and important disclosures included in the full report. NOTE: investment decisions should not be based upon the content of this research summary. Proper due diligence is required before making any investment decision.
What is Hydrogen, and Can it Really Become a Climate Change Solution?
As the United States and other countries react to achieve a goal of zero-carbon electricity generation by 2035, energy providers are swiftly ramping up renewable resources such as solar and wind. But because these technologies churn out electrons only when the sun shines and the wind blows, a backup from more reliable energy sources would prevent blackouts and brownouts. Currently, plants burning fossil fuels, primarily natural gas, fill in the gaps. Can we stop using fossil fuels now? – Paul Hoffman, Managing Editor, Channelchek
Hydrogen, or H₂, is getting a lot of attention lately as governments in the U.S., Canada and Europe push to cut their greenhouse gas emissions.
But what exactly is H₂, and is it really a clean power source?
I specialize in researching and developing H₂ production techniques. Here are some key facts about this versatile chemical that could play a much larger role in our lives in the future.
This article was republished with permission from The Conversation, a news site dedicated to sharing ideas from academic experts. It represents the research-based findings and thoughts of Hannes van der Watt, Research Assistant Professor, University of North Dakota.
So, What is Hydrogen?
Hydrogen is the most abundant element in the universe, but because it’s so reactive, it isn’t found on its own in nature. Instead, it is typically bound to other atoms and molecules in water, natural gas, coal and even biological matter like plants and human bodies.
Hydrogen can be isolated, however. And on its own, the H₂ molecule packs a heavy punch as a highly effective energy carrier.
It is already used in industry to manufacture ammonia, methanol and steel and in refining crude oil. As a fuel, it can store energy and reduce emissions from vehicles, including buses and cargo ships.
Hydrogen can also be used to generate electricity with lower greenhouse gas emissions than coal or natural gas power plants. That potential is getting more attention as the U.S. government proposes new rules that would require existing power plants to cut their carbon dioxide emissions.
Because it can be stored, H₂ could help overcome intermittency issues associated with renewable power sources like wind and solar. It can also be blended with natural gas in existing power plants to reduce the plant’s emissions.
Using hydrogen in power plants can reduce carbon dioxide emissions when either blended or alone in specialized turbines, or in fuel cells, which consume H₂ and oxygen, or O₂, to produce electricity, heat and water. But it’s typically not entirely CO₂-free. That’s in part because isolating H₂ from water or natural gas takes a lot of energy.
How is Hydrogen Produced?
There are a few common ways to produce H₂:
Electrolysis can isolate hydrogen by splitting water – H₂O – into H₂ and O₂ using an electric current.
Methane reforming uses steam to split methane, or CH₄, into H₂ and CO₂. Oxygen and steam or CO₂ can also be used for this splitting process.
Gasification transforms hydrocarbon-based materials – including biomass, coal or even municipal waste – into synthesis gas, an H₂-rich gas that can be used as a fuel either on its own or as a precursor for producing chemicals and liquid fuels.
Each has benefits and drawbacks.
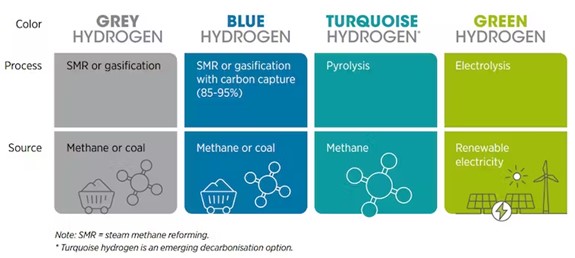
Green, Blue, Gray – What Do the Colors Mean?
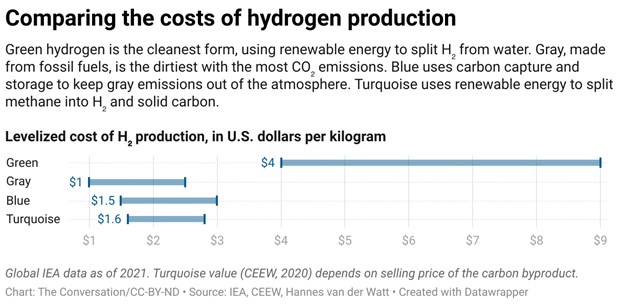
Hydrogen is often described by colors to indicate how clean, or CO₂-free, it is. The cleanest is green hydrogen.
Green H₂ is produced using electrolysis powered by renewable energy sources, such as wind, solar or hydropower. While green hydrogen is completely CO₂-free, it is costly, at around US$4-$9 per kilogram ($2-$4 per pound) because of the high energy required to split water.
The largest share of hydrogen today is made from natural gas, meaning methane, which is a potent greenhouse gas. IRENA (2020), Green Hydrogen: A guide to policymaking
Other less energy-intensive techniques can produce H₂ at a lower cost, but they still emit greenhouse gases.
Gray H₂ is the most common type of hydrogen. It is made from natural gas through methane reforming. This process releases carbon dioxide into the atmosphere and costs around $1-$2.50 per kilogram (50 cents-$1 per pound).
If gray hydrogen’s CO₂ emissions are captured and locked away so they aren’t released into the atmosphere, it can become blue hydrogen. The costs are higher, at around $1.50-$3 per kilogram (70 cents-$1.50 per pound) to produce, and greenhouse gas emissions can still escape when the natural gas is produced and transported.
Another alternative is turquoise hydrogen, produced using both renewable and nonrenewable resources. Renewable resources provide clean energy to convert methane – CH₄ – into H₂ and solid carbon, rather than that carbon dioxide that must be captured and stored. This type of pyrolysis technology is still new, and is estimated to cost between $1.60 and $2.80 per kilogram (70 cents-$1.30 per pound).
Can We Switch Off the Lights on Fossil Fuels Now?
Over 95% of the H₂ produced in the U.S. today is gray hydrogen made with natural gas, which still emits greenhouse gases.
Whether H₂ can ramp up as a natural gas alternative for the power industry and other uses, such as for transportation, heating and industrial processes, will depend on the availability of low-cost renewable energy for electrolysis to generate green H₂.
It will also depend on the development and expansion of pipelines and other infrastructure to efficiently store, transport and dispense H₂.
Without the infrastructure, H₂ use won’t grow quickly. It’s a modern-day version of “Which came first, the chicken or the egg?” Continued use of fossil fuels for H₂ production could spur investment in H₂ infrastructure, but using fossil fuels releases greenhouse gases.
What Does the Future Hold for Hydrogen?
Although green and blue hydrogen projects are emerging, they are small so far.
Policies like Europe’s greenhouse gas emissions limits and the 2022 U.S. Inflation Reduction Act, which offers tax credits up to $3 per kilogram ($1.36 per pound) of H₂, could help make cleaner hydrogen more competitive.
Hydrogen demand is projected to increase up to two to four times its current level by 2050. For that to be green H₂ would require significant amounts of renewable energy at the same time that new solar, wind and other renewable energy power plants are being built to provide electricity directly to the power sector.
While green hydrogen is a promising trend, it is not the only solution to meeting the world’s energy needs and carbon-free energy goals. A combination of renewable energy sources and clean H₂, including blue, green or turquoise, will likely be necessary to meet the world’s energy needs in a sustainable way.
Investors are always searching for the next great investment opportunity; one of the most fundamental factors in making an educated investment decision is determining if the market is undervaluing a specific stock. Valuing a stock involves analyzing various financial metrics and market conditions to determine the stock’s intrinsic value. This represents the true worth of the company, knowing it before others discover the value provides an investment edge and maybe above-average returns.
There are several key factors that investors should consider when valuing a stock. These include the P/E ratio (price/earnings), intrinsic value, GAAP earnings vs. adjusted earnings and other metrics and market expectations. When determining P/E and other ratios, variations that may come into play for a specific industry or economic environment are important measures as well. These could include industry comparisons of price/sales ratio, price/book ratio, and trends like industry grouping conditions improving or deteriorating.
Below we’ll look at many of the numbers that investors use as filters to create watch lists. The lists can then be used to weigh one opportunity against another based on market environments, demand trends, and competition.
P/E Ratio
The P/E ratio, or price-to-earnings ratio, is a commonly used metric for valuing stocks. It’s the ratio of a company’s stock price to its actual earnings per share (EPS). A high P/E ratio indicates that investors are paying a premium for the company’s continued earnings potential, while a low P/E ratio suggests that the company may be undervalued.
As an example, the price-to-earnings ratio (taking the latest closing price and dividing it by the most recent earnings per share) for Meta Platforms (META) as of May 10, 2023 is 23.95. That is to say that it each share is priced at almost 24 times earnings. By comparison, General Morors (GM) has a current P/E ratio of 5.11. This could indicate that the stability or growth potential of Meta (Facebook) is perceived by investors as greater than a traditional car company in an increasingly competitive environment – or that the value of one is not sustainable. This information gives the investor a foundation from which to make decisions.
Of course it is not that easy. It’s important to note that not all P/E ratios are created equal. The P/E ratio can be calculated using either GAAP (Generally Accepted Accounting Principles) earnings or adjusted earnings, which can have a significant impact on the valuation of a company. Non-GAAP financial measures exclude certain expenses. The exclusions include one-time expenses like restructuring charges, gains/losses from asset sales, and other non-operating items. The refined metric is often used by investors and analysts to assess a company’s earnings power excluding certain items that may not be representative of the company’s core business operations.
Variations of P/E Ratio
There are also several variations of the P/E ratio that investors should be aware of. The forward P/E ratio uses projected earnings instead of historical earnings to calculate the ratio, this can provide a more accurate picture of a company’s future valuation potential. Of course, this depends upon the accuracy of forecasts.
The trailing P/E ratio, on the other hand, uses historical earnings over the past 12 months to calculate the P/E ratio.
Price/Sales Ratio
The price/sales ratio is another valid measure of a stocks over or undervaluation. It represents the ratio of a company’s stock price to its sales per share. This ratio is particularly useful for valuing companies that have yet to turn a profit, as it focuses on the company’s revenue instead of its earnings.
Price/Book Ratio
The price/book ratio is a metric that compares a company’s stock price to its book value per share. Book value represents the total value of a company’s assets minus its liabilities, and it provides a measure of the company’s ability to earn per asset. A low price/book ratio may indicate that a company is efficient and undervalued, while a high price/book ratio may indicate that the company is overvalued.
Intrinsic Value
The intrinsic value of a stock represents its true worth based on the company’s underlying fundamentals, such as its revenue, earnings, and assets. Calculating intrinsic value can be a complex process that involves forecasts developed by analyzing financials, market trends, demand for product growth, and other relevant factors. The most common method for calculating intrinsic value is the discounted cash flow (DCF) method, this involves projecting a company’s future cash flows and discounting them back to their present value. Present valuing future cash flows results in what many use as the measure of intrinsic value of a company’s stock.
Business Conditions
It is always important to consider the overall business conditions when valuing a stock. This may be why GM has a much lower P/E than META. The growth in demand for tech is expected to continue to be greater than the growth in demand for cars. In other words, a company that is operating in a growing industry with strong demand may be more valuable than a company that is operating in a declining or increasingly competitive industry. Similarly, a company that is well-positioned to take advantage of new technologies or trends may be more valuable than a company that is lagging behind its competitors.
In all cases, it’s imperative that investors consider macroeconomic factors, such as interest rates, inflation, and geopolitical risks, that could impact the overall market conditions and the company’s performance.
Take Away
Self-directed investors typically have at their disposal a platform that can filter and sort through many criteria. This helps investors that are trying to determine if a stock is currently undervalued. The information that one pulls from these filters and ratio analysis is only as valid as its accuracy and completeness. But it can serve as a good starting point to avoid stocks that are currently overvalued and to uncover companies that are not getting the attention they need to have its stock trade at higher valuations.
An investor doesn’t have to be first to recognize an undervalued stock, but discovering it early and then hoping others follow may require an investor to look at companies not making headlines every week. The 6,000 small-cap stock names on Channelchek, complete with enough data to compare the ratios and other elements mentioned above, may be the only stock universe needed to help an investor create a watch list of potentially undervalued opportunities.
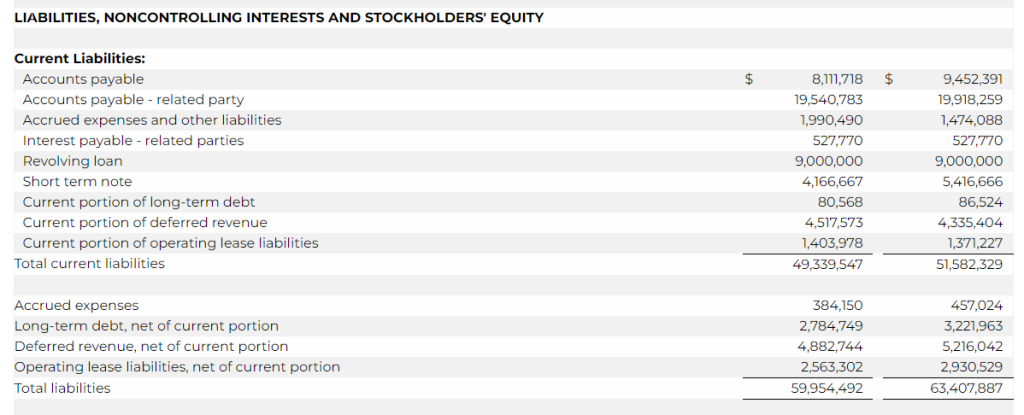
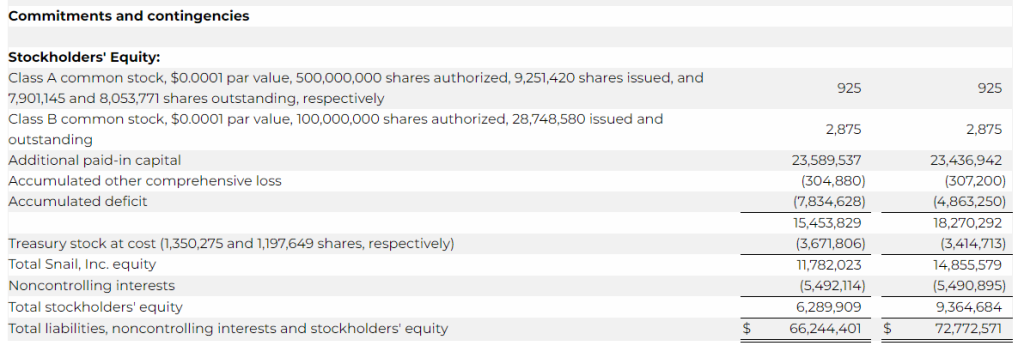
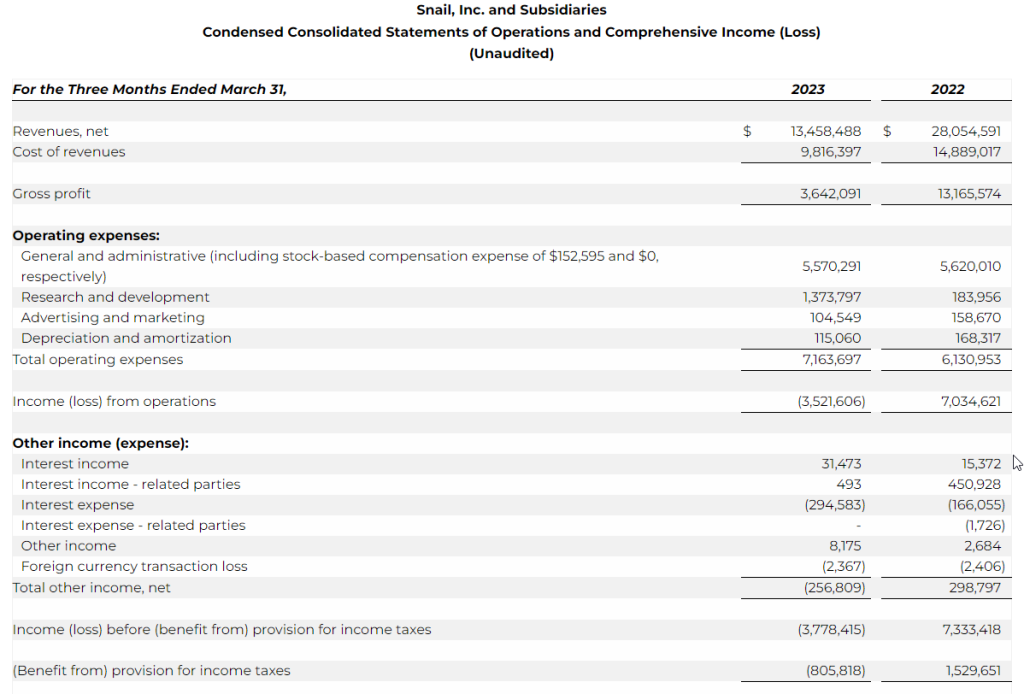
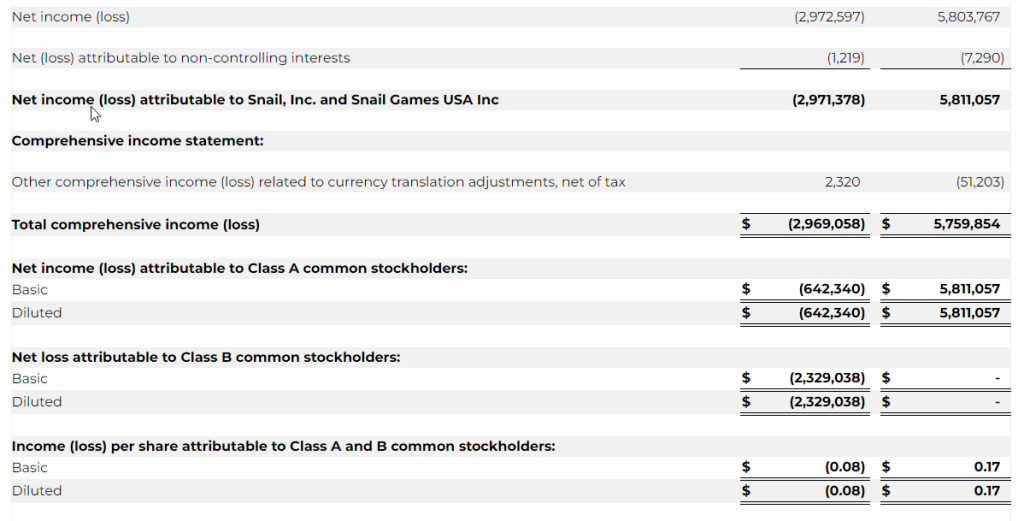
CULVER CITY, Calif., May 10, 2023 (GLOBE NEWSWIRE) — Snail, Inc. (Nasdaq: SNAL) (“Snail” or “the Company”), a leading, global independent developer and publisher of interactive digital entertainment, today announced financial results for the three months ended March 31, 2023.
Jim Tsai, Chief Executive Officer of Snail, commented: “We are thrilled by the ongoing engagement surrounding our ARK series. We have faced the challenging choice of postponing the release of ARK 2 until next year to ensure that we devote ample time to enhancing the game’s quality and providing an unparalleled gaming experience for our players.”
Tsai continued, “We have exciting plans to launch an expanded edition of the ARK series, which will undergo a remastering process using Unreal Engine 5. This remastered series will offer an extraordinary experience to both new and existing players, while also establishing a solid foundation for a successful launch of ARK 2.”
First Quarter 2023 and Subsequent Financial and Business Highlights
Revenue was $13.5 million for the three months ended March 31, 2023, compared to revenue of $28.1 million in the prior year period, representing a decrease of $14.6 million. The decrease in net revenues was due to a decrease in sales of ARK, attributable to a decrease in the average sales price per unit, and the recognition of additional revenue from deferred revenue and one-time payments related to contracts with certain platforms that did not repeat in the three months ended March 31, 2023. ARK sales decreased by $3.1 million, deferred revenue from contracts decreased by $2.5 million, and one-off contract payments decreased by $8.5 million. Sales of the Company’s smaller titles decreased by a collective $0.7 million. These decreases in the Company’s smaller titles were partially offset by $0.2 million in revenue related to West Hunt.
ARK: Survival Evolved. In the three months ended March 31, 2023, ARK: Survival Evolved averaged a total of 276,144 daily active users (“DAUs”) versus 257,168 DAUs in the prior year period.
ARK units sold increased for the first quarter 2023 compared to the same period last year; approximately 1.6 million vs. 1.2 million, respectively.
Through March 31, 2023, total playtime for the ARK franchise amounted to 3.2 billion hours.
The Company sold an additional 0.4 million units of its ARK franchise in the three-month period ended March 31, 2023, versus the prior year period, due to the increase in sales promotions offered by our platform partners during the period.
The Company expects to release ARK: Survival Ascended later this year. ARK: Survival Ascended is the entire base game of ARK: Survival Evolved, remastered with Unreal Engine 5 and expanded numerous times. It’ll feature The Island, Survival of the Fittest, and a collection of downloadable content (“DLC”) maps released over time.
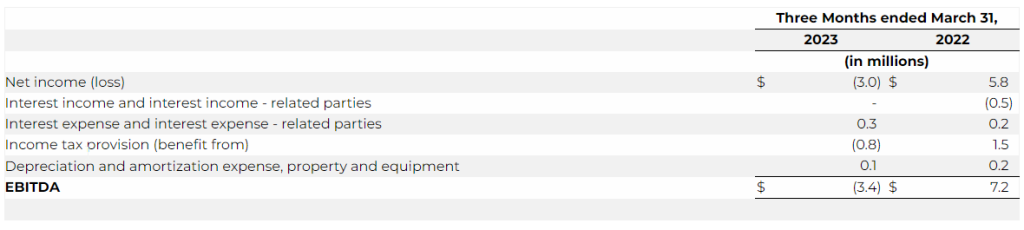
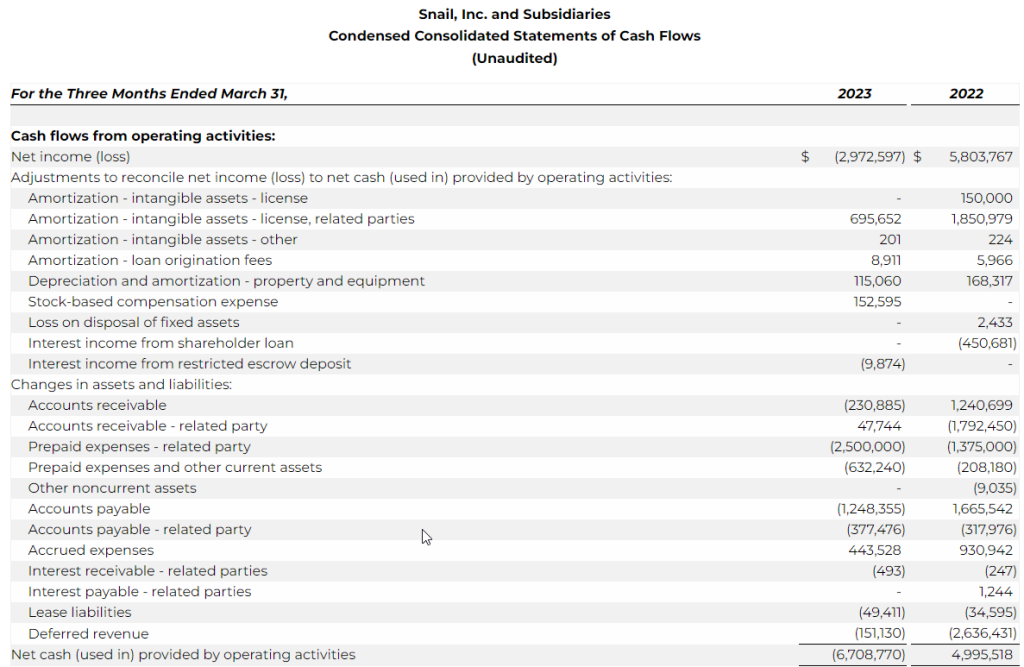
Net loss was $3.0 million for the three months ended March 31, 2023 as compared to a net income of $5.8 million for the three months ended March 31, 2022, representing a decrease of $8.8 million. The decrease was primarily due to a decrease in revenue of $14.6 million, an increase in research and development expense of $1.2 million, a net decrease in interest income – related parties of $0.5 million, an increase in interest expense of $0.1 million, offset by a decrease in royalties of $3.2 million, a decrease in license cost and license right amortization of $1.3 million, a decrease in merchant and engine fees of $0.5 million, and a decrease in the Company’s tax provision of $2.3 million.
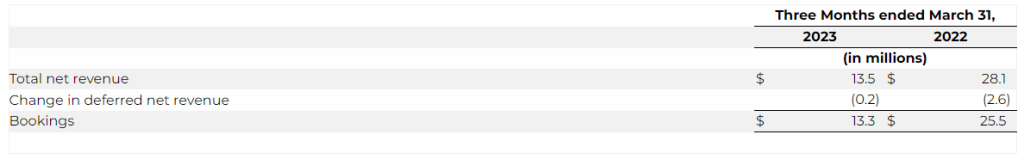
Bookings for the three months ended March 31, 2023 were $13.3 million, a decrease of $12.2 million, or 47.6%, compared to the three months ended March 31, 2022. The decrease was primarily the result of decreased ARK revenues in 2023 due to the factors mentioned above.
Earnings before interest, taxes, depreciation and amortization (“EBITDA”) for the first quarter of 2023 was a loss of $3.4 million compared to a gain of $7.2 million in the prior year period.
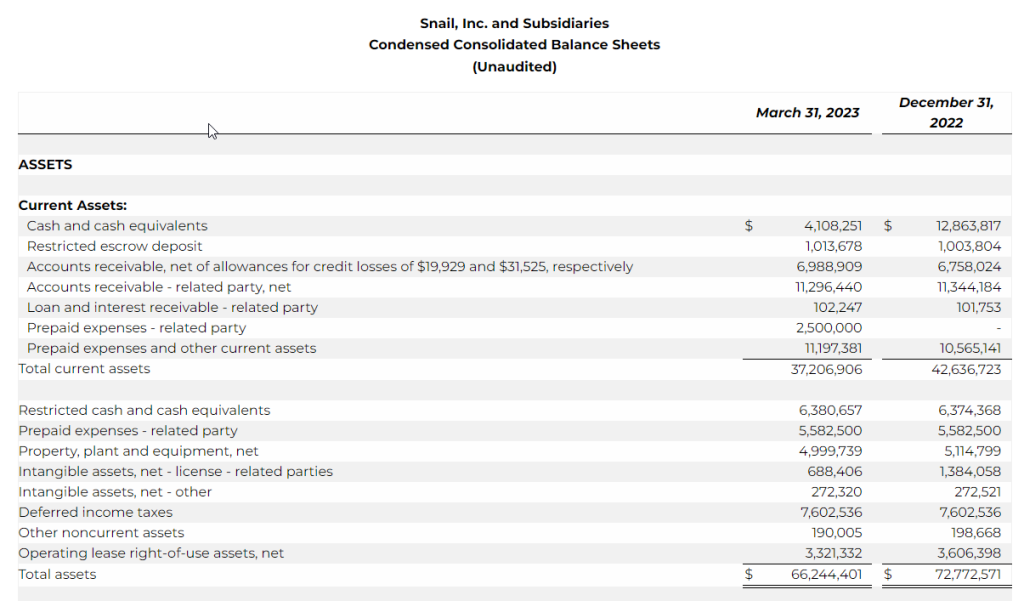
As of March 31, 2023, unrestricted cash was $4.1 million versus $12.9 million as of December 31, 2022.
Use of Non-GAAP Financial Measures
In addition to the financial results determined in accordance with U.S. generally accepted accounting principles, or GAAP, Snail believes Bookings and EBITDA, as non-GAAP measures, are useful in evaluating its operating performance. Bookings and EBITDA are non-GAAP financial measures that are presented as supplemental disclosures and should not be construed as alternatives to net income (loss) or revenue as indicators of operating performance, nor as alternatives to cash flow provided by operating activities as measures of liquidity, both as determined in accordance with GAAP. Snail supplementally presents Bookings and EBITDA because they are key operating measures used by management to assess financial performance. Bookings adjusts for the impact of deferrals and, Snail believes, provides a useful indicator of sales in a given period. EBITDA adjusts for items that Snail believes do not reflect the ongoing operating performance of its business, such as certain non-cash items, unusual or infrequent items or items that change from period to period without any material relevance to its operating performance. Management believes Bookings and EBITDA are useful to investors and analysts in highlighting trends in Snail’s operating performance, while other measures can differ significantly depending on long-term strategic decisions regarding capital structure, the tax jurisdictions in which Snail operates and capital investments.
Bookings is defined as the net amount of products and services sold digitally or physically in the period. Bookings is equal to revenues excluding the impact from deferrals. Below is a reconciliation of total net revenue to Bookings, the closest GAAP financial measure.
We define EBITDA as net income (loss) before (i) interest expense, (ii) interest income, (iii) income tax provision (benefit from) and (iv) depreciation and amortization expense. The following table provides a reconciliation from net income (loss) to EBITDA:
Webcast Details
The Company will host a webcast at 5:00 PM ET today to discuss the first quarter 2023 financial results. Participants may access the live webcast and replay on the Company’s investor relations website at https://investor.snail.com/. The earnings call may also be accessed by dialling 1 (877) 451-6152 from the United States, or by dialling 1 (201) 389-0879 internationally.
About Snail, Inc.
Snail is a leading, global independent developer and publisher of interactive digital entertainment for consumers around the world, with a premier portfolio of premium games designed for use on a variety of platforms, including consoles, PCs and mobile devices.
Forward-Looking Statements This press release contains statements that constitute forward-looking statements. Many of the forward-looking statements contained in this press release can be identified by the use of forward-looking words such as “anticipate,” “believe,” “could,” “expect,” “should,” “plan,” “intend,” “may,” “predict,” “continue,” “estimate” and “potential,” or the negative of these terms or other similar expressions. Forward-looking statements appear in a number of places in this press release and include, but are not limited to, statements regarding Snail’s intent, belief or current expectations. These forward-looking statements include information about possible or assumed future results of Snail’s business, financial condition, results of operations, liquidity, plans and objectives. The statements Snail makes regarding the following matters are forward-looking by their nature: growth prospects and strategies; launching new games and additional functionality to games that are commercially successful; expectations regarding significant drivers of future growth; its ability to retain and increase its player base and develop new video games and enhance existing games; competition from companies in a number of industries, including other casual game developers and publishers and both large and small, public and private Internet companies; its ability to attract and retain a qualified management team and other team members while controlling its labor costs; its relationships with third-party platforms such as Xbox Live and Game Pass, PlayStation Network, Steam, Epic Games Store, My Nintendo Store, the Apple App Store, the Google Play Store and the Amazon Appstore; the size of addressable markets, market share and market trends; its ability to successfully enter new markets and manage international expansion; protecting and developing its brand and intellectual property portfolio; costs associated with defending intellectual property infringement and other claims; future business development, results of operations and financial condition; the ongoing conflict involving Russia and Ukraine on its business and the global economy generally; rulings by courts or other governmental authorities; the Share Repurchase Program, including expectations regarding the timing and manner of repurchases made under the program; its plans to pursue and successfully integrate strategic acquisitions; assumptions underlying any of the foregoing.
Further information on risks, uncertainties and other factors that could affect Snail’s financial results are included in its filings with the Securities and Exchange Commission (the “SEC”) from time to time, annual reports on Forms 10-K and quarterly reports on 10-Q filed, or to be filed, with the SEC. You should not rely on these forward-looking statements, as actual outcomes and results may differ materially from those expressed or implied in the forward-looking statements as a result of such risks and uncertainties. All forward-looking statements in this press release are based on management’s beliefs and assumptions and on information currently available to Snail, and Snail does not assume any obligation to update the forward-looking statements provided to reflect events that occur or circumstances that exist after the date on which they were made.
CULVER CITY, Calif., May 09, 2023 (GLOBE NEWSWIRE) — Snail, Inc. (Nasdaq: SNAL), a leading, global independent developer and publisher of interactive digital entertainment, announced today that it will report financial results for the first quarter ended March 31, 2023 on Wednesday, May 10, 2023, after the U.S. stock market closes. Management will host a conference call and webcast on the same day at 5:00 p.m. ET to discuss the results.
Participants may access the live webcast and replay on the Company’s investor relations website at https://investor.snail.com/. The earnings call may also be accessed by dialing 1 (877) 451-6152 from the United States, or by dialing 1 (201) 389-0879 internationally.
About Snail, Inc. Snail is a leading, global independent developer and publisher of interactive digital entertainment for consumers around the world, with a premier portfolio of premium games designed for use on a variety of platforms, including consoles, PCs, and mobile devices.
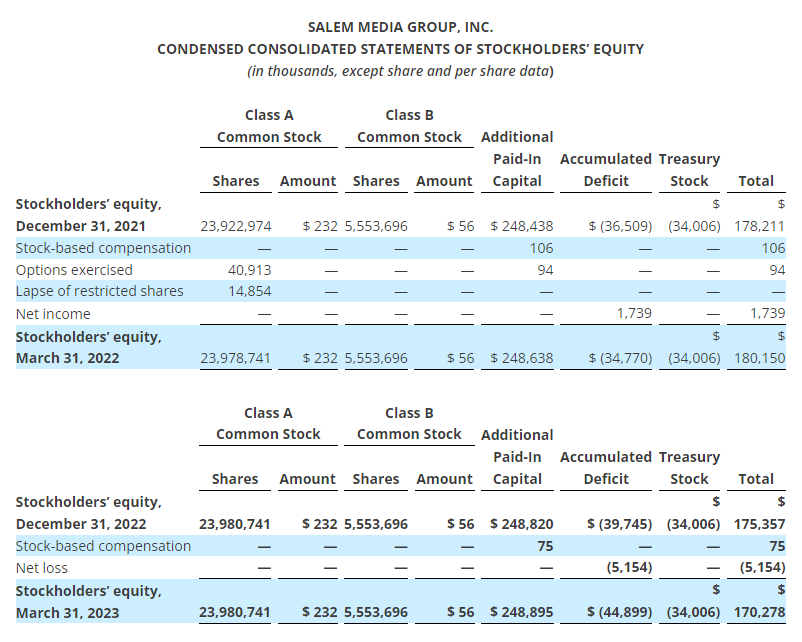
IRVING, Texas–(BUSINESS WIRE)– Salem Media Group, Inc. (the “company”)(NASDAQ: SALM) released its results for the three months ended March 31, 2023.
First Quarter 2023 Results
For the three months ended March 31, 2023 compared to the three months ended March 31, 2022:
Consolidated
Total revenue increased 1.4% to $63.5 million from $62.6 million;
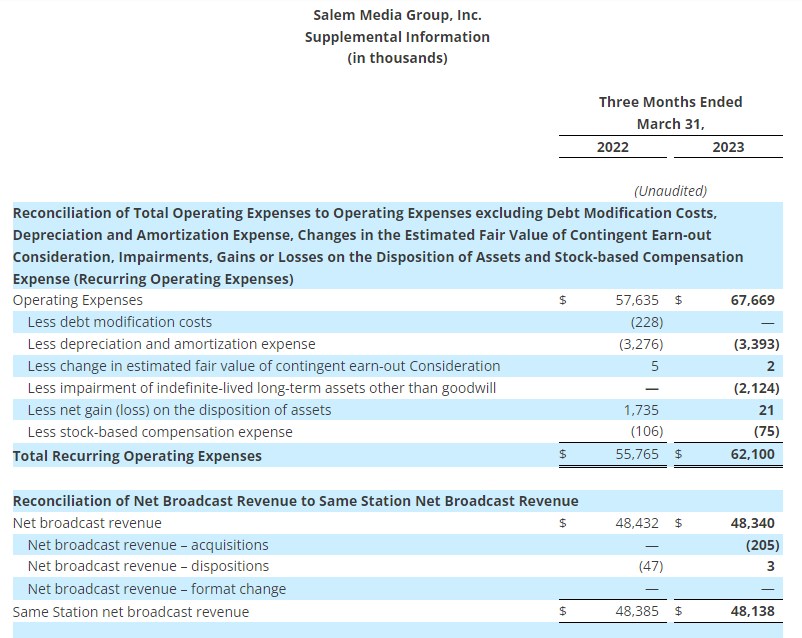
Total operating expenses increased 17.4% to $67.7 million from $57.6 million;
Operating expenses, excluding stock-based compensation expense, debt modification costs, gains and losses on the sale or disposition of assets, impairments, depreciation expense and amortization expense (1) increased 11.4% to $62.1 million from $55.8 million;
The company had an operating loss of $4.2 million as compared to operating income of $5.0 million;
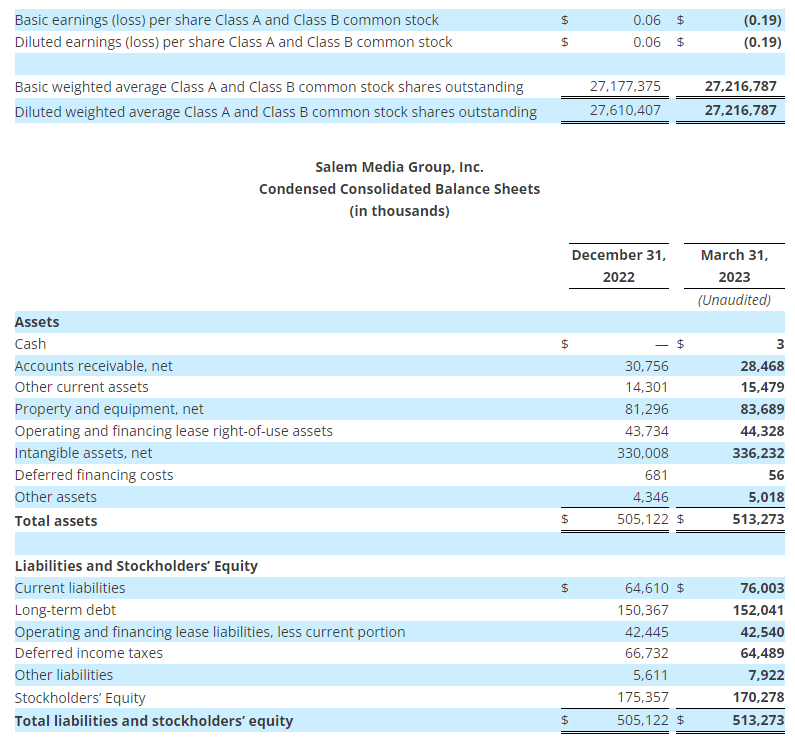
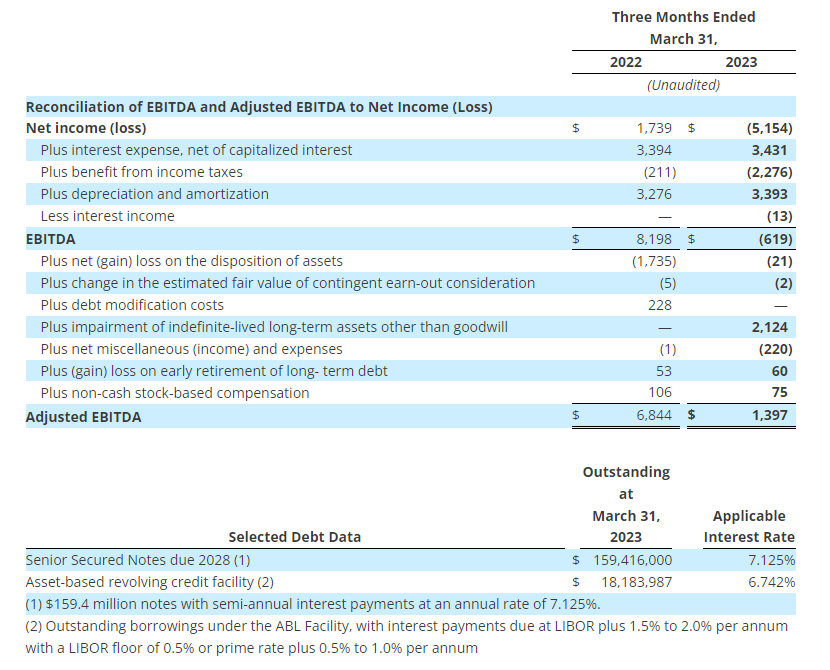
The company had a net loss of $5.2 million, or $0.19 net loss per share, compared to net income of $1.7 million, or $0.06 net income per diluted share;
EBITDA (1) decreased 107.6% to $(0.6) million from $8.2 million; and
Adjusted EBITDA (1) decreased 79.6% to $1.4 million from $6.8 million.
Broadcast
Net broadcast revenue decreased 0.2% to $48.3 million from $48.4 million;
Station Operating Income (“SOI”) (1) decreased 46.4% to $5.5 million from $10.3 million;
Same Station (1) net broadcast revenue decreased 0.5% to $48.1 million from $48.4 million; and
Same Station SOI (1) decreased 41.6% to $6.0 million from $10.3 million.
Digital Media
Digital media revenue increased 2.0% to $10.5 million from $10.3 million; and
Digital Media Operating Income (1) decreased 17.0% to $1.5 million from $1.8 million.
Publishing
Publishing revenue increased 19.7% to $4.6 million from $3.9 million; and
Publishing Operating Loss (1) increased 24.9% to $0.7 million from $0.6 million.
Included in the results for the three months ended March 31, 2023 are:
A $2.1 million ($1.6 million, net of tax, or $0.06 per share) impairment charge to the value of broadcast license related to the acquisition of radio station WMYM-AM in Miami, Florida;
A $0.1 million loss on the early retirement of long-term debt associated with the 2024 Notes; and
A $0.1 million non-cash compensation charge related to the expensing of stock options.
Included in the results for the three months ended March 31, 2022 are:
A $1.7 million ($1.3 million, net of tax, or $0.05 per diluted share) net gain on the disposition of assets related primarily to the gain on sale of land in Phoenix, Arizona offset by various fixed asset disposals; and
A $0.2 million ($0.2 million, net of tax, or $0.01 per share) charge for debt modification costs; and
A $0.1 million non-cash compensation charge ($0.1 million, net of tax) related to the expensing of stock options.
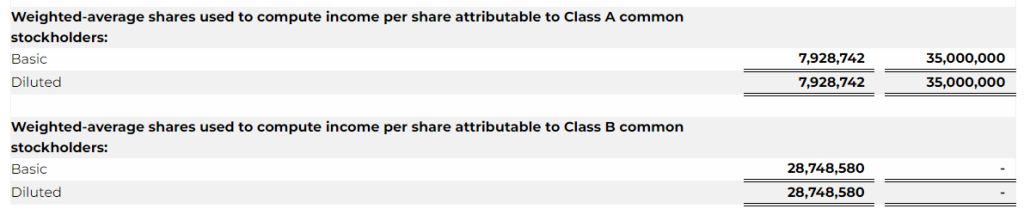
Per share numbers are calculated based on 27,216,787 diluted weighted average shares for the three months ended March 31, 2023, and 27,610,407 diluted weighted average shares for the three months ended March 31, 2022.
Balance Sheet
As of March 31, 2023, the company had $159.4 million outstanding on the 7.125% senior secured notes due 2028 (“2028 Notes”) and $18.2 million outstanding on the ABL facility.
Acquisitions and Divestitures
The following transactions were completed since January 1, 2023:
The company invested $1.5 million in a limited liability company that will own, distribute, and market a motion picture.
On March 24, 2023, the company closed on the acquisition of Digital Felt Productions and its digital content library for $25,000 in cash.
On February 1, 2023, the company acquired the George Gilder Report and other digital newsletters and related website assets. The company assumed the deferred subscription liabilities paying no cash at the time of closing. The purchase price is 25% of net revenue generated from sales of most Eagle Financial products during the next year to subscribers who are on George Gilder subscriber lists that are not already on Eagle Financial lists.
On January 10, 2023, the company closed on the acquisition of radio stations WWFE-AM, WRHC-AM and two FM translators in Miami, Florida for $3.0 million in cash. The Asset Purchase Agreement (“APA”) was amended for the company to acquire only the radio stations and translators for $3.0 million, a related party to acquire the land directly from the seller for $2.0 million, and the company to have an option to purchase the land from the related party pursuant to an option to purchase real estate agreement. The company’s executive officers, who have no relationship with the related party, began negotiations for the related party lease agreements and option agreements, subject to final approval by the company’s Audit Committee pursuant to its related party transaction policy. The option to purchase real estate agreement was approved by the company’s Audit Committee on March 1, 2023.
On January 6, 2023 the company closed on the acquisition of radio station WMYM-AM and an FM translator in Miami, Florida for $3.2 million in cash. The company began operating the radio station under a Time Brokerage Agreement (“TBA”) beginning on November 16, 2022. The APA was amended for the company to acquire only the radio station and translator for $3.2 million, a related party to acquire the land directly from the seller for $1.8 million, and the company to have an option to purchase the land from the related party pursuant to an option to purchase real estate agreement. The company’s executive officers, who have no relationship with the related party, began negotiations for the related party lease agreements and option agreements, subject to final approval by the company’s Audit Committee pursuant to its related party transaction policy. The option to purchase real estate agreement was approved by the company’s Audit Committee on March 1, 2023.
Pending transactions:
In June 2022 the company entered into agreements to sell radio stations KLFE-AM and KNTS-AM in Seattle, Washington for $0.7 million subject to approval of the Federal Communications Commission. Radio station KLFE-AM is being programmed under a TBA as of August 1, 2022.
Conference Call Information
The company will host a teleconference to discuss its results on May 9, 2023 at 4:00 p.m. Central Time. To access the teleconference, please dial (888) 770-7291, and then ask to be joined into the Salem Media Group First Quarter 2023 call or listen via the investor relations portion of the company’s website, located at investor.salemmedia.com. A replay of the teleconference will be available through May 23, 2023 and can be heard by dialing (800) 770-2030, passcode 2413416 or on the investor relations portion of the company’s website, located at investor.salemmedia.com.
Follow us on Twitter @SalemMediaGrp.
Second Quarter 2023 Outlook
For the second quarter of 2023, the company is projecting total revenue to decline between 5% and 7% from the second quarter 2022 total revenue of $68.7 million. The company is also projecting operating expenses before gains or losses on the sale or disposal of assets, stock-based compensation expense, legal settlement, changes in the estimated fair value of contingent earn-out consideration, impairments, depreciation expense and amortization expense (“Recurring Operating Expenses”) to increase between 3% and 6% compared to the second quarter of 2022 Recurring Operating Expenses of $60.0 million.
A reconciliation of Recurring Operating Expenses (a non-GAAP measure) to the most directly comparable GAAP measure is not available without unreasonable efforts on a forward-looking basis due to the potential high variability, complexity and low visibility with respect to the charges excluded from this non-GAAP financial measure, in particular, the change in the estimated fair value of earn-out consideration, impairments and gains or losses from the disposition of fixed assets. The company expects the variability of the above charges may have a significant, and potentially unpredictable, impact on its future GAAP financial results.
About Salem Media Group, Inc.
Salem Media Group is America’s leading multimedia company specializing in Christian and conservative content, with media properties comprising radio, digital media and book and newsletter publishing. Each day Salem serves a loyal and dedicated audience of listeners and readers numbering in the millions nationally. With its unique programming focus, Salem provides compelling content, fresh commentary and relevant information from some of the most respected figures across the Christian and conservative media landscape. Learn more about Salem Media Group, Inc. at www.salemmedia.com, Facebook and Twitter.
Forward-Looking Statements
Statements used in this press release that relate to future plans, events, financial results, prospects or performance are forward-looking statements as defined under the Private Securities Litigation Reform Act of 1995. Actual results may differ materially from those anticipated as a result of certain risks and uncertainties, including but not limited to the ability of the company to close and integrate announced transactions, market acceptance of the company’s radio station formats, competition from new technologies, inflation and other adverse economic conditions, and other risks and uncertainties detailed from time to time in the company’s reports on Forms 10-K, 10-Q, 8-K and other filings filed with or furnished to the Securities and Exchange Commission. Readers are cautioned not to place undue reliance on these forward-looking statements, which speak only as of the date hereof. The company undertakes no obligation to update or revise any forward-looking statements to reflect new information, changed circumstances or unanticipated events.
(1) Regulation G
Management uses certain non-GAAP financial measures defined below in communications with investors, analysts, rating agencies, banks and others to assist such parties in understanding the impact of various items on its financial statements. The company uses these non-GAAP financial measures to evaluate financial results, develop budgets, manage expenditures and as a measure of performance under compensation programs.
The company’s presentation of these non-GAAP financial measures should not be considered as a substitute for or superior to the most directly comparable financial measures as reported in accordance with GAAP.
Regulation G defines and prescribes the conditions under which certain non-GAAP financial information may be presented in this earnings release. The company closely monitors EBITDA, Adjusted EBITDA, Station Operating Income (“SOI”), Same Station net broadcast revenue, Same Station broadcast operating expenses, Same Station Operating Income, Digital Media Operating Income, Publishing Operating Loss, and operating expenses excluding gains or losses on the disposition of assets, stock-based compensation, changes in the estimated fair value of contingent earn-out consideration, impairments, depreciation and amortization, all of which are non-GAAP financial measures. The company believes that these non-GAAP financial measures provide useful information about its core operating results, and thus, are appropriate to enhance the overall understanding of its financial performance. These non-GAAP financial measures are intended to provide management and investors a more complete understanding of its underlying operational results, trends and performance.
The company defines Station Operating Income (“SOI”) as net broadcast revenue minus broadcast operating expenses. The company defines Digital Media Operating Income as net Digital Media Revenue minus Digital Media Operating Expenses. The company defines Publishing Operating Loss as net Publishing Revenue minus Publishing Operating Expenses. The company defines EBITDA as net income before interest, taxes, depreciation, and amortization. The company defines Adjusted EBITDA as EBITDA before gains or losses on the disposition of assets, before debt modification costs, before changes in the estimated fair value of contingent earn-out consideration, before impairments, before net miscellaneous income and expenses, before (gain) loss on early retirement of long-term debt and before non-cash compensation expense. SOI, Digital Media Operating Income, Publishing Operating Loss, EBITDA and Adjusted EBITDA are commonly used by the broadcast and media industry as important measures of performance and are used by investors and analysts who report on the industry to provide meaningful comparisons between broadcasters. SOI, Digital Media Operating Income, Publishing Operating Loss, EBITDA and Adjusted EBITDA are not measures of liquidity or of performance in accordance with GAAP and should be viewed as a supplement to and not a substitute for or superior to its results of operations and financial condition presented in accordance with GAAP. The company’s definitions of SOI, Digital Media Operating Income, Publishing Operating Loss, EBITDA and Adjusted EBITDA are not necessarily comparable to similarly titled measures reported by other companies.
The company defines Same Station net broadcast revenue as broadcast revenue from its radio stations and networks that the company owns or operates in the same format on the first and last day of each quarter, as well as the corresponding quarter of the prior year. The company defines Same Station broadcast operating expenses as broadcast operating expenses from its radio stations and networks that the company owns or operates in the same format on the first and last day of each quarter, as well as the corresponding quarter of the prior year. The company defines Same Station SOI as Same Station net broadcast revenue less Same Station broadcast operating expenses. Same Station operating results include those stations that the company owns or operates in the same format on the first and last day of each quarter, as well as the corresponding quarter of the prior year. Same Station operating results for a full calendar year are calculated as the sum of the Same Station operating results for each of the four quarters of that year. The company uses Same Station operating results, a non-GAAP financial measure, both in presenting its results to stockholders and the investment community, and in its internal evaluations and management of the business. The company believes that Same Station operating results provide a meaningful comparison of period over period performance of its core broadcast operations as this measure excludes the impact of new stations, the impact of stations the company no longer owns or operates, and the impact of stations operating under a new programming format. The company’s presentation of Same Station operating results is not intended to be considered in isolation or as a substitute for the financial information prepared and presented in accordance with GAAP. The company’s definition of Same Station operating results is not necessarily comparable to similarly titled measures reported by other companies.
For all non-GAAP financial measures, investors should consider the limitations associated with these metrics, including the potential lack of comparability of these measures from one company to another.
The Supplemental Information tables that follow the condensed consolidated financial statements provide reconciliations of the non-GAAP financial measures that the company uses in this earnings release to the most directly comparable measures calculated in accordance with GAAP. The company uses non-GAAP financial measures to evaluate financial performance, develop budgets, manage expenditures, and determine employee compensation. The company’s presentation of this additional information is not to be considered as a substitute for or superior to the directly comparable measures as reported in accordance with GAAP.
The company defines EBITDA (1) as net income before interest, taxes, depreciation, and amortization. The table below presents a reconciliation of EBITDA (1) to Net Income (Loss), the most directly comparable GAAP measure. EBITDA (1) is a non-GAAP financial performance measure that is not to be considered a substitute for or superior to the directly comparable measures reported in accordance with GAAP. The company defines Adjusted EBITDA (1) as EBITDA (1) before gains or losses on the disposition of assets,before debt modification costs, before changes in the estimated fair value of contingent earn-out consideration, before impairments, before net miscellaneous income and expenses, before (gain) loss on early retirement of long-term debt, and before non-cash compensation expense. The table below presents a reconciliation of Adjusted EBITDA (1) to Net Income (Loss), the most directly comparable GAAP measure. Adjusted EBITDA (1) is a non-GAAP financial performance measure that is not to be considered a substitute for or superior to the directly comparable measures reported in accordance with GAAP.
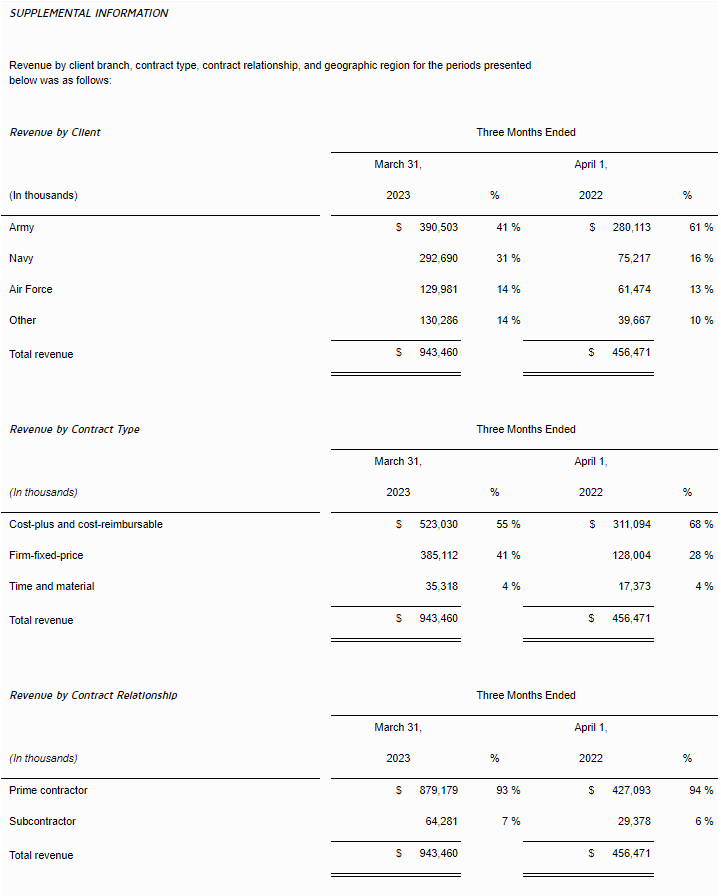
Revenue of $943.5 million, up 12.0% y/y on a pro forma basis
Continued expansion in the Pacific driving strong revenue growth of ~300% y/y
Awarded new contracts valued at ~$600 million and secured ~$250 million in recompetes
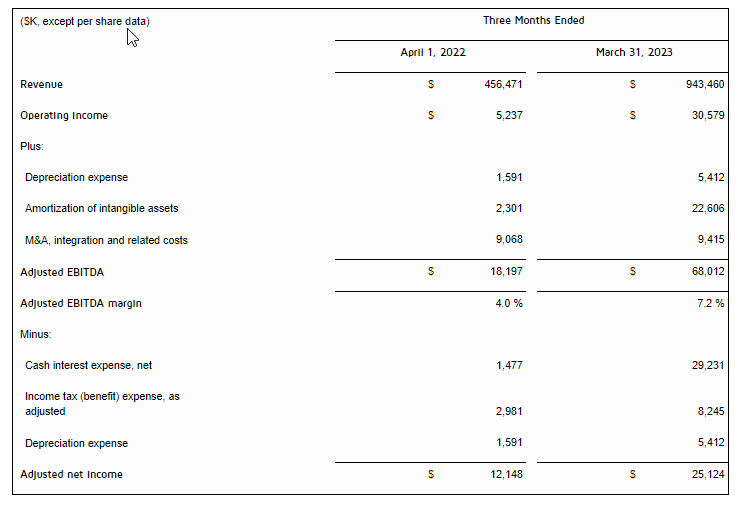
Reported operating income of $30.6 million; adjusted operating income1 of $62.6 million
Adjusted EBITDA1 of $68.0 million with a margin1 of 7.2%
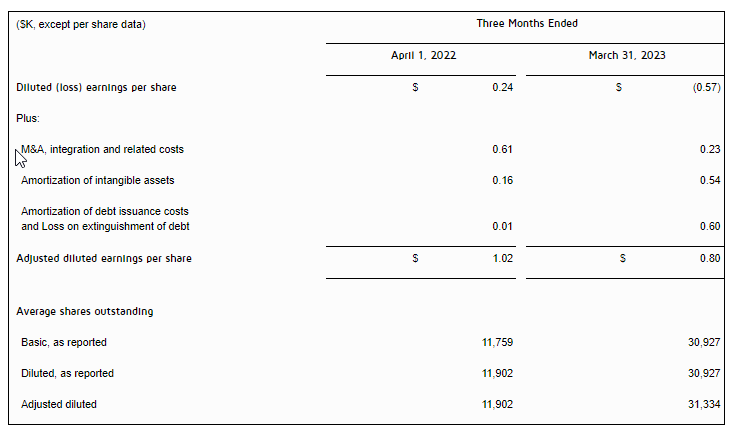
Diluted EPS of ($0.57); adjusted diluted EPS1 of $0.80
2023 Guidance:
Reiterating full-year 2023 guidance
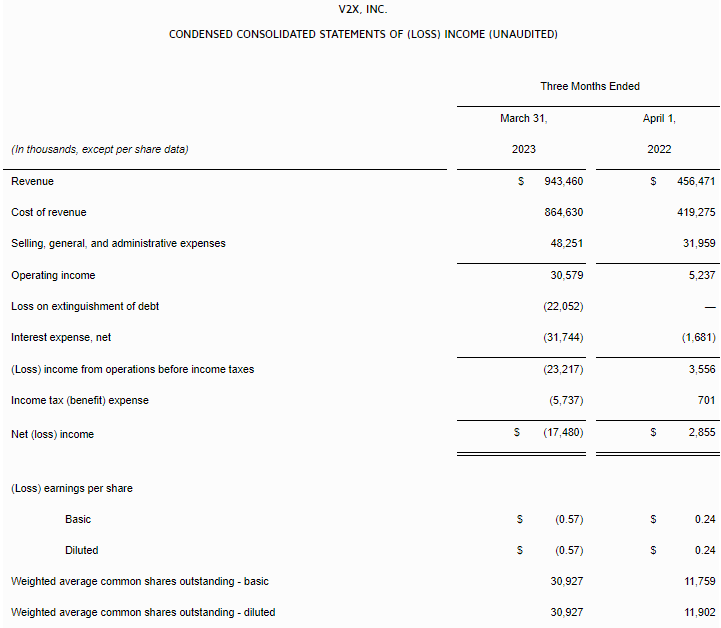
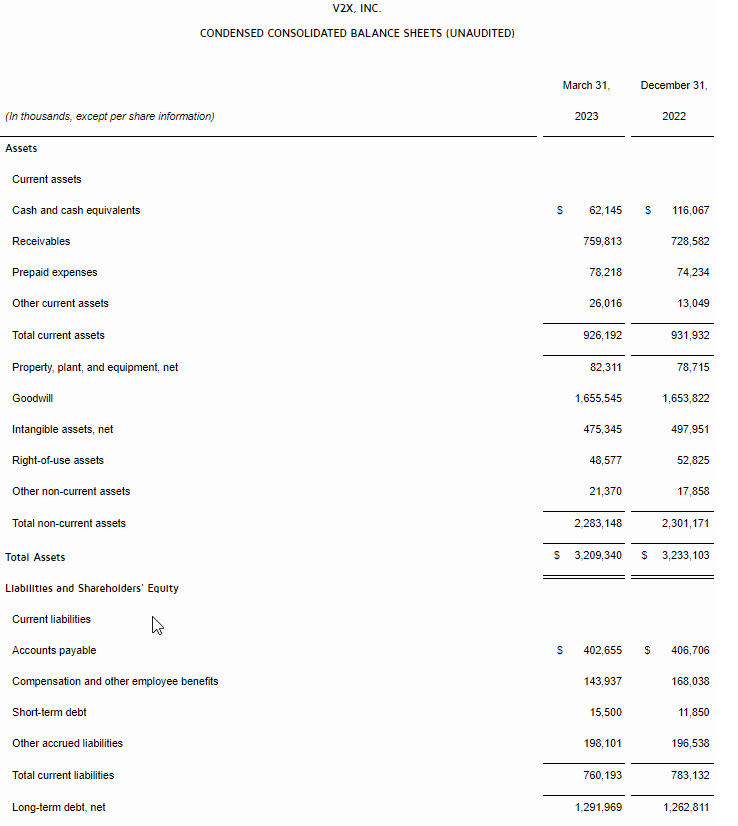
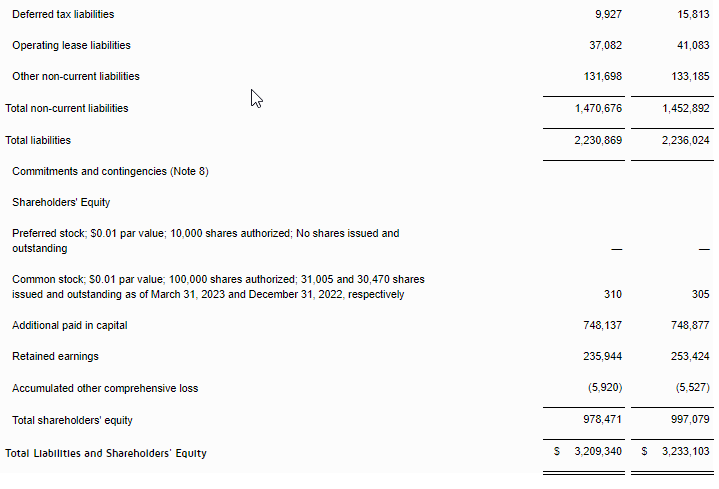
MCLEAN, Va., May 9, 2023 /PRNewswire/ — V2X, Inc. (NYSE:VVX) announced first quarter 2023 financial results.
“V2X reported an excellent start to the year with revenue increasing 12.0% year-over-year, on a pro forma basis during the first quarter,” said Chuck Prow, President and Chief Executive Officer of V2X. “Adjusted EBITDA for the quarter was $68.0 million or a 7.2% margin and reflects a benefit from strong revenue volume and program productivity. The pace of award activity is improving and was exemplified by approximately $600 million in new business awarded to V2X. With over $4 billion in bids under evaluation and a robust backlog of ~$12 billion, the outlook for V2X remains solid.”
“Revenue growth in the quarter was generated by continued expansion on existing programs, contribution from new awards, as well as success in securing recompete wins late last year and in early 2023,” said Mr. Prow. “Our teams continued to drive momentum with several notable wins in the quarter. This has been achieved while successfully expanding on our core programs. Importantly, we continue to experience significant growth in the Pacific or INDOPACOM, with our presence and footprint in the region proving to be a key channel to support increasing mission requirements.”
Mr. Prow continued, “Our growth activities during the quarter were robust. In March, we were awarded two strategically important new business contracts. Firstly, we were the successful bidder on the Naval Test Wing Pacific contract valued at $440 million over seven years, which further builds on the services V2X is providing under the $880 million Naval Test Wing Atlantic program. This effort to support the critical test and evaluation activities performed by the Naval Test Wing Pacific leveraged V2X’s proprietary and innovative technology-based solution, AMMO®, and demonstrates our commitment to maintaining high levels of mission readiness. We are honored to be selected to support the Navy’s preeminent organization for flight testing and flight test support of the latest systems. Secondly, V2X was also awarded a three-year, approximately $100 million contract to provide critical cybersecurity support services to a government client. This is a key win for V2X in the cyber and IT support domain and leverages our core mission of intersecting our technology and operations capabilities.”
“In addition, during the first quarter, we were awarded over $250 million in recompetes,” said Mr. Prow. “This includes a five-year, $142 million contract with Naval Air Systems Command (NAVAIR) PMA 281 in support of mission planning systems. PMA-281 is responsible for the acquisition and life cycle management of a range of mission planning, control system and execution tools that are developed and integrated in partnership with other services, and foreign nation partners. This recompete win with the Navy represents successful execution on this deliberate client engagement campaign. We also secured a five-year recompete contract valued at over $90 million with a National Security client. Transition to the new contract is complete and I’d like to thank our team for their exceptional performance and dedication to this important client.”
Mr. Prow concluded, “The significant momentum in harnessing combined V2X solutions offers an opportunity to deliver growth with access to pursuits that would not have been achievable in the past. We remain focused on delivering on our strategy to drive growth by creating more value in our core markets with converged solutions, increasing market share where our operational knowledge sets us apart, and expanding mission capabilities into adjacent markets.”
First Quarter 2023 Results
On July 5, 2022 (“Closing Date”), Vectrus, Inc. (“Vectrus”) completed its merger (“the Merger”) with Vertex Aerospace Services Holding Corp. (“Vertex”), thereby forming V2X, Inc. First quarter 2022 “reported results” reflect the contributions of Vectrus from January 1, 2022, through March 31, 2022, unless otherwise noted. Comparisons to historical periods are relative to legacy Vectrus results, unless otherwise noted.
Revenue of $943.5 million, up 12.0% y/y on a pro forma basis
Operating income of $30.6 million, including merger and integration related costs of $9.4 million, and amortization of acquired intangible assets of $22.6 million
Adjusted operating income1 of $62.6 million
Adjusted EBITDA1 of $68.0 million with a 7.2% adjusted EBITDA margin1
Diluted EPS of ($0.57)
Adjusted diluted EPS1 of $0.80
Net debt as of March 31, 2023 of $1,288.6 million
Total backlog as of March 31, 2023 of $11.8 billion
“Our first quarter financial results were a strong start to the year,” said Susan Lynch, Senior Vice President and Chief Financial Officer. “Pro forma revenue increased 12.0% year-over-year to $943.5 million. Revenue growth was driven by momentum in the Pacific, expansion on existing programs, and the contribution from new business wins awarded in 2022 and 2023. Notably, revenue from the Pacific increased approximately 300% year-over-year and 18% sequentially, reflecting our agile readiness position to support the increased operational tempo of mission exercises in the region.”
For the quarter, the Company reported operating income of $30.6 million and adjusted operating income1 of $62.6 million. Adjusted EBITDA1 was $68.0 million with a margin of 7.2%. First quarter diluted EPS was ($0.57), due primarily to merger and integration related costs, loss on extinguishment of debt, amortization of acquired intangible assets, and interest expense. Adjusted diluted EPS1 for the quarter was $0.80 cents.
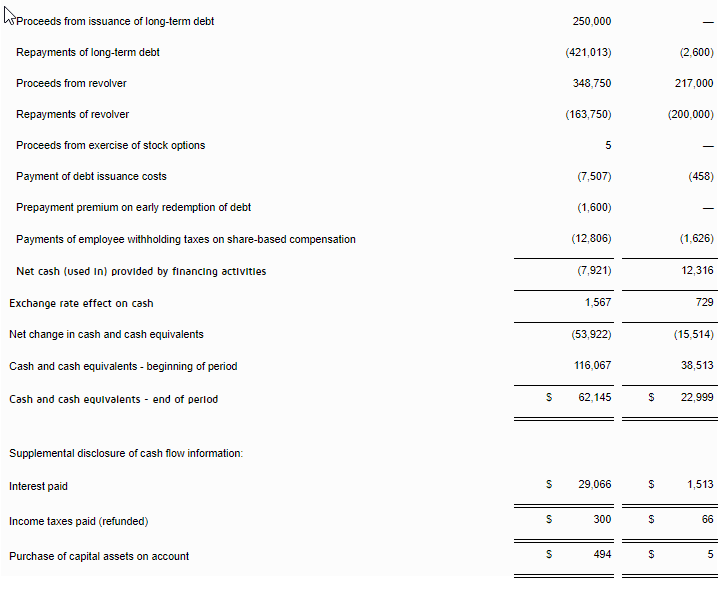
Ms. Lynch continued, “In the first quarter, V2X successfully enhanced its capital structure through a lower cost credit facility with greater liquidity. The new $750 million credit facility eliminated the second lien term loan B, the incremental portion of the first lien term loan B, and the asset-based loan revolver and was replaced with a lower cost $500 million revolver and a $250 million term loan A. In order to manage interest rate risk and uncertainty, the Company also entered into interest rate swaps, converting 30% of its variable-rate term loan debt into fixed rate-debt. I would like to thank our banking partners for their support and trust in our business. At the end of the quarter, our net consolidated indebtedness to EBITDA1 (net leverage ratio) was 3.8x. We are focused on reducing debt and expect that our leverage ratio will show further improvement in 2023.”
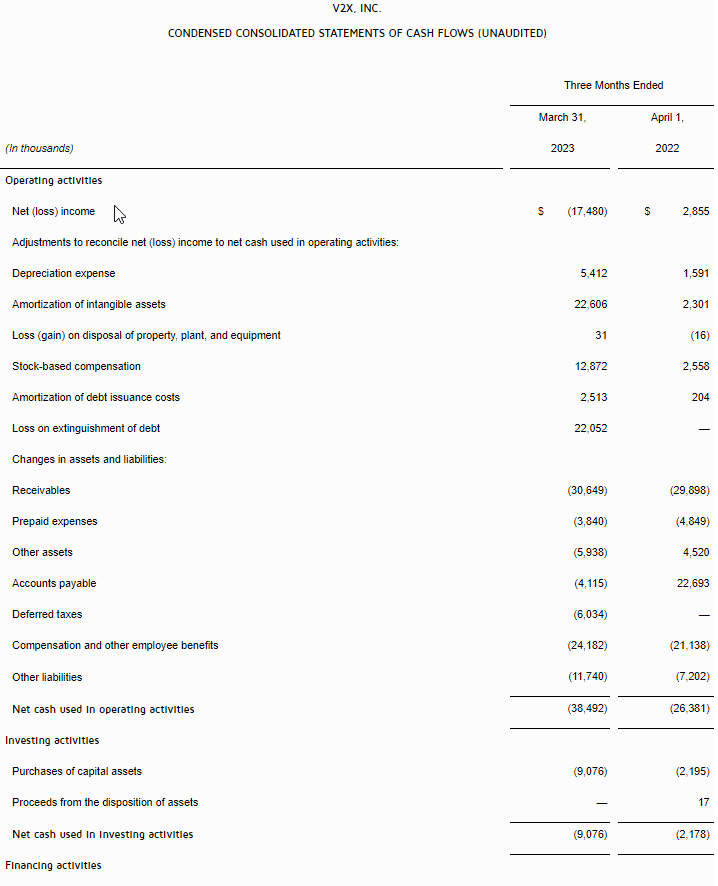
“Net cash used in operating activities for the quarter was $38.5 million. Adjusted net cash used in operating activities1 was $23.4 million, which adds back $13.4 million of CARES Act related payments and $1.7 million of M&A and integration costs,” said Ms. Lynch. “Cash flow followed our normal seasonal pattern and we expect operating cash flow to ramp to our previously communicated guidance.”
Total backlog as of March 31, 2023, was $11.8 billion and funded backlog was $2.6 billion. The trailing twelve-month book-to-bill was 1.4x.
Reiterating 2023 Guidance
Ms. Lynch concluded, “I am pleased with our strong start to the year. Our teams continue to work together seamlessly, making notable progress on integration milestones while driving results across the board. We have made great strides in harmonizing our processes, technology, and applications, which is allowing us to deliver on our commitments. As such, the Company is reiterating its guidance for 2023.” Guidance for 2023 remains as follows:
$ millions, except for per share amounts
2023 Guidance
2023 Mid-Point
Revenue
$3,800
To
$3,900
$3,850
Adjusted EBITDA1
$290
To
$310
$300
Adjusted Diluted Earnings Per Share1
$3.80
To
$4.30
$4.05
Adjusted Net Cash Provided by Operating Activities 1
$115.0
To
$135.0
$125.0
Forward-looking statements are based upon current expectations and are subject to factors that could cause actual results to differ materially from those suggested here, including those factors set forth in the Safe Harbor Statement below.
First Quarter 2023 Conference Call
Management will conduct a conference call with analysts and investors at 4:30 p.m. ET on Tuesday, May 9, 2023. U.S.-based participants may dial in to the conference call at 888-886-7786, while international participants may dial 416-764-8658. A live webcast of the conference call as well as an accompanying slide presentation will be available here: https://app.webinar.net/4AayJaN5XPr
A replay of the conference call will be posted on the V2X website shortly after completion of the call and will be available for one year. A telephonic replay will also be available through May 23, 2023, at 844-512-2921 (domestic) or 412-317-6671 (international) with passcode 30124902.
Presentation slides that will be used in conjunction with the conference call will also be made available online in advance at https://investors.vectrus.com/. V2X recognizes its website as a key channel of distribution to reach public investors and as a means of disclosing material non-public information to comply with its obligations under the U.S. Securities and Exchange Commission (“SEC”) Regulation FD.
Footnotes: 1 See “Key Performance Indicators and Non-GAAP Financial Measures” for descriptions and reconciliations.
About V2X
V2X is a leading provider of critical mission solutions and support to defense clients globally, formed by the 2022 Merger of Vectrus and Vertex to build on more than 120 combined years of successful mission support. The Company delivers a comprehensive suite of integrated solutions across the operations and logistics, aerospace, training and technology markets to national security, defense, civilian and international clients. Our global team of approximately 15,000 employees brings innovation to every point in the mission lifecycle, from preparation, to operations, to sustainment, as it tackles the most complex challenges with agility, grit, and dedication.
Safe Harbor Statement
Safe Harbor Statement under the Private Securities Litigation Reform Act of 1995 (the “Act”): Certain material presented herein includes forward-looking statements intended to qualify for the safe harbor from liability established by the Act. These forward-looking statements include, but are not limited to, all the statements and items listed under “Reiterating 2023 Guidance” above and other assumptions contained therein for purposes of such guidance, other statements about our 2023 performance outlook, revenue, contract opportunities, and any discussion of future operating or financial performance.
Forward-looking statements generally can be identified by the use of forward-looking terminology such as “may,” “will,” “expect,” “intend,” “estimate,” “anticipate,” “believe,” “could,” “potential,” “continue” or similar terminology. These statements are based on the beliefs and assumptions of the management of the Company based on information currently available to management.
These forward-looking statements are not guarantees of future performance, conditions, or results, and involve a number of known and unknown risks, uncertainties, assumptions, and other important factors, many of which are outside our management’s control, that could cause actual results to differ materially from the results discussed in the forward-looking statements. In addition, forward-looking statements are subject to certain risks and uncertainties that could cause actual results to differ materially from the Company’s historical experience and our present expectations or projections. For a discussion of some of the risks and uncertainties that could cause actual results to differ from such forward-looking statements, see the risks and other factors detailed from time to time our Annual Report on Form 10-K, Quarterly Reports on Form 10-Q, and other filings with the SEC.
We undertake no obligation to update any forward-looking statements, whether as a result of new information, future events or otherwise, except as required by law.
Key Performance Indicators and Non-GAAP Measures
The primary financial performance measures we use to manage our business and monitor results of operations are revenue trends and operating income trends. Management believes that these financial performance measures are the primary drivers for our earnings and net cash from operating activities. Management evaluates its contracts and business performance by focusing on revenue, operating income, and operating margin. Operating income represents revenue less both cost of revenue and selling, general and administrative (SG&A) expenses. Cost of revenue consists of labor, subcontracting costs, materials, and an allocation of indirect costs, which includes service center transaction costs. SG&A expenses consist of indirect labor costs (including wages and salaries for executives and administrative personnel), bid and proposal expenses and other general and administrative expenses not allocated to cost of revenue. We define operating margin as operating income divided by revenue.
We manage the nature and amount of costs at the program level, which forms the basis for estimating our total costs and profitability. This is consistent with our approach for managing our business, which begins with management’s assessing the bidding opportunity for each contract and then managing contract profitability throughout the performance period.
In addition to the key performance measures discussed above, we consider adjusted net income, adjusted diluted earnings per share, adjusted operating income, adjusted EBITDA, adjusted EBITDA margin, adjusted operating cash flow, and pro forma revenue to be useful to management and investors in evaluating our operating performance, and to provide a tool for evaluating our ongoing operations. This information can assist investors in assessing our financial performance and measures our ability to generate capital for deployment among competing strategic alternatives and initiatives. We provide this information to our investors in our earnings releases, presentations, and other disclosures.
Adjusted net income, adjusted diluted earnings per share, adjusted operating income, adjusted EBITDA, adjusted EBITDA margin, adjusted operating cash flow, and pro forma revenue, however, are not measures of financial performance under GAAP and should not be considered a substitute for financial measures determined in accordance with GAAP. Definitions and reconciliations of these items are provided below.
Pro forma revenue is defined as the combined results of our operations for the three months ended March 31, 2023 and April 1, 2022 as if the Merger had occurred on January 1, 2021.
Adjusted operating income is defined as operating income, adjusted to exclude items that may include, but are not limited to, significant charges or credits, and unusual and infrequent non-operating items that impact current results but are not related to our ongoing operations, such as M&A, integration, and related costs.
Adjusted EBITDA is defined as operating income, adjusted to exclude depreciation and amortization of intangible assets, and items that may include, but are not limited to, significant charges or credits, and unusual and infrequent non-operating items that impact current results but are not related to our ongoing operations, such as M&A, integration, and related costs.
Adjusted EBITDA margin is defined as adjusted EBITDA divided by revenue.
Adjusted net income is defined as net income, adjusted to exclude items that may include, but are not limited to, significant charges or credits, and unusual and infrequent non-operating items that impact current results but are not related to our ongoing operations, such as M&A, integration and related costs, amortization of acquired intangible assets, amortization of debt issuance costs, and loss on extinguishment of debt.
Adjusted diluted earnings per share is defined as adjusted net income divided by the weighted average diluted common shares outstanding.
Cash interest, net is defined as interest expense, net adjusted to exclude amortization of debt issuance costs.
Adjusted operating cash flow is defined as net cash provided by (or used in) operating activities adjusted to exclude infrequent non-operating items, such as M&A payments and related costs.
In this document, the Company presents certain forward-looking non-GAAP metrics. The Company does not provide outlook on a GAAP basis because the items that the Company excludes from GAAP to calculate the comparable non-GAAP measure can be dependent on future events that are less capable of being controlled or reliably predicted by management and are not part of the Company’s routine operating activities. Additionally, management does not forecast many of the excluded items for internal use and therefore cannot create or rely on outlook done on a GAAP basis. The occurrence, timing and amount of any of the items excluded from GAAP to calculate non-GAAP could significantly impact the Company’s fiscal 2023 GAAP results.
Salem Media Group is America’s leading multimedia company specializing in Christian and conservative content, with media properties comprising radio, digital media and book and newsletter publishing. Each day Salem serves a loyal and dedicated audience of listeners and readers numbering in the millions nationally. With its unique programming focus, Salem provides compelling content, fresh commentary and relevant information from some of the most respected figures across the Christian and conservative media landscape.
Michael Kupinski, Director of Research, Equity Research Analyst, Digital, Media & Technology , Noble Capital Markets, Inc.
Patrick McCann, Research Associate, Noble Capital Markets, Inc.
Refer to the full report for the price target, fundamental analysis, and rating.
In-line Q1 results. The company reported Q1 revenue of $63.5 million, beating our estimate of $62 million by 2.4%. Revenue in the quarter was driven by slightly better than expected broadcast and publishing revenues. Adj. EBITDA of $1.4 million was largely in line with our estimate of $1.7 million.
Sizeable cost reductions. The company eliminated $5 million in annualized costs in the first quarter. The savings were included in management issued guidance for Q2 and full year 2023, and are expected to have an equal impact in each quarter moving forward. We believe that the company is managing cash flow while investing in its Digital businesses and into Salem News.
Equity Research is available at no cost to Registered users of Channelchek. Not a Member? Click ‘Join’ to join the Channelchek Community. There is no cost to register, and we never collect credit card information.
This Company Sponsored Research is provided by Noble Capital Markets, Inc., a FINRA and S.E.C. registered broker-dealer (B/D).
*Analyst certification and important disclosures included in the full report. NOTE: investment decisions should not be based upon the content of this research summary. Proper due diligence is required before making any investment decision.
Joe Gomes, Managing Director, Equity Research Analyst, Generalist , Noble Capital Markets, Inc.
Joshua Zoepfel, Research Associate, Noble Capital Markets, Inc.
Refer to the full report for the price target, fundamental analysis, and rating.
Disappointing 1Q23. Management was disappointed with 1Q23 results, but a number of negative impacts were out of their hands, such as weather and customer delays, impacting production rates and profitability. However, these projects are not lost, just pushed to the right.
But Improvements Being Made. The most significant is a return to profitability for the Concrete segment in March, its first profitable month in two years. As the unfavorable Central Texas business continues to fall off, we expect further profitability improvement for the Concrete business.
Equity Research is available at no cost to Registered users of Channelchek. Not a Member? Click ‘Join’ to join the Channelchek Community. There is no cost to register, and we never collect credit card information.
This Company Sponsored Research is provided by Noble Capital Markets, Inc., a FINRA and S.E.C. registered broker-dealer (B/D).
*Analyst certification and important disclosures included in the full report. NOTE: investment decisions should not be based upon the content of this research summary. Proper due diligence is required before making any investment decision.
Lee Enterprises, Incorporated provides local news, information, and advertising primarily in midsize markets in the United States. It publishes 49 daily newspapers, as well as offers 300 weekly newspapers and specialty publications in 23 states. The company also provides online advertising and services; and online infrastructure and online publishing services for approximately 1,500 daily and weekly newspapers and shoppers. In addition, it offers commercial printing services. The company has a strategic alliance with Yahoo!, Inc. to provide its classified employment advertising customer base the opportunity to post job listings and other employment products on Yahoo!�s HotJobs national platform. Lee Enterprises, Incorporated was founded in 1890 and is based in Davenport, Iowa.
Michael Kupinski, Director of Research, Equity Research Analyst, Digital, Media & Technology , Noble Capital Markets, Inc.
Refer to the full report for the price target, fundamental analysis, and rating.
Post quarterly review. The company delivered a solid fiscal second quarter in spite of heavy economic headwinds and secular pressure on its print legacy business. Notably, its Digital businesses performed well, and its digital subscriber growth continues to lead the industry. We believe that the company will be able to achieve its FY 2023 revenue and adj. EBITDA guidance given its attention to costs.
Reiterates guidance. Management reiterated its previously issued FY 2023 guidance of $270 to $285 million in digital revenues, $94 to $100 million in adj. EBITDA, 632,000 digital subscribers and cash costs in the range of $610 to $620 million. While management did not provide guidance for print revenues, we are flowing through Q2 operating results to our full year 2023 forecast.
Equity Research is available at no cost to Registered users of Channelchek. Not a Member? Click ‘Join’ to join the Channelchek Community. There is no cost to register, and we never collect credit card information.
This Company Sponsored Research is provided by Noble Capital Markets, Inc., a FINRA and S.E.C. registered broker-dealer (B/D).
*Analyst certification and important disclosures included in the full report. NOTE: investment decisions should not be based upon the content of this research summary. Proper due diligence is required before making any investment decision.
ISG (Information Services Group) (Nasdaq: III) is a leading global technology research and advisory firm. A trusted business partner to more than 700 clients, including more than 75 of the world’s top 100 enterprises, ISG is committed to helping corporations, public sector organizations, and service and technology providers achieve operational excellence and faster growth. The firm specializes in digital transformation services, including automation, cloud and data analytics; sourcing advisory; managed governance and risk services; network carrier services; strategy and operations design; change management; market intelligence and technology research and analysis. Founded in 2006, and based in Stamford, Conn., ISG employs more than 1,300 digital-ready professionals operating in more than 20 countries—a global team known for its innovative thinking, market influence, deep industry and technology expertise, and world-class research and analytical capabilities based on the industry’s most comprehensive marketplace data. For additional information, visit www.ISG-One.com
Joe Gomes, Managing Director, Equity Research Analyst, Generalist , Noble Capital Markets, Inc.
Joshua Zoepfel, Research Associate, Noble Capital Markets, Inc.
Refer to the full report for the price target, fundamental analysis, and rating.
Seeing More Demand. ISG’s momentum has continued to build and this quarter realized an all time high in revenue, as demand for digital services, especially cost optimization, is providing ISG with a nice tailwind through the economic environment. Companies continue to invest in digital to maintain and build competitive advantage. The client base now exceeds 900.
Record Revenue. ISG reported an all-time record revenue of $78 million, exceeding guidance and our estimate of $74 million. Recurring revenue, driven by double-digit growth in the GovernX and risk management business, reached a record $33 million, up 27% y-o-y.
Equity Research is available at no cost to Registered users of Channelchek. Not a Member? Click ‘Join’ to join the Channelchek Community. There is no cost to register, and we never collect credit card information.
This Company Sponsored Research is provided by Noble Capital Markets, Inc., a FINRA and S.E.C. registered broker-dealer (B/D).
*Analyst certification and important disclosures included in the full report. NOTE: investment decisions should not be based upon the content of this research summary. Proper due diligence is required before making any investment decision.


