Baudax Bio is a pharmaceutical company focused on innovative products for acute care settings. ANJESO is the first and only 24-hour, intravenous (IV) COX-2 preferential non-steroidal anti-inflammatory (NSAID) for the management of moderate to severe pain. In addition to ANJESO, Baudax Bio has a pipeline of other innovative pharmaceutical assets including two novel neuromuscular blocking agents (NMBs) and a proprietary chemical reversal agent specific to these NMBs. For more information, please visit www.baudaxbio.com.
Gregory Aurand, Senior Research Analyst, Healthcare Services & Medical Devices, Noble Capital Markets, Inc.
Refer to the full report for the price target, fundamental analysis, and rating.
Baudax Bio reported 4Q 2022. While we had removed 4Q ANJESO revenues with the announced ANJESO discontinuation at the end of December, the Company reported 4Q revenues of $0.310 million in the quarter. Net loss per share for 4Q 2022 was $12.33 per share as compared to our outlook of $9.76 per share loss as the Company took additional write-offs related to ANJESO.
Baudax Bio reported full year 2022. For the year 2022, Baudax Bio generated revenues of $1.27 million, up from $1.08 million in the 2021 year. The Company took a write-down for impairment of intangibles of $19.7 million. The full year impairment write-down for property and equipment totaled $4.2 million. The reported full year 2022 net loss was $58.8 million or a loss of $177.30 per share compared to our full year 2022 expected loss of $55.3 million or $189.44 per share.
Equity Research is available at no cost to Registered users of Channelchek. Not a Member? Click ‘Join’ to join the Channelchek Community. There is no cost to register, and we never collect credit card information.
This Company Sponsored Research is provided by Noble Capital Markets, Inc., a FINRA and S.E.C. registered broker-dealer (B/D).
*Analyst certification and important disclosures included in the full report. NOTE: investment decisions should not be based upon the content of this research summary. Proper due diligence is required before making any investment decision.
ACCO Brands Corporation is one of the world’s largest designers, marketers and manufacturers of branded academic, consumer and business products. Our widely recognized brands include AT-A-GLANCE®, Esselte®, Five Star®, GBC®, Kensington®, Leitz®, Mead®, PowerA®, Quartet®, Rapid®, Rexel®, Swingline®, Tilibra®, and many others. Our products are sold in more than 100 countries around the world. More information about ACCO Brands, the Home of Great Brands Built by Great People, can be found at www.accobrands.com.
Joe Gomes, Managing Director – Generalist Analyst, Noble Capital Markets, Inc.
Joshua Zoepfel, Research Associate, Noble Capital Markets, Inc.
Refer to the full report for the price target, fundamental analysis, and rating.
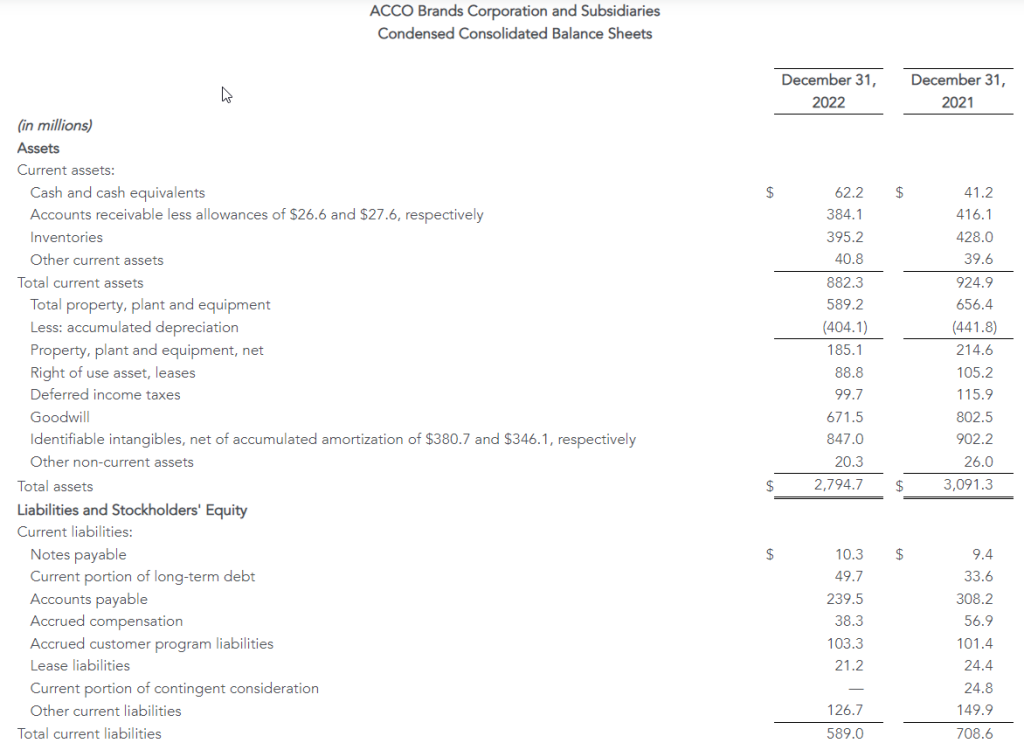
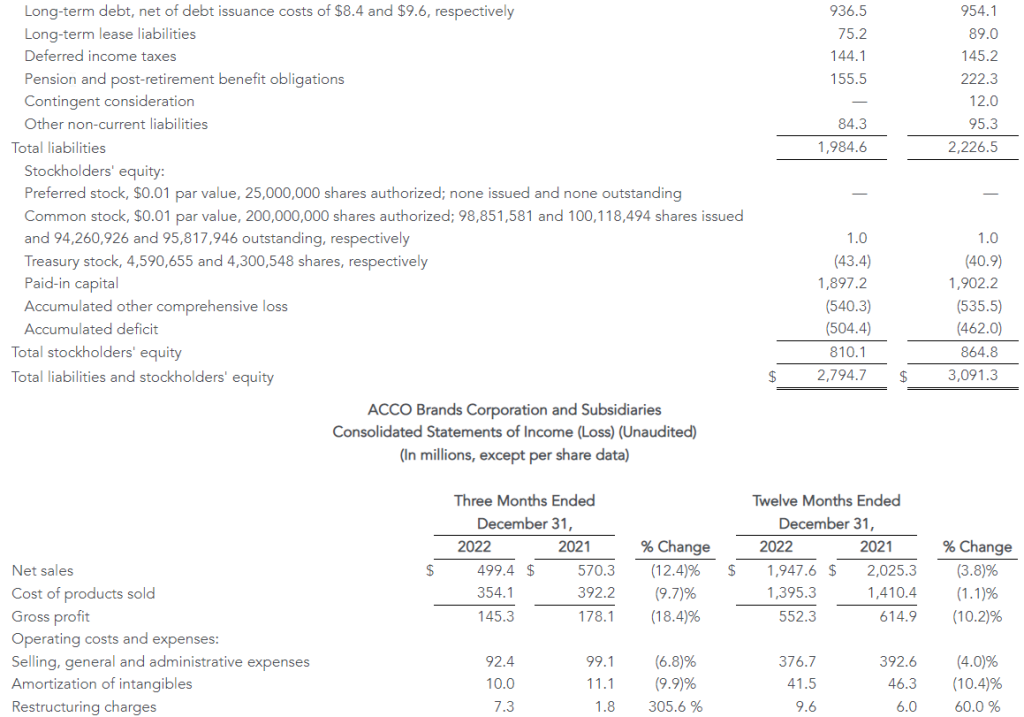
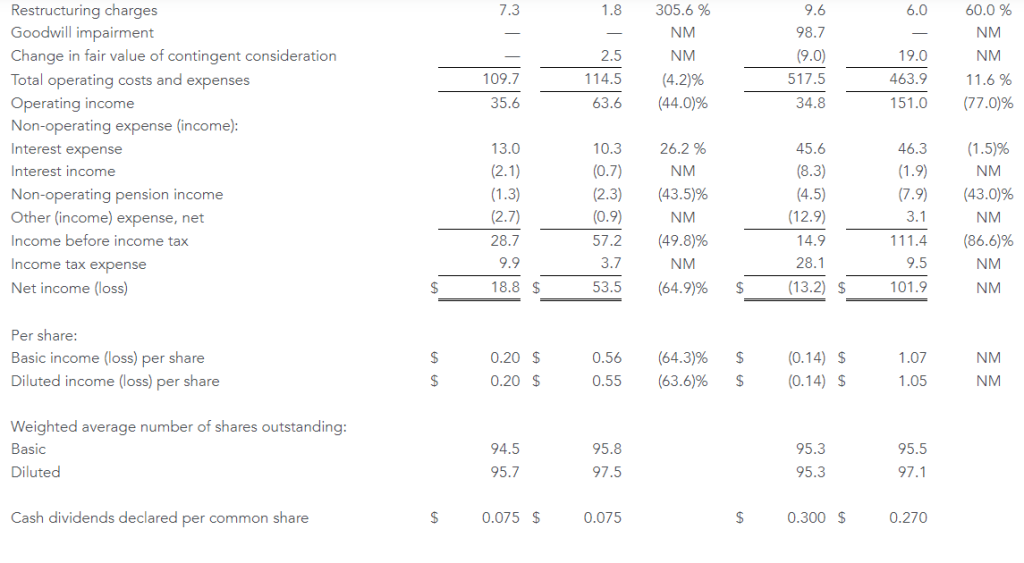
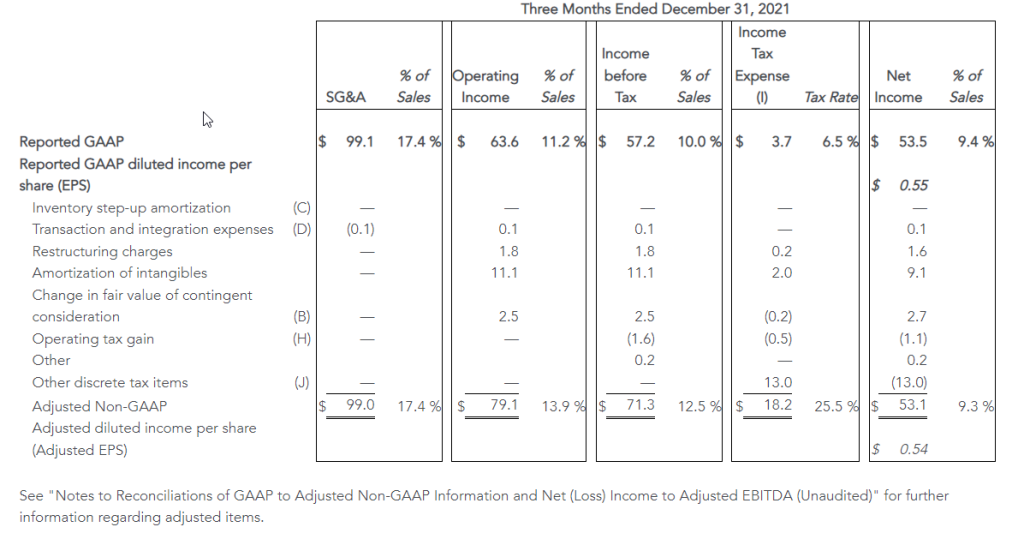
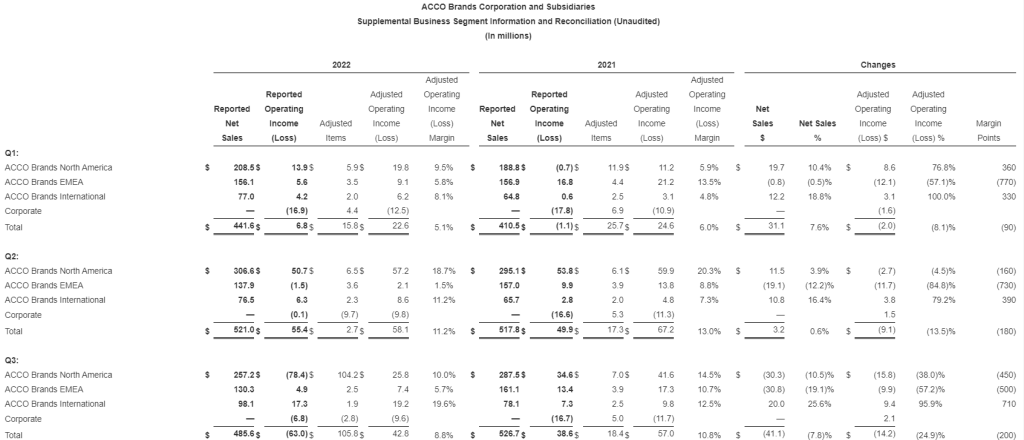
4Q Results. ACCO Brands posted net sales of $499.4 million, a decrease of 12.4% from the prior year’s $570.3 million. Operating income for the quarter was at $35.6 million versus $63.6 million the prior year due to lower sales volumes and higher inflation. Net income was reported at $18.8 million, or $0.20 per diluted share, compared to $53.5 million, or $0.55/sh, last year. We estimated revenue of $510.0 million, operating income of $47 million, net income of $26 million, and EPS of $0.28.
Revenue Segments. North America saw a decrease in sales to $225.7 million versus $271.0 million the prior year with operating income of $8.9 million versus $34.2 million a year ago. EMEA sales were $156.0 million versus $187.9 million the year prior, with operating income of $12.7 million versus $21.6 million. Lastly, International had sales of $117.7 million, an increase from last year’s $111.4 million, with operating income of $22.7 million, an increase over last year’s $20.9 million.
Equity Research is available at no cost to Registered users of Channelchek. Not a Member? Click ‘Join’ to join the Channelchek Community. There is no cost to register, and we never collect credit card information.
This Company Sponsored Research is provided by Noble Capital Markets, Inc., a FINRA and S.E.C. registered broker-dealer (B/D).
*Analyst certification and important disclosures included in the full report. NOTE: investment decisions should not be based upon the content of this research summary. Proper due diligence is required before making any investment decision.
Use of Psychedelics to Treat PTSD, OCD, Depression and Chronic Pain – a Researcher Discusses Recent Trials, Possible Risks
New research is exploring whether psychedelic drugs, taken under strict medical supervision, might help in treating post-traumatic stress disorder, chronic pain, depression and obsessive-compulsive disorder. Dr. Jennifer Mitchell – a professor in the Departments of Neurology and Psychiatry & Behavioral Science in the School of Medicine at the University of California, San Francisco was interviewed by SciLine. She discusses what scientists have found to date about the effectiveness of these drugs in treating these disorders and how best for them to be administered. Highlights and key excerpts of the interview have been transcribed and published below.
What are psychedelic drugs and how do they work?
Dr. Jennifer Mitchell: Psychedelic basically means “mind manifesting,” suggesting that the compound assists one in uncovering subject matter that perhaps is otherwise deeply hidden from the conscious mind.
It’s a slightly different term from hallucinogen, which you see used almost interchangeably at times with the term psychedelic.
A hallucinogen by definition is something that makes you see, hear, smell something that isn’t otherwise there, so you can imagine there’s a lot of overlap between psychedelics and hallucinogens.
Which types of psychedelic drugs are being studied by researchers for potential therapeutic use?
Dr. Jennifer Mitchell: The two most well studied drugs at this point are MDMA and psilocybin.
MDMA is being evaluated mainly for treatment of post-traumatic stress disorder treatments, and psilocybin mainly for treatment of resistant depression and major depressive disorder.
MDMA is the furthest along because there’s phase 3 data (data from late-stage research) and the possibility that a new drug application would be submitted to the FDA sometime later this year.
LSD is also being evaluated for a number of different indications, most notably obsessive-compulsive disorder.
And then a couple of sort of heavier hitters are now being tested in primarily healthy control populations, including drugs like mescaline and ayahuasca.
What have scientists discovered about whether these drugs are effective in treating health problems like PTSD or chronic pain?
Dr. Jennifer Mitchell: The drugs so far appear to be quite effective. I think one key, though, is that they’re typically being administered in conjunction with some form of psychotherapy.
So it’s important to keep that in mind when we look at the results from some of these recent trials that these are not drugs that are being administered in isolation. You are not taking home a bottle of pills and taking those twice a day as you would, say, an antidepressant. These are administered in a very particular way.
What is involved in therapeutic treatment using these drugs?
Dr. Jennifer Mitchell: Typically, prior to taking the drug at all, subjects participate in a number of preparatory sessions so that they understand a little bit about what is going to happen on an experimental session day.
And then subjects come into a room that looks very much like a comfortable living room, and they spend all day there. The drug is administered typically in the morning. For psilocybin, you’re looking at a six-hour dosing session, and for MDMA, an eight-hour dosing session.
You are in the company of a group of trained providers: therapists, psychedelic facilitators, psychiatrists and clinical research coordinators.
What are the potential risks of using psychedelic drugs for therapeutic purposes?
Dr. Jennifer Mitchell: One concern we’ve had is cardiovascular risk, and so we are taking great care in some of the clinical trials at present to evaluate cardiovascular burden, including heart attack risk, during and after the experiment. This evaluation includes tracking the heart rate and blood pressure of the participants.
In addition, researchers are worried about suicidality, in part because these are treatment-resistant populations that we’re starting off with, and so there’s a concern that perhaps, if they’re destabilized – either by the psychedelic, or just by tapering off their other meds in order to be part of a psychedelic trial – that we could run the risk of suicidality.
Lastly, I think the FDA has been concerned about the possibility that psychedelics are addictive, and so we’ve been following up with study participants to ensure that they aren’t engaging in drug seeking or drug taking outside of the study.
What do we know about the safety of taking psychedelics outside the clinical context?
Dr. Jennifer Mitchell: I think we’ve all heard stories from the ‘60s and ’70s of people taking psychedelics and having very bad experiences. What we know now is that the environment in which you take the psychedelic is of the utmost importance. It’s not appropriate at this point to try to take some of these substances or replicate some of these protocols on your own without oversight.
Watch the full interview to hear more about psychedelic medicine.
SciLine is a free service based at the nonprofit American Association for the Advancement of Science that helps journalists include scientific evidence and experts in their news stories.
What Sectors Outperformed the Market after the PCE Inflation Shock?
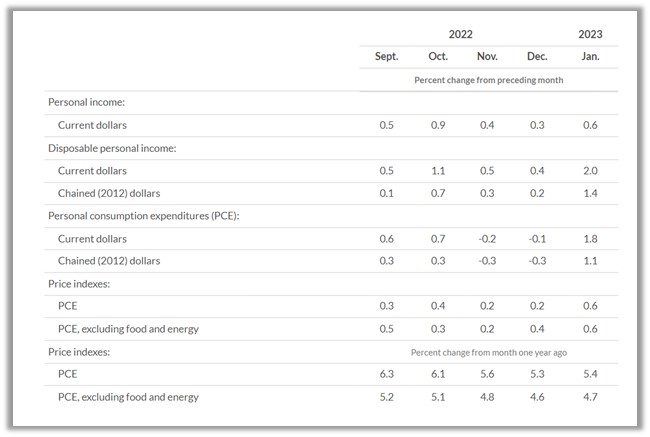
When an investor inquires, “What stocks do well with high inflation?” they are often asking, “What sectors do well with rising interest rates?,” because inflation expectations often drive rate moves. The text book response usually given are: consumer staples, banks and financials, and commodities. The PCE indexes are considered the Fed’s preferred indicator of inflation trends. The PCE surprised markets on the high side when released on February 24th. What can investors now expect from higher-than-forecast inflation?
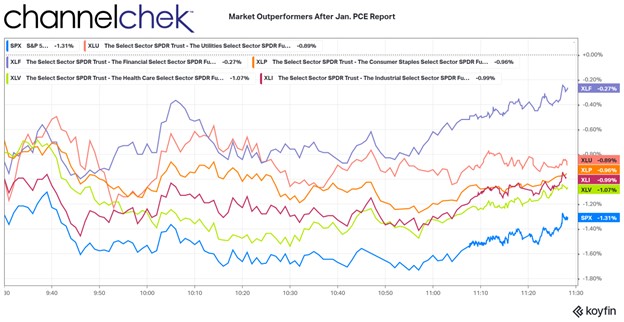
Rather than look at old information on what outperforms the overall market when inflation expectations rise, I thought it would be informative and more useful to see what is outperforming under current 2023 conditions and climate. The chart below and the remainder of this simple study is a snapshot three hours after the news settled in among investors (11:30am ET, February 24th).
There were five S&P sectors that outperformed the S&P 500 a few hours after the inflation number showed an almost across-the-board acceleration in price increases. At this point, the S&P 500 had already fallen 1.31%.
Beating the S&P larger index, but the worst of the five outperformers was Health Care (XLV). The Health sector is considered to be a necessity that consumers find a means to pay for regardless of cost. Within the sector there are companies providing goods and services that are more embraced by investors than others. Within the XLV, many stocks were green after the report.
Outperforming the Health Care sector were stocks making up the Industrial Sector (XLI). This includes large industrial manufacturers like John Deere, General Electric, and Caterpillar. Many of these companies have contracts well out into the future that assures business. What is not ordinarily assured is the cost of manufacturing which can go up with inflation. A number of the top holdings in XLI barely budged on the morning – GE was up .08%, Honeywell was down .18%, and UPS was down just .20%.
Almost even with the Industrial Sector was Consumer Staples (XLP). As with Health Care and to a lesser degree Industrials this sector is where money moves to during inflationary periods. Consumers may be postpone a new car purchase, but they’ll keep their buying habits unchanged for products produced by Colgate, Coca-Cola, Proctor and Gamble, or cigarette manufacturers.
Performing second best after the inflation numbers was the Utility sector (XLU). Again this follows the mindset that consumers can only cutback on water, electricity, and natural gas so much. It is more likely that cutbacks would come in other areas like entertainment, or technology. Technology was the worst performing sector.
The top performer, although still modestly negative, was the Financial sector. This includes insurance, banks and credit card companies, as well as investment firms. Banks, particularly those with a higher percentage of traditional banking business, benefit from a steepening yield curve. Banks use cash as their product line. They borrow short from customers, and lend longer term. As the yield curve steepens, their net income can be expected to rise. This may explain why two of the top three holdings were positive after the report, JP Morgan (JPM), and Wells Fargo (WFC). Brokerage firms also may benefit as accounts uninvested balances can be a source of revenue as financial firms earn interest on them. Rising rates means every balance they can earn on creates additional income.
Larger Index Observations
As indicated earlier, technology was the worst-performing sector. This causes the tech heavy Nasdaq to far underperform the other major indexes. The best performing a few hour after the open was the Dow Industrials, which is comprised of just 30 industrial stocks, many paying consistent dividends. The second best performer, beating both the Dow and S&P 500 was the Russell 2000 Small-Cap index. Small-cap stocks tend to be less affected when borrowing costs change, and tend to have more of their end customers located domestically. The U.S.-based customers is an advantage to smaller stocks when rising rates cause rising dollar values. A rising dollar makes goods or services from the U.S. more expensive overseas.
Take Away
The textbook reply to questions related to rising rates, inflation, and sector rotation in stocks held up after the surprise PCE index increase. Banks, and necessities like heat and consumer goods outperformed. Also small-cap stocks did not disappoint, they also held up better than the overall large cap universe.
One difficulty small and even microcap investors face is that information is less available on many of these companies. And there are a lot of them, including in the sectors that outperform with inflation. One easy way to find which smaller companies are rising to the top is Channelchek’s Market Movers tab. This can be viewed throughout the trading day by clicking here for the link.
Net sales were $1.95 billion, down 4 percent; comparable sales up 1 percent
Gained market share across multiple product categories in North America in 2022
Achieved quarterly sequential margin improvement in EMEA as pricing actions took hold
Realized double-digit sales and profit growth in the International segment
Generated $78 million of cash from operations; adjusted free cash flow of $78 million
During fourth quarter of 2022 actioned annual cost savings of $13 million from significant restructuring initiatives
Full year 2023 outlook anticipates margin expansion and profit growth
LAKE ZURICH, Ill.–(BUSINESS WIRE)– ACCO Brands Corporation (NYSE: ACCO) today announced its fourth quarter and full year results for the period ended December 31, 2022.
“We delivered 1% comparable sales growth in 2022 as we continue to execute on our strategic transformation, including expanding our product categories, broadening our geographic reach and bringing innovative new consumer-centric products to market. This enabled us to achieve market share gains with many of our brands, including Five Star®, Kensington®, Mead®, Quartet® and AT-A-GLANCE®. These successes give us confidence that our strategy of being a more consumer, brand and technology centric company and our portfolio of strong brands will position us to deliver sustainable organic growth over the long-term,” said Boris Elisman, Chairman and Chief Executive Officer of ACCO Brands.
“In 2023 our top priority is to restore our margin profile through incremental pricing actions implemented in January of 2023, the restructuring initiatives undertaken during the fourth quarter of 2022 and the additional productivity programs we will implement in 2023. We expect these actions will drive margin expansion and profit growth for the full year of 2023. With our expected continued strong cash flow in 2023, we will support our quarterly dividend, pay down debt and continue to invest in new product development and go-to-market initiatives, which we expect will better position us for future growth,” added Elisman.
Fourth Quarter Results
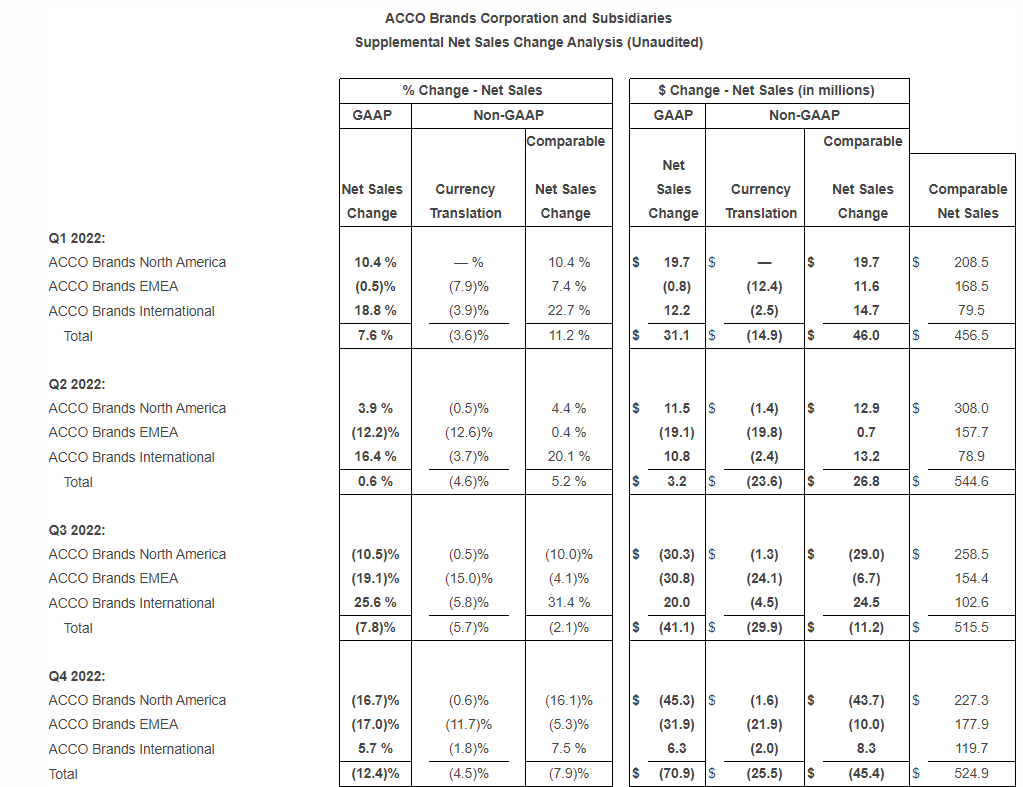
Net sales declined 12.4 percent to $499.4 million from $570.3 million in 2021. Adverse foreign exchange reduced sales $25.5 million, or 4.5 percent. Comparable sales fell 7.9 percent. Both reported and comparable sales declines were due to weaker sales of gaming accessories, lower inventory replenishment by our retailer customers and reduced volumes due to a deterioration in the macroeconomic environment. These more than offset global price increases.
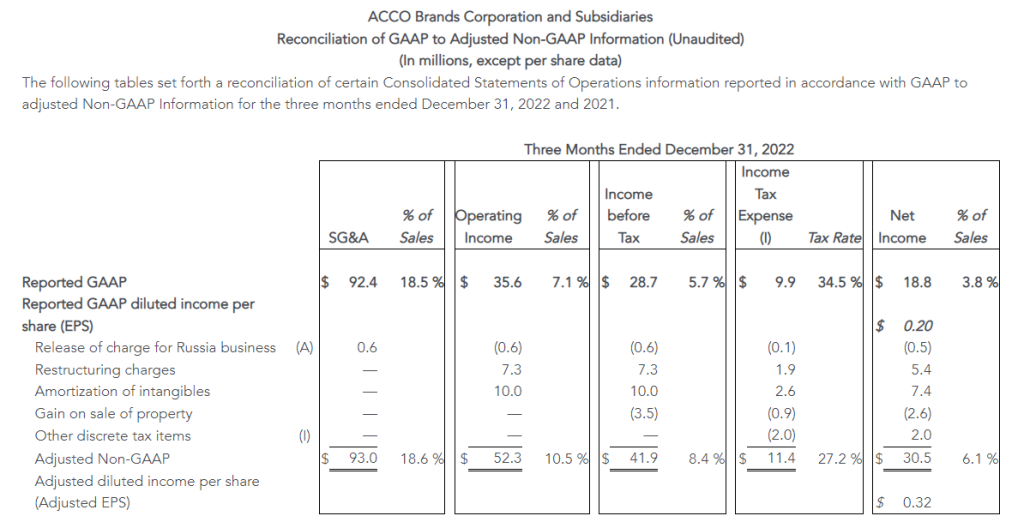
Operating income was $35.6 million versus $63.6 million in 2021, and adjusted operating income decreased to $52.3 million from $79.1 million in the prior year. Both reported and adjusted operating income reflect the impact of lower sales volumes and higher inflation on raw materials, finished goods and transportation costs, which was partially offset by price increases, and reduced SG&A expense due to lower incentive compensation expense. Adverse foreign exchange reduced operating income by $2.2 million.
The Company reported net income of $18.8 million, or $0.20 per share, compared with prior year net income of $53.5 million, or $0.55 per share, which included $13.0 million of favorable discrete tax items. Adjusted net income was $30.5 million, or $0.32 per share, compared with $53.1 million, or $0.54 per share in 2021. The remaining declines in underlying reported net income, as well as adjusted net income were due to the items noted above in operating income.
Full Year Results
Net sales decreased 3.8 percent to $1.95 billion from $2.03 billion in 2021. The unfavorable impact of foreign exchange reduced sales by $93.9 million, or 4.6 percent. Comparable sales increased 0.8 percent. Both reported and comparable sales reflect the benefit of higher prices in all segments and strong volume growth in the International segment, partially offset by weaker sales of gaming accessories, and lower volumes in North America and EMEA due to the challenging macroeconomic environment.
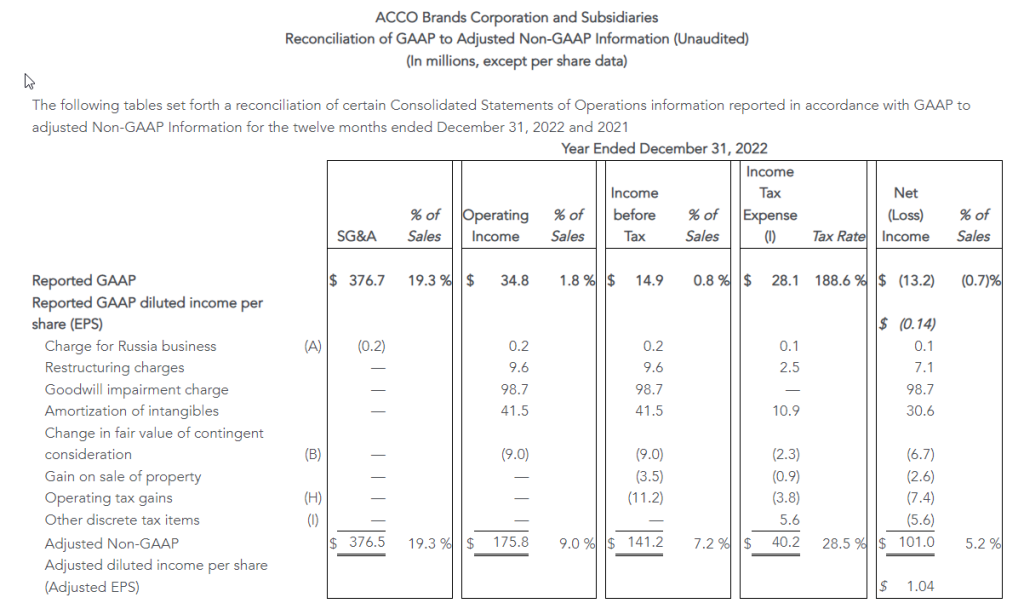
Operating income was $34.8 million compared to $151.0 million in 2021, with the decline primarily due to the non-cash goodwill impairment charge of $98.7 million, partially offset by the favorable change in fair value of $28.0 million related to the PowerA contingent earnout. Adjusted operating income declined to $175.8 million from $227.9 million in 2021. The declines in both reported and adjusted operating income also reflect the impact of inflation that exceeded the benefit of price increases, and reduced volumes, partially offset by reduced SG&A expense which includes lower incentive compensation expense. Unfavorable foreign exchange reduced operating income by $6.3 million.
Net loss was $13.2 million, or ($0.14) per share, compared with net income of $101.9 million, or $1.05 per share, in 2021. The current year net loss includes $98.7 million in non-cash goodwill impairment charges, mitigated by the favorable change in fair value of the contingent earnout consideration of $20.9 million. Prior year net income also included $19.7 million of additional favorable discrete tax items, partially offset by $9.9 million of expenses related to the debt refinancing. Adjusted net income was $101.0 million, compared with $136.8 million in 2021, and adjusted earnings per share were $1.04 compared with $1.41 in 2021. The remaining declines in reported net income and adjusted net income reflect the changes noted above for adjusted operating income, partially offset by higher interest income due to higher cash balances and increased interest rates in Brazil. Interest expense was similar to the prior year.
Capital Allocation and Dividend
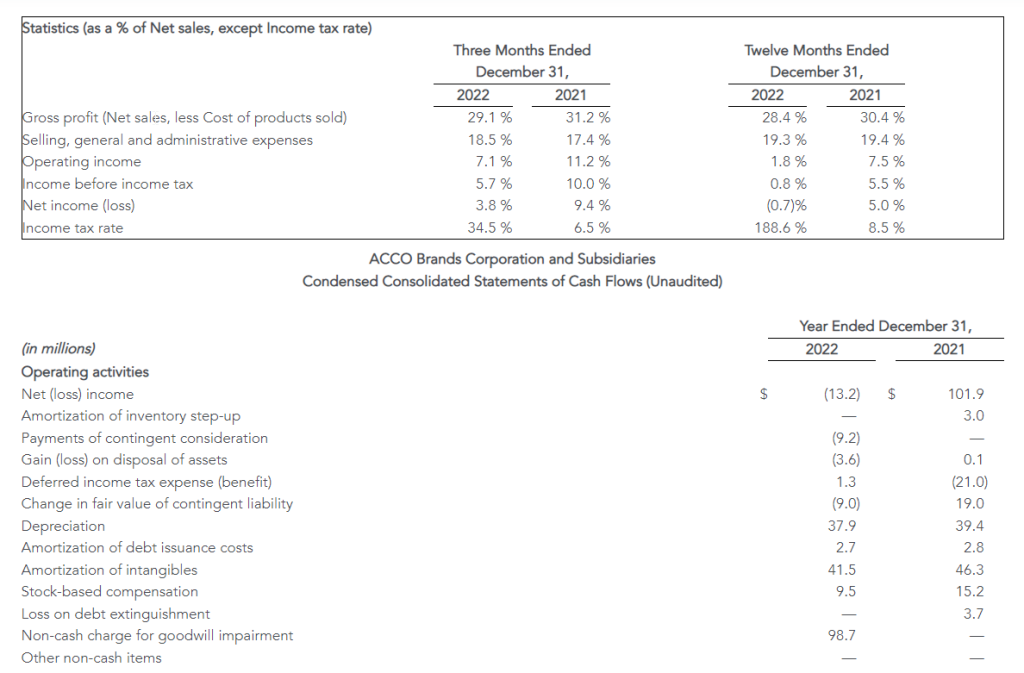
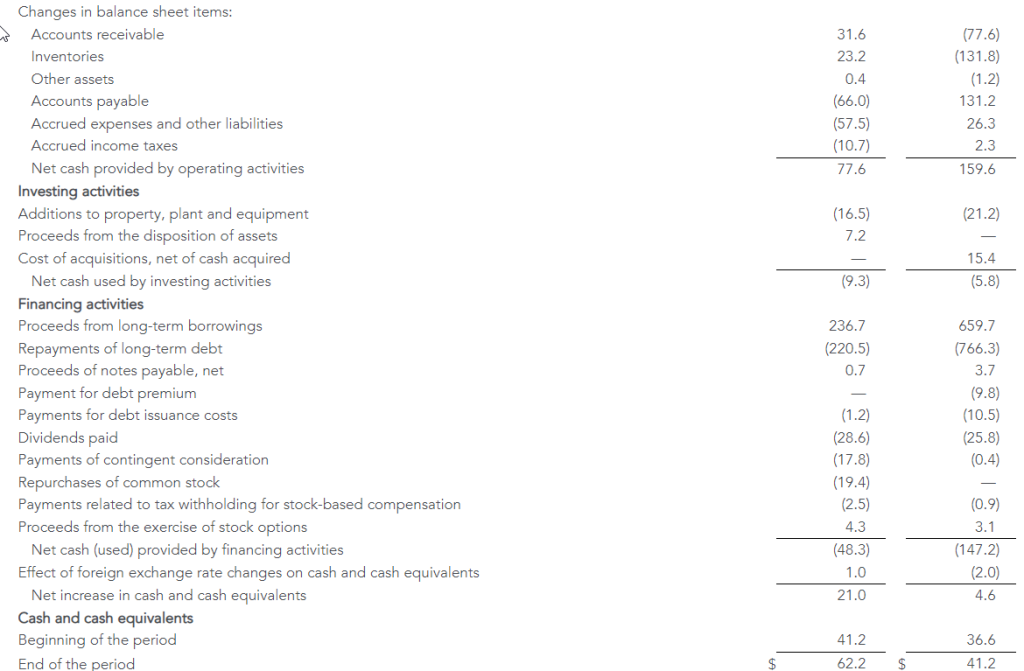
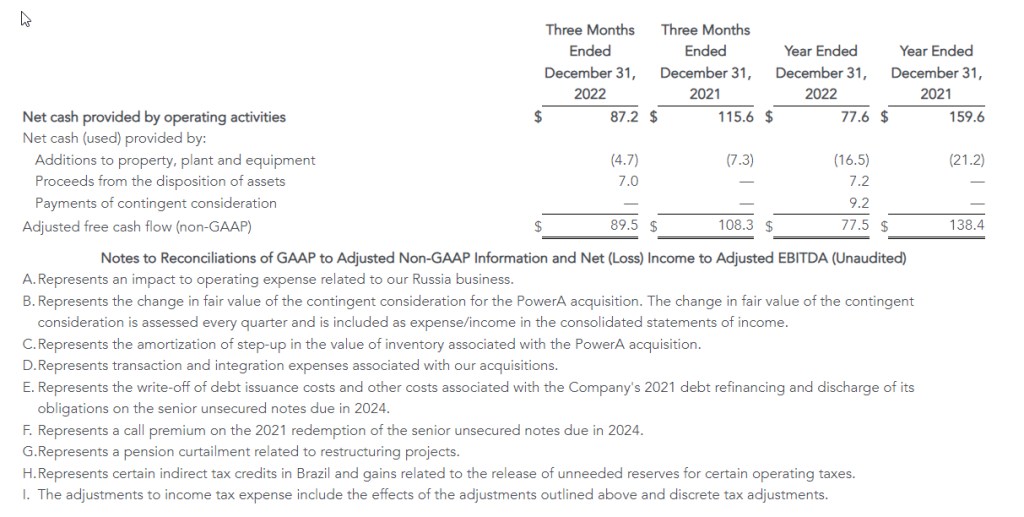
For the full year, the Company’s cash generated by operating activities was $77.6 million versus $159.6 million in the prior year. Adjusted free cash flow in 2022 was $77.5 million, reflecting net investing activity and excluding the operating component of the contingent earnout payment. In 2022 the Company paid $28.6 million in dividends, repurchased 2.7 million shares for $19.4 million and fully paid $27.0 million related to the 2021 PowerA contingent earnout.
ACCO Brands announced on February 17, 2023, that its board of directors declared a regular quarterly cash dividend of $0.075 per share. The dividend will be paid on April 5, 2023, to stockholders of record at the close of business on March 10, 2023.
Restructuring Actions
During the fourth quarter of 2022, the Company developed restructuring plans for both its North America and EMEA operating segments, intended to expand margins through initiatives focused on improving operating efficiency and reducing cost. In the Company’s North America segment, the plan is focused on consolidation of supply chain operations, SKU reduction, automating our sales support process, and sourcing optimization. In the Company’s EMEA segment, the focus is on reducing redundancy and enhancing productivity in its operations, SKU reduction, and sourcing initiatives. The Company anticipates these initiatives will create operating efficiencies and improve profitability, as well as provide for future growth investments. The Company has the following expectations for the restructuring plans:
Targeted annualized operating profit improvement of $13 million, with the vast majority of these savings delivered in 2023
Total profit improvements to be realized approximately 75% through lower SG&A costs and 25% through reduced cost of goods sold
Pre-tax restructuring charges of approximately $7 million were recorded in the fourth quarter, primarily comprised of severance and employee related costs
In addition, the Company has implemented plans to reduce inventory levels, increase inventory turns and improve cash flow and working capital.
Business Segment Results
ACCO Brands North America – Fourth quarter segment net sales of $225.7 million decreased 16.7 percent versus the prior year’s segment net sales of $271.0 million. Adverse foreign exchange reduced sales by 0.6 percent. Comparable sales of $227.3 million were down 16.1 percent. The decrease was primarily due to lower demand for gaming accessories and channel inventory destocking, more than offsetting price increases.
Fourth quarter operating income in North America was $8.9 million versus $34.2 million a year earlier, and adjusted operating income was $18.7 million compared to $41.9 million a year ago, with the decline in both primarily reflecting the impact of lower sales, reduced gross margin rates from negative fixed cost leverage and higher inflation on raw materials, finished goods and transportation costs. In addition, we incurred one-off items in the quarter of $7.8 million, reducing the margin rate by 340 basis points. We anticipate stabilization of product costs in select areas and improved ocean freight rates, which should benefit our margin profile in future periods.
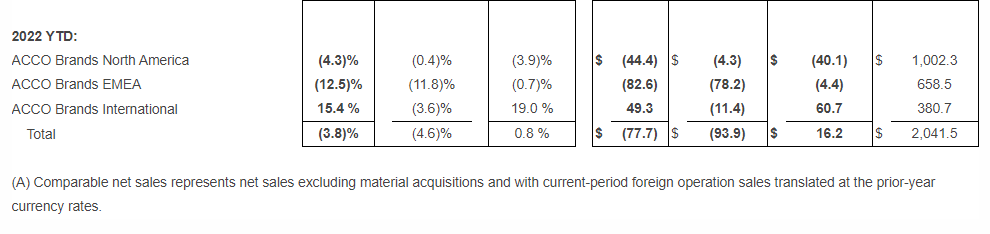
For the full year, 2022 North America net sales of $998.0 million decreased 4.3 percent from $1,042.4 million in 2021, and comparable sales declined 3.9 percent. Higher sales and market share gains in many brands and product categories were more than offset by weaker demand for gaming accessories. Sales were stronger in the first half of 2022, driven by early demand for back-to-school products as retailers pulled their shipments to earlier in the year seeking to secure product for the selling season, while second half sales were challenged by both this pull forward, as well as inventory destocking and a slowdown in demand related to the macroeconomic environment.
In North America, the full year operating loss was $4.9 million versus operating income of $121.9 million in 2021. The loss was primarily due to the $98.7 million non-cash goodwill impairment charge. Adjusted operating income of $121.5 million decreased from $154.6 million in 2021. The decreases to reported operating loss/income and adjusted operating income reflect lower sales volumes and reduced gross margin from higher inflation on raw materials, finished goods and transportation costs.
ACCO Brands EMEA – Fourth quarter segment net sales of $156.0 million decreased 17.0 percent versus the prior year’s segment revenue of $187.9 million. Adverse foreign exchange reduced sales by 11.7 percent. Comparable sales of $177.9 million decreased 5.3 percent versus the prior-year period. Both reported and comparable sales declines were due to lower volumes which more than offset price increases. In Europe, the current energy crisis and significant inflation have created a challenging macroeconomic environment impacting sales.
Fourth quarter operating income in EMEA was $12.7 million versus $21.6 million a year earlier, and adjusted operating income was $18.4 million compared to $24.9 million a year ago. The decreases in both reported operating income and adjusted operating income were due primarily to lower sales and reduced gross margins reflecting negative fixed cost leverage and higher costs for finished goods, raw materials and freight due to significant inflation. In the fourth quarter, EMEA’s operating margin improved on a sequential basis benefiting from pricing actions and deflation in certain product and transportation costs.
Net sales for the full year in the EMEA segment of $580.3 million decreased 12.5 percent from $662.9 million in 2021. The impact of adverse foreign exchange reduced sales $78.2 million, or 11.8 percent. Comparable sales of $658.5 million decreased $4.4 million or 0.7 percent. Both reported and comparable sales declines reflect stronger sales volumes in early 2022 driven by computer accessories and business products, offset by persistent inflation and a challenging demand environment in the second half of the year, as well as the stoppage of sales to Russia.
The EMEA segment posted full-year operating income of $21.7 million compared with operating income of $61.7 million in 2021. Adjusted operating income was $37.0 million, down from $77.2 million in 2021. The declines in both reflects the impact of lower sales volumes and reduced gross margins reflecting higher costs for finished goods, raw materials and freight due to significant inflation and negative fixed cost leverage.
ACCO Brands International – Fourth quarter segment sales of $117.7 million increased 5.7 percent versus the prior year’s segment revenue of $111.4 million. Adverse foreign exchange reduced sales by 1.8 percent. Comparable sales of $119.7 million increased 7.5 percent versus the year-ago period. Both reported and comparable sales increased primarily due to price increases, more than offsetting lower volumes. Strong sales in Brazil benefited from a return to in-person education.
Fourth quarter operating income in the International segment was $22.7 million versus $20.9 million a year earlier, and adjusted operating income was $24.3 million compared to $22.9 million a year ago. The increases in both operating income and adjusted operating income were due primarily to price increases, and the strong performance in our Brazil business.
International segment sales of $369.3 million for the full year increased 15.4 percent from $320.0 million in 2021. Adverse foreign exchange reduced sales by $11.4 million. Comparable sales were $380.7 million, up 19.0 percent, due to increased volume and higher prices, primarily in Latin America from a return of in-person education and work.
Operating income of $50.5 million increased from $31.6 million in 2021. Adjusted operating income of $58.3 million increased from $40.6 million. The increases in both operating and adjusted operating income were primarily due to higher sales volumes, pricing and improved expense leverage.
Commentary and Outlook for 1Q and Full Year 2023
“Our priority in 2023 is to improve our operating profitability and free cash flow through pricing, productivity and restructuring initiatives and more efficient use of working capital. We anticipate that these actions, along with a moderating rate of inflation, will allow us to deliver margin expansion and profit and cash flow growth in 2023. We achieved comparable sales growth in 2022 and are confident in the long term sales potential of our business. Our proven business strategy, which includes geographic diversity, and our strong portfolio of brands and innovative products have us well positioned for continued long term profitable growth,” added Elisman.
“While the current economic environment remains fluid, we have an experienced management team with a proven track record of navigating periods of economic uncertainties. We are also well-capitalized, with no near-term debt maturities and generate consistent free cash flow. We remain confident in our strategic transformation and believe we have taken the right actions to drive long-term shareholder value,” Elisman concluded.
The Company is providing full year 2023 and 1Q outlook. For the full year, we expect comparable sales to be down 3 percent to flat, reflecting a challenging near-term demand environment. Foreign exchange is expected to be neutral to reported revenue. Full year adjusted EPS is expected to rise 4 percent to 8 percent, to $1.08 to $1.12, approaching low double-digit growth in adjusted operating income, partially offset by higher interest and non-cash non-operating pension expenses. 2023 free cash flow is expected to grow to at least $100 million.
Our quarterly sales and profit projection for 2023 will reflect a different cadence than last year. In 2022, the Company experienced good sales growth in the first half of the year reflecting strong demand from the post-pandemic economic recovery. In addition, North America sales benefited from the pull forward of purchases by retailers to ensure product availability for back-to-school. Concerns about the economy, the war in Ukraine and related energy crisis in EMEA challenged demand and our sales in the second half of 2022. In addition, our retail customers proactively curtailed purchases in the back half of the year to aggressively reduce their inventory levels. Against these comparisons, we are projecting our sales to be down in both the first quarter and first half of 2023, with growth anticipated in the second half of the year.
In the first quarter, we expect comparable sales to decline 10 percent to 7 percent, primarily due to the timing of back-to-school shipments and lower sales of gaming accessories in North America, partially offset by higher sales in our International segment. First quarter adjusted EPS is expected to be $0.05 to $0.07 with higher gross margins offset by sales deleveraging, higher interest and non-cash, non-operating pension expenses.
Webcast
At 8:30 a.m. ET on February 24, 2023, ACCO Brands Corporation will host a conference call to discuss the Company’s fourth quarter and full year 2022 results. The call will be broadcast live via webcast. The webcast can be accessed through the Investor Relations section of www.accobrands.com. The webcast will be in listen-only mode and will be available for replay following the event.
About ACCO Brands Corporation
ACCO Brands, the Home of Great Brands Built by Great People, designs, manufactures and markets consumer and end-user products that help people work, learn, play and thrive. Our widely recognized brands include AT-A-GLANCE®, Five Star®, Kensington®, Leitz®, Mead®, PowerA®, Swingline®, Tilibra® and many others. More information about ACCO Brands Corporation (NYSE: ACCO) can be found at www.accobrands.com.
Non-GAAP Financial Measures
In addition to financial results reported in accordance with generally accepted accounting principles (GAAP), we have provided certain non-GAAP financial information in this earnings release to aid investors in understanding the Company’s performance. Each non-GAAP financial measure is defined and reconciled to its most closely related GAAP financial measure in the “About Non-GAAP Financial Measures” section of this earnings release.
Forward-Looking Statements
Statements contained herein, other than statements of historical fact, particularly those anticipating future financial performance, business prospects, growth, strategies, business operations and similar matters, results of operations, liquidity and financial condition, are “forward-looking statements” within the meaning of the Private Securities Litigation Reform Act of 1995. These statements are based on the beliefs and assumptions of management based on information available to us at the time such statements are made. These statements, which are generally identifiable by the use of the words “will,” “believe,” “expect,” “intend,” “anticipate,” “estimate,” “forecast,” “project,” “plan,” and similar expressions, are subject to certain risks and uncertainties, are made as of the date hereof, and we undertake no duty or obligation to update them. Because actual results may differ materially from those suggested or implied by such forward-looking statements, you should not place undue reliance on them when deciding whether to buy, sell or hold the company’s securities.
Our outlook is based on certain assumptions, which we believe to be reasonable under the circumstances. These include, without limitation, assumptions regarding the impact of the COVID-19 pandemic and the war in Ukraine; the impact of inflation and global economic uncertainties, fluctuations in foreign currency exchange rates and acquisitions; and the other factors described below.
Among the factors that could cause our actual results to differ materially from our forward-looking statements are: our ability to successfully execute our restructuring plans and realize the benefits of our productivity initiatives; our ability to obtain additional price increases and realize longer-term cost reductions; the ongoing impact of the COVID-19 pandemic; a relatively limited number of large customers account for a significant percentage of our sales; issues that influence customer and consumer discretionary spending during periods of economic uncertainty or weakness; risks associated with foreign currency exchange rate fluctuations; challenges related to the highly competitive business environment in which we operate; our ability to develop and market innovative products that meet consumer demands and to expand into new and adjacent product categories that are experiencing higher growth rates; our ability to successfully expand our business in emerging markets and the exposure to greater financial, operational, regulatory, compliance and other risks in such markets; the continued decline in the use of certain of our products; risks associated with seasonality; the sufficiency of investment returns on pension assets, risks related to actuarial assumptions, changes in government regulations and changes in the unfunded liabilities of a multi-employer pension plan; any impairment of our intangible assets; our ability to secure, protect and maintain our intellectual property rights, and our ability to license rights from major gaming console makers and video game publishers to support our gaming business; continued disruptions in the global supply chain; risks associated with inflation and other changes in the cost or availability of raw materials, transportation, labor, and other necessary supplies and services and the cost of finished goods; the continued global shortage of microchips which are needed in our gaming and computer accessories businesses; risks associated with outsourcing production of certain of our products, information technology systems and other administrative functions; the failure, inadequacy or interruption of our information technology systems or its supporting infrastructure; risks associated with a cybersecurity incident or information security breach, including that related to a disclosure of personally identifiable information; our ability to grow profitably through acquisitions; our ability to successfully integrate acquisitions and achieve the financial and other results anticipated at the time of acquisition, including planned synergies; risks associated with our indebtedness, including limitations imposed by restrictive covenants, our debt service obligations, and our ability to comply with financial ratios and tests; a change in or discontinuance of our stock repurchase program or the payment of dividends; product liability claims, recalls or regulatory actions; the impact of litigation or other legal proceedings; our failure to comply with applicable laws, rules and regulations and self-regulatory requirements, the costs of compliance and the impact of changes in such laws; our ability to attract and retain qualified personnel; the volatility of our stock price; risks associated with circumstances outside our control, including those caused by public health crises, such as the occurrence of contagious diseases like COVID-19, severe weather events, war, terrorism and other geopolitical incidents; and other risks and uncertainties described in “Part I, Item 1A. Risk Factors” in our Annual Report on Form 10-K for the year ended December 31, 2021, “Part II, Item 1A Risk Factors” in our Quarterly Report on Form 10-Q for the quarter ended September 30, 2022 and in other reports we file with the Securities and Exchange Commission.
About Non-GAAP Financial Measures
We explain below how we calculate each of our non-GAAP financial measures and a reconciliation of our current period and historical non-GAAP financial measures to the most directly comparable GAAP financial measures follows.
We use our non-GAAP financial measures both to explain our results to stockholders and the investment community and in the internal evaluation and management of our business. We believe our non-GAAP financial measures provide management and investors with a more complete understanding of our underlying operational results and trends, facilitate meaningful period-to-period comparisons and enhance an overall understanding of our past and future financial performance.
Our non-GAAP financial measures exclude certain items that may have a material impact upon our reported financial results such as restructuring charges, transaction and integration expenses associated with material acquisitions, the impact of foreign currency exchange rate fluctuations and acquisitions, unusual tax items, goodwill impairment charges, and other non-recurring items that we consider to be outside of our core operations. These measures should not be considered in isolation or as a substitute for, or superior to, the directly comparable GAAP financial measures and should be read in connection with the Company’s financial statements presented in accordance with GAAP.
Our non-GAAP financial measures include the following:
Comparable Sales : Represents net sales excluding the impact of material acquisitions with current-period foreign operation sales translated at prior-year currency rates. We believe comparable sales are useful to investors and management because they reflect underlying sales and sales trends without the effect of acquisitions and fluctuations in foreign exchange rates and facilitate meaningful period-to-period comparisons. We sometimes refer to comparable sales as comparable net sales.
Adjusted Gross Profit : Represents gross profit excluding the effect of the amortization of the step-up in inventory from material acquisitions. We believe adjusted gross profit is useful to investors and management because it reflects underlying gross profit without the effect of inventory adjustments resulting from acquisitions that we consider to be outside our core operations and facilitates meaningful period-to-period comparisons.
Adjusted Selling, General and Administrative (SG&A) Expenses : Represents selling, general and administrative expenses excluding transaction and integration expenses related to material acquisitions. We believe adjusted SG&A expenses are useful to investors and management because they reflect underlying SG&A expenses without the effect of expenses related to acquiring and integrating acquisitions that we consider to be outside our core operations and facilitate meaningful period-to-period comparisons.
Adjusted Operating Income/Adjusted Income Before Taxes/Adjusted Net Income/Adjusted Net Income Per Diluted Share :Represents operating income, income before taxes, net income, and net income per diluted share excluding restructuring and goodwill impairment charges, the amortization of intangibles, the amortization of the step-up in value of inventory, the change in fair value of contingent consideration, transaction and integration expenses associated with material acquisitions, non-recurring items in interest expense or other income/expense such as expenses associated with debt refinancing, a bond redemption, or a pension curtailment, and other non-recurring items as well as all unusual and discrete income tax adjustments, including income tax related to the foregoing. We believe these adjusted non-GAAP financial measures are useful to investors and management because they reflect our underlying operating performance before items that we consider to be outside our core operations and facilitate meaningful period-to-period comparisons. Senior management’s incentive compensation is derived, in part, using adjusted operating income and adjusted net income per diluted share, which is derived from adjusted net income. We sometimes refer to adjusted net income per diluted share as adjusted earnings per share or adjusted EPS.
Adjusted Income Tax Expense/Rate :Represents income tax expense/rate excluding the tax effect of the items that have been excluded from adjusted income before taxes, unusual income tax items such as the impact of tax audits and changes in laws, significant reserves for cash repatriation, excess tax benefits/losses, and other discrete tax items. We believe our adjusted income tax expense/rate is useful to investors because it reflects our baseline income tax expense/rate before benefits/losses and other discrete items that we consider to be outside our core operations and facilitates meaningful period-to-period comparisons.
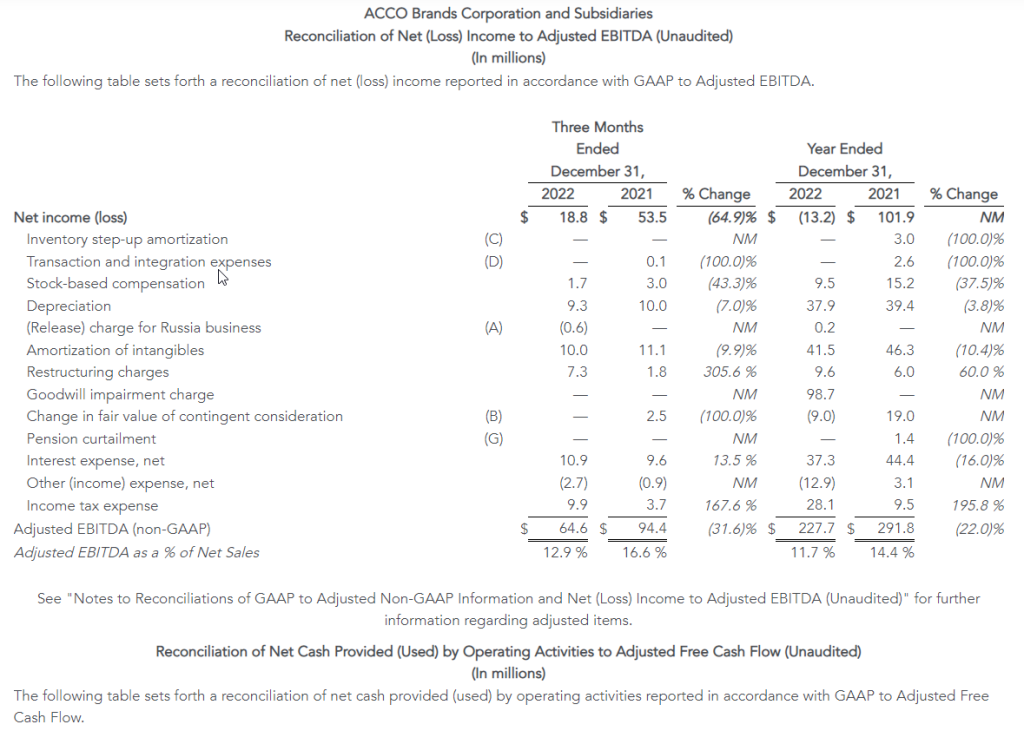
Adjusted EBITDA: Represents net income excluding the effects of depreciation, stock-based compensation expense, amortization of intangibles, the change in fair value of contingent consideration, interest expense, net, other (income) expense, net, and income tax expense, the amortization of the step-up in value of inventory, transaction and integration expenses associated with material acquisitions, restructuring and goodwill impairment charges, non-recurring items in interest expense or other income/expense such as expenses associated with debt refinancing, a bond redemption, or a pension curtailment and other non-recurring items. We believe adjusted EBITDA is useful to investors because it reflects our underlying cash profitability and adjusts for certain non-cash charges, and items that we consider to be outside our core operations and facilitates meaningful period-to-period comparisons.
Adjusted Free Cash Flow: Represents cash flow from operating activities, excluding cash payments made for contingent earnouts, less cash used for additions to property, plant and equipment, plus cash proceeds from the disposition of assets. We believe adjusted free cash flow is useful to investors because it measures our available cash flow for paying dividends, funding strategic material acquisitions, reducing debt, and repurchasing shares.
Consolidated Leverage Ratio: Represents balance sheet debt, plus debt origination costs and less any cash and cash equivalents divided by adjusted EBITDA. We believe that consolidated leverage ratio is useful to investors since the company has the ability to, and may decide to use a portion of its cash and cash equivalents to retire debt.
We also provide forward-looking non-GAAP comparable sales, adjusted earnings per share, adjusted free cash flow, adjusted EBITDA, and adjusted tax rate, and historical and forward-looking consolidated leverage ratio. We do not provide a reconciliation of these forward-looking and historical non-GAAP measures to GAAP because the GAAP financial measure is not currently available and management cannot reliably predict all the necessary components of such non-GAAP measures without unreasonable effort or expense due to the inherent difficulty of forecasting and quantifying certain amounts that are necessary for such a reconciliation, including adjustments that could be made for restructuring, integration and acquisition-related expenses, the variability of our tax rate and the impact of foreign currency fluctuation and material acquisitions, and other charges reflected in our historical results. The probable significance of each of these items is high and, based on historical experience, could be material.
Christopher McGinnis Investor Relations (847) 796-4320
TORONTO, ON / ACCESSWIRE / February 23, 2023 / Eskay Mining Corp. (“Eskay” or the “Company”) (TSXV:ESK) (OTCQX:ESKYF) (Frankfurt:KN7)(WKN:A0YDPM) is pleased to announce further encouraging diamond drill results from its 2022 exploration program at its 100% controlled Consolidated Eskay Property in the Golden Triangle, British Columbia.
“Results from our 2022 exploration season demonstrate Eskay’s team has made considerable progress toward unraveling the district-scale potential of VMS mineralization surrounding the Eskay Creek deposit,” commented Dr. John DeDecker, VP of Exploration for Eskay Mining Corp. “Achievements of the 2022 exploration program include defining a new trend of VMS mineralization along the Scarlet-Tarn corridor parallel to and approximately seven kilometers east of the Eskay anticline. Tarn Lake and Scarlet Knob are situated along an east-west trending VMS feeder structure hosted by Eskay rhyolite like that seen in the footwall of the Eskay Creek deposit. Mapping and prospecting define a westward stratigraphic younging direction suggesting that stockwork and replacement-style mineralization at Tarn Lake may represent feeders to seafloor-hosted mineralization up-section towards the important Contact Mudstone horizon, host to high-grade mineralization at Eskay Creek. This recognition is a significant step towards meeting our goal of discovering new Eskay Creek-like high-grade VMS systems. Drilling at TV now shows that Au- and Ag-bearing massive sulfide extends 100 m along strike and overlies an even more extensive zone of stockwork mineralization. We are eager to follow up on all of these encouraging results in 2023.”
TV Extensional Drilling
Highlight results:
4.61 gpt Au and 22.17 gpt Ag (4.89 gpt Au Eq) over 6.28m within 2.84 gpt Au and 22.17 gpt Ag (3.13 gpt Au Eq) over 16.36m in hole TV22-105
2.66 gpt Au and 30.45 gpt Ag (3.05 gpt Au Eq) over 10.56m within 1.51 gpt Au and 25.39 gpt Ag (1.83 gpt Au Eq) over 43.09m in hole TV22-120
3.36 gpt Au and 109.50 gpt Ag (4.76 gpt Au Eq) over 2.00m within 1.14 gpt Au and 30.40 gpt Ag (1.53 gpt Au Eq) over 30.56m in hole TV22-97
6.88 gpt Au and 21.00 gpt Ag (7.15 gpt Au Eq) over 1.10m within 1.28 gpt Au and 87.92 gpt Ag (2.41 gpt Au Eq) over 14.95m in hole TV22-109
Drilling at TV in 2022 expanded the footprint of both the Upper Massive Sulfide Zone and Stockwork Zone at TV (Figures 1, 2 and 3). Massive sulfide mineralization now extends approximately 100 m along strike, ranges from 5 to 10 m in thickness, and is characterized by sulfide lenses hosted by intensely silicified carbonaceous mudstone associated with peperitic dacite (Figures 4 and 5). Massive and semi-massive sulfide mineralization overlies an extensive stockwork feeder zone hosted by dacitic and andesitic breccia and peperite. Stockwork mineralization now extends approximately 175 m along strike, 175 m down dip, and ranges in thickness from 50 to 100 m. Significantly, drill holes testing the up-dip extent of the stockwork zone (TV22-106, 108, and 112) intercepted strongly anomalous Au and Ag values with interspersed values over 1 gpt Au equivalent. Rock chip samples collected from the vicinity of these drill holes suggest that this up-dip zone may contain higher grade pockets of Au and Ag mineralization (Figure 2).
Significant mineralized intervals from 2022 drill holes completed in the vicinity of the TV deposit are presented in the table below. A complete list of the coordinates of drill holes including holes without significant mineralized intercepts is found at the bottom of this release.
Hole
From (m)
To (m)
Length (m)
Au (gpt)
Ag (gpt)
Au Eq (gpt)
Ag Eq (gpt)
TV22-88
133.30
135.00
1.70
1.22
1.22
1.24
96.38
TV22-97
95.44
126.00
30.56
1.14
30.40
1.53
119.68
includes
114.00
116.00
2.00
3.36
109.50
4.76
371.58
TV22-99
88.72
93.60
4.88
0.70
23.50
1.00
78.17
97.64
103.34
5.70
1.77
19.46
2.02
157.82
includes
102.55
103.34
0.79
8.85
23.00
9.14
713.30
TV22-105
86.72
103.08
16.36
2.84
22.17
3.13
243.78
includes
86.72
93.00
6.28
4.61
22.17
4.89
381.59
and
96.00
101.00
5.00
2.39
25.40
2.71
211.66
TV22-106
2.56
4.60
2.04
1.69
2.38
1.72
134.20
24.91
26.91
2.00
0.78
17.50
1.00
78.30
TV22-108
4.20
6.99
2.79
1.94
6.00
2.02
157.32
15.00
18.00
3.00
1.33
2.17
1.36
105.76
TV22-109
50.05
65.00
14.95
1.28
87.92
2.41
188.00
includes
50.05
51.15
1.10
6.88
21.00
7.15
557.64
and
57.58
63.23
5.65
1.03
173.12
3.25
253.38
TV22-110
72.27
88.95
16.68
1.44
19.62
1.69
131.55
TV22-111
51.56
58.78
7.22
0.45
92.99
1.64
127.96
includes
54.83
56.51
1.68
0.87
309.00
4.84
377.21
TV22-112
0.00
7.00
7.00
0.75
9.31
0.87
68.05
includes
4.00
5.00
1.00
3.57
8.18
3.67
286.64
TV22-120
127.79
170.88
43.09
1.51
25.39
1.83
142.83
includes
130.18
131.00
0.82
4.19
15.00
4.38
341.82
and
136.58
147.14
10.56
2.66
30.45
3.05
238.18
TV22-121
95.00
97.18
2.18
0.13
121.87
1.69
131.82
128.31
132.00
3.69
1.27
40.31
1.79
139.37
Au Eq and Ag Eq values have all been adjusted to the silver-to-gold ratio of 78:1 for this news release.
Tarn Lake
Assay results from the maiden drill program at Tarn Lake have already defined an 80m-long open-ended trend of Au mineralization that dips west-northwest (Figures. 1, 7 and 8). Rock chip sample results suggest that Au mineralization extends up-dip from the drill holes to the surface. Mineralization remains open down-dip.
Sulfide mineralization intercepted by drilling is dominantly replacement-style and stockwork-style (Figure 9), and is hosted by intensely altered Eskay rhyolite. This style of mineralization and intense hydrothermal alteration are consistent with a position in the immediate sub-seafloor environment of a VMS feeder zone. Geological mapping, drilling, and lithological facies analyses show extensive rhyolite-bearing volcaniclastic debris flow beds, peperitic rhyolite, and flow-banded rhyolite defining a rhyolite dome complex that formed at a paleoseafloor position proximal to a syn-volcanic VMS feeder structure, supporting the interpretation based on mineralization and alteration. Based on this geology, Eskay’s exploration team thinks there is considerable potential for the presence of seafloor-hosted VMS mineralization at one or more horizons at Tarn Lake, as is seen along the parallel Eskay Creek-Sib-Lulu trend to the west (Figure 10).
Eskay’s geological mapping team has determined that the stratigraphic younging direction along the Scarlet-Tarn trend is to the west, and that the contact between the Eskay rhyolite and the Willow Ridge basalt lies to the west of Tarn Lake (Figure 10). The contact between these lithologies defines the Contact mudstone horizon that hosts the world-class Au-Ag mineralization at Eskay Creek Mine. Given that recent rock chip sampling indicates Au mineralization continues west of Tarn Lake, it is possible the Tarn VMS system continues up-stratigraphy to the Contact mudstone horizon. These findings are a significant step towards our goal of finding Eskay Creek-like VMS deposits on the Consolidated Eskay Property.
In addition to the potential for Au and Ag mineralization down-dip and up-section from 2022 drilling, there is considerable potential for mineralization to extend beneath Bruce Glacier to Scarlet Knob along east-west trending feeder structures (Figure 11). These feeder structures are delineated by andesite dikes surrounded by sulfide mineralization and intense hydrothermal alteration of the host Eskay rhyolite.
Significant drill results from hole TN22-8 completed at Tarn Lake are presented in the table below.
Hole
From (m)
To (m)
Length (m)
Au (gpt)
Ag (gpt)
Au Eq (gpt)
Ag Eq (gpt)
TN22-8
90.19
92.88
2.69
0.75
29.00
1.12
87.50
117.33
123.00
5.67
1.37
3.37
1.41
110.00
133.53
139.72
6.19
1.46
2.13
1.49
116.16
158.04
161.00
2.96
1.27
4.11
1.32
102.78
Au Eq and Ag Eq values have all been adjusted to the silver-to-gold ratio of 78:1 for this news release.
2022 Exploration Program
The fundamental goal of the 2022 exploration program was to identify new precious metal-rich VMS deposits across the Consolidated Eskay Project through early-stage work including mapping and geochemical sampling, and more advanced work including widely spaced drilling. During the 2022 exploration season, Eskay Mining successfully completed 29,500m of diamond drilling along the TV-Jeff corridor and along the Scarlet Ridge-Tarn Lake trend.
Drill results discussed in this news release come from holes drilled in the vicinity of the TV deposit and the newly discovered Tarn Lake mineralizing system. As of this news release, all assays have returned from the 2022 drill program.
Au Eq and Ag Eq Calculations and True Width:
Note on use of Au eq (Au eq=Au+Ag/78) and Ag eq (Ag eq=Au*78+Ag): Mineralization at the TV and Jeff deposits displays similar characteristics and mineralogy to the Eskay Creek deposit and therefore for Au eq, and Au:Ag, a ratio of 78:1 is used and Au eq and Ag eq values are deemed to be reasonable based on assumed gold recovery (84.2%) and silver recovery (87.3%) as reported in the Eskay Creek Project NI 43-101 Technical Report and Prefeasibility Study, British Columbia, Canada, Effective Date: 22 July, 2021, Prepared for: Skeena Resources Ltd., Prepared by: Absence Engineering Canada Inc.
True widths of reported intercepts are not fully understood at this time but given the moderately dipping tabular nature of these deposits and the steep angle of drilling, Eskay geologists estimate true widths represent approximately 70-90% of the reported drill intercept lengths.
QA/QC, Methodology Statement:
Halved HQ drill core samples are submitted to ALS Geochemistry in Terrace, British Columbia for preparation and analysis. ALS is accredited to the ISO/IEC 17025 standard for gold assays. All analytical methods include quality control standards inserted at set frequencies. The entire sample interval is crushed and homogenized, 250 g of the homogenized sample is pulped. All samples were analyzed for gold, silver, mercury, and a suite of 48 major and trace elements. Analysis for gold is by fire assay fusion followed by Inductively Coupled Plasma Atomic Emission Spectroscopy (ICP-AES) on 30 g of pulp. Analysis for silver is by fire assay and gravimetric analysis on 30 g of pulp. Mercury is analyzed using the trace Hg Inductively Coupled Plasma Mass Spectroscopy (ICP-MS) method. All other major and trace elements are analyzed by four-acid digestion followed by ICP-MS.
Historical rock chip sample data is sourced from Assessment Report AR19675 by Granges dated February 7, 1990. Eskay Mining is unable to fully verify this data, and it should be treated as such by the reader.
Dr. Quinton Hennigh, P. Geo., a Director of the Company and its technical adviser, a qualified person as defined by National Instrument 43-101, has reviewed and approved the technical contents of this news release.
About Eskay Mining Corp:
Eskay Mining Corp (TSX-V:ESK) is a TSX Venture Exchange listed company, headquartered in Toronto, Ontario. Eskay is an exploration company focused on the exploration and development of precious and base metals along the Eskay rift in a highly prolific region of northwest British Columbia known as the “Golden Triangle,” 70km northwest of Stewart, BC. The Company currently holds mineral tenures in this area comprised of 177 claims (52,600 hectares).
Neither the TSX Venture Exchange nor its Regulation Services Provider (as that term is defined in the policies of the TSX Venture Exchange) accepts responsibility for the adequacy or accuracy of this release.
Forward-Looking Statements: This Press Release contains forward-looking statements that involve risks and uncertainties, which may cause actual results to differ materially from the statements made. When used in this document, the words “may”, “would”, “could”, “will”, “intend”, “plan”, “anticipate”, “believe”, “estimate”, “expect” and similar expressions are intended to identify forward-looking statements. Such statements reflect our current views with respect to future events and are subject to risks and uncertainties. Many factors could cause our actual results to differ materially from the statements made, including those factors discussed in filings made by us with the Canadian securities regulatory authorities. Should one or more of these risks and uncertainties, such as actual results of current exploration programs, the general risks associated with the mining industry, the price of gold and other metals, currency and interest rate fluctuations, increased competition and general economic and market factors, occur or should assumptions underlying the forward looking statements prove incorrect, actual results may vary materially from those described herein as intended, planned, anticipated, or expected. We do not intend and do not assume any obligation to update these forward-looking statements, except as required by law. Shareholders are cautioned not to put undue reliance on such forward-looking statements.
Firm improves financial flexibility, eliminates mandatory annual principal payments under new all-revolver facility with more favorable terms, extended maturity date
STAMFORD, Conn.–(BUSINESS WIRE)– Information Services Group (ISG) (Nasdaq: III), a leading global technology research and advisory firm, today announced it has successfully amended its $140 million credit facility at more favorable terms, to improve the firm’s financial flexibility.
The new credit agreement amends the previous agreement entered into on March 10, 2020. Key updates include:
Converting the previous term and revolving loan into an all-revolving credit facility
Eliminating $4.3 million of mandatory annual principal payments due in 2023 and 2024
Extending the maturity date of the previous agreement by three years, to February 2028
“Our amended credit facility greatly enhances our financial flexibility and offers further validation of our robust business performance that enabled these enhancements,” said Michael P. Connors, chairman and CEO of ISG. “We thank our lenders for their partnership and confidence in our ability to deliver long-term sustainable growth and value for our shareholders.”
BofA Securities Inc. was the Sole Lead Arranger and Sole Bookrunner on the transaction.
Additional details about the amended credit agreement can be found in the Form 8-K ISG filed today with the U.S. Securities and Exchange Commission, a link to which can be found on ISG’s website.
Forward-Looking Statements
This communication contains “forward-looking statements” which represent the current expectations and beliefs of management of ISG concerning future events and their potential effects. Statements contained herein including words such as “anticipate,” “believe,” “contemplate,” “plan,” “estimate,” “target,” “expect,” “intend,” “will,” “continue,” “should,” “may,” and other similar expressions, are “forward-looking statements” under the Private Securities Litigation Reform Act of 1995. These forward-looking statements are not guarantees of future results and are subject to certain risks and uncertainties that could cause actual results to differ materially from those anticipated. Those risks relate to inherent business, economic and competitive uncertainties and contingencies relating to the businesses of ISG and its subsidiaries including without limitation: (1) failure to secure new engagements or loss of important clients; (2) ability to hire and retain enough qualified employees to support operations; (3) ability to maintain or increase billing and utilization rates; (4) management of growth; (5) success of expansion internationally; (6) competition; (7) ability to move the product mix into higher margin businesses; (8) general political and social conditions such as war, political unrest and terrorism; (9) healthcare and benefit cost management; (10) ability to protect ISG and its subsidiaries’ intellectual property or data and the intellectual property or data of others; (11) currency fluctuations and exchange rate adjustments; (12) ability to successfully consummate or integrate strategic acquisitions; (13) outbreaks of diseases, including coronavirus, or similar public health threats or fear of such an event; and (14) engagements may be terminated, delayed or reduced in scope by clients. Certain of these and other applicable risks, cautionary statements and factors that could cause actual results to differ from ISG’s forward-looking statements are included in ISG’s filings with the U.S. Securities and Exchange Commission. ISG undertakes no obligation to update or revise any forward-looking statements to reflect subsequent events or circumstances.
About ISG
ISG (Information Services Group) (Nasdaq: III) is a leading global technology research and advisory firm. A trusted business partner to more than 800 clients, including 75 of the world’s top 100 enterprises, ISG is committed to helping corporations, public sector organizations, and service and technology providers achieve operational excellence and faster growth. The firm specializes in digital transformation services, including automation, cloud and data analytics; sourcing advisory; managed governance and risk services; network carrier services; strategy and operations design; change management; market intelligence and technology research and analysis. Founded in 2006, and based in Stamford, Conn., ISG employs more than 1,300 digital-ready professionals operating in more than 20 countries—a global team known for its innovative thinking, market influence, deep industry and technology expertise, and world-class research and analytical capabilities based on the industry’s most comprehensive marketplace data. For more information, visit www.isg-one.com.
Company Focuses on Development of Neuromuscular Blocking Agents
Phase II Randomized Trial for BX1000 Initiated, Positive Interim Results Announced; Completion of Study Enrollment Expected Q1 2023, Top Line Results Expected Early Q2 2023
BX2000 Dose Escalation Study Progressing
$5 Million in Financing Secured through Public Offering
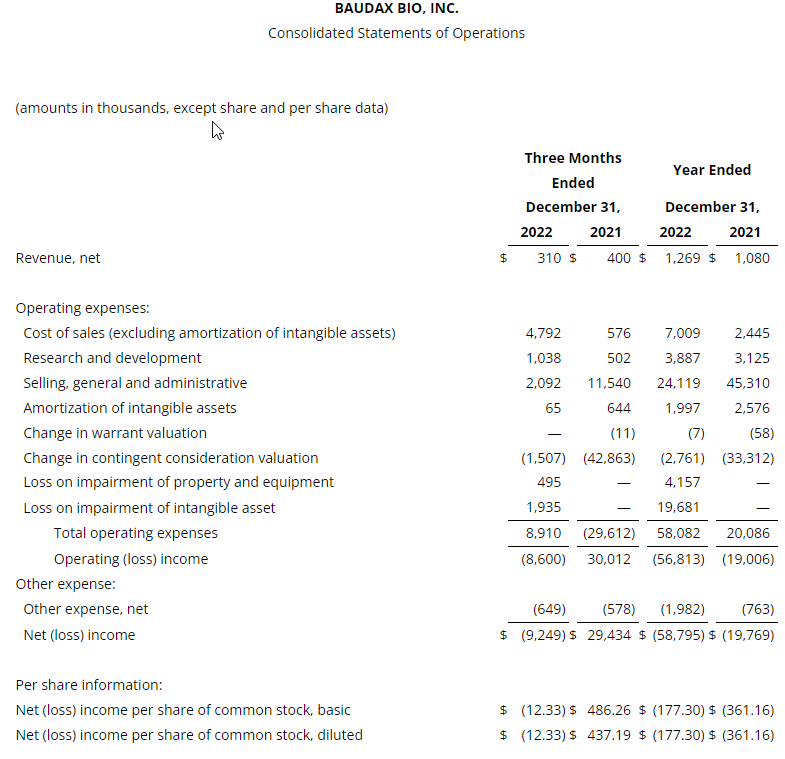
MALVERN, Pa., Feb. 23, 2023 (GLOBE NEWSWIRE) — Baudax Bio, Inc. (Nasdaq:BXRX) (the “Company”), a pharmaceutical company focused on innovative products for hospital and related settings, today reported financial results for the fourth quarter and year ended December 31, 2022, updated the status of the neuromuscular blocking (NMB) agent development program, and provided an overview of other corporate and financial developments.
“During our fourth quarter we refocused our priorities on our NMB portfolio, initiating our Phase II trial for BX1000 and advancing our Phase I dose escalation trial for BX2000,” said Gerri Henwood, Baudax Bio’s President and Chief Executive Officer. “The encouraging interim data we announced from the BX1000 trial showed all patients treated to date have met the criteria for Good or Excellent intubating conditions at 60 seconds, and that BX1000 has been generally well tolerated. We believe these data speak to the potential of our NMB portfolio to improve patient management and deliver cost efficiencies in procedures where NMB is required. We expect to complete enrollment in the BX1000 trial during the first quarter of 2023, and to announce top line data early in the second quarter of 2023. Concurrently, BX2000, our ultrashort acting NMB, is continuing through its dose escalation study, which we expect to complete by the end of 2023. BX3000, our NMB reversal agent, remains on track, and we expect to complete the nonclinical and manufacturing studies needed to support an IND filing for BX3000, the NMB reversal agent in the summer of 2023. Data from these trials will provide us with insight on the profiles of the two blocking agents, which will contribute to decisions to move forward later in 2023.”
“Due to persistent economic challenges facing hospitals, as previously disclosed, we have taken the strategic decision to discontinue commercialization of ANJESO,” continued Ms. Henwood. “We continue to believe in ANJESO’s advantages over other non-opioid pain therapies, as well as its potential to overcome many of the issues associated with commonly prescribed opioid therapeutics.”
Fourth Quarter 2022 and Recent Business Highlights
NMBs
BX1000 (IV Intermediate duration of action). Results for a planned interim analysis of the Phase II trial for BX1000 were announced in January 2023. This randomized, double-blind, active-controlled clinical trial comparing three different doses of BX1000 to a standard dose of rocuronium (rocuronium bromide 0.6 mg/kg IV Bolus) is planned to enroll a total of 80 adult patients undergoing elective surgery utilizing total intravenous anesthesia currently at a single clinical site in the U.S. The primary efficacy endpoint is the proportion of patients meeting criteria for Good or Excellent intubating conditions using a standardized scale. Additionally, the trial is evaluating the safety and tolerability profile of BX1000 and rocuronium in this patient population.
BX1000 Interim Data. The pre-planned interim analysis evaluated the intubating conditions for each randomized patient after administration of study drug in a blinded fashion. In the 20-patient cohort, 5 patients per group received one of the study medications. All 20 patients were observed to have met the criteria for Good or Excellent intubating conditions at 60 seconds. Nineteen of the subjects were successfully intubated following the assessment at 60 seconds, with one remaining subject successfully intubated following the assessment at 90 seconds. Study treatments were generally well tolerated with no occurrence of severe or serious adverse events. This blinded interim analysis did not result in the decision to drop any of the four study groups nor any decision to adjust planned study enrollment numbers.
BX2000 (IV Ultra-short duration of action). Cohort enrollment is ongoing for the Phase I dose escalation study evaluating the safety, tolerability, and pharmacokinetics of BX2000 in intubated healthy volunteers. This study is comprised of likely seven or eight dosing cohorts and each cohort is planned to enroll eight patients. The first and second cohorts have been dosed and enrollment of the third cohort is underway. The Company expects to complete enrollment of the remaining cohorts in the study by the end of 2023.
BX3000 (Reversal agent). Baudax Bio expects to complete nonclinical studies and manufacturing data required to support the IND for BX3000 in the summer of 2023. Early single agent clinical trials of BX3000 will not require intubation and so would be expected to progress quickly once the IND is active, and trials are ready to initiate. The Company believes progress towards a reversal study using BX3000 in patients who have received BX1000 could begin before the end of 2023.
The Company believes the data from the ongoing clinical trials for BX1000 and BX2000 will contribute to decisions to move forward later in 2023.
ANJESO
ANJESO U.S. Commercialization Discontinued. Despite having distinct benefits as the first and only once-daily, non-opioid IV analgesic, market conditions are not favorable for the introduction and commercialization of a new pain management product in the hospital market. As a result, Baudax Bio has formally discontinued the commercialization of ANJESO and the product is currently on hold due to these business conditions.
Corporate and Financial
Closed $5 million public offering – on December 6, 2022 the Company closed a public offering of an aggregate of 1,042,787 shares of its common stock (or pre-funded warrants in lieu thereof), Series A-3 warrants to purchase up to 1,042,787 shares of common stock and Series A-4 warrants to purchase 1,042,787 shares of common stock, at a combined public offering price of $4.795 per share (or pre-funded warrant) and accompanying warrants. The Series A-3 warrants have an exercise price of $4.50 per share, are exercisable immediately upon issuance and expire five years from the date of issuance, and the Series A-4 warrants have an exercise price of $4.50 per share, are exercisable immediately and expire thirteen months from the date of issuance. The Company intends to use the net proceeds from this offering for working capital, pipeline development activities and general corporate purposes. In January 2023, 961,787 warrants were exercised providing $4.3 million in cash to the Company.
Financial Results for the Three Months Ended December 31, 2022
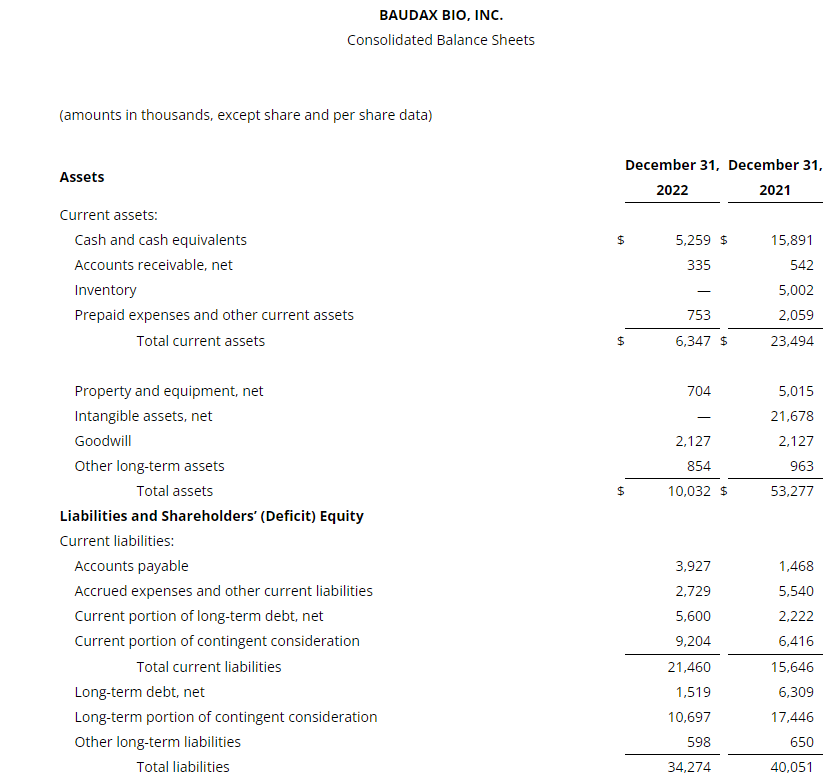
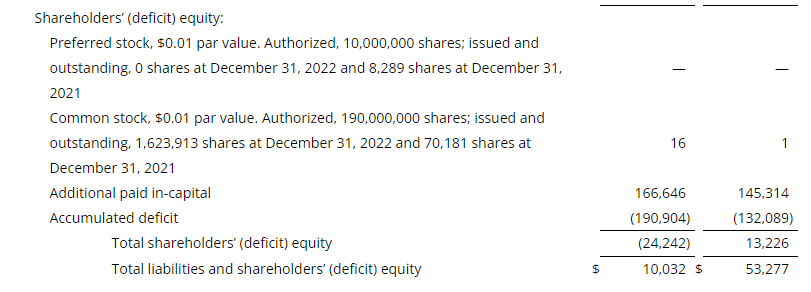
As of December 31, 2022, Baudax had cash and cash equivalents of $5.3 million.
Net product revenue related to sales of ANJESO in the U.S., recognized according to U.S. GAAP, for the three months ended December 31, 2022 was $0.3 million. This compares to $0.4 million for the three months ended December 31, 2021, a decrease of $0.1 million, resulting from the impact of the reduction in our field staff in 2022 and the impact of our discontinuation of commercialization in the fourth quarter of 2022. While utilizing the title model of distribution, product revenue was recognized as shipments were made to the Company’s third-party logistics provider.
Cost of sales for the three months ended December 31, 2022 was $4.8 million, compared to $0.6 million for the three months ended December 31, 2021, an increase of $4.2 million, and consisted of product costs, royalty expense and certain fixed costs associated with the manufacturing of ANJESO, including supply chain and quality costs. The increase of $4.2 million was primarily a result of an increase in the non-cash charge for inventory reserve expense of $4.4 million, partially offset by the decrease in fixed personnel related costs of $0.2 million. Certain product costs of ANJESO units recognized as revenue during the three months ended December 31, 2022 and 2021 were expensed prior to the FDA approval of ANJESO in February 2020, and therefore are not included in cost of sales during the related periods.
Research and development expense for the three months ended December 31, 2022 was $1.0 million compared to $0.5 million for the three months ended December 31, 2021, an increase of $0.5 million, which was a result of an increase in NMB clinical trial costs of $0.9 million, partially offset by a decrease in personnel costs of $0.3 million.
Selling, general and administrative expenses for the three months ended December 31, 2022 were $2.1 million, of which $0.2 million was attributable to selling expense and $1.9 million was attributable to general and administrative expense. This compares to $11.5 million for the same prior year period, of which $6.5 million was attributable to selling expense and $5.0 million was attributable to general and administrative expense. Selling expenses decreased $6.3 million, primarily as a result of a reduction in personnel costs of $4.4 million, a decrease in marketing costs of $1.6 million and a decrease in associated travel expenses of $0.3 million. The decrease of $3.1 million in general and administrative costs was primarily a result of a decrease in personnel costs of $2.2 million, a decrease in public company costs of $0.5 million and a decrease in both consulting costs and travel expenses of $0.2 million.
As a result of the discontinuation of commercialization of ANJESO, Baudax Bio evaluated the intangible asset carrying value attributed to ANJESO as of December 31, 2022 and recorded a non-cash impairment loss of $1.9 million to eliminate the carrying value of the asset. The value of its construction in progress related to the construction of an additional manufacturing suite for ANJESO was further reduced by $0.5 million.
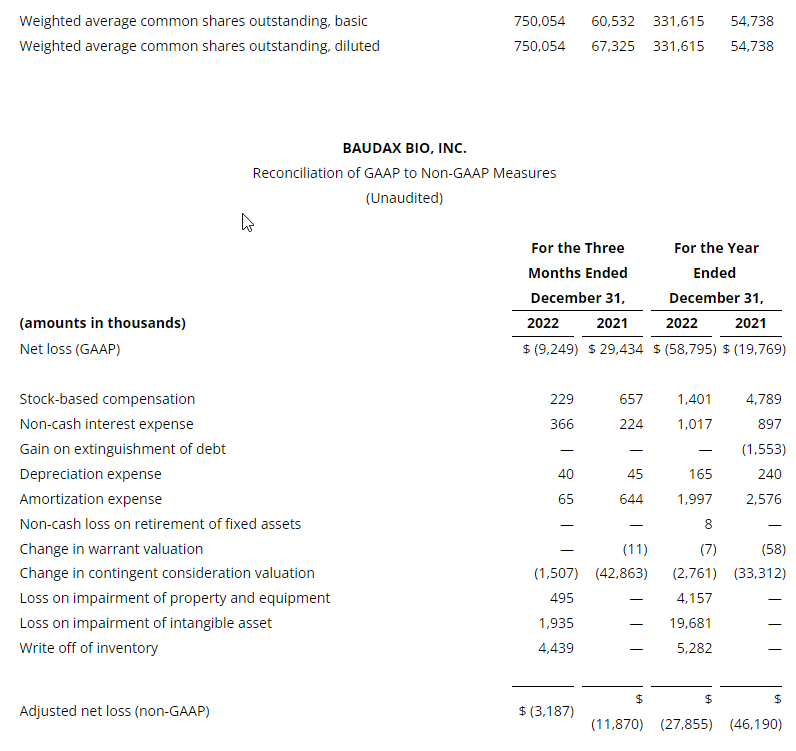
Baudax Bio reported net loss of $9.2 million, or $(12.33) per share, including non-cash charges of $6.1 million (primarily related to the inventory reserve expense discussed above), for the three months ended December 31, 2022. Adjusted net loss* was $3.1 million for the three months ended December 31, 2022. Net income for the three months ended December 31, 2021 was $29.4 million, or $437.19 per diluted share, including a non-cash benefit of $41.3 million. Adjusted net loss* was $11.9 million for the three months ended December 31, 2021.
Financial Results for the Year Ended December 31, 2022
Net product revenue related to sales of ANJESO in the U.S., recognized according to U.S. GAAP, for the year ended December 31, 2022 was $1.3 million. This compares to $1.1 million for the year ended December 31, 2021, an increase of $0.2 million, which was attributable to increased demand at existing accounts. While utilizing the title model of distribution, product revenue was recognized as shipments were made to the Company’s third-party logistics provider.
Cost of sales for the year ended December 31, 2022 was $7.0 million, compared to $2.4 million for the year ended December 31, 2021, an increase of $4.6 million, and consisted of product costs, royalty expense and certain fixed costs associated with the manufacturing of ANJESO, including supply chain and quality costs. The increase of $4.6 million was primarily a result of the increase in the non-cash charge for inventory reserve expense of $5.2 million, partially offset by the reduction in personnel related costs of $0.4 million and the reduction in production and storage costs of $0.2 million. Certain product costs of ANJESO units recognized as revenue during the year ended December 31, 2022 and 2021 were expensed prior to the FDA approval of ANJESO in February 2020, and therefore are not included in cost of sales during the related periods.
Research and development expenses for the year ended December 31, 2022 were $3.9 million compared to $3.1 million for the year ended December 31, 2021. The increase of $0.8 million was primarily due to the increase in the NMB portfolio clinical trial costs of $1.0 million and an increase of $0.2 million related to the pediatric clinical trial costs for ANJESO. These costs were partially offset by a decrease in personnel related costs of $0.4 million.
Selling, general and administrative expenses for the year ended December 31, 2022 were $24.1 million, of which $9.4 million was attributable to selling expense and $14.7 million was attributable to general and administrative expense. This compares to $45.3 million for the same prior year period, of which $22.4 million was attributable to selling expense and $22.9 million was attributable to general and administrative expense. Selling expenses decreased $13.0 million, primarily as a result of a reduction in personnel costs of $7.9 million, a decrease in marketing costs of $4.7 million and a decrease in travel expenses of $0.4 million compared to 2021. The decrease of $8.2 million in general and administrative expenses was primarily a result of a decrease in personnel costs of $4.7 million, a decrease in public company costs of $2.3 million, a decrease in consulting costs of $0.9 million and a decrease in other costs of $0.3 million.
As a result of the discontinuation of commercialization of ANJESO, Baudax Bio evaluated the intangible asset carrying value attributed to ANJESO as of December 31, 2022 and recorded a non-cash impairment loss of $19.7 million to eliminate the carrying value of the asset. Additionally, the value of its construction in progress related to the construction of an additional manufacturing suite for ANJESO was reduced by $4.2 million.
Baudax Bio reported net loss of $58.8 million, or $(177.30) per share, including net non-cash charges of $30.9 million, for the year ended December 31, 2022. Adjusted net loss* was $27.9 million for the year ended December 31, 2022. For the year ended December 31, 2021 net loss was $19.8 million, or $(361.16) per share, including net non-cash benefit of $26.4 million. Adjusted net loss* was $46.2 million for the year ended December 31, 2021.
Non-GAAP Financial Measures
To supplement the Company’s financial results determined by U.S. generally accepted accounting principles (“GAAP”), the Company is reporting certain non-GAAP information for its business, including adjusted net loss. Adjusted net loss is net loss as determined under GAAP, excluding the changes in fair values of contingent consideration and warrant valuations, gain on extinguishment of debt, interest, depreciation, amortization, stock-based compensation, losses on impairment of construction in progress and intangible assets and the write off of inventory. The Company believes this non-GAAP financial measure is helpful in understanding its business as it is useful to investors in allowing for greater transparency of supplemental information used by management. This measure is used by investors, as well as management in assessing the Company’s performance. Non-GAAP financial measures should be considered in addition to, but not as a substitute for, reported GAAP results. Further, Non-GAAP financial measures, even if similarly titled, may not be calculated in the same manner by all companies, and therefore should not be compared. Please see the section of this press release titled “Reconciliation of GAAP to Non-GAAP Financial Measures” for a reconciliation of non-GAAP adjusted net loss to its most directly comparable GAAP measure.
About Baudax Bio
Baudax Bio is a pharmaceutical company focused on innovative products for hospital and related settings. The Company has a pipeline of innovative pharmaceutical assets including two clinical-stage, novel neuromuscular blocking (NMBs) agents, one undergoing a Phase II clinical trial and an additional unique NMB undergoing a dose escalation Phase I clinical trial, as well as a proprietary chemical reversal agent specific to these NMBs, which is currently undergoing nonclinical and manufacturing studies to prepare for an expected IND filing in the summer of 2023. For more information, please visit www.baudaxbio.com.
Forward Looking Statements
This press release contains forward-looking statements that involve risks and uncertainties. Such forward-looking statements reflect Baudax Bio’s expectations about its future performance and opportunities that involve substantial risks and uncertainties. When used herein, the words “anticipate,” “believe,” “estimate,” “may,” “upcoming,” “plan,” “target,” “goal,” “intend” and “expect” and similar expressions, as they relate to Baudax Bio or its management, are intended to identify such forward-looking statements. These forward-looking statements are based on information available to Baudax Bio as of the date of publication on this internet site and are subject to a number of risks, uncertainties, and other factors that could cause Baudax Bio’s performance to differ materially from those expressed in, or implied by, these forward-looking statements. These risks and uncertainties include, among other things, risks related to market, economic and other conditions, the ongoing economic and social consequences of the COVID-19 pandemic, Baudax Bio’s ability to advance its current product candidate pipeline through pre-clinical studies and clinical trials, Baudax Bio’s ability to raise future financing for continued development of its product candidates such as BX1000, BX2000 and BX3000, Baudax Bio’s ability to pay its debt and satisfy conditions necessary to access future tranches of debt, Baudax Bio’s ability to comply with the financial and other covenants under its credit facility, Baudax Bio’s ability to manage costs and execute on its operational and budget plans, Baudax Bio’s ability to achieve its financial goals; Baudax Bio’s ability to maintain listing on the Nasdaq Capital Market; and Baudax Bio’s ability to obtain, maintain and successfully enforce adequate patent and other intellectual property protection. These forward-looking statements should be considered together with the risks and uncertainties that may affect Baudax Bio’s business and future results included in Baudax Bio’s filings with the Securities and Exchange Commission at www.sec.gov. These forward-looking statements are based on information currently available to Baudax Bio, and Baudax Bio assumes no obligation to update any forward-looking statements except as required by applicable law.
To supplement the Company’s financial results determined by U.S. generally accepted accounting principles (“GAAP”), the Company has disclosed in the tables below the following non-GAAP information about adjusted net loss.
Adjusted net loss is net loss as determined under GAAP, excluding the changes in fair values of contingent consideration and warrant valuations, gain on extinguishment of debt, interest, depreciation, amortization, stock-based compensation, losses on impairment of construction in progress and intangible assets and the write off of inventory.
The Company believes that non-GAAP financial measures are helpful in understanding its business as it is useful to investors in allowing for greater transparency of supplemental information used by management. Adjusted net loss is used by investors, as well as management in assessing the Company’s performance. Non-GAAP financial measures should be considered in addition to, but not as a substitute for, reported GAAP results. Further, Non-GAAP financial measures, even if similarly titled, may not be calculated in the same manner by all companies, and therefore should not be compared.
Robert LeBoyer, Vice President, Research Analyst, Life Sciences , Noble Capital Markets, Inc.
Refer to the bottom of the report for important disclosures
Webinar. BIO (Biotechnology Innovation Organization, an industry group) sponsored a webinar titled, “Long COVID: What Will It Take To Accelerate Therapeutic Progress?” Speakers included officials from government, academia, and drug development companies to discuss the scientific basis of the condition, its public health implications, and its potential treatments. Presenting companies included Axcella Health (AXLA) and Tonix Pharmaceuticals (TNXP).
Long COVID Symptoms and Prevalence. The program began with how Long COVID became recognized as a condition, its incidence, and its patient population. Scientific presentations showed the biological effects of the SARS-CoV-2 virus on cells in the body, including the connection between Long COVID and other chronic conditions such as CFS/ME (chronic fatigue syndrome/myalgic encephalomyelitis). Symptoms and their duration can vary widely, including inflammation, fatigue, organ dysfunction, and reactivation of latent viral reservoirs. The presenters agreed that the range of symptoms and their variability will require numerous drugs.
Axcella Health Presented AXA1125. Chief Scientific Officer at Axcella Health, Dr. Margaret Koziel, presented the scientific basis for the use of AXA1125 in Long COVID, including its effects on inflammation, mitochondrial dysfunction, and fatigue. Data from the Phase 2a trial was presented, showing improvements in function, and biomarkers that correlate with reductions in inflammation and mitochondrial dysfunction. The design of the Phase 2b/3 trial was also presented.
Tonix Pharmaceuticals Presented Data From TNX-102 SL. Tonix is currently enrolling patients in its Phase 2 PREVAIL trial testing TNX-102 SL, sublingual cyclobenzaprine, in Long COVID. This trial is based on common symptoms with fibromyalgia and chronic fatigue syndrome, such as pain, fatigue, and insomnia. Projected enrollment is about 470 patients with a primary endpoint of change in daily pain score from baseline over the 14-week treatment period.
Conclusion. The BIO webinar speakers agreed that the high variability and large population would require several drugs to adequately treat patients. For Axcella, we believe the presentation could raise awareness of AXA1125 and its “Phase 2b/3 Ready” status, allowing it obtain trial funding through partnerships, government funding, or from investors. Tonix was able to present how TNX-102 SL overlaps with other pain syndromes and how it could treat symptoms, as well as to highlight its clinical milestones in the coming year.
Summary. BIO (Biotechnology Innovation Organization, and industry group) sponsored a webinar titled, “Long COVID: What Will It Take To Accelerate Therapeutic Progress?” Speakers included officials from government, academia, and drug development companies to discuss the scientific basis of the condition, its public health implications, and its potential treatments. Presenting companies included Axcella Health (AXLS) and Tonix Pharmaceuticals (TNXP).
The program began with the history of Long COVID, how it became recognized as a condition, and its prevalence. Scientific presentations discussed the SARS-CoV-2 viral infection and its effects on different organs, as well as the mechanisms of infection that lead to fatigue, cerebral effects (brain fog), and chronic pain. The speakers pointed out that the range and severity of symptoms can vary widely, making it likely that numerous drugs will be needed.
The overlap between Long COVID and other chronic conditions, such as CFS/ME (chronic fatigue syndrome/myalgic encephalomyelitis), was also discussed. The common features in these conditions were cited in the “National Research Action Plan on Long COVID”, published by the Department of Health and Human Services in August 2022.
Axcella Health Spoke About AXA1125. Chief Scientific Officer at Axcella Health, Dr. Margaret Koziel, presented the scientific basis for the use of AXA1125 in Long COVID, including its effect on inflammation, mitochondrial dysfunction, epithelial dysfunction, and fatigue. Data from the Phase 2a trial was presented, showing improvements in physical and mental function. These data included biomarkers that correlate with improvements in inflammation and mitochondrial function. The design of the Phase 2b/3 trial was also presented.
Tonix Pharmaceuticals Presented Data From TNX-102 SL. Tonix is currently enrolling patients in its Phase 2 PREVAIL trial testing TNX-102 SL, sublingual cyclobenzaprine, in Long COVID. This trial is based on common symptoms with fibromyalgia and chronic fatigue syndrome, such as pain, fatigue, and insomnia. Projected enrollment is about 470 patients with a primary endpoint of change in daily pain score from baseline over the 14-week treatment period.
TNX-102 SL showed positive results in its Phase 3 RELIEF study in fibromyalgia, although the confirmatory Phase 3 RALLY missed its primary endpoint. After analyzing the RALLY trial, the Phase 3 RESILIENT trial began. An interim analysis from the RESILIENT trial is expected in 2Q23.
Conclusion. The BIO webinar gave different perspectives on Long COVID and discussed different approaches to treatment. For Axcella, we believe the presentation could raise awareness of AXA1125 data and its “Phase 2b/3” ready status, allowing it obtain trial funding through partnerships, government funding, or from investors. For Tonix, presentations on the common features of Long COVID and chronic pain syndromes support the use of Tonix’s TNX-102 SL, and show how its Phase 2 PREVAIL clinical trial design could become an effective treatment.
All statements or opinions contained herein that include the words “we”, “us”, or “our” are solely the responsibility of Noble Capital Markets, Inc.(“Noble”) and do not necessarily reflect statements or opinions expressed by any person or party affiliated with the company mentioned in this report. Any opinions expressed herein are subject to change without notice. All information provided herein is based on public and non-public information believed to be accurate and reliable, but is not necessarily complete and cannot be guaranteed. No judgment is hereby expressed or should be implied as to the suitability of any security described herein for any specific investor or any specific investment portfolio. The decision to undertake any investment regarding the security mentioned herein should be made by each reader of this publication based on its own appraisal of the implications and risks of such decision.
This publication is intended for information purposes only and shall not constitute an offer to buy/sell or the solicitation of an offer to buy/sell any security mentioned in this report, nor shall there be any sale of the security herein in any state or domicile in which said offer, solicitation or sale would be unlawful prior to registration or qualification under the securities laws of any such state or domicile. This publication and all information, comments, statements or opinions contained or expressed herein are applicable only as of the date of this publication and subject to change without prior notice. Past performance is not indicative of future results. Noble accepts no liability for loss arising from the use of the material in this report, except that this exclusion of liability does not apply to the extent that such liability arises under specific statutes or regulations applicable to Noble. This report is not to be relied upon as a substitute for the exercising of independent judgement. Noble may have published, and may in the future publish, other research reports that are inconsistent with, and reach different conclusions from, the information provided in this report. Noble is under no obligation to bring to the attention of any recipient of this report, any past or future reports. Investors should only consider this report as single factor in making an investment decision.
IMPORTANT DISCLOSURES
This publication is confidential for the information of the addressee only and may not be reproduced in whole or in part, copies circulated, or discussed to another party, without the written consent of Noble Capital Markets, Inc. (“Noble”). Noble seeks to update its research as appropriate, but may be unable to do so based upon various regulatory constraints. Research reports are not published at regular intervals; publication times and dates are based upon the analyst’s judgement. Noble professionals including traders, salespeople and investment bankers may provide written or oral market commentary, or discuss trading strategies to Noble clients and the Noble proprietary trading desk that reflect opinions that are contrary to the opinions expressed in this research report. The majority of companies that Noble follows are emerging growth companies. Securities in these companies involve a higher degree of risk and more volatility than the securities of more established companies. The securities discussed in Noble research reports may not be suitable for some investors and as such, investors must take extra care and make their own determination of the appropriateness of an investment based upon risk tolerance, investment objectives and financial status.
Company Specific Disclosures
The following disclosures relate to relationships between Noble and the company (the “Company”) covered by the Noble Research Division and referred to in this research report. Noble is not a market maker in any of the companies mentioned in this report. Noble intends to seek compensation for investment banking services and non-investment banking services (securities and non-securities related) with any or all of the companies mentioned in this report within the next 3 months
ANALYST CREDENTIALS, PROFESSIONAL DESIGNATIONS, AND EXPERIENCE
Senior Equity Analyst focusing on Basic Materials & Mining. 20 years of experience in equity research. BA in Business Administration from Westminster College. MBA with a Finance concentration from the University of Missouri. MA in International Affairs from Washington University in St. Louis. Named WSJ ‘Best on the Street’ Analyst and Forbes/StarMine’s “Best Brokerage Analyst.” FINRA licenses 7, 24, 63, 87
WARNING
This report is intended to provide general securities advice, and does not purport to make any recommendation that any securities transaction is appropriate for any recipient particular investment objectives, financial situation or particular needs. Prior to making any investment decision, recipients should assess, or seek advice from their advisors, on whether any relevant part of this report is appropriate to their individual circumstances. If a recipient was referred to Noble Capital Markets, Inc. by an investment advisor, that advisor may receive a benefit in respect of transactions effected on the recipients behalf, details of which will be available on request in regard to a transaction that involves a personalized securities recommendation. Additional risks associated with the security mentioned in this report that might impede achievement of the target can be found in its initial report issued by Noble Capital Markets, Inc.. This report may not be reproduced, distributed or published for any purpose unless authorized by Noble Capital Markets, Inc..
RESEARCH ANALYST CERTIFICATION
Independence Of View All views expressed in this report accurately reflect my personal views about the subject securities or issuers.
Receipt of Compensation No part of my compensation was, is, or will be directly or indirectly related to any specific recommendations or views expressed in the public appearance and/or research report.
Ownership and Material Conflicts of Interest Neither I nor anybody in my household has a financial interest in the securities of the subject company or any other company mentioned in this report.
No two hearts beat alike. The size and shape of the heart can vary from one person to the next. These differences can be particularly pronounced for people living with heart disease, as their hearts and major vessels work harder to overcome any compromised function.
MIT engineers are hoping to help doctors tailor treatments to patients’ specific heart form and function, with a custom robotic heart. The team has developed a procedure to 3D print a soft and flexible replica of a patient’s heart. They can then control the replica’s action to mimic that patient’s blood-pumping ability.
The procedure involves first converting medical images of a patient’s heart into a three-dimensional computer model, which the researchers can then 3D print using a polymer-based ink. The result is a soft, flexible shell in the exact shape of the patient’s own heart. The team can also use this approach to print a patient’s aorta — the major artery that carries blood out of the heart to the rest of the body.
To mimic the heart’s pumping action, the team has fabricated sleeves similar to blood pressure cuffs that wrap around a printed heart and aorta. The underside of each sleeve resembles precisely patterned bubble wrap. When the sleeve is connected to a pneumatic system, researchers can tune the outflowing air to rhythmically inflate the sleeve’s bubbles and contract the heart, mimicking its pumping action.
The researchers can also inflate a separate sleeve surrounding a printed aorta to constrict the vessel. This constriction, they say, can be tuned to mimic aortic stenosis — a condition in which the aortic valve narrows, causing the heart to work harder to force blood through the body.
Doctors commonly treat aortic stenosis by surgically implanting a synthetic valve designed to widen the aorta’s natural valve. In the future, the team says that doctors could potentially use their new procedure to first print a patient’s heart and aorta, then implant a variety of valves into the printed model to see which design results in the best function and fit for that particular patient. The heart replicas could also be used by research labs and the medical device industry as realistic platforms for testing therapies for various types of heart disease.
“All hearts are different,” says Luca Rosalia, a graduate student in the MIT-Harvard Program in Health Sciences and Technology. “There are massive variations, especially when patients are sick. The advantage of our system is that we can recreate not just the form of a patient’s heart, but also its function in both physiology and disease.”
Rosalia and his colleagues report their results in a study appearing today in Science Robotics. MIT co-authors include Caglar Ozturk, Debkalpa Goswami, Jean Bonnemain, Sophie Wang, and Ellen Roche, along with Benjamin Bonner of Massachusetts General Hospital, James Weaver of Harvard University, and Christopher Nguyen, Rishi Puri, and Samir Kapadia at the Cleveland Clinic in Ohio.
Print and Pump
In January 2020, team members, led by mechanical engineering professor Ellen Roche, developed a “biorobotic hybrid heart” — a general replica of a heart, made from synthetic muscle containing small, inflatable cylinders, which they could control to mimic the contractions of a real beating heart.
Shortly after those efforts, the Covid-19 pandemic forced Roche’s lab, along with most others on campus, to temporarily close. Undeterred, Rosalia continued tweaking the heart-pumping design at home.
“I recreated the whole system in my dorm room that March,” Rosalia recalls.
Months later, the lab reopened, and the team continued where it left off, working to improve the control of the heart-pumping sleeve, which they tested in animal and computational models. They then expanded their approach to develop sleeves and heart replicas that are specific to individual patients. For this, they turned to 3D printing.
“There is a lot of interest in the medical field in using 3D printing technology to accurately recreate patient anatomy for use in preprocedural planning and training,” notes Wang, who is a vascular surgery resident at Beth Israel Deaconess Medical Center in Boston.
An Inclusive Design
In the new study, the team took advantage of 3D printing to produce custom replicas of actual patients’ hearts. They used a polymer-based ink that, once printed and cured, can squeeze and stretch, similarly to a real beating heart.
As their source material, the researchers used medical scans of 15 patients diagnosed with aortic stenosis. The team converted each patient’s images into a three-dimensional computer model of the patient’s left ventricle (the main pumping chamber of the heart) and aorta. They fed this model into a 3D printer to generate a soft, anatomically accurate shell of both the ventricle and vessel.
The team also fabricated sleeves to wrap around the printed forms. They tailored each sleeve’s pockets such that, when wrapped around their respective forms and connected to a small air pumping system, the sleeves could be tuned separately to realistically contract and constrict the printed models.
The researchers showed that for each model heart, they could accurately recreate the same heart-pumping pressures and flows that were previously measured in each respective patient.
“Being able to match the patients’ flows and pressures was very encouraging,” Roche says. “We’re not only printing the heart’s anatomy, but also replicating its mechanics and physiology. That’s the part that we get excited about.”
Going a step further, the team aimed to replicate some of the interventions that a handful of the patients underwent, to see whether the printed heart and vessel responded in the same way. Some patients had received valve implants designed to widen the aorta. Roche and her colleagues implanted similar valves in the printed aortas modeled after each patient. When they activated the printed heart to pump, they observed that the implanted valve produced similarly improved flows as in actual patients following their surgical implants.
Finally, the team used an actuated printed heart to compare implants of different sizes, to see which would result in the best fit and flow — something they envision clinicians could potentially do for their patients in the future.
“Patients would get their imaging done, which they do anyway, and we would use that to make this system, ideally within the day,” says co-author Nguyen. “Once it’s up and running, clinicians could test different valve types and sizes and see which works best, then use that to implant.”
Ultimately, Roche says the patient-specific replicas could help develop and identify ideal treatments for individuals with unique and challenging cardiac geometries.
“Designing inclusively for a large range of anatomies, and testing interventions across this range, may increase the addressable target population for minimally invasive procedures,” Roche says.
This research was supported, in part, by the National Science Foundation, the National Institutes of Health, and the National Heart Lung Blood Institute.
The Statement on Crypto Vulnerabilities by Regulators
A joint statement to banking organizations on “crypto-asset vulnerabilities” was just released by three bank regulatory agencies. Most banks in the U.S. fall under these three federal institutions overseeing them in a regulatory capacity. So when a statement regarding the health and stability of banks is made, it is often a joint statement from the three. At a minimum, statements include the Federal Reserve Bank (FRB), Office of the Controller of the Currency (OCC), and Federal Deposit Insurance Corp. (FDIC).
About the Statement
Issued on February 23rd, the multiple agencies felt a need to highlight liquidity risks presented by some “sources of funding” from crypto-asset-related entities, and practices they should be using to manage the risks.
The regulators remind banks that they are neither prohibited nor discouraged from offering banking services to this class of customer, but if they do, much of the existing risk management principles should be applied.
Related Liquidity Risks
Highlighted in the statement by the three bank regulatory bodies are key liquidity risks associated with crypto asset participants and crypto-asset organizations involved in banking and what they should be aware of.
This includes some sources of funding from crypto-asset-related entities that may pose heightened liquidity risks to those involved in banking due to the unpredictability of the scale and timing of deposit inflows and outflows, including, for example:
Deposits placed by a crypto-asset-related entity that is for the benefit of thecrypto-asset-related entity’s customers. The stability of the deposits, according to the statement, may be driven by the behavior of the end customer or asset sector dynamics, and not solely by the crypto-asset-related entity itself, which is the banking organization’s direct counterparty. The concern is the stability of the deposits may be influenced by, for example, periods of stress, market volatility, and related vulnerabilities in the crypto-asset sector, which may or may not be specific to the crypto-asset-related entity. Such deposits can be susceptible to large and rapid inflows as well as outflows when end customers react to crypto-asset-sector-related market events, media reports, and uncertainty. This uncertainty and resulting deposit volatility can be exacerbated by end customer confusion related to inaccurate or misleading representations of deposit insurance by a crypto-assetrelated entity.
Deposits that constitute stablecoin-related reserves. The stability of this type of deposit may be linked to demand for stablecoins according to the agencies, along with the confidence of stablecoin holders in the coin arrangement, and the stablecoin issuer’s reserve management practices. These deposits can be susceptible to large and rapid outflows stemming from, for unanticipated stablecoin redemptions or dislocations in crypto-asset markets.
More broadly, when a banking organization’s deposit funding base is concentrated in crypto-asset-related entities that are highly interconnected or share similar risk profiles, deposit fluctuations may also be correlated, and liquidity risk therefore may be further heightened, according to the statement.
Effective Risk Management Practices
In light of these hightened risks, agencies think it is critical for banks that use certain sources of funding from crypto-asset-related entities, as described earlier, to actively monitor the liquidity risks inherent in these sources of funding and to establish and maintain effective risk management and controls commensurate with the level of liquidity risks from these funding sources. Effective practices for these banking organizations could include:
Understanding the direct and indirect drivers of the potential behavior of deposits from crypto-asset-related entities and the extent to which those deposits are susceptible to unpredictible vulnerability.
Assessing potential concentration or interconnectedness across deposits from crypto-asset-related entities and the associated liquidity risks.
Incorporating the liquidity risks or funding volatility associated with crypto-asset-related deposits into contingency funding planning, including liquidity stress testing and, as appropriate, other asset-liability governance and risk management processes.
Performing significant due diligence and monitoring of crypto-related-entities that establish deposit accounts, including assessing the representations made by those crypto-asset-related entities to their end customers about the accounts – if innaccurate they could lead to to unexpected or rapid outflows.
Additionally, banks and banking organizations are required to comply with applicable laws and regulations. For FDIC insured institutions, this includes compliance with rules related to brokered deposits and Call Report filing requirements.
LOS ANGELES, Feb. 22, 2023 (GLOBE NEWSWIRE) — FAT (Fresh. Authentic. Tasty.) Brands Inc. (NASDAQ: FAT) (“FAT Brands” or the “Company”) today reported fourth quarter and full year 2022 financial results for the fiscal year ended December 25, 2022.
Andy Wiederhorn, President and CEO of FAT Brands, commented, “The fourth quarter marked yet another strong performance for FAT Brands, as evidenced by our robust unit development and profitable revenue growth. After a very active acquisition strategy in 2021, I am particularly pleased with the momentum of our organic growth strategy during 2022.”
“With over 140 store openings during 2022, we achieved a new milestone for FAT Brands, including 44 that opened in the fourth quarter. We plan to continue this robust unit growth with between 150 and 175 units slated to open in 2023. We are seeing strong new franchisee activity as well as continued demand from existing franchise partners to develop other brands within our portfolio, which is very encouraging as we look beyond our current unit development pipeline of over 1,000 locations representing 60% EBITDA growth over the next several years.”
“We are extremely impressed with how our 2021 acquisitions have seamlessly fit into our portfolio and the demand we are experiencing for them from our franchisee base. In addition to our organic growth momentum, we will lean into the expansion of our high-growth brands, particularly our sports lodge category, and continue to expand our factory business.”
“We also continue to work on reducing our cost of capital and are pursuing strategies to significantly reduce our leverage ratio over the next 24 to 36 months.”
Fiscal FourthQuarter 2022Highlights
Total revenue improved 39.9% to $103.8 million compared to $74.2 million in the fourth quarter of 2021
System-wide sales growth of 22.1% in the fourth quarter of 2022 compared to the prior year quarter
Year-to-date system-wide same-store sales growth of 2.7% in the fourth quarter of 2022 compared to the prior year
44 new store openings during the fourth quarter of 2022 and over 140 openings during the year
Net loss of $70.8 million, or $4.29 per diluted share, compared to $19.6 million, or $1.38 per diluted share, in the fourth quarter of 2021
Adjusted EBITDA(1) of $19.6 million compared to $10.4 million in the fourth quarter of 2021
Adjusted net loss(1) of $43.0 million, or $2.60 per diluted share, compared to $16.5 million, or $1.16 per diluted share, in the fourth quarter of 2021
Fiscal Year 2022 Highlights
Total revenue increased 242.5% to $407.2 million compared to $118.9 million in 2021
System-wide sales growth of 108.0% compared to 2021
Year-to-date system-wide same-store sales growth of 6.0% in 2022 compared to 2021
Over 140 new store openings during 2022
Net loss of $126.2 million, or $7.66 per diluted share, compared to $31.6 million, or $2.15 per diluted share, in 2021
Adjusted EBITDA(1) of $88.8 million compared to $21.1 million 2021
Adjusted net loss(1) of $80.9 million, or $4.91 per diluted share, compared to $20.6 million, or $1.41 per diluted share, in 2021
(1) EBITDA, Adjusted EBITDA and adjusted net loss are non-GAAP measures defined below, under “Non-GAAP Measures”. Reconciliation of GAAP net loss to EBITDA, adjusted EBITDA and adjusted net loss are included in the accompanying financial tables.
Summary of Fourth Quarter 2022 Financial Results
Total revenue increased $29.6 million, or 39.9%, in the fourth quarter of 2022, to $103.8 million compared to $74.2 million in the same period of 2021. The increase reflects revenue from the acquisition of Twin Peaks in October 2021, the acquisitions of Fazoli’s and Native Grill & Wings in December 2021 (collectively, the “2021 Acquisitions”) and the continuing recovery from the negative effects of the COVID-19 pandemic on royalties from restaurant sales.
Costs and expenses increased $59.5 million, or 77.3%, in the fourth quarter of 2022 to $136.4 million compared to $77.0 million in the same period in the prior year, primarily due to the 2021 Acquisitions.
General and administrative expense increased $17.6 million, or 81.4%, in the fourth quarter of 2022 compared to the same period in the prior year, primarily due to the 2021 Acquisitions, increased compensation costs, professional fees related to pending litigation and government investigations, and travel, reflecting the significant expansion of the organization.
Cost of restaurant and factory revenues totaled $61.7 million in the fourth quarter of 2022 and was related to the operations of the company-owned restaurant locations and our dough factory associated with the 2021 Acquisitions.
Depreciation and amortization increased $1.6 million, or 30.6% in the fourth quarter of 2022 compared to the same period in the prior year, primarily due to depreciation of company-owned restaurant property and equipment and amortizing intangible assets related to the 2021 Acquisitions.
Refranchising losses in the fourth quarter of 2022 were $3.1 million and were comprised of restaurant costs and expenses, net of food sales. Refranchising losses in the fourth quarter of 2021 were $1.0 million and were comprised of $2.1 million restaurant operating costs, net of food sales, partially offset by $1.1 million in net gains related to refranchised restaurants.
Advertising expenses increased $1.6 million in the fourth quarter of 2022 compared to the prior year period. These expenses vary in relation to advertising revenues and reflect advertising expenses related to the 2021 Acquisitions and the increase in customer activity as the recovery from COVID continues.
Total other expense, net for the fourth quarters of 2022 and 2021 was $24.2 million and $17.1 million, respectively, primarily comprised of net interest expense of $25.6 million and $16.4 million, respectively.
Adjusted net loss was $43.0 million, or $2.60 per diluted share, in the fourth quarter of 2022 compared to $16.5 million, or $1.16 per diluted share, in the fourth quarter of 2021.
Key Financial Definitions
New store openings – The number of new store openings reflects the number of stores opened during a particular reporting period. The total number of new stores per reporting period and the timing of stores openings has, and will continue to have, an impact on our results.
Same-store sales growth – Same-store sales growth reflects the change in year-over-year sales for the comparable store base, which we define as the number of stores open and in the FAT Brands system for at least one full fiscal year. For stores that were temporarily closed, sales in the current and prior period are adjusted accordingly. Given our focused marketing efforts and public excitement surrounding each opening, new stores often experience an initial start-up period with considerably higher than average sales volumes, which subsequently decrease to stabilized levels after three to six months. Additionally, when we acquire a brand, it may take several months to integrate fully each location of said brand into the FAT Brands platform. Thus, we do not include stores in the comparable base until they have been open and in the FAT Brands system for at least one full fiscal year. For 2022, the comparable store base does not include concepts acquired during the fourth quarter of 2021.
System-wide sales growth – System wide sales growth reflects the percentage change in sales in any given fiscal period compared to the prior fiscal period for all stores in that brand only when the brand is owned by FAT Brands. Because of acquisitions, new store openings and store closures, the stores open throughout both fiscal periods being compared may be different from period to period.
Conference Call and Webcast
FAT Brands will host a conference call and webcast to discuss its fiscal fourth quarter 2022 financial results today at 5:00 PM ET. Hosting the conference call and webcast will be Andy Wiederhorn, President and Chief Executive Officer, and Ken Kuick, Chief Financial Officer.
The conference call can be accessed live over the phone by dialing 1-877-704-4453 from the U.S. or 1-201-389-0920 internationally. A replay will be available after the call until Wednesday, March 1, 2023, and can be accessed by dialing 1-844-512-2921 from the U.S. or 1-412-317-6671 internationally. The passcode is 13735781. The webcast will be available at www.fatbrands.com under the “Investors” section and will be archived on the site shortly after the call has concluded.
About FAT (Fresh. Authentic. Tasty.) Brands
FAT Brands (NASDAQ: FAT) is a leading global franchising company that strategically acquires, markets, and develops fast casual, quick-service, casual dining, and polished casual dining concepts around the world. The Company currently owns 17 restaurant brands: Round Table Pizza, Fatburger, Marble Slab Creamery, Johnny Rockets, Fazoli’s, Twin Peaks, Great American Cookies, Hot Dog on a Stick, Buffalo’s Cafe & Express, Hurricane Grill & Wings, Pretzelmaker, Elevation Burger, Native Grill & Wings, Yalla Mediterranean and Ponderosa and Bonanza Steakhouses and franchises and owns approximately 2,300 units worldwide. For more information, please visit www.fatbrands.com.
Forward-Looking Statements
This press release contains forward-looking statements within the meaning of the Private Securities Litigation Reform Act of 1995, including statements relating to the future financial and operating results of the Company, estimates of future EBITDA, the timing and performance of new store openings, future reductions in cost of capital and leverage ratio, our ability to conduct future accretive acquisitions, our pipeline of new store locations, and the recovery of our business from the COVID-19 pandemic. Forward-looking statements generally use words such as “expect,” “foresee,” “anticipate,” “believe,” “project,” “should,” “estimate,” “will,” “plans,” “forecast,” and similar expressions, and reflect our expectations concerning the future. Forward-looking statements are subject to significant business, economic and competitive risks, uncertainties and contingencies, many of which are difficult to predict and beyond our control, which could cause our actual results to differ materially from the results expressed or implied in such forward-looking statements. We refer you to the documents that we file from time to time with the Securities and Exchange Commission, such as our reports on Form 10-K, Form 10-Q and Form 8-K, for a discussion of these and other risks and uncertainties that could cause our actual results to differ materially from our current expectations and from the forward-looking statements contained in this press release. We undertake no obligation to update any forward-looking statements to reflect events or circumstances occurring after the date of this press release.
Non-GAAP Measures (Unaudited)
This press release includes the non-GAAP financial measures of EBITDA, adjusted EBITDA and adjusted net loss.
EBITDA is defined as earnings before interest, taxes, and depreciation and amortization. We use the term EBITDA, as opposed to income from operations, as it is widely used by analysts, investors, and other interested parties to evaluate companies in our industry. We believe that EBITDA is an appropriate measure of operating performance because it eliminates the impact of expenses that do not relate to business performance. EBITDA is not a measure of our financial performance or liquidity that is determined in accordance with generally accepted accounting principles (“GAAP”), and should not be considered as an alternative to net income (loss) as a measure of financial performance or cash flows from operations as measures of liquidity, or any other performance measure derived in accordance with GAAP.
Adjusted EBITDA is defined as EBITDA (as defined above), excluding expenses related to acquisitions, refranchising gain or losses, impairment charges, and certain non-recurring or non-cash items that the Company does not believe directly reflect its core operations and may not be indicative of the Company’s recurring business operations.
Adjusted net loss is a supplemental measure of financial performance that is not required by or presented in accordance with GAAP. Adjusted net loss is defined as net loss plus the impact of adjustments and the tax effects of such adjustments. Adjusted net loss is presented because we believe it helps convey supplemental information to investors regarding our performance, excluding the impact of special items that affect the comparability of results in past quarters to expected results in future quarters. Adjusted net loss as presented may not be comparable to other similarly titled measures of other companies, and our presentation of adjusted net loss should not be construed as an inference that our future results will be unaffected by excluded or unusual items. Our management uses this non-GAAP financial measure to analyze changes in our underlying business from quarter to quarter based on comparable financial results.
Reconciliations of net loss presented in accordance with GAAP to EBITDA, adjusted EBITDA and adjusted net loss are set forth in the tables below.
NEW ALBANY, Ohio, Feb. 22, 2023 (GLOBE NEWSWIRE) — CVG (NASDAQ: CVGI) will hold its quarterly conference call on Tuesday, March 7, 2023, at 10:00 a.m. ET, to discuss fourth quarter and full year 2022 financial results. CVG will issue a press release and presentation prior to the conference call.
Toll-free participants dial (888) 396-8049 using conference code 33489158. International participants dial (416) 764-8646 using conference code 33489158. This call is being webcast and can be accessed through the “Investors” section of CVG’s website at ir.cvgrp.com where it will be archived for one year.
A telephonic replay of the conference call will be available until March 21, 2023. To access the replay, toll-free callers can dial (877) 674-7070 using access code 489158.
About CVG
At CVG, we deliver real solutions to complex design, engineering and manufacturing problems while creating positive change for our customers, industries, and communities we serve. Information about the Company and its products is available on the internet at www.cvgrp.com.
Investor Relations Contact: Ross Collins or Stephen Poe Alpha IR Group CVGI@alpha-ir.com