Key Points: – Roku will acquire Frndly TV for $185 million in cash, aiming to expand its affordable live and on-demand TV offerings. – Frndly TV offers 50+ family-friendly channels and unlimited DVR for $6.99/month, appealing to cost-conscious consumers. – The acquisition supports Roku’s platform revenue strategy while preserving Frndly TV’s availability across all major devices.
Roku (NASDAQ: ROKU) has announced a definitive agreement to acquire Frndly TV, a low-cost subscription streaming service offering live and on-demand television content. The $185 million all-cash deal is expected to close in the second quarter of 2025 and marks Roku’s latest effort to expand its content offerings and drive subscription revenue through its growing streaming platform.
Founded in 2019 and based in Denver, Colorado, Frndly TV has built a loyal subscriber base by offering more than 50 family-friendly channels—including A&E, Hallmark Channel, Lifetime, and The History Channel—for just $6.99 per month. The service also includes thousands of hours of on-demand content and unlimited cloud-based DVR functionality, appealing to value-conscious viewers seeking alternatives to more expensive cable or streaming bundles.
Roku, already the No. 1 TV streaming platform in the U.S. by hours streamed, sees the acquisition as a natural extension of its efforts to grow platform revenue and bolster its direct-to-consumer subscription business. In a competitive streaming landscape dominated by major players like Netflix, Disney+, and Amazon Prime Video, Roku’s focus on aggregation, accessibility, and affordability gives it a unique position to appeal to mainstream households and budget-conscious consumers.
“Frndly TV has carved out an impressive niche by delivering high-quality, feel-good programming at a very competitive price,” said Roku CEO Anthony Wood. “This acquisition enhances our ability to serve the growing segment of viewers seeking live TV without the high cost of traditional cable. It’s a move that supports both our customer-first philosophy and our monetization goals.”
The deal structure includes a $75 million performance-based holdback, contingent on Frndly TV achieving certain subscription and revenue milestones over the next two years. Frndly TV’s leadership team, including co-founder and CEO Andy Karofsky, will remain with the company post-acquisition to maintain continuity and support its growth within the Roku ecosystem.
Importantly, Frndly TV will continue to operate as a multi-platform service. It will remain available on Amazon Fire TV, Apple TV, Android and Google TV, Samsung and Vizio smart TVs, as well as on mobile apps and the web—ensuring that existing subscribers can continue accessing their content without disruption.
For Roku, the acquisition aligns with its broader strategy to offer comprehensive content at competitive price points while continuing to invest in its proprietary advertising and subscription infrastructure. The company has made it clear that adding subscription value—especially live TV and family-friendly entertainment—is a core component of its growth model moving forward.
This move also puts Roku in a stronger position to compete in the live TV space, where rivals like YouTube TV and Hulu + Live TV offer broader packages at significantly higher price points. By acquiring Frndly TV, Roku gains a differentiated product that serves an underserved market segment.
With stable subscriber growth, brand trust, and a growing library of original and licensed content, Roku’s purchase of Frndly TV is poised to pay long-term dividends, particularly as consumers continue to shift from traditional cable to more flexible and affordable streaming solutions.
A Focus on Profitability Drives A Strong Start to the Year
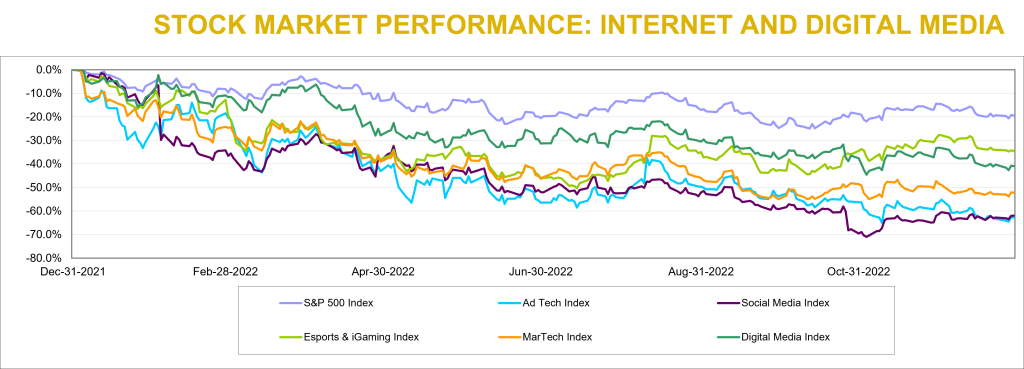
Last quarter we wrote that the S&P 500 increased for the first time since the fourth quarter of 2021 and that we were beginning to see signs of life in Noble’s Internet and Digital Media Indices as well. Those signs of life continued to bear fruit throughout the first quarter, as every one of Noble’s Internet and Digital Media Indices not only finished the quarter up, but significantly outperformed the S&P 500. The best performing index was Noble’s Social Media Index, which increased by 70% in the first quarter of 2023, followed by Noble’s eSports & iGaming Index (+32%), Ad Tech Index (+31%), MarTech Index (+30%), and Digital Media Index (+18%).
Noble’s Indices are market cap weighted, and we attribute the strength of the Social Media Index to its largest constituent, Meta Platforms (META; a.k.a. Facebook) whose shares increased by 76% in the first quarter. We attribute this increase to management’s 4Q 2022 earnings call when they spent most of their time talking about “efficiency”, which investors interpreted to mean that Meta was newly focused on profitability. After a relatively disastrous 3Q 2022 earnings call, after which shares fell by 25%, the company demonstrated on its 4Q 2022 earnings call that it clearly had
gotten the message: investors were not enamored about the company’s plans in October 2022 to spend billions of dollars to develop its Metaverse initiatives. Rather, on its fourth quarter call, management focused on driving its short form video initiative Reels (i.e., becoming more TikTok like), reducing its headcount by reducing layers of management, lowering its operating expenses and reducing its capital expenditures. Investors applauded this newfound focus on profitability and shares rebounded from a low of $88.90 per share in early November to $211.94 at the March quarter-end.
Noble’s eSports and iGaming Index increased by 32% as 9 of the 16 stocks in the index posted gains, the two largest market cap weighted stocks. Shares of the largest stock in the index, Flutter Entertainment (FLTR) increased by 31%) while shares of the second largest stock in the index, DraftKings (DKNG) increased by 70%. Flutter’s improvement is likely due to an improved inflection point in the company’s U.S. operations which include its FanDuel operations. DraftKings also beat revenue and EBITDA expectations in 4Q 2022 and appears to be proving out its path to profitability. In both cases, investors are rewarding companies who are accelerating their path to profitability.
The next best performing index was Noble’s Ad Tech Index which increased by 31% during 1Q 2023. Fourteen of the 23 stocks in the index were up in the first quarter. Standouts during the quarter were Integral Ad Science (IAS; +62%) and Perion Networks (PERI; +56%). Integral Ad Science exceeded expectations in its fourth quarter results and guided to better-than-expected results in 1Q 2023. The company continues to expand its product suite, scale its social media offerings (i.e., for TikTok) and is well positioned to continue to benefit from the shift from linear TV to connected TV (CTV). Perion shares continued their winning streak: Perion was the only ad tech stock whose shares were up in 2022. Perion’s 56% increase in 1Q 2023 reflected beat on both revenues (by 2%) and EBITDA (by 10%) as well as improved guidance for 1Q 2023. Perion’s profitability increased significantly in 2022, with EBITDA nearly doubling (+90%) from $70 million in 2021 to $132 million in 2022.
Noble’s MarTech Index increased by 30% with 14 of the 22 stocks in the index posting increases in 1Q 2023. The best performing stocks were Qualtrics (XM; +70%) Sprinklr (CXM; +59%), Salesforce (CRM; +51%), Hubspot (HUBS; +48%) and Yext (YEXT; +47%). Qualtrics agreed to be acquired for $12.5 billion by Silver Lake and the Canadian Pension Plan Investment Board, which came at a 73% premium to its 30-day volume weighted stock price. Sprinklr beat revenue expectations and significantly beat EBITDA expectations (doubling the Street expectations) and guided to a current year forecast that focuses more on efficiency and profitability. MarTech stocks have been victims of their own success. Two years ago at this time the sector was trading at 11.3x forward revenue estimates, and a year ago the group was trading at 6.5x forward revenues. Today the group trades at 4.1x forward revenues and investors appear to be wading back into the sector.
Finally, Noble’s Digital Media Index, while lagging that of its digital peers posted an 18% increase and significantly outperformed the S&P 500 (+7%) with a broad based recovery in which 9 of the sector’s 11 stocks increase during 1Q 2023. The best performing stock was Spotify (SPOT; +69%), whose revenues fell short of expectations by less than 1%, significantly beat consensus Street EBITDA expectations by $58M and more importantly pivoted towards demonstrating operating leverage. Spotify, which posted an EBITDA loss of nearly $500 million 2022 is expected to generate $650 million in EBITDA in 2024, according Street estimates. A deteriorating ad market 2022 combined with higher interest rates likely prompted the company to shift its priorities to running a profitable company and doing it more quickly. The second best performing stock was Travelzoo (TZOO; +36%), as the company’s 4Q 2022 revenues and EBITDA increased by 31% and 328%, respectively. Notably, Travelzoo’s EBITDA came in 58% higher than Street consensus. The company appears to be benefiting from pent up demand for travel and management highlighted the opportunity for margin expansion in the coming quarters.
Sluggish M&A Market Carries Over into 2023
Last quarter we remarked that M&A deals in the Internet and Digital Media sector had held up well through the first three quarters of 2022 despite economic headwinds. However, the number of deals slowed in 4Q 2022 (by 17%) and total deal value fell dramatically (by 70%). The slowdown carried over into 1Q 2023. According to Dealogic, Global M&A fell by 48% to $575 billion in 1Q 2023 compared to $1.1 trillion in 1Q 2022. Global M&A dollar values fell to their lowest level in a decade. In the U.S., deal values fell by 44% to $283 billion from $176 billion in 1Q 2022.
The M&A market had weathered stock price declines, Fed rate hikes, elevated inflation, and geopolitical conflict in 2022. In 1Q 2023, to this “recession that never comes” economic environment we added increased volatility and uncertainty caused by banking failures. One of the biggest impediments to deals is debt financing. Private equity firms have had to write larger check in lieu of a robust debt financing market. Banks have been less willing to provide financing because some have had to hold loans on their balance sheet or take losses when selling debt to investors while smaller regional banks have seen deposits flee to larger banks, especially those considered too big to fail.
Finally, increased antitrust scrutiny likely has played a role in the M&A deal slowdown. Lengthy merger reviews resulted in three public transactions being blocked by regulators: Standard General’s acquisition of Tegna; JetBlue’s acquisition of Spirit Airlines, and Intercontinental Exchange’s acquisition of Black Knight, Inc.
1Q 2023 Internet and Digital Media M&A: A Dearth of Large Deals
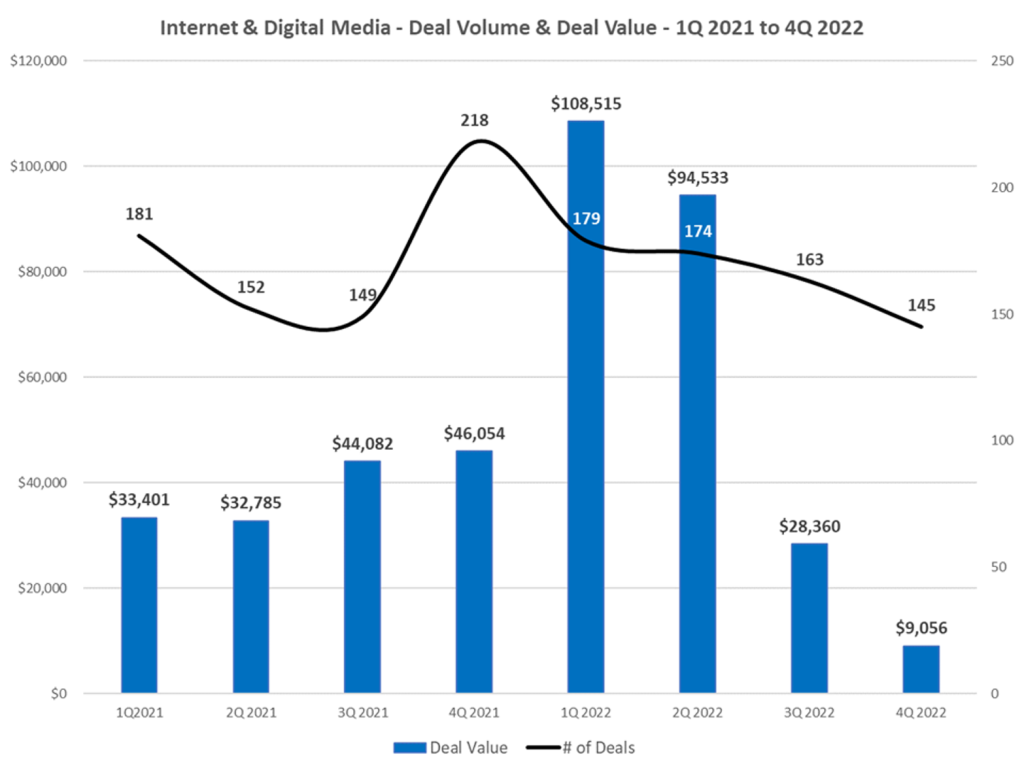
Based on Noble’s analysis, deal making in the first quarter of 2023 in the Internet and Digital Media sectors actually increased by 11% compared to 1Q 2022. The total number of deals we tracked in the Internet and Digital Media space increased to 202 deals in 1Q 2023 compared to 182 deals in 1Q 2022. On a sequential basis, the total number of deals increased by 39% compared to 145 deals in 4Q 2022. The only explanation we can provide for this is that with the expectation that an economic slowdown was pending, many companies likely made the decision to sell in mid-2022, with the deals being announced in 1Q 2023.
The biggest change was in the first quarter’s M&A deal value, where the total dollar value of deals fell by 95% to $5.4 billion of announced deals in 1Q 2023 compared to $108.5 billion in announced deals in 1Q 2022. On a sequential basis, deal value fell by 40% from $9.1 billion in deal value in 4Q 2022.
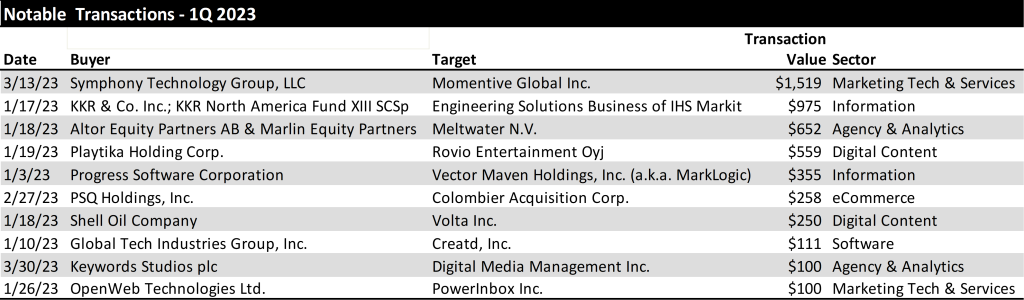
From a deal volume perspective, the most active sectors we tracked were Digital Content (59 deals), Agency & Analytics (51 deals), and MarTech (39), followed by Information Services (17 deals), Ad Tech (11 deals) and eCommerce sectors (10 deals). From a dollar value perspective, MarTech led the way with $1.6 billion in transactions, followed by Information Services ($1.4 billion), Digital Content ($922 million) and Agency and Analytics ($875 million). The largest deals in the quarter by dollar value are shown below.
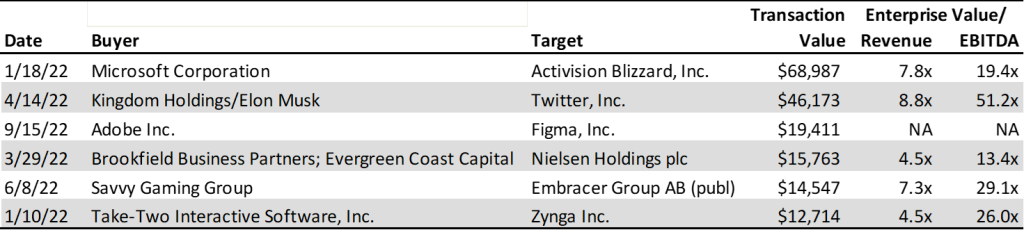
Notably, there were no mega deals ($10B+) in the first quarter of 2023, compared to the first quarter of 2022 when Microsoft agreed to by Activision Blizzard for $68 billion and Take-Two Interactive agreed to acquire Zynga for $12 billion. Once the Fed stops hiking rates and visibility into operating trends returns, we may begin to see an environment in which mega deals will be contemplated again.
TRADITIONAL MEDIA COMMENTARY
The following is an excerpt from a recent note by Noble’s Media Equity Research Analyst Michael Kupinski
The NAB Show Stopper
Media investors are unpacking all of information from last week’s National Association of Broadcasters (NAB) convention. There is a lot to digest given that there were over 1,400 exhibits, and 140 new exhibitors this year. Because of the overwhelming number of exhibitors, many that go to Vegas for this annual convention do not go to the convention floor. It is a shame. There is a lot to see and learn. Noble’s Media & Entertainment Analyst Michael Kupinski walked the convention floor, which covers 4.6 million square feet of exhibit halls and meeting rooms. He stopped by booths and taped presentations to explain the new technologies, the plan for implementation of new services, and the prospect for revenue monetization. One important demonstration focused on the new broadcast standard, ATSC 3.0, the hope for a bright future for the television industry. This new standard should allow the industry to become more contemporary in terms of how its audience consumes video and information. In addition, it offers the ability for the industry to participate in new revenue streams, including datacasting, which may become bigger than Retransmission revenue in the future.
In addition to touring the floor, he participated in NAB panel discussions and hosted meetings with media management teams in a fireside chat format to discuss current business trends, the new technologies (including Artificial Intelligence (AI)) and the new broadcast standard. In addition, these C-suite management teams provided their key takeaways from the NAB convention and offered why they participated in the conference this year. These discussions will be available for free to Channelchek users on Channelchek.com on April 27th as a virtual conference. In this upcoming Channelchek Takeaway Series on the NAB Show, Michael offers his key takeaways, including the current advertising outlook, his take on the monetization of the new technologies and what media investors should do now given the current economic and advertising environment. Free registration to this informative event is available here.
This report highlights the performance of the media sectors over the past 12 months and past quarter. Overall, media stocks struggled in the past year, but there has been some improved quarterly performance, particularly in Digital Media and Broadcast Television, discussed later. All media stocks are struggling to offset losses over the course of the past year with trailing 12 months stocks down in the range of 5% on the low end to as high as down 68%.
In the first quarter, stock performance was mixed. The best performers in the traditional media sectors were Broadcast Television stocks, up nearly 10% versus the general market which increased 7% in the comparable period. However, the individual TV stock performance reflected a different story, explained later in this report. The worse performer for the quarter were the radio stocks, driven by a Wall Street downgrade of one of the leading radio broadcasters. We believe that stock performance will be a roller coaster for at least another quarter or two as the weight of the Fed rate increases begin to adversely affect the economy.
While national advertising has remained weak, we believe that local advertising is now beginning to moderate as well. The local advertising weakness appears to be in the smaller markets as well as the larger markets. This is somewhat different than the most recent economic cycles whereby the smaller markets were somewhat resilient. It seems that the smaller markets are feeling the adverse affects from inflation, rising employment costs and tightening bank credit. In our view, the disappointing advertising outlook likely will cause second quarter revenue estimates to come down, creating a difficult environment for media stocks.
Broadcast Television
Weak Current Revenue Trends
TV stocks outperformed the general market in the first quarter. This market cap weighted index masked the performance of many poor performing stocks in the quarter. Sinclair Broadcasting (up 10%), Entravision (up a strong 26%), and Fox (up 12%) were the best performing stocks and favorably influenced the TV index in the quarter. But, there were many poor performing stocks including E.W. Scripps (down 29%), Gray Television (down 22%) and Tegna (down 20%). We believe that there was heightened interest in Entravision given its favorable Q1 results which was fueled by its fast growing digital advertising business. Entravision’s Q4 revenue performance was among the best in the industry. While Entravision was among the best revenue performer, its margins are below that of its peer group EBITDA Margins. This is due to the accounting treatment of its digital revenues given that it is an agency business.. The poorer performing stocks are among the higher debt levered in the industry. The underperformance reflects concern of a slowing economy and investors flight to quality in the sector.
We do not believe that we are out of the woods with the TV stocks and the market is expected to be volatile. The advertising environment appears to be deteriorating given weakening economic conditions. There are bright spots which include some improvement in the Auto category. Dealerships appear to be stepping up advertising given higher inventory levels. In addition, broadcasters appear optimistic about political advertising, which could begin in the third quarter 2023. There is a planned Republican presidential candidate debate schedule in August. There is some promise that candidates will advertise in advance of that debate and into the fourth quarter given the early primary season. We do not believe that political and auto will be enough to offset the weakness in national and Local advertising. In our view, Q2 and full year 2023 estimates are likely to come down. Furthermore, we believe that broadcasters will be shy about predicting political advertising even into 2024 given the past disappointments in management forecasts in the last political cycle.
Broadcast Radio
All Out of Love
Radio stocks had another tough quarter, down 17% versus a 7% gain for the general market. Notably, there was a wide variance in the individual stock performance, with the largest stocks in the group having the worst performance in the quarter, including Audacy (AUD down 40%), Cumulus Media (CMLS down 41%) and iHeart Media (IHRT down 36%). The first quarter stock performance did not appear to reflect the fourth quarter results, during which revenues were relatively okay, with some exceptions. Some of the larger radio companies which have a large percentage of national advertising, underperformed relative to the more diversified radio companies, especially those with a strong digital segment presence. Margins for the industry remain relatively healthy.
The weakness in the Radio stocks was fueled in the quarter from a downgrade to Underperform on the shares of iHeart by a Wall Street firm. Many radio stocks were down in sympathy. The analyst attributed the downgrade to the current macro environment and its heavy floating rate debt burden. The company is not expected to generate enough free cash flow to de-lever its balance sheet. We believe the downgrade as well as the excessive debt profile of Audacy, another industry leader which likely will need to restructure, sent all radio stocks tumbling. Some stocks performed better than others. While Cumulus Media’s debt profile is not as levered as iHeart or Audacy, the shares were caught in the net of a weak advertising outlook. Cumulus is among the most sensitive to national advertising, which currently continues to be weak.
Some of our favorite stocks which are diversified and have developing digital businesses performed better. Those stocks included Townsquare Media (TSQ, up 10%), and Salem Media (SALM, up 4%). Notably, while the shares of Beasley Broadcasting (BBGI) were down 10%, the shares performed better than the 17% decline for the industry in the quarter. Importantly, Beasley recently provided favorable updated Q1 guidance for the first quarter. Q1 revenues are expected to increase 1% to 2.5% and EBITDA growth is expected to be in the range of 40% to 50%, significantly better than our estimates. Furthermore, management provided a sanguine outlook for 2023 and 2024. Digital revenue is expected to reach 20% to 30% of total revenue with a goal of reaching 40% in 2024. By comparison, digital revenue was 17% of total revenue in the fourth quarter 2022. Furthermore, the company is sitting on roughly $35 million in cash. It has opportunistically repurchased $10 million of its bonds at a significant discount. We believe that it is likely to maintain a strong cash position given the economic uncertainty.
Townsquare Media (TSQ), Salem Media (SALM) and Beasley Broadcast (BBGI) are all diversifying their revenue streams. While these companies are not immune to the economic headwinds, we believe theirdigital businesses should offer some ballast to its more sensitive Radio business. In the case of Salem, 30% of its revenues are relatively stable with block programming.
Publishing
After a period of moderating revenue trends, publishers reported a weakened advertising environment. Revenue trends deteriorated with print advertising taking a nose dive. This trend was illustrative in the results from Lee Enterprises. After a fiscal fourth quarter flat revenue performance, the company reported a 8.5% decline in its fiscal first quarter. The Q1 revenue performance reflected an 18.5% decrease in print advertising, an acceleration in the rate of the 11% decline in the previous quarter.
The surprisingly weak quarter hit the company’s adj. EBITDA margins. Traditionally, Lee maintained some of the best margins in the industry., but the company fell in ranking to among the lowest in the sector. Importantly, in spite of the revenue weakness, the company maintained its previous adj. EBITDA guidance of $94 million to $100 million for F2023. To achieve its cash flow target in light of the soft revenue outlook, Lee implemented a round of expense cuts to bolster cash flow. Cost reductions are expected to result in $40 million of savings in FY 23, and $60 million in annualized savings going forward. While the company’s print business declined more than expected , the company’s digital businesses remains favorably robust. In addition, its digital business is turning toward contributing margins; another step in the company’s digital evolution.
This newsletter was prepared and provided by Noble Capital Markets, Inc. For any questions and/or requests regarding this news letter, please contact Chris Ensley
DISCLAIMER
All statements or opinions contained herein that include the words “ we”,“ or “ are solely the responsibility of NOBLE Capital Markets, Inc and do not necessarily reflect statements or opinions expressed by any person or party affiliated with companies mentioned in this report Any opinions expressed herein are subject to change without notice All information provided herein is based on public and non public information believed to be accurate and reliable, but is not necessarily complete and cannot be guaranteed No judgment is hereby expressed or should be implied as to the suitability of any security described herein for any specific investor or any specific investment portfolio The decision to undertake any investment regarding the security mentioned herein should be made by each reader of this publication based on their own appraisal of the implications and risks of such decision This publication is intended for information purposes only and shall not constitute an offer to buy/ sell or the solicitation of an offer to buy/sell any security mentioned in this report, nor shall there be any sale of the security herein in any state or domicile in which said offer, solicitation or sale would be unlawful prior to registration or qualification under the securities laws of any such state or domicile This publication and all information, comments, statements or opinions contained or expressed herein are applicable only as of the date of this publication and subject to change without prior notice Past performance is not indicative of future results.
Please refer to the above PDF for a complete list of disclaimers pertaining to this newsletter
The S&P 500 increased by 7% during the fourth quarter of 2022, marking the first time the Index had increased since fourth quarter of 2021. We also saw signs of life in two of Noble’s Internet and Digital Media Indices: Noble’s eSports and iGaming Index increased (+13%) and outperformed the broader market (which we define as the S&P 500) while Noble’s MarTech Index also increased (+6%), roughly in-line with the market. This marked the second quarter in a row in which the eSports and iGaming Index not only increased but significantly outperformed the broader market, following several quarters of underperformance. Laggards during the fourth quarter were Noble’s Digital Media Index (-5%), Social Media Index (-7%) and Ad Tech Index (-20%).
Noble Indices are market cap weighted, and we attribute the relative strength of the eSports and iGaming Index to its largest constituent, Flutter Entertainment (ISE: FLTR). Flutter shares finished the year at $127.80, down only 8% from the start of the year, despite trading as low as $76 per share in mid-July. Investors appear to appreciate Flutter’s FanDuel business and its market leading position and competitive advantage, something that Flutter management highlighted during a November Investor Day. Management also laid out a case to increase U.S. revenues by 5x and achieve margins of 25%-30% implying EBITDA of up to $5 billion in 8 years-time, quadruple its levels today. Despite the overall strength of the eSports and iGaming Index, share price gains within the sector were not widely dispersed. Only 3 of the 16 stocks in eSports and iGaming sector finished the quarter up, including Engine Gaming and Media (GAME, +71%) and SportRadar Group (SRAD; +13%).
Noble’s MarTech Index increased by 6% with 11 of the 22 stocks in the index posting gains, led by Yext (YEXT; +46%), Shopify (SHOP; +29%), LiveRamp (RAMP; +29%) and Adobe (ADBE; +22%). This marks significant improvement from last quarter when only 4 of the sectors’ stocks finished the quarter in positive territory. MarTech stocks have suffered from a market resetting of revenue multiples which began when the Fed began raising rates. MarTech share price declines in the first, second and third quarters of 2022 were mostly driven by multiple compression as investors rotated out of high-flying tech sectors where companies had chased growth at all costs (at the expense of profitability). Only 7 of the MarTech companies in the Index posted positive EBITDA in the latest quarter.
2022 – A Year That Internet and Digital Media Investors Would Like to Forget
While there were signs of life in the fourth quarter of 2022 for the Internet and Digital Media sectors, 2022 was a year most investors in these sectors would like to forget. Every one of these sectors substantially underperformed the S&P 500 last year. The S&P 500 Index finished the year down 19% which was substantially better than Noble’s eSports and iGaming Index (-35%), Digital Media Index (-41%), MarTech Index (-52%), Social Media Index (-63%), and Ad Tech Index (-63%). Rather than focus on the stocks that significantly underperformed their respective Indices (and there are many), we would rather focus on the three stocks that finished 2022 up for the year.
Harte Hanks (HHS) – Shares of Harte Hanks increased by 53% in 2022, which continued its multi-year turnaround from a highly levered and unprofitable business (in 2019), to a double-digit EBITDA margin business with a debt-free balance sheet (in 2022).
Tencent (TME) – Shares of Tencent increased by 21% in 2022. Shares declined earlier in the year as China’s economy slowed as it maintained its Zero Covid-19 lockdown, but surged in the fourth quarter as it appeared that the company would enjoy an increase in demand as China begins easing Covid restrictions.
Perion Networks (PERI) – Perion shares increased by 5% in 2022 as Perion consistently beat expectations and raised its guidance throughout 2022. In the first week of 2023, the company once again pre-announced better than expected results for the fourth quarter, and shares are already up 18% since the start of the new year.
2022 M&A – A Tale of Two Halves
When we look back at last year from an M&A perspective, we can say that 2022 was another year of robust M&A activity. The total number of deals increased by just under 2%, as we tracked 667 deals in 2022 compared to 657 deals in 2021. Deal values were up a robust 71% in 2022 to $241 billion, up from $141 billion in 2021. The fact that deal value was so significantly higher happened despite the fact that there were far fewer deals where the transaction value was disclosed in 2022 compared to 2021. In 2022, there were 184 deals where the purchase price was disclosed, significantly lower than the 264 deals where the purchase price was disclosed in 2021.
2022 – A Year of Mega Deals
The biggest difference between 2022 and 2021 was two “mega” deals that were announced in 2022: Microsoft’s $69 billion announced acquisition of Activision Blizzard (which the Federal Trade Commission is seeking to block) and Elon Musk/Kingdom Holding’s $46 billion acquisition of Twitter. In fact, there were six transactions in 2022 that exceeded $10 billion in deal value, while there were only 2 such deals in 2021. Five of the 6 largest transactions of 2022 took place in the first half of the year. Half the largest M&A deals in 2022 were in the video or mobile gaming sector.
Only Adobe’s $19 billion announced acquisition of Figma took place in the second half of the year, which is not surprising given that the cost of financing M&A transactions using debt increased by approximately 300 basis points as the Fed continued to raise rates to fight inflation. Given the higher cost of financing deals, in 2023 we are not likely to see as many mega deals particularly at the relatively elevated EBITDA multiples shown above.
4Q 2022 M&A: A Chink in the Armor – M&A Activity and Deal Values Slide
Through the first three quarters of the year in 2022, we noted how well M&A had held up despite public equity market declines, Fed rate hikes, elevated inflation, contractionary monetary policy and geopolitical conflict. While the M&A market stayed resilient throughout most of 2022, it is clear that we began to see some “chinks in the armor” in 4Q 2022. We are not surprised by this relative weakness given the economic uncertainty and an inability to accurately forecast revenue and earnings trends for both acquirors and target companies alike.
Deal making in the fourth quarter of 2022 slowed both from a deal volume and deal value perspective. The total number of deals we tracked in the Internet and Digital Media space fell by 17% to 145 deals in 4Q 2022 compared to 174 deals in 4Q 2021. On a sequential basis, the total number of deals fell by 14% to 143 deals compared to 167 deals in 3Q 2022.
The biggest change was in deal value, where the total dollar value of deals fell by 70% to $9.1 billion in 4Q 2022 compared to $30.1 billion in 4Q 2021. On a sequential basis, deal value fell by 69% in 4Q 2022 from $29.1 billion in deal value in 3Q 2022.
The tale of two halves is best represented by the chart below.
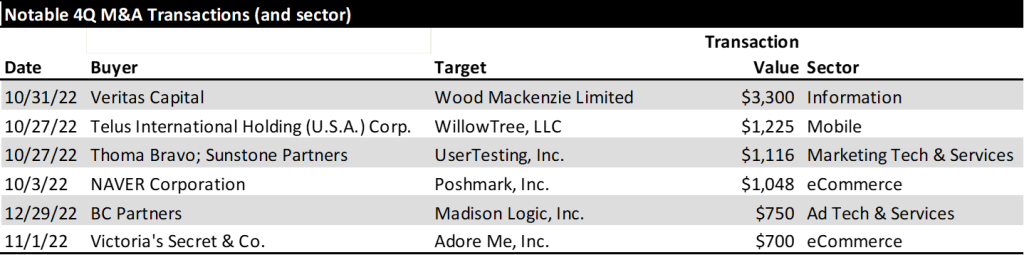
From a deal volume perspective, the most active sectors we tracked were Digital Content (40 deals), Marketing Tech (36 deals), Agency & Analytics (32 deals) and Information Services (12 deals). From a deal value perspective, the Information Services sector had the largest dollar value of transactions ($3.3 billion), followed by eCommerce ($1.7 billion), Mar Tech ($1.2 billion), and Mobile ($1.2 billion).
During the fourth quarter there were a dozen announced deals in the video gaming sector, but the sector did not register as a top sector based on deal value. In fact, only 2 of the 12 deals that were announced included the purchase price: Churchill Down’s $250 million acquisition of horse racing game provider Exacta Systems and Playstudios’ $97 million acquisition of mobile game developer Branium Studios. The largest deals in the quarter by dollar value are shown below.
Digital Advertising
Digital Advertising Outlook for 2023
Last October eMarketer revised lower its 2023 U.S. digital advertising forecast by $5.5 billion, from $284.1 billion to $278.6 billion. While this sounds like a substantial drop, in percentage terms they lowered their 2023 forecast by only 2 percentage points, from 14% growth to 12% growth. Most of the global ad agencies expect digital to continue to grow by double digits driven by dollars migrating to such digital ad channels as retail media and connected TV. Both sectors continue to demonstrate impressive growth.
Retail Media – A retail media network is a retailer-owned advertising service that allows marketers to purchase advertising space across all digital assets owned by a retail business, using the retailer’s first-party data to connect with shoppers throughout their buying journey. eMarketer forecasts that retail media ad spending in the U.S. grew by 31% last year to $41 billion and will grow to $61 billion over the next two years, by which time it will equate to 20% of all digital advertising. The leaders in retail media are Amazon, Walmart and Instacart.
Through a retail media network, partners (advertisers) get direct access to a retailer’s customers. The benefit to the partners/advertisers is that they get access to first party data. Retailers own and store this data and allow advertisers to access them through their retail media programs. The first party data is valuable because it is collected at the point of sale allowing brands to get better insights into purchase behavior. Traditional retailers are beginning to follow suit. Traditional retailers with the largest digital audiences (per comScore) are Walmart, Target, Home Depot, Lowes, CVS, Walgreens, Costco and Kohls.
On January 10th, Microsoft announced that it intended to create the industry’s most complete omnichannel retail media technology stack supported by its Promote IQ platform, a company Microsoft acquired in 2019. We expect companies that serve the retail media sector from an Ad Tech or Mar Tech standpoint are poised to benefit from secular trends in this sector.
Connected TV (CTV) – Last July, Nielsen announced that for the first time U.S. streaming TV viewership was larger than cable TV viewing. In July 2022, eMarketer forecast that CTV advertising would reach $18.9 billion in 2022. However, in October 2022,
eMarketer raised its forecast for CTV advertising by $2.3 billion to $21.2 billion in 2022. In October, the forecaster also raised its 2023 CTV advertising forecast by $3 billion to $26.9 billion, up from $23.9 billion in the July 2022 forecast. The big increase is due primarily to Netflix and Disney+ announcing they were launching ad supported tiers to their streaming offerings.
The ability to target specific audiences and measure specific outcomes tied to the ads that viewers watched has made CTV a force to be reckoned with, particularly for those advertisers that are never quite sure which of their advertising mediums provide the highest returns. Historically, TV was a mass medium used by large brands that wanted massive reach. CTV has opened the door to a wider variety of advertisers that are looking to reach more targeted, even niche, audiences. According to MNTN, a connected TV performance marketing platform, many CTV advertisers are first-time TV advertisers. With new FAST (Free Ad-Supported Streaming TV) channels coming online every month, there is no shortage of supply coming to market. This is just one reason why eMarketer predicts CTV advertising to grow by $10+ billion over the next two years and reach nearly $32 billion in advertising revenue in 2024. Ad Tech or Mar Tech companies that serve this market are also poised to benefit from secular viewing trends and the advertising dollars that are migrating to these platforms.
TRADITIONAL MEDIA COMMENTARY
The following is an excerpt from a recent note by Noble’s Media Equity Research Analyst Michael Kupinski
Overview – Will It Be A Happy New Year?
2022 was one of the worst for media stock performance in recent memory, with stocks across traditional and digital media sectors down over 40% or more. Media stocks underperformed the general market, as measured by the S&P 500 Index, which was down a more moderate 19% on a comparable basis for the full year 2022. It is typical for media stocks to underperform in a late-stage economic cycle or in the midst of an economic downturn, but the significant stock declines are stunning. Macro-economic issues including inflation, rising interest rates, and the prospect of a looming economic downturn all contributed to the poor performance.
The question is “will 2023 be better?” We believe so. There has been recent signs of life. The S&P 500 increased by 7% during the fourth quarter of 2022, marking the first time the Index had increased since fourth quarter of 2021. Notably, the Noble Publishing Index outperformed the general market in the latest quarter. However, the full impact of the recent interest rate increase likely have not been reflected in the economy. Many media stocks seem to anticipate an economic downturn, but current fundamentals do not appear to be in a freefall and may be better than expected. If the economy further deteriorates from the recent or future rate hikes, it appears now that it may adversely affect the second half of 2023. Advertising pacings appear to be holding up well so far in the first half 2023. Notably, media stocks may begin to anticipate an improving economic outlook and overlook the weak fundamental environment in the second half.
Conventional thought anticipates that increasing concerns over an economic recession may prompt mortgage rates to trend lower in 2023. Furthermore, it is possible that the Fed may lower interest rates if inflation moderates, although the Fed is not currently anticipating rate decreases in 2023. Nonetheless, this paints a favorable picture for media stocks in 2023. Traditionally, the best time to buy media stocks is in the midst of an economic downturn. In addition, these consumer cyclical stocks tend to be among the first movers in an early-stage economic cycle and tend to perform well in a moderating interest rate environment. As mentioned earlier, the stocks may currently be oversold given the prospect that the current fundamental environment is better than anticipated.
What is the risk to this favorable outlook? We believe that the resurging Chinese economy may be disruptive. Within the last month, China’s economy has been reopened from Covid lockdowns, which may put pressure on global energy prices. Such a prospect may make the Fed’s fight on inflation more stubborn to combat, potentially throwing off our favorable outlook for moderating interest rates. Given the prospect that these stocks tend to outperform the market in an early-stage economic recovery, we believe it is time for investors to accumulate positions in the media sectors.
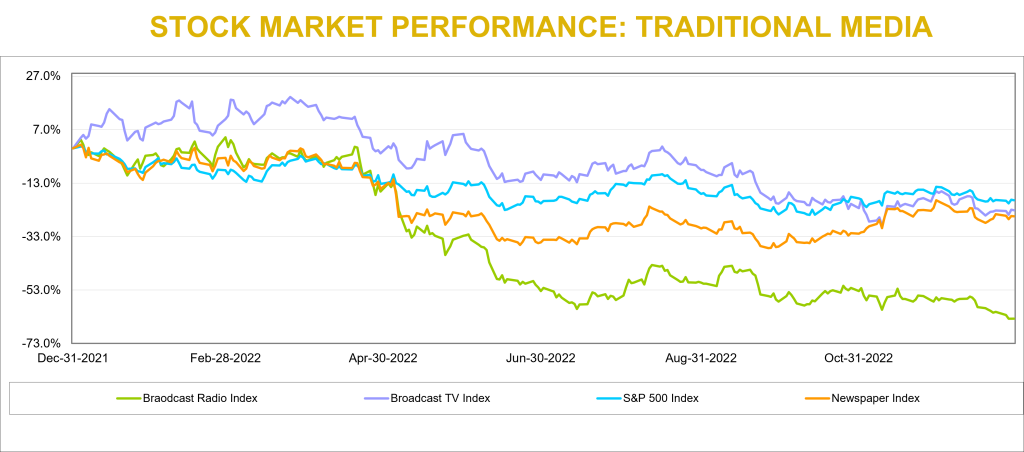
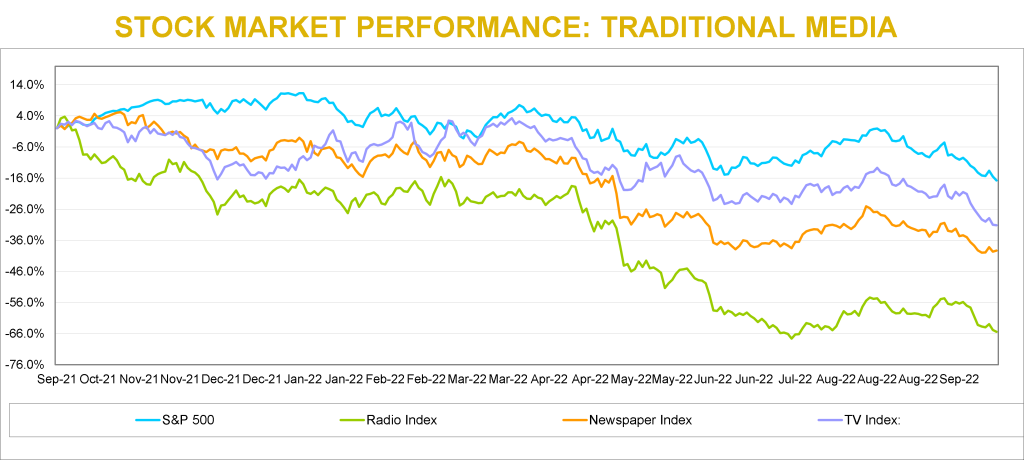
Traditional Media – Another Quarter of Moderating Stock Performance
Traditional media stocks underperformed the general market in 2022, with the Radio sector the hardest hit. The Noble Radio Index declined 64% versus 19% for the general market, as measured by the S&P 500, in a comparable time period. Television and Publishing stocks were down 23% and 25%, respectively, more in line with the general market returns. But there were notable company stock performance disparities within each sector, highlighted later in this report. Larger market capitalized companies performed better, which skewed the market cap weighted Indices.
Traditional media stocks seemed to have stabilized from the rapid declines in early 2022. The Publishing sector once again outperformed the general market in the quarter. Noble’s Television Index declined 3%, but this decline moderated from the 10% decline in the third quarter. The Radio industry still has not yet stabilized, with the Noble Radio Index down 15% in the latest quarter.
Broadcast Television
Will Netflix suck the air out of the room?
Netflix launched a new pricing plan on November 3rd which offers a basic tier with advertising at a low price point of $6.99. This compares with its previous tiers of $9.99 and $19.99 for advertising-free streaming. While reports indicate that the advertising platform is off to a slow start, we believe that the Netflix move could be disruptive to the broadcast television network business as its lower price basic service gains traction. It is likely that there will be some cannibalization from its higher pricing tier, but we believe that the move will broaden its subscriber base. While Netflix has not considered offering live sports on its streaming platform given the cost of sports rights, we believe that the potential success of its subscription/advertising tier may provide a platform to upend that decision. There is a strong tailwind for viewership trends on streaming platforms, which now exceed that of broadcast television viewing. A decision to enter sports will be a big deal and disruptive to network broadcasting.
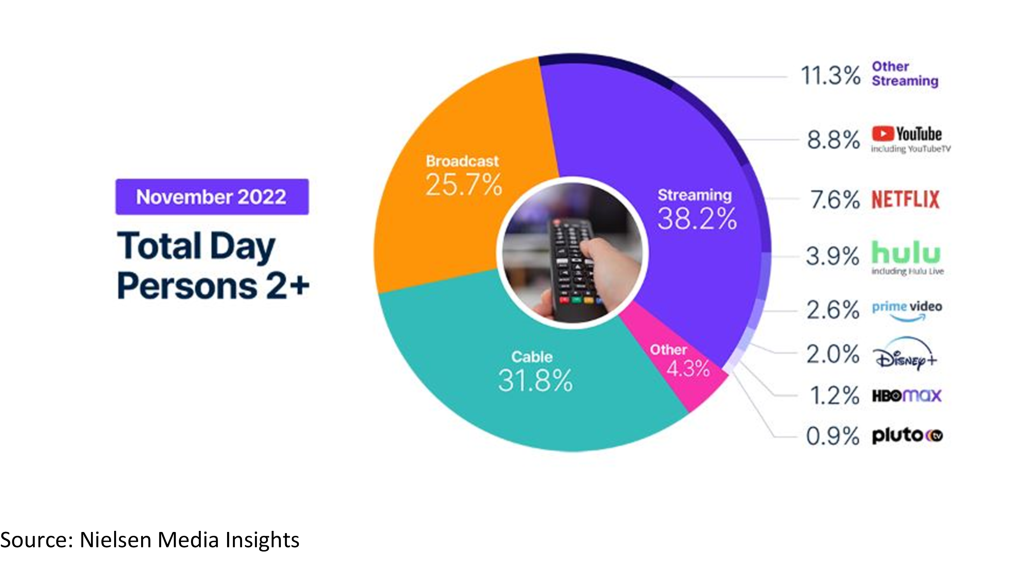
Streaming viewership not only eclipsed television viewing in July 2022, but also that of cable viewing, 34.8% versus 34.4%. In addition, based on the latest Nielsen data from November 2022, streaming now accounts for 38.2% of total viewing with Broadcast at 25.7% and cable at 31.8%, as shown in the chart below. While TV viewership increased 7.8% in November, largely due to sports content, streaming usage year over year was up more than 41%.
Scripps Plans To Expand Sports
The declining cable subscriptions and cable viewership, especially on regional sports networks, led E.W. Scripps to launch a new Scripps Sports division. This division plans to seek broadcast rights from teams and leagues and bring that programming to broadcast television. The company plans to obtain rights either in local TV markets where it can partner with local teams or on a national basis, utilizing its distribution on its Ion Network. It is important to note that ION is unique from other networks. Ion’s distribution is nearly 100% of the US television market given that it has local licenses and local towers in every market, it is fully distributed on cable and satellite, and is offered over the air. As such, we believe that Scripps offers a unique proposition to sports teams interested in building its audiences.
Will ATSC 3.0 Stream The Tide?
Furthermore, the broadcast industry appears to be more aggressively ramping its own streaming capabilities with the rollout of its new broadcast standard, ATSC 3.0. ATSC 3.0 is built on the same Internet Protocol as other streaming platforms which enables broadcast programming and internet content to be accessible in the car, on mobile devices, and in the home. While there are many opportunities for the new standard, services and offerings are still being developed. ATSC 3.0 offers promising opportunities for broadcasters to compete with streaming services in the future. We expect that the industry will make more announcements about this promising technology at future events, including the upcoming NAB Show, April 16-19 in Las Vegas, NV.
Are We In A Recession?
In our view, the current fundamentals may be better than the stocks project. Advertising seems to be holding up, post political advertising. Most companies in the industry reported strong Q3 revenue growth, influenced by a large influx of political advertising. The largest broadcasters, particularly Nexstar, have the largest EBITDA margins. The two stocks with the highest revenue growth in the quarter, Entravision and E.W. Scripps, saw their shares perform the best in the fourth quarter.
Notably, local advertising appears to be fairing better than national advertising. Based on our estimates, core local advertising is expected to be down in the range of 5% to 8%, with core national down as much as double digits. We believe that some large advertising categories like auto, retail and home improvement will show improving trends. The first quarter 2023 appears to be consistent with the fourth quarter. Broadcast network TV is another story, which we believe is weak. Network has potential heightened competition from streamers such as Netflix and Disney+ which have just launched ad-supported streaming tiers.
Is There Room For Upside?
Most TV stocks are trading in a tight range of each other. The biggest variance in stock valuations is Entravision, which is trading at 5.9x EV to our 2023 EBITDA estimate, well below that of its industry peers which trade on average at 7.7x. One might argue that Entravision, which has migrated to become a leading Digital Media company which contributes roughly 80% of its total company revenues, ought to trade at a premium to its broadcast peers, rather than at a discount. Investors appear to be somewhat confused by the company’s relatively low EBITDA margins, which is a function of how revenues are accounted for in its digital media division. We would also note that its capital structure is among the best in the industry, with a large cash position and modest net debt position.
As mentioned earlier, the Noble Broadcast TV Index declined 3% in the latest quarter, underperforming the general market’s 7% advance. E.W. Scripps, which increased 6% and Entravision, which increased 5% were among the strongest revenue performers in the third quarter. Among the poor performers were shares of Gray Television, down a significant 34% and Sinclair Broadcasting, which was down 24%. With the TV stocks down a significant 23% for the year, have the stocks already assumed that the industry is in an economic downturn? We believe that the stocks may be oversold based on the prospect that advertising is currently holding up in the first quarter.
Broadcast Radio
Digital Is Bolstering Performance
The radio industry index was the worst performing index in the traditional media segment, declining 15% in 4Q22 and 64% for the year. The radio industry is feeling the pressure that recessionary concerns place on the demand for advertising. In addition to increased competition for audiences from digital music providers and shifting advertising dollars from radio to a more targeted advertising medium, digital media.
For the third quarter Urban One and Townsquare Media top its peers with revenue growth of 9% and 8%, respectively. A common theme with companies that grew fastest was diversified revenue streams. Salem Media and Beasley Broadcast Group grew less quickly but are taking steps to further diversify revenue. Salem has diversified into content creation and digital media and Beasley is continuing to pursue a digital agency model. The median Q3 revenue growth rate was 1.5%, and the average revenue growth was -1%. The average growth rate of -1% is skewed due to the poor performance of Medico Holdings (MDIA). In previous quarters Medico benefited from Covid-19 vaccine advertising campaigns and ticket sales for an annual outdoor live event that took place in Q3 of 2021. Without Covid vaccine advertising and Medico’s concert being held in Q2 2022 instead of Q3 resulted in revenue declining 34% on a year over year basis.
After the 2022 calendar year ended, Moody’s downgraded Cumulus Media’s Corporate Family Rating to B3 from B2. Moody’s believes Cumulus Media will face a further decline in advertising demand as the economy weakens. Moody’s could upgrade its rating if leverage decreases to 5x as a result of positive performance and could downgrade its rating if leverage ratio increases to 7x as a result of poor performance. It should be noted that Cumulus has a large cash position of $118 million and could access an additional $100 million through an asset backed loan.
However, there are several companies in the radio industry with improving leverage profiles. We believe that radio companies are diversifying traditional revenue streams with digital revenue. In our view, companies that achieved a greater degree of digital transformation and are better shielded from macroeconomic headwinds. Townsquare Media, Cumulus Media, and Salem Media are among the cheapest in the group. For those companies with substantial digital media businesses that are growing rapidly, like Townsquare Media and Beasley, we believe that advertising pacings in the first quarter are likely to be positive. On the low end pacings are expected to be flat to plus 3% and may even be stronger, up 8% or more in the second quarter (although this is too early to bank). In our view, advertising for these companies do not appear to be falling off of a cliff as the stocks seem to project. Therefore, we believe that the Radio sector appears to be in an oversold position and should have some upside prospects in 2023.
Publishing
Publishing stocks had a pretty good quarter, up 18% as measured by the Noble Publishing Index versus the general market as measured by the S&P 500 Index up 7%. But the largest stocks in the index, New York Times and News Corp, were the only stocks that were up in the sector. Given that the Noble Publishing Index is market cap weighted, it was the reason that the Index was up in the quarter. Lee Enterprises was down a very modest 2% in the quarter. The relatively favorable performance of the index was primarily due to its largest constituents, News Corp. and The New York Times, which rebounded from -30% and -39%, respectively in Q2 2022, to -3% and +3%, respectively, in Q3 2022 and then up 17% and 16%, respectively, in Q4 2022.
We believe that Gannett, the nation’s largest newspaper company, continues to create a pall over the publishing group as it continues to struggle to manage cash flows with its heavy debt burden. In August, the company announced a round of layoffs of 400 employees and then announced another 200 in December. We believe that the company is trying to shore up its cash flow amidst a weak fundamental environment. Not surprisingly, GCI shares (-30%) were among the worst performers in the sector in the fourth quarter. To a large extent, the stock performance in the latest quarter reflected the various company results in Q3.
Q3 publishing revenue declined on average 1%, which excludes the strong revenue growth of the Daily Journal. The company benefited from its Journal Technologies consulting fees which bolstered revenues in its fiscal Q4 results. In addition, during the year, the company sold marketable securities for roughly $80.6 million, realizing net gains of $14.2 million. We have backed out the extraordinary results of the Daily Journal from our industry averages. Notably, Gannett had the weakest revenue performance in the fourth quarter, down 10%.
Notable exceptions to the overall weak industry revenue performance was The New York Times, up 7.5% in Q3 revenues, which reflected a moderation in revenue growth from the prior quarter of an increase of 12%. News Corp, declined 1%, which was well below the 7% gain in the prior quarter. Importantly, Lee Enterprises’ fiscal quarter revenue was down a modest 0.2%, a sequential improvement from the modest 0.7% decrease in the prior fiscal quarter. We believe that Lee’s digital strategy continues to gain traction and that the company is very close to an inflection point toward revenue growth. We continue to note that Lee’s digital subscriptions currently lead the industry. The company has exceeded all of its peers in terms of digital subscription growth in the past 11 consecutive quarters. Furthermore, over 50% of its advertising is derived from digital. Currently, roughly 30% of the company’s total revenues are derived from digital, still short of the 55% at The New York Times, but closing the gap.
Not only is Lee performing well on the digital revenue front, but the company has industry leading margins. Lee’s Q3 EBITDA margins were industry leading at 16.7%. We believe that Lee’s margins are notable given that it demonstrates that the company is managing its margins in spite of the investments in its digital media businesses. Its margins place it on par with its digital media focused peers, such as the New York Times.
LEE’s shares trade at an average industry multiple of 5.7x Enterprise Value to our 2023 adj. EBITDA estimate. Notably, the company is closing the gap with its digital media revenue contribution to that of New York Times. The New York Times carries a significantly higher stock valuation, currently trading at an estimated 15.8x EV to 2023 adj. EBITDA. We believe that the valuation gap with the New York Times should close.
This newsletter was prepared and provided by Noble Capital Markets, Inc. For any questions and/or requests regarding this news letter, please contact Chris Ensley
DISCLAIMER
All statements or opinions contained herein that include the words “ we”,“ or “ are solely the responsibility of NOBLE Capital Markets, Inc and do not necessarily reflect statements or opinions expressed by any person or party affiliated with companies mentioned in this report Any opinions expressed herein are subject to change without notice All information provided herein is based on public and non public information believed to be accurate and reliable, but is not necessarily complete and cannot be guaranteed No judgment is hereby expressed or should be implied as to the suitability of any security described herein for any specific investor or any specific investment portfolio The decision to undertake any investment regarding the security mentioned herein should be made by each reader of this publication based on their own appraisal of the implications and risks of such decision This publication is intended for information purposes only and shall not constitute an offer to buy/ sell or the solicitation of an offer to buy/sell any security mentioned in this report, nor shall there be any sale of the security herein in any state or domicile in which said offer, solicitation or sale would be unlawful prior to registration or qualification under the securities laws of any such state or domicile This publication and all information, comments, statements or opinions contained or expressed herein are applicable only as of the date of this publication and subject to change without prior notice Past performance is not indicative of future results.
Please refer to the above PDF for a complete list of disclaimers pertaining to this newsletter
ATLANTA, Nov. 29, 2022 (GLOBE NEWSWIRE) — Gray Television, Inc. (NYSE: GTN) announced today that it has entered into agreements with The Walt Disney Company that extend and renew the network affiliations for all of Gray’s ABC affiliated television stations across 25 markets through December 31, 2024.
“We are pleased to announce the further extension of our decades-long relationship with Disney for ABC station affiliations,” said Gray’s President and Co-CEO, Pat LaPlatney. “These agreements recognize our ABC affiliates’ commitment to public service and will help them continue to serve their communities.”
“We are excited to continue our strong and well-established collaboration with Gray Television,” said John Rouse, EVP, Affiliate Relations, The Walt Disney Company. “These stations are leaders in their communities, and we are proud to have ABC’s unrivaled network programming paired with Gray’s local programming and community commitment.”
The ABC affiliated television stations covered by the new agreements are as follows:
Station
DMA Name
WWSB
Tampa-St. Pete (Sarasota)
WBAY-TV
Green Bay-Appleton
WTVG
Toledo
KSPR-LD
Springfield, MO
KCRG-TV
Cedar Rapids
KOLO-TV
Reno
KTRE & KLTV
Tyler-Longview
WPTA
Ft. Wayne
KSFY & KPRY
Sioux Falls
WGGB-TV
Springfield-Holyoke, MA
WEEK-TV
Peoria
WTVM
Columbus, GA-Opelika, AL
KNOE
Monroe – El Dorado
KSWO
Wichita Falls & Lawton
WALB-D2
Albany, GA
WLOX
Biloxi-Gulfport
WCJB-TV
Gainesville
WDAM-D2
Hattiesburg-Laurel
KOTA-TV, KHSD-TV and KSGW-TV
Rapid City
WHSV-TV
Harrisonburg
KAIT
Jonesboro
WBKO
Bowling Green
KGNS-TV
Laredo
KJCT-LD
Grand Junction-Montrose
WTOK-TV
Meridian
About Gray:
Gray Television, Inc. is a multimedia company headquartered in Atlanta, Georgia. Gray is the nation’s largest owner of top-rated local television stations and digital assets in the United States. Its television stations serve 113 television markets that collectively reach approximately 36 percent of US television households. This portfolio includes 80 markets with the top-rated television station and 100 markets with the first and/or second highest rated television station. It also owns video program companies Raycom Sports, Tupelo Media Group, and PowerNation Studios, as well as the studio production facilities Assembly Atlanta and Third Rail Studios. For more information, please visit www.gray.tv.
Gray Contact:
Kevin P. Latek, Executive Vice President, Chief Legal and Development Officer, 404-266-8333
Entravision Communications Corporation is a diversified Spanish-language media company utilizing a combination of television and radio operations to reach Hispanic consumers across the United States, as well as the border markets of Mexico. Entravision owns and/or operates 53 primary television stations and is the largest affiliate group of both the top-ranked Univision television network and Univision’s TeleFutura network, with television stations in 20 of the nation’s top 50 Hispanic markets. The Company also operates one of the nation’s largest groups of primarily Spanish-language radio stations, consisting of 48 owned and operated radio stations.
Michael Kupinski, Director of Research, Noble Capital Markets, Inc.
Patrick McCann, Research Associate, Noble Capital Markets, Inc.
Refer to the full report for the price target, fundamental analysis, and rating.
Solid Q3 results. Q3 revenue of $241 million increased 21% versus the prior year period, better than our $234.1 million estimate. Digital revenues accounted for much of the upside variance while stronger than expected Political advertising contributed as well. Adj. EBITDA was $25.9 million, up 12% year over year, slightly below our $27.3 million estimate, which was impacted by currency exchange rates.
Digital continues its impressive growth. Digital revenues increased 29%, driven by strong performance of the company’s digital ad agency business in Latin America. Additionally, the recent acquisitions of 365 Digital and MediaDonuts were not fully accounted for in in Q3 of 2021, leading to further upside in the quarter.
This Company Sponsored Research is provided by Noble Capital Markets, Inc., a FINRA and S.E.C. registered broker-dealer (B/D).
*Analyst certification and important disclosures included in the full report. NOTE: investment decisions should not be based upon the content of this research summary. Proper due diligence is required before making any investment decision.
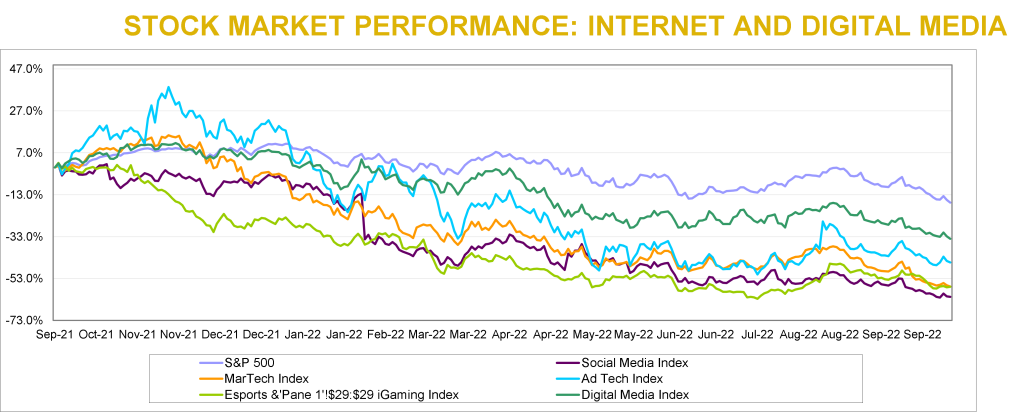
Internet and Digital Media stocks declined for the fourth consecutive quarter in a row. It wasn’t all bad, as two of Noble’s Internet and Digital Media Indices outperformed the broader market (which we define as the S&P 500). Noble’s Ad Tech (+7%) and eSports & iGaming (+7%) Indices each finished up for the quarter, and significantly outperformed the S&P 500 Index in the process, which decreased by 5% in 3Q 2022. These two sectors also materially outperformed Noble’s other Internet & Digital Media subsectors, including Noble’s Digital Media Index (-10%); Social Media Index (-15%) and MarTech Index (-16%).
Noble Indices are market cap weighted, and we attribute the relative strength of the Ad Tech Index to The Trade Desk (TTD), the Ad Tech sector’s largest market cap company, whose shares were up 42% during the quarter. Other notable performers were Digital Media Solutions (DMS; +73%) which announced a deal to be taken private, and Zeta Global (ZETA; +46%), whose 2Q results significantly exceeded guidance. Despite the relative strength of the sector, returns were not broad-based: only 9 of the 23 stocks in the Ad Tech sector were up during the quarter.
The relative strength of Noble’s eSports and iGaming sector was also driven by the largest cap stocks in the sector. Shares of Draft Kings (DKNG) increased by 30% while shares of Flutter Entertainment (ISE:FLTR), the owner of FanDuel, increased by 17%. Shares of sports betting stocks have been battered this year as investors have become skeptical of the time it might take for these companies to reach profitability amidst a backdrop of a slowing economy and consumer propensity to spend.
Year-to-date, FLTR shares are down 19% while DKNG shares are down 45%. Shares are down even more relative to their highs reached in 4Q 2020. Like the Ad Tech sector, the eSports & iGaming sector’s relative strength was not broad-based: only 4 of the 16 stocks in this sector were up during the third quarter, and all of stocks in the sector are down year-to-date.
The worst performing sector was the MarTech sector, which is also the least profitable sector, which likely explains the sector’s underperformance. Only 4 of the 24 companies we monitor in this sector generate positive EBITDA, and investors migrated away from unprofitable growth stocks towards more profitable companies or defensive sectors that might withstand a recession better. Investors would clearly like to see companies in this sector accelerate their path to profitability, and most companies in the sector are responding accordingly. To be fair, some of the companies that aren’t EBITDA positive do generate positive cash flow from operations, which is a quirk of SaaS software accounting. Of the two dozen companies in this sector, the only stock that was up during the quarter was Harte-Hanks (HHS), whose shares increased by 68%. HHS continues to generate improved operating results while lowering its debt and pension obligations.
MarTech stocks have also been victims of their own success. Earlier this year the group traded at average revenue and EBITDA multiples of 8.5x and 70.8x, respectively. Today the same group trades at average revenue and EBITDA multiples of 4.5x and 30.1x, respectively. Stocks like Shopify (SHOP), and Hubspot (HUBS) entered the year trading at 22.2x and 14.7x 2022E revenues, respectively, and now trade at 5.3x, and 7.7x, respectively. Some of this appears to be a Covid-related hangover: when Covid hit, retail companies needed to emphasize their online channels, and companies like Shopify benefited. As consumers return to stores, growth has moderated. Shopify aside, the broader message investors seem to be sending is that recurring revenues are great, but not if they are paired with EBITDA losses at a time when economy appears to be heading into a potential recession.
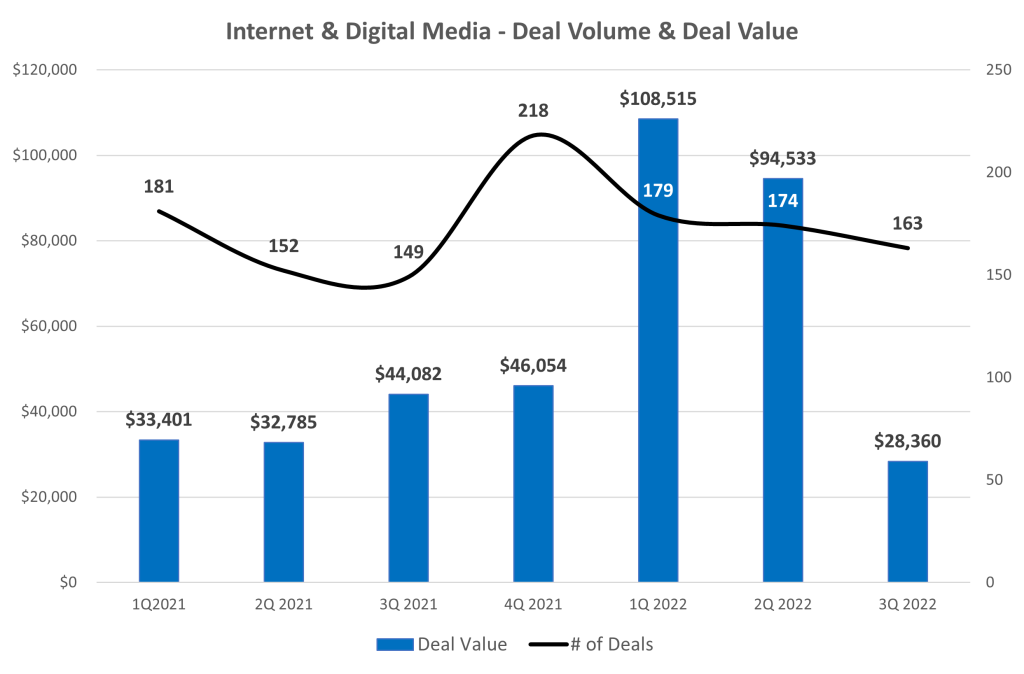
M&A Continues to Hold Up Well Despite Macro Headwinds
Overall, we are impressed with the resiliency of the M&A marketplace in the Internet & Digital Media sectors. Despite a background that includes public equity market volatility, Fed rate hikes, persistent inflation, contractionary monetary policy, and geopolitical conflict, the M&A marketplace has held up relatively well, all things considered. Noble tracked 163 transactions in the third quarter of 2022 in the TMT sectors we follow, a 9% increase compared to the third quarter of 2021, when we tracked 150 deals, and 6% sequential slowdown compared to 2Q 2022, when we tracked 174 transactions. Year-to-date, the number of M&A transactions is up 7% vs. the year ago period, with 516 announced transactions this year compared to 483 transactions announced through the end of last year’s third quarter.
The real difference between 2022 and 2021 is the dollar value of transactions. Total deal value in 3Q 2022 fell by 36% to $28.4 billion, down from $44.1 billion in 3Q 2021. On a sequential basis, the $28.4 billion in deal value represents a 70% decrease from 2Q 2022 levels of $94.5 billion, nearly half of which reflects Elon Musk’s $46 billion offer to acquire Twitter (TWTR).
In looking at the M&A trends in the chart on the previous page, the biggest change is not the number of deals, but primarily the number of mega-deals. There was only one transaction in 3Q 2022 that was greater than $10 billion dollars: Adobe’s $19.4 billion acquisition of Figma, a collaborative all-in-one design platform. This decline in larger deal activity suggests acquirers are becoming more cautious about making big bets in the current environment or it could also mean that arranging for financing to close on larger deals is becoming more challenging. No doubt the cost to incur debt to close on transactions today are higher than they were just a few months ago, which lowers the return on debt financed M&A transactions. Referencing the Twitter deal again, according to media reports, Apollo Global Management and Sixth Street Partners, which had agreed to provide financing for the Twitter deal when it was first announced in April, are no longer in talks with Elon Musk to provide financing.
From a deal volume perspective, the most active sectors we tracked were Marketing Tech (44 deals), Digital Content (43 deals) and Agency & Analytics (28 deals) and Information (25 deals). From a deal value perspective, the largest transaction was Adobe’s nearly $20 billion acquisition of Figma, a collaborative design software company. Other active sectors were Marketing Tech ($4.9 billion), Information ($1.1 billion, and Digital Content ($1.1B).
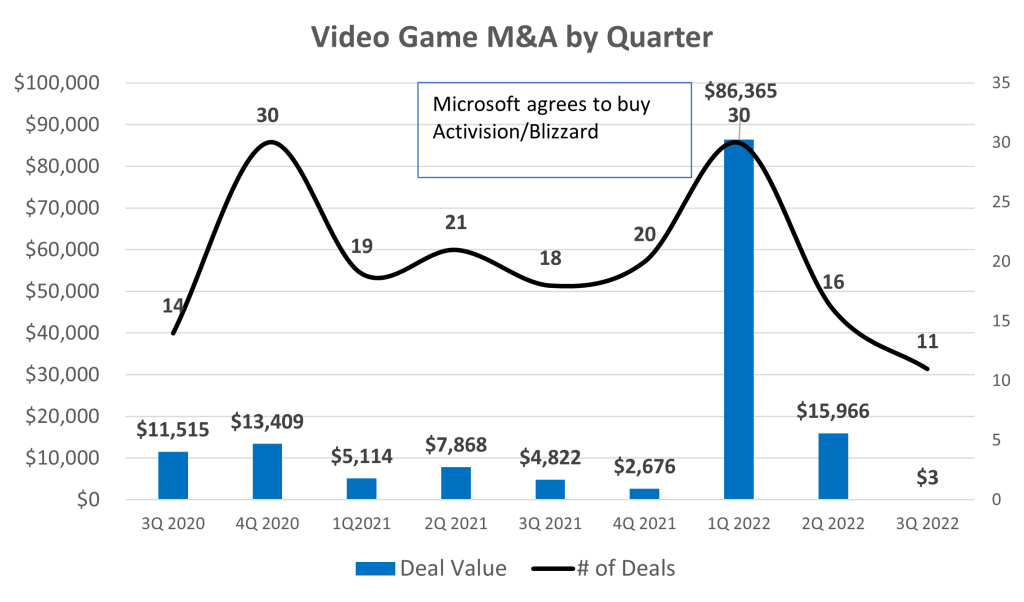
Video Game M&A Declines Precipitously
For the last several quarters we have noted how strong M&A activity was in the current quarter. Perhaps the biggest surprise of the third quarter M&A analysis was the steep drop in M&A in North America in the video gaming sector. Interest in the video gaming sector exploded at the onset of the pandemic as work form home edicts resulted in less commuting time and more time playing video games. As the pandemic has subsided and consumers return to work, the sector has faced difficult comparions, and growth has been challenged.
As shown in the chart below, over the last several quarters, the sector had averaged 21 deals per quarter and $18+ billion in deal value. In the third quarter, there were only 11 announced transactions, and only one with a transaction price announced, resulting in just $3 million of deal value. Perhaps there is some consolation in that the second largest transaction in 3Q 2022 was a gaming related transaction: Unity Software’s agreement to buy IronSource Ltd, a lead generation platform for in-game advertising, for $4.4 billion.
While we expect M&A transactions to moderate given the difficult economic backdrop and an increase in the cost of financing transactions, we expect M&A marketplace to remain resilient. In our discussions with management teams in Internet & Digital Media sectors, we are struck by how many companies believe that industry consolidation is either beneficial or necessary. Scale is widely seen as a panacea to potential slowing or declining revenue trends.
iGaming
The following is an excerpt from a recent note by Noble’s Media Equity Research Analyst Michael Kupinski
The past year has been tough on the iGaming industry. The Noble iGaming Index is down nearly 54% versus a negative 17% for the general market, as measured by the S&P 500 Index. In the latest quarter, the iGaming stocks seemed to have stabilized, up 2% versus a continued general market decline, down 5% for the general market. Interestingly, the iGaming sector was the best performing sector among the Entertainment and Esports sectors, which were up a modest 1% and down 38%, respectively.
The shares of Codere Online (CDRO) could not fight the headwinds of the industry-wide selling pressure. CDRO shares dropped 70% from its post de-SPACing in December 2021. The weakness in the shares has been in spite of the company executing on its growth strategy as planned and maintaining its fundamental pace to meet full-year guidance. In the latest quarter, the shares drifted lower (-4%) versus the industry which increased 2%.
The poor performance of the iGaming industry in many respects is due to the developmental nature of the industry. Many of the companies included in the Noble iGaming index do not generate positive cash flow, with balance sheets supporting growth investment. Certainly, there will be a shake-out of players in the industry that do not have the financial capability to invest for growth, but we believe that Codere Online is one of the survivors.
Although the company is not yet cash flow positive, its operations in Spain generated its highest quarterly cash flow since Q2 2020. Adj. EBITDA in Spain was $3.6 million, enough to offset 87% of the $4.1 million adj. EBITDA loss from the company’s operations in Mexico. Interestingly, the marketing restrictions in the country came with a silver lining of lower competition. This is because the restrictions make it harder for newer operators to establish their brands in the country. Additionally, the lower marketing costs contributed to the strong cash flow generation. Notably, management expects similar cash flow generation going forward for the Spanish operations. We view the situation in Spain favorably as the consistent cash flow profile will help fund the expansion in Latin America and have a mitigating impact on the company’s cash burn.
eSports
The Esports industry had a difficult year and a difficult quarter in terms of stock performance. The horrible stock performance does not reflect the overall industry trends. Video gaming is still on the rise. It is estimated that there are 2.7 billion gamers worldwide, expected to achieve an estimated 3.0 billion gamers in 2023, based on Newzoo’s numbers. The video game market is expected to reach $159.3 billion this year and grow to $200.0 billion in 2023. So, what about the Esports industry? Esports viewership was elevated during the Covid lockdowns, with viewership significantly higher. Viewership trends are expected to increase even from the elevated 2020 levels to over 640 million viewers in 2025.
TRADITIONAL MEDIA COMMENTARY
The following is an excerpt from a recent note by Noble’s Media Equity Research Analyst Michael Kupinski
Overview
Downward trends, but some bright spots
Traditional Media stocks have had tough sledding this year. All of Noble’s Traditional Media Indices have declined over the past 12 months and each have underperformed the general market. The downward spiral seemed to have moderated somewhat in the third quarter.
Notably, during the third quarter, many of the stocks had a very nice bounce before resuming a downward trend. At one point in the latest quarter, stocks were up as high as 30% from the second quarter end. It is important to note that only the Publishing stocks outperformed the general market in the latest quarter.
Broadcast Television
Will Political Carry The Quarter?
Noble’s TV Index dropped 10% in the third quarter, underperforming the broader market (-5%) As we indicated in our previous quarterly report, we believe that there would be a trading opportunity in media stocks. The latest quarter stock performance indicated that. Many of the TV stocks had a strong performance from the end of the second quarter (June 30) to highs achieved in August. Many of the TV stocks increased a strong 25% on average. It is instructive to know that E.W. Scripps had the largest advance from June 30 lows, up 31% to highs achieved August 16. When the industry is in favor, the shares of E.W. Scripps tends to outperform its industry peers. The shares of Entravision (EVC) were the next best performing within the quarter, up 30%, before trading lower and ending down 12%.
TV stocks were challenged by macro-economic pressures such as inflation, the rising cost of borrowing, and a Fed determined to curb inflation by slowing the economy. In the end, interest rate increases by the Fed curbed enthusiasm for TV stocks and the Noble TV Index ended the third quarter down.
The average television company reported 11% revenue growth in the latest quarter. Most broadcasters were very optimistic about political advertising, with some raising forecasts to be near the levels of the Presidential election, a highwater mark. We would note that Entravision had the highest revenue performance in the quarter, up 24%, as the company continues to benefit from its transition toward faster growth digital advertising, which now accounts for over 80% of its total company revenues.
EBITDA margins were healthy, with the average margin for the industry at 25.5%. It is notable to mention that Entravision’s margins appear to be significantly below that of the industry at 10%. Its digital advertising business is a rep firm business, and, as such, the company reports revenues on a net basis and not gross revenues. While a rep firm business tends to be a lower margin business, the accounting treatment for rep revenues gives the appearance of very low margins. The company is in a strong cash flow and free cash flow position.
Most companies will be reporting third quarter financial results in the first two weeks in November. We believe that the third quarter will reflect an influx of political advertising, even though the lion share of the political advertising likely will fall in the fourth quarter. Consequently, we believe that the third quarter revenue growth will be better than the second quarter, showing some acceleration. With signs of weakening national advertising, and a likely weakening local advertising environment in some larger markets, broadcasters are looking forward toward Q4 political advertising as an offset. Many broadcasters indicated that political advertising may be at record levels in 2022, even higher than the Presidential election year of 2020. Political advertising, however, is not usually evenly spent across all markets. As such, there may be winners and some disappointment.
Investors are not encouraged to buy a Television broadcaster on the basis of the upcoming fourth quarter political advertising influx. There are broader issues at play, like cord cutting, slowing retransmission revenue growth, and the prospect for a weakening economy. We believe broadcasters with minimal emphasis on national advertising, a larger focus on small to medium size markets and local advertising, are best positioned to weather an economic downturn. We also like companies that do not have high debt leverage. In addition, we like diversified companies that can benefit from cord cutting, like E.W. Scripps, or have diversified revenue streams and large fast growing digital businesses, like Entravision.
Broadcast Radio
Polishing its tarnished image
One of the epic fails of the radio industry has been Audacy (AUD), once one of the leadership companies in the industry. AUD shares are down a staggering 95% from highs in March 2021. The poor stock performance reflects the poor revenue and cash flow performance and high debt levels at the company. Recently, the company announced that it plans to sell some of its prized assets, including its podcasting business, Cadence 13, in an effort to more aggressively pare down debt.
While Audacy struggles, there are emerging leaders in the industry, many that are not focused on its radio business. The average radio revenue grew 8.9%. Companies that were at the top of the list of revenue growth had diversified revenue streams. Townsquare Media (TSQ) was the best performer, with Q2 revenue growth of 13.6%. We believe that Townsquare also benefits from significantly lower national advertising and concentration on less cyclical larger markets. Other diversified companies that performed better than the lower growth companies in the group were Salem Media and Beasley Broadcasting. Salem Media has diversified into content creation and digital media and Beasley recently accelerated its push into Digital Media. Separately, Beasley recently announced a station swap with Audacy, which will enhance its position in with its four existing stations in Las Vegas.
On the margin front, Townsquare Media also was among the leaders in the industry. Notably, Townsquare Media’s digital business carries margins similar to its radio businesses, near 30%. As such, its investments in Digital Media are not depressing its total company margins. Townsquare’s Q2 adj. EBITDA margins were 27%, well above that of the larger industry peers like iHeart (25%), Cumulus Media (19%), and Audacy (12%).
In looking forward toward the upcoming third quarter results, which will be released in coming weeks, we believe that the effects of rising inflation and weakening economy will start to show. Many of the larger broadcasters which focus on larger markets, have national network business, may disappoint. In addition, we believe that there will be spotty political advertising performances. In our view, the resulting potential weakness in the stocks may create an opportunity to more aggressively accumulate or establish positions.
Radio stocks largely mirrored the performance of the TV industry, falling 9% in the third quarter. Last quarter we pointed out that large industry players such as Audacy and iHeart had an outsized negative impact on the market cap-weighted index. This was due to the stocks being downgraded by a Wall Street firm on the basis of high leverage in a time of recession.
However, there are several broadcasters in the radio industry with improving leverage profiles. Furthermore, we believe that in a time when traditional radio companies are making a transition to more digitally based revenue sources, investors would do well to differentiate among them on that basis as well. In our view, certain companies are ahead of peers in the digital transformation and are better shielded from certain fundamental headwinds that have traditionally plagued radio broadcasters in prior recessions, such as Townsquare Media (TSQ), Salem Media (SALM), and Beasley Broadcasting (BBGI).
Publishing
Once a leader, now a laggard
It is hard to believe that Gannett was once a $90 stock and held a record for one of the longest strings of quarterly earnings gains in the S&P 500 Index. The shares are down 80% from year earlier highs to near $1.37. For some anti newspaper investors, this is a “told you so” moment. But, this view missed notable exceptions, like the New York Times, which seemed to transition more quickly toward digital revenues. There are publishers that are set apart from the weak trends at Gannett and are on a favorable trajectory toward a digital future. As such, we believe that investors should not throw the baby out with the bathwater or avoid the industry. There are gems here, which is discussed later in this report.
There were sizable differences in the financial performance of the companies in the publishing group.Q2 publishing revenue declined on average 1.5%. The notable exceptions to this performance was The New York Times, up 11.5%, News Corp, up 7.3%, and Lee Enterprises, down a modest 0.7%. The improved performance into the ranks of the leaders in the industry is quite notable. Lee’s digital subscriptions currently lead the industry. The company has exceeded all of its peers in terms of digital subscription growth in the past 11 consecutive quarters. Furthermore, over 50% of its advertising is derived from digital. Currently, roughly 30% of the company total revenues are derived from digital, still short of the 55% at The New York Times, but closing the gap.
Not only is Lee performing well on the digital revenue front, it has industry leading margins. Lee’s Q2 EBITDA margins were 12%, in line with News Corp and second only to the New York Times at 17%. We believe that margins should improve over time as the company continues to migrate toward a higher digital margin business model.
Noble’s Publishing Index, which decreased a modest 2% in the quarter, outperforming the S&P (-5%). The relatively favorable performance of the index was primarily due to its largest constituents, News Corp. and The New York Times, which rebounded from -30% and -39%, respectively in Q2, to -3% and +3%, respectively, in Q3. The average percentage change of the stocks in the industry was -16%, more in line with Traditional Media as a whole. One of the poor performing stocks in the index for the quarter was Gannett (GCI) which declined 47%. It was recently reported that the company implemented austerity measures included unpaid leave and voluntary layoffs. In the case of Lee Enterprises, the shares were down a much more modest 7%, more in line with the general market.
LEE shares trade at an average industry multiple of 5.8 times Enterprise Value to our 2023 adj. EBITDA estimate. Notably, the company is closing the gap with its Digital Media revenue contribution to that of New York Times, which is currently trading at an estimated 14.5 times EV to 2023 adj. EBITDA. We believe that the valuation gap with the New York Times should close as well. In recent Lee Enterprise news, a buyout specialist investor filed a 13D and indicated interest in taking the company private. While financial players continue to circle the wagons for Lee, we believe that investors should take note.
This newsletter was prepared and provided by Noble Capital Markets, Inc. For any questions and/or requests regarding this news letter, please contact Chris Ensley
DISCLAIMER
All statements or opinions contained herein that include the words “ we”,“ or “ are solely the responsibility of NOBLE Capital Markets, Inc and do not necessarily reflect statements or opinions expressed by any person or party affiliated with companies mentioned in this report Any opinions expressed herein are subject to change without notice All information provided herein is based on public and non public information believed to be accurate and reliable, but is not necessarily complete and cannot be guaranteed No judgment is hereby expressed or should be implied as to the suitability of any security described herein for any specific investor or any specific investment portfolio The decision to undertake any investment regarding the security mentioned herein should be made by each reader of this publication based on their own appraisal of the implications and risks of such decision This publication is intended for information purposes only and shall not constitute an offer to buy/ sell or the solicitation of an offer to buy/sell any security mentioned in this report, nor shall there be any sale of the security herein in any state or domicile in which said offer, solicitation or sale would be unlawful prior to registration or qualification under the securities laws of any such state or domicile This publication and all information, comments, statements or opinions contained or expressed herein are applicable only as of the date of this publication and subject to change without prior notice Past performance is not indicative of future results.
Please refer to the above PDF for a complete list of disclaimers pertaining to this newsletter
Entravision Communications Corporation is a diversified Spanish-language media company utilizing a combination of television and radio operations to reach Hispanic consumers across the United States, as well as the border markets of Mexico. Entravision owns and/or operates 53 primary television stations and is the largest affiliate group of both the top-ranked Univision television network and Univision’s TeleFutura network, with television stations in 20 of the nation’s top 50 Hispanic markets. The Company also operates one of the nation’s largest groups of primarily Spanish-language radio stations, consisting of 48 owned and operated radio stations.
Michael Kupinski, Director of Research, Noble Capital Markets, Inc.
Refer to the full report for the price target, fundamental analysis, and rating.
Accelerates purchase of Cisneros. The company announced that it paid $22 million and will pay another $22 million in April 2023 for a total of $44 million for the remaining balance that it owes for Cisneros. This accelerates the payment plan for 49% of Cisneros that it agreed to acquire in 2021. Under the original plan, the company was expected to have paid as much as $60 million over the next 2 years.
Frees management. We believe that the advanced timeline for the payment, which is expected to have included performance fees, frees management to pursue growth opportunities outside of its existing Latin American territories.
This Company Sponsored Research is provided by Noble Capital Markets, Inc., a FINRA and S.E.C. registered broker-dealer (B/D).
*Analyst certification and important disclosures included in the full report. NOTE: investment decisions should not be based upon the content of this research summary. Proper due diligence is required before making any investment decision.