Innovation Works Best as a Freewheeling Process Not Grand Design

Image credit: Marcus Herzberg (Pexels)

For Now, Innovation and Entrepreneurship Still Hold a High Place in the USA

Commentators worry that the United States might lose its dominance in innovation to Asian countries like China and Singapore. Many policymakers are intimidated by the R&D budgets of Asian countries and by their superior performance on international academic assessments. However, these concerns are misguided because the United States still dominates innovation.

The United States ranks second on the Global Innovation Index and scores the highest in the world on fifteen of eighty-one innovation indicators. The US innovation ecosystem continues to lead in the commercialization of research, and its universities are on the cutting edge of academic research. Other countries are expanding research budgets, but the United States’ genius is its ability to commercialize relevant innovations.

Innovations are only useful when they disrupt industries by transforming society and altering consumer preferences. Because innovations respond to market changes, anything can become an innovation, and the process is highly spontaneous. Unfortunately, too many countries are laboring under the assumption that government plans inevitably lead to innovation. Finding the next game changer is tremendously difficult due to the dynamism of consumer preferences.

US entrepreneurs appreciate that innovation is a freewheeling process rather than an object of grand design. That is why Silicon Valley, with its reverence for risk and failure, has been known for innovation. In her 2014 book, The Upside of Down: Why Failing Well is the Key to Success, Megan McArdle argues that the United States’ tolerance toward failure is a crucial pillar of prosperity because it promotes self-actualization, risk, and the continuous quest for innovation.

The United States’ rivals have eloquent five-year plans and extravagant budgets, but US innovation is undergirded by private institutions with a strong appetite for risk and iconoclastic thinking. Private venture-capital associations and research institutions searching for future pioneers are the primary players in US innovation. Government innovation plans are inherently conservative because they hinge on the success of targeted industries.

But, in the private sector, entrepreneurs are deliberately scouting for disruptors to undercut traditional industries by launching breakthrough products. The conformity of government bureaucracies is an enemy of the unorthodox thinking that spurs innovation. China is known for having a competent and meritocratic civil service, yet scholars contend that it lacks an innovative environment.

A key problem is that China focuses on competing with western rivals instead of developing new industries; innovation is perceived as a competition between China and its rivals rather than an activity pursued for its own sake. Consequently, US companies remain market leaders and are more adept at converting market information into innovative products than their Chinese counterparts. Unlike China, US entrepreneurship is not a function of geopolitics.

Meanwhile, some commentators suggest that the US education system is better at deploying talent due to its encouragement of unorthodox thinking. In contrast, Singapore and China have been criticized for emphasizing rote learning at the expense of critical thinking. For example, Singapore’s public sector is a model of excellence; however, despite government support, Singapore is yet to become an innovation hotbed.

Bryan Cheung, in an assessment of industrial policy in Singapore, comments on the failure of Singapore to translate research into innovation: “Even though Singapore ranks highly on global innovation indices, closer scrutiny reveals that it scores poorly on the sub-component of innovation efficiency.” A recent edition of the Global Innovation Index, using a global comparison, declared that “Singapore produces less innovation outputs relative to its level of innovation investments.”

Cheung explains that Singapore is heavily reliant on foreign talent to boost innovation: “Even the six ‘unicorns’ that Singapore has produced (Grab, SEA, Trax, Lazada, Patsnap, Razer) were all founded or co-founded by foreign entrepreneurs. In the Start-Up Genome (2021), Singapore also performed relatively poorly in ‘quality and access’ to tech talent, research impact of publications, and local market reach, which is unsurprising since innovation activity is concentrated in foreign hands.”

Asian countries are growing more competitive, but it will take decades before they develop the United States’ appetite for risk, market-driven innovations, and the uncanny ability to monetize anything. The United States’ spectacular economic performance and business acumen are based on its unique culture. Those who bet against the United States by downplaying its culture are bound to lose. The United States’ rivals are still catching up.

About the Author

Lipton Matthews is a researcher, business analyst, and contributor to Merion WestThe FederalistAmerican Thinker, Intellectual Takeout, mises.org, and Imaginative Conservative. Visit his YouTube channel, here. He may be contacted at lo_matthews@yahoo.com or on Twitter (@matthewslipton)

Inflation, Interest Rates, and Economic Growth – Where are We Headed?

Global Economy 2023 – Central Banks Face an Epic Battle Against Inflation Amid Political Obstacles

Where is the global economy heading in 2023?

After all the challenges of last year, it’s a question asked with concern. Just as the economy was dealing with the aftermath of the COVID-19 pandemic, Russia’s invasion of Ukraine added a little more impetus to global inflation.

Significant rises in the cost of vital items such as food and energy created a cost-of-living issue that needs to be addressed by households and businesses. Central banks reacted with a barrage of interest-rate hikes, while a wave of industrial action saw workers in many countries fighting for pay and conditions to keep pace with this more expensive economic era.

Now, as we begin 2023, these conditions are set to continue, and the IMF thinks that a third of the world will experience a recession in the coming months. This article discusses the weakening independence of central banks and the uncertainty and possible high costs the political influence brings.

This article takes a deep dive into the new interference the Federal Reserve and other central bankers are faced with. It was authored by Steve Schifferes, Honorary Research Fellow, City Political Economy Research Centre, City, University of London. Schifferes believes there are two key ways politics may interfere with central bank plans in 2023.

Some of the world’s biggest economies – and their central banks – face a tricky task this year taming inflation via higher interest rates without triggering a recession.

And whether they like it or not, the U.S. Federal Reserve, the Bank of England and other central banks are now being thrust into the center of a political debate that could threaten their independence as well as their ability to act decisively to curb rising prices.

I’ve been following and covering politics and finance for four decades as a reporter and now as an economics research fellow. I believe there are two key ways politics may interfere with central bank plans in 2023.

An Inflationary Challenge

High inflation is perhaps the biggest challenge facing the world economy over the coming year.

Inflation has rapidly accelerated and is now at or near its highest rate in decades in most developed economies like the U.S. and in Europe, causing living standards to stagnate or decline in many countries. This has particularly hurt the poorest people, who suffer a higher rate of inflation than the general population because they spend more of their income on food and energy.

The sharp rise in inflation caught central banks by surprise after two decades of low and stable inflation. They reacted by aggressively raising interest rates in the second half of 2022, with the Fed leading the way. The U.S. central bank lifted rates 4.25 percentage points over a six-month period, and the Bank of England, the European Central Bank, and others followed in its footsteps.

Their strategies seem to be working. Inflation in the U.S. has slowed, while in the U.K. and the eurozone, recent data suggest inflation may have peaked – although it’s still very high, at around 10% – and might start trending down.

But interest rate hikes – which are expected to continue in 2023, albeit at a slower pace – could further cloud the outlook for economic growth, which already looks grim for developed economies.

The Organization for Economic Cooperation and Development predicts that in 2023 both the U.S. and the eurozone will grow by only 0.5%, well below their historic averages, while Europe’s largest economy, Germany, will actually shrink by 0.3%. In the U.K., the Bank of England projects that the economy will continue to shrink until the middle of 2024.

Fiscal Spending and Inflation

That brings us to the first political problem that could upset central bank plans: government spending.

The politics is playing out in different ways. In the U.S., spending has increased substantially, most notably with the $1.2 trillion infrastructure bill signed into law in late 2021 and the $1.7 trillion budget bill passed in December.

This kind of expansionary fiscal policy, which may be in place for years, could undermine attempts by central banks like the Fed to fight inflation. As the central banks seek to reduce inflation by curbing demand, increased government spending has the opposite effect. This could force the Fed and other banks to raise rates even higher than they otherwise would have.

In Europe and the U.K., governments have been forced to spend billions to subsidize the energy bills of consumers and businesses, while the economic slowdown has reduced their tax revenue, leading to soaring government deficits

Nevertheless, in the U.K. the Conservative government has prioritized the fight against inflation, announcing cutbacks to consumer subsidies for energy, plus higher taxes and further cuts in public spending if it wins the next general election, which is expected to take place in 2024. While these actions are deflationary, they are politically unpopular.

The Bank of England is now split on whether or how fast to continue to raise rates.

Central Bank Independence Under Threat

The other political problem is more existential for central banks and makes their task all the more delicate.

For the past 20 years, their independence from government interference and the setting of public inflation targets at around 2% have helped them gain credibility in fighting inflation, which stayed at historic lows for much of the 21st century.

Now both their credibility and independence may be under threat.

Central bankers, especially in Europe, are acutely aware of public concerns about how higher interest rates might stifle growth, in part because their economies have been more severely affected than the U.S. by the Ukraine war. Meanwhile, consumers are being hit by higher mortgage payments, which may tank the housing market.

At the same time, central bank efforts to persuade workers not to ask for higher wages to compensate for inflation, which would help reduce the need for more interest rate hikes, have spectacularly backfired, especially in Britain, where a wave of strikes by public-sector workers shows no sign of abating.

Long-standing political tensions over the role of the European Central Bank have been exacerbated by the election of right-wing governments in several eurozone countries.

Traditionally, under the influence of Germany’s Bundesbank, the European Central Bank has worried about inflation more than other central banks. Under competing political pressures, it has moved more slowly than some other central banks to unwind its policy of low – and even negative – interest rates.

In the States, where Fed Chief Jerome Powell has rejected any attempt to mitigate his focus on inflation, political pressures may grow from both left and right, particularly if Donald Trump becomes the Republican presidential nominee. This ultimately may lead Congress or a new administration to try to change the central bank’s approach, its leadership, and even its mandate.

Uncharted Waters

None of this might be a problem if central bank projections of a sharp fall in inflation by the end of 2023 come to pass. But these projections are based on the belief that energy prices will continue to remain below their peak or even fall further in the coming year.

Just as in 2022, when central banks failed to grasp the inflationary threat early enough, other risks beyond their control, as well as political developments, may derail their hopes. These include an escalation of the war in Ukraine, which could raise energy prices further, more supply chain disruptions from China, and domestic pushes for higher wages.

With the cost-of-living crisis now at the top of the public’s agenda in many developed countries, the setting of interest rates has ceased to be just a technical matter and has instead become highly political. Both governments and central banks are entering uncharted waters in their attempt to curb inflation without stifling growth. If their projections prove overly optimistic, the political as well as the economic costs could be high.

All this means that the outlook for inflation is highly uncertain. And fears of 1970s-style stagflation – high inflation and stagnant economic growth – could become a reality.

Two Non-Wall Street Economists Share Their 2023 Projections

Image Credit: Engin Akyurt (Pexels)

Inflation, Unemployment, the Housing Crisis, and a Possible Recession: Two Economists Forecast What’s Ahead in 2023

With the current U.S. inflation rate at 7.1%, interest rates rising and housing costs up, many Americans are wondering if a recession is looming.

Two economists discussed that and more in a recent wide-ranging and exclusive interview for The Conversation. Brian Blank is a finance professor at Mississippi State University who specializes in the study of corporations and how they respond to economic downturns. Rodney Ramcharan is an economist at the University of Southern California who previously held posts with the Federal Reserve and the International Monetary Fund.

Both were interviewed by Bryan Keogh, deputy managing editor and senior editor of economy and business for The Conversation.

Are we headed for a recession in 2023?

Brian Blank: The consensus view among most forecasters is that there is a recession coming at some point, maybe in the middle of next year. I’m a little bit more optimistic than that consensus.

People have been calling for a recession for months now, and this seems to be the most anticipated recession on record. I think that it could still be a ways off. Consumer balance sheets are still relatively strong, stronger than we’ve seen them for most periods.

I think that the labor market is going to remain hotter than people have expected. Right now, over the last eight months, the labor market has added more jobs than anticipated, which is one of the strongest streaks on record. And I think that until consumer balance sheets weaken considerably, we can expect consumer spending, which is the largest part of the economy, to continue to grow quickly.

[But this] doesn’t mean that a recession is not coming. There’s always a recession somewhere down the road.

Rodney Ramcharan: Indeed, yes, there’s a likelihood that the economy is going to contract in the next nine months. The president of the New York Fed expects the unemployment rate to go up from 3.5% currently to somewhere between 4% to 5% in the next year. And I think that will be consistent with a recession.

In terms of how much worse it can be beyond that, it’s going to depend on a number of things. It could depend on whether the Fed is going to accept a higher inflation rate over the medium term or whether it’s really committed to getting the inflation rate down to the 2% rate. So I think that’s the trade-off.

Will unemployment go up?

Blank: [Unemployment] hasn’t risen much, and maybe it’ll pick up to somewhere close to 4%. Many are expecting something like four and a half percent. And I think that’s certainly possible. And I think that we can see small upticks in the coming months.

But I don’t think it’s going to rise as quickly as some people are expecting, in part because what we’ve seen so far is a lack of labor force participation. Until more people enter the labor market, I think there are going to be plenty of jobs to go around.

What is your outlook on interest rates?

Ramcharan: As people find it more and more difficult to find jobs, or to get jobs as they begin to lose jobs, I think that’s going to dampen spending. And we’re seeing that now as the cost of borrowing has gone up sharply, and the Fed is expecting that.

The expectation is the federal funds rate will go up to 5% by next year. If you tack on another couple of points, because of the risk involved, then the cost to borrow to buy a home could potentially get up to 8% for some people. And that could be very expensive.

And the flip side of this for businesses is there’s potentially going to be a slowdown in cash flow. If consumers are not spending, then the revenues that businesses depend on to make investments might not be there.

The additional piece in this puzzle is what the banks will then do. I think banks are going to begin to curtail the extension of credit. So not only will interest rates go up for the typical consumer and the typical business, it’s also likely that they are more likely to experience denial of credit, and so that should together begin to slow spending quite a bit.

After massive increases in housing prices, what caused them to suddenly drop?

Ramcharan: As the Fed lowered interest rates, there was a massive shift among the population for various reasons. They decided that housing was the right investment or the right thing. And so when 50 million people all collectively decide to buy homes, the supply of homes is reasonably constrained in the short run. And so that led to this massive increase in house prices and in rents.

In the last three months, the housing market has cooled sharply. We’re now seeing house prices beginning to fall. I would imagine, going forward, the housing market cooling is going to be a major driver behind the slowdown in the inflation rate and in real estate investment trusts. So that’s positive.

Our recent election just changed the composition of Congress. How will that affect the economy?

Blank: Certainly, when we have a divided Congress, we’re less likely to see decisions made that involve passing legislation that might support the economy. And I think it’s likely the Republican House is going to become a little bit more conservative with spending.

And so if we do start to see a downturn, I think you’re less likely to see legislation that might help support an economy that could be in need of it. That is going to make the job of the Federal Reserve more important.

How certain are these predictions?

Ramcharan: I just want to be careful here and let your viewers know that we’re making these statements based on theory, because the inflation that we’re experiencing now comes about from a pandemic, and there really is no evidence, there’s no data available, that people can look to to say, “What happens to an economy after a pandemic?” That data does not exist.

So we’re trying to piece together the data we do have with the theories we do have, but there’s a huge band of uncertainty about what’s going to happen.

Watch the full interview here.

Should We Tax Robots?

Image credit: Steve Jurvetson (Flickr)

Could a Modest Levy Combat Automation’s Impact on Income Imbalance?

Peter Dizikes | MIT News Office

What if the U.S. placed a tax on robots? The concept has been publicly discussed by policy analysts, scholars, and Bill Gates (who favors the notion). Because robots can replace jobs, the idea goes, a stiff tax on them would give firms incentive to help retain workers, while also compensating for a dropoff in payroll taxes when robots are used. Thus far, South Korea has reduced incentives for firms to deploy robots; European Union policymakers, on the other hand, considered a robot tax but did not enact it. 

Now a study by MIT economists scrutinizes the existing evidence and suggests the optimal policy in this situation would indeed include a tax on robots, but only a modest one. The same applies to taxes on foreign trade that would also reduce U.S. jobs, the research finds.  

“Our finding suggests that taxes on either robots or imported goods should be pretty small,” says Arnaud Costinot, an MIT economist, and co-author of a published paper detailing the findings. “Although robots have an effect on income inequality … they still lead to optimal taxes that are modest.”

Specifically, the study finds that a tax on robots should range from 1 percent to 3.7 percent of their value, while trade taxes would be from 0.03 percent to 0.11 percent, given current U.S. income taxes.

“We came into this not knowing what would happen,” says Iván Werning, an MIT economist and the other co-author of the study. “We had all the potential ingredients for this to be a big tax, so that by stopping technology or trade, you would have less inequality, but … for now, we find a tax in the one-digit range, and for trade, even smaller taxes.”

The paper, “Robots, Trade, and Luddism: A Sufficient Statistic Approach to Optimal Technology Regulation,” appears in the advance online form in The Review of Economic Studies. Costinot is a professor of economics and associate head of the MIT Department of Economics; Werning is the department’s Robert M. Solow Professor of Economics.

A Sufficient Statistic: Wages

A key to the study is that the scholars did not start with an a priori idea about whether or not taxes on robots and trade were merited. Rather, they applied a “sufficient statistic” approach, examining empirical evidence on the subject.

For instance, one study by MIT economist Daron Acemoglu and Boston University economist Pascual Restrepo found that in the U.S. from 1990 to 2007, adding one robot per 1,000 workers reduced the employment-to-population ratio by about 0.2 percent; each robot added in manufacturing replaced about 3.3 workers, while the increase in workplace robots lowered wages about 0.4 percent.

In conducting their policy analysis, Costinot and Werning drew upon that empirical study and others. They built a model to evaluate a few different scenarios, and included levers like income taxes as other means of addressing income inequality.

“We do have these other tools, though they’re not perfect, for dealing with inequality,” Werning says. “We think it’s incorrect to discuss this taxes on robots and trade as if they are our only tools for redistribution.”

Still more specifically, the scholars used wage distribution data across all five income quintiles in the U.S. — the top 20 percent, the next 20 percent, and so on — to evaluate the need for robot and trade taxes. Where empirical data indicates technology and trade have changed that wage distribution, the magnitude of that change helped produce the robot and trade tax estimates Costinot and Werning suggest. This has the benefit of simplicity; the overall wage numbers help the economists avoid making a model with too many assumptions about, say, the exact role automation might play in a workplace.

“I think where we are methodologically breaking ground, we’re able to make that connection between wages and taxes without making super-particular assumptions about technology and about the way production works,” Werning says. “It’s all encoded in that distributional effect. We’re asking a lot from that empirical work. But we’re not making assumptions we cannot test about the rest of the economy.”

Costinot adds: “If you are at peace with some high-level assumptions about the way markets operate, we can tell you that the only objects of interest driving the optimal policy on robots or Chinese goods should be these responses of wages across quantiles of the income distribution, which, luckily for us, people have tried to estimate.”

Beyond Robots, an Approach for Climate and More

Apart from its bottom-line tax numbers, the study contains some additional conclusions about technology and income trends. Perhaps counterintuitively, the research concludes that after many more robots are added to the economy, the impact that each additional robot has on wages may actually decline. At a future point, robot taxes could then be reduced even further.  

“You could have a situation where we deeply care about redistribution, we have more robots, we have more trade, but taxes are actually going down,” Costinot says. If the economy is relatively saturated with robots, he adds, “That marginal robot you are getting in the economy matters less and less for inequality.”

The study’s approach could also be applied to subjects besides automation and trade. There is increasing empirical work on, for instance, the impact of climate change on income inequality, as well as similar studies about how migration, education, and other things affect wages. Given the increasing empirical data in those fields, the kind of modeling Costinot and Werning perform in this paper could be applied to determine, say, the right level for carbon taxes, if the goal is to sustain a reasonable income distribution.

“There are a lot of other applications,” Werning says. “There is a similar logic to those issues, where this methodology would carry through.” That suggests several other future avenues of research related to the current paper.

In the meantime, for people who have envisioned a steep tax on robots, however, they are “qualitatively right, but quantitatively off,” Werning concludes.

Reprinted with permission of MIT News” (http://news.mit.edu/)

How Inflation Clips Age Groups Differently

Image Credit: Rodnae (Pexels)

Inflation for Americans at Each Age

According to the Bureau of Labor Statistics, consumer prices rose 9.1% from June 2021 to June 2022, the highest rate since 1981. That figure is an average of price increases for bananas, electricity, haircuts, and more than 200 other categories of goods and services. But households in different age groups spend money differently, so inflation rates vary by age, too. The diagrams below show average spending for households at different ages, in the categories that make up the inflation index.

25 Year-Olds / Full Interactive Graphic

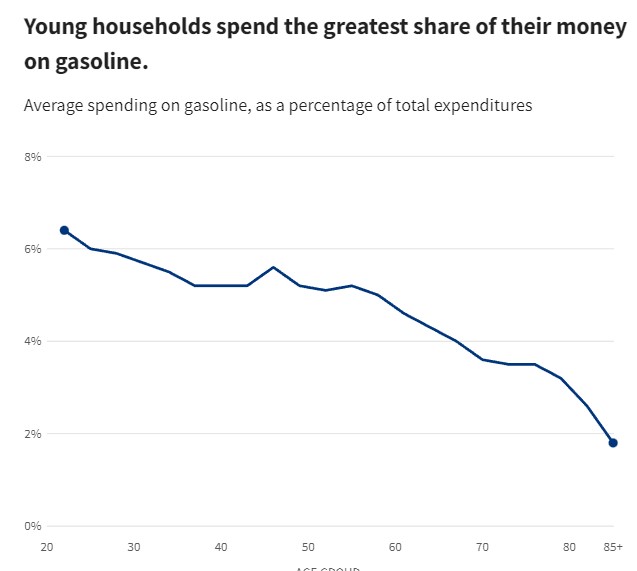
Young households spend more of their budgets on gasoline, where prices rose 60% in the last year. Gasoline has been the largest single-category driver of inflation since March 2021, accounting for nearly 25% of inflation by itself. Gas has had an outsized impact considering that the category is 4.8% of Consumer Price Index spending. (Gasoline prices began falling in mid-June.)

40 Year-Olds / Full Interactive Graphic

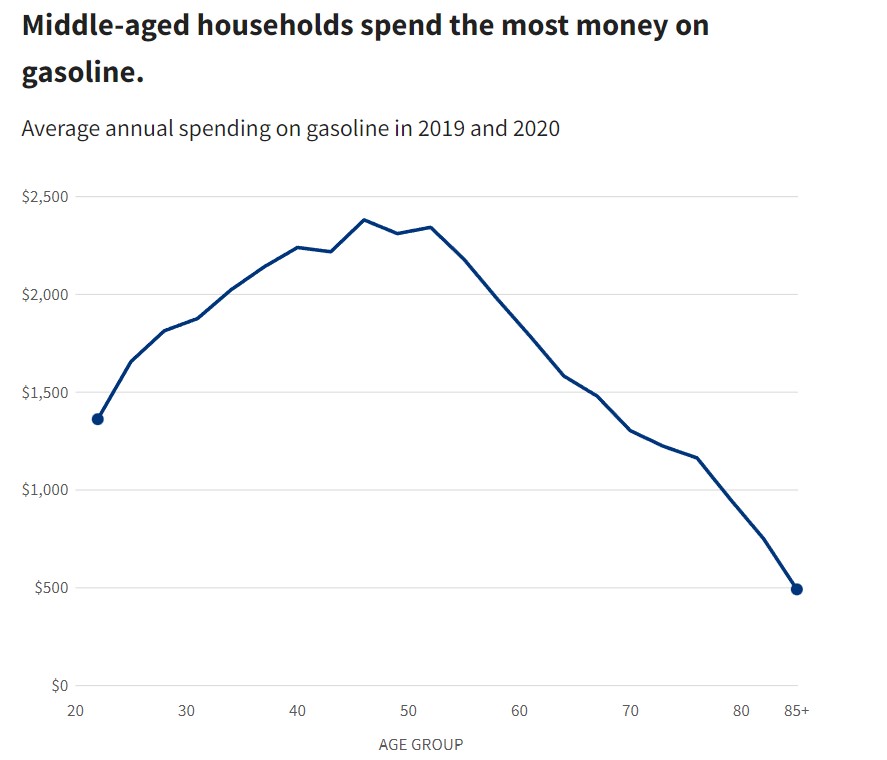
Measured in dollars, gasoline spending peaks around age 40, according to government surveys.

But, as a percentage of spending, gasoline spending is highest for the youngest households.

Sources:
US Bureau of Labor Statistics
Consumer Expenditure Survey
Consumer Price Index

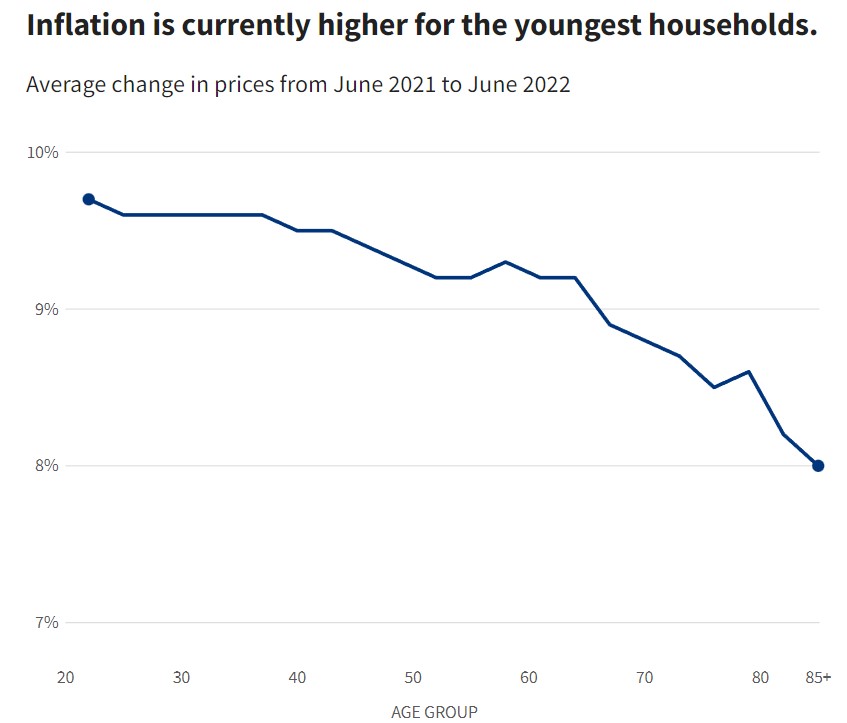
Taking an average of all categories, as the inflation index does, shows that inflation is currently highest for younger households. It is about 2 percentage points higher for households headed by 21-year-olds as it is for octogenarians who live at home. That has not been true for most of the last 40 years. Inflation rates calculated in this way were higher for older households as recently as early 2021, when medical care costs were rising faster than gasoline prices.

Sources:
US Bureau of Labor Statistics
Consumer Expenditure Survey
Consumer Price Index

These estimates are imperfect. The Bureau of Labor Statistics notes in its estimate of inflation for elderly households that different age groups may buy different items within each category or buy them from different types of stores. They may also live in locations with costs of living so dissimilar that national changes in prices are not relevant. Over the past 12 months, inflation was 6.7% in the New York City metropolitan area and 12.3 in the Phoenix metropolitan area, due in part to different housing markets.

The above was adapted from USAFacts and is the intellectual property of USAFacts protected by copyrights and similar rights. USAFacts grants a license to use this Original Content under the Creative Commons Attribution-ShareAlike 4.0 (or higher) International Public License (the “CC BY-SA 4.0 License”).

Nuclear Fusion Technology Could Be A $40 Trillion Market

Nuclear Fusion’s Potential to Be a Highly Disruptive Breakthrough with Investment Opportunities

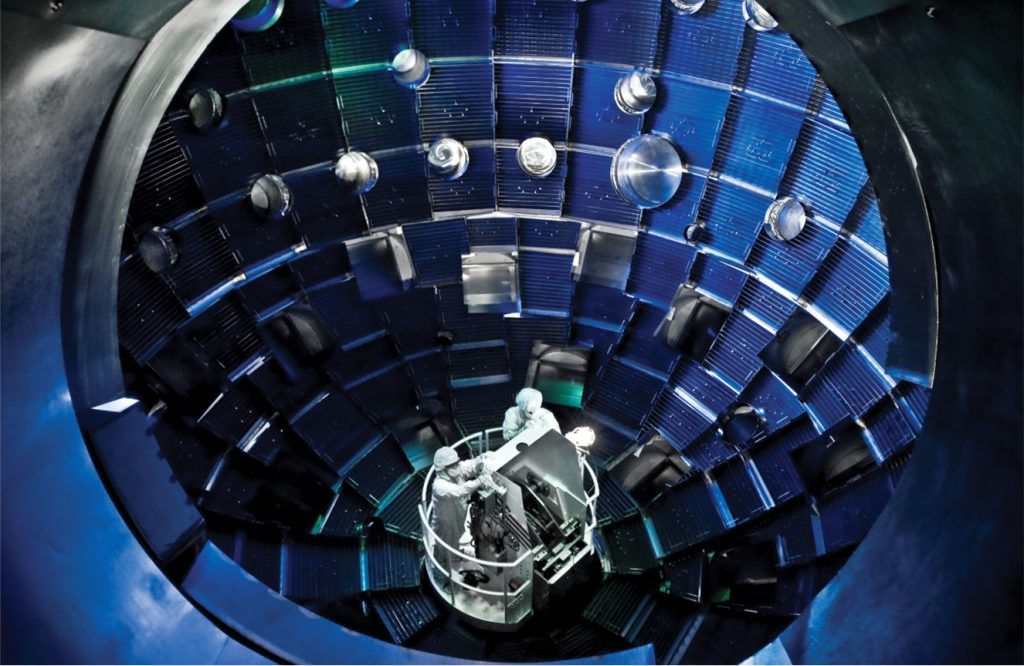
Scientists at the Energy Department’s Lawrence Livermore National Laboratory (LLNL) in California announced the first-ever demonstration of fusion “ignition.” This means that more energy was generated from fusion than was needed to operate the high-powered lasers that triggered the reaction. More than 2 megajoules (MJ) of laser light were directed onto a tiny gold-plated capsule, resulting in the production of a little over 3 MJ of energy, the equivalent of three sticks of dynamite.

This important milestone is the culmination of decades’ worth of research and lots of trial and error, and it makes good on the hope that humanity will one day enjoy 100% clean and plentiful energy.

This article was republished with permission from Frank Talk, a CEO Blog by Frank Holmes
of U.S. Global Investors (GROW).
Find more of Frank’s articles here – Originally published December 19, 2022.

Unlike conventional nuclear fission, which produces highly radioactive waste and carries the risk of nuclear proliferation, nuclear fusion has no emissions or risk of cataclysmic disaster. That should please activists who support renewable, non-carbon-emitting energy sources such as wind and solar and yet oppose nuclear power.

75th Anniversary of Another Great American Invention, The Transistor

I think it’s only fitting that this breakthrough occurred not just in the U.S., the most innovative country on earth, but also on the 75th anniversary of the invention of the transistor.

Like fusion energy, the transistor’s importance can’t be overstated. Invented in December 1947 in New Jersey’s storied Bell Labs—also the birthplace of the photovoltaic cell, fiber optic cable, communications satellite, UNIX operating system and C programming language—the transistor made the 20th century possible. Everything we use and enjoy today, from our iPhones to our Teslas, wouldn’t exist without the seminal American invention.  

In 2021, the electric vehicle maker unveiled its proprietary application-specific integrated circuit (ASIC) for artificial intelligence (AI) training. The ASIC chip, believe it or not, boasts an unbelievable 50 billion transistors.

Private Investment in Fusion Technology Has Been Increasing

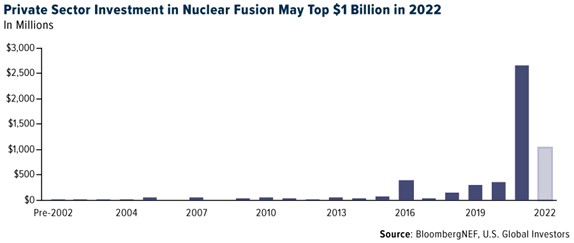
Getting your electricity from a commercial fusion reactor is still years if not decades away, but that hasn’t stopped money from flowing into the sector. This year, private investment is estimated to top $1 billion, following the record $2.6 billion that went into fusion research in 2021, according to BloombergNEF.  

Private Sector Investment in Nuclear Fusion May Top $1 Billion in 2022

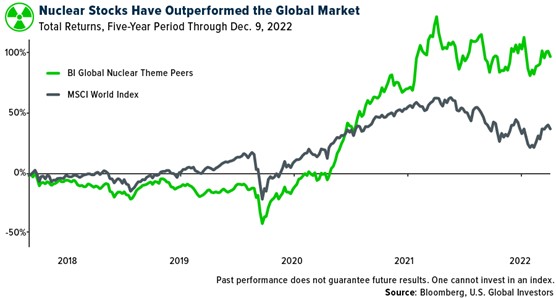
At the moment, there aren’t any publicly traded fusion companies. However, Bloomberg has a Global Nuclear Theme Peers index that tracks listed companies with exposure to the industry, estimated by Bloomberg to one day achieve a jaw-dropping $40 trillion valuation. Some of the more recognizable names include Rolls-Royce, Toshiba, Hitachi and General Electric.

For the five-year period, the index of 64 “nuclear” stocks has advanced approximately 100%, compared to the MSCI World Index, up 38% over the same period.

The number of private firms involved in R&D continues to grow, raising the possibility that some will tap public markets in the coming years.

Among the largest is Commonwealth Fusion Systems, or CFS, which spun out of MIT’s Plasma Science and Fusion Center in 2018. The company raised $1.8 billion in December 2021, on top of the $250 million it had raised previously. Its investors include Bill Gates and Google, along with oil companies, venture capital firms and sovereign wealth funds. CFS claims to have the fastest, lowest cost solution to commercial fusion energy and is in the process of building a prototype that is set to demonstrate net energy gain by 2025.

Another major player is TAE Technologies. Located in California, the company has raised a total of $1.2 billion as of December 2022, from investors such as the late Paul Allen, Goldman Sachs, Google and the family office of Charles Schwab. TAE says it is developing a fusion reactor, scheduled to be unveiled in the early 2030s, that will generate electricity from a proton-boron reaction at an incredible temperature of 1 billion degrees.

Other contenders in the field include Washington State-based Helion Energy, Canada’s General Fusion and the United Kingdom’s Tokamak Energy. In February 2022, Tokamak broke a longstanding record by generating 59 MJ of energy, the highest sustained energy pulse ever.

As an investor, I would keep an eye on this space!

Solar Accounted For 45% Of All New Energy Capacity Growth In The U.S.

In the meantime, energy investors with an eye on the future still have renewable energy stocks to consider.

2022 has been a challenging year for the industry, with much of it facing supply constraints. According to Wood Mackenzie, total new solar installations in the U.S. were 18.6 gigawatts (GW), a 23% decrease from 2021.

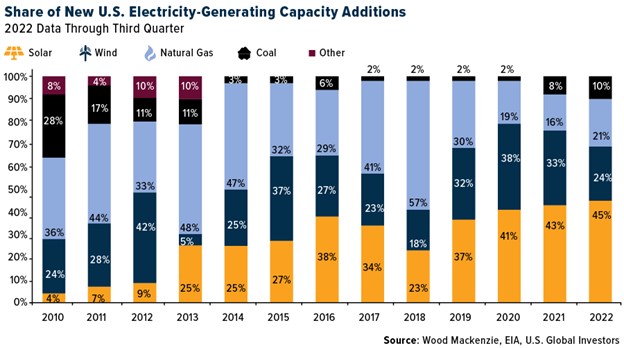
Even so, solar accounted for 45% of all new electricity-generation capacity added this year through the end of the third quarter. That’s greater than any other energy source. Wind was in second place, representing a quarter of all new energy power, followed by natural gas at 21% and coal at 10%, its best year since 2013.

WoodMac expresses optimism in the next two years. Solar projects that were delayed this year due to supply issues may finally come online in 2023, and by 2024, the real effects of President Biden’s Inflation Reduction Act (IRA) should be felt. The U.K.-based research firm forecasts 21% average annual growth from 2023 through 2027, so now may be an opportune time to start participating.

One of our favorite plays right now is Canadian Solar, up more than 11% for the year. On Thursday of this week, the Ontario-based company announced that it would begin mass-producing high efficiency solar modules in the first quarter of 2023. Canadian Solar shares were up more than 1% last week, despite experiencing two down days on this week’s news of continued rate hikes into 2023.

US Global Investors Disclaimer

All opinions expressed and data provided are subject to change without notice. Some of these opinions may not be appropriate to every investor. By clicking the link(s) above, you will be directed to a third-party website(s). U.S. Global Investors does not endorse all information supplied by this/these website(s) and is not responsible for its/their content.

The BI Global Nuclear Theme Peers is an index not for use as a financial benchmark that tracks 64 companies exposed to nuclear energy research and production. The MSCI World Index is a free-float weighted equity index which includes developed world markets and does not include emerging markets.

Holdings may change daily. Holdings are reported as of the most recent quarter-end. The following securities mentioned in the article were held by one or more accounts managed by U.S. Global Investors as of (09/30/22): Tesla Inc., Canadian Solar Inc.

Battery Power From EV to the Grid Could Open a Fast Lane to a Net-Zero Future.

Source: MIT News

Reversing the Charge – Energy Storage on Wheels

Leda Zimmerman | MIT Energy Initiative

Owners of electric vehicles (EVs) are accustomed to plugging into charging stations at home and at work and filling up their batteries with electricity from the power grid. But someday soon, when these drivers plug in, their cars will also have the capacity to reverse the flow and send electrons back to the grid. As the number of EVs climbs, the fleet’s batteries could serve as a cost-effective, large-scale energy source, with potentially dramatic impacts on the energy transition, according to a new paper published by an MIT team in the journal Energy Advances.

“At scale, vehicle-to-grid (V2G) can boost renewable energy growth, displacing the need for stationary energy storage and decreasing reliance on firm [always-on] generators, such as natural gas, that are traditionally used to balance wind and solar intermittency,” says Jim Owens, lead author and a doctoral student in the MIT Department of Chemical Engineering. Additional authors include Emre Gençer, a principal research scientist at the MIT Energy Initiative (MITEI), and Ian Miller, a research specialist for MITEI at the time of the study.

The group’s work is the first comprehensive, systems-based analysis of future power systems, drawing on a novel mix of computational models integrating such factors as carbon emission goals, variable renewable energy (VRE) generation, and costs of building energy storage, production, and transmission infrastructure.

“We explored not just how EVs could provide service back to the grid — thinking of these vehicles almost like energy storage on wheels — but also the value of V2G applications to the entire energy system and if EVs could reduce the cost of decarbonizing the power system,” says Gençer. “The results were surprising; I personally didn’t believe we’d have so much potential here.”

Displacing New Infrastructure

As the United States and other nations pursue stringent goals to limit carbon emissions, electrification of transportation has taken off, with the rate of EV adoption rapidly accelerating. (Some projections show EVs supplanting internal combustion vehicles over the next 30 years.) With the rise of emission-free driving, though, there will be increased demand for energy. “The challenge is ensuring both that there’s enough electricity to charge the vehicles and that this electricity is coming from renewable sources,” says Gençer.

But solar and wind energy is intermittent. Without adequate backup for these sources, such as stationary energy storage facilities using lithium-ion batteries, for instance, or large-scale, natural gas- or hydrogen-fueled power plants, achieving clean energy goals will prove elusive. More vexing, costs for building the necessary new energy infrastructure runs to the hundreds of billions.

This is precisely where V2G can play a critical, and welcome, role, the researchers reported. In their case study of a theoretical New England power system meeting strict carbon constraints, for instance, the team found that participation from just 13.9 percent of the region’s 8 million light-duty (passenger) EVs displaced 14.7 gigawatts of stationary energy storage. This added up to $700 million in savings — the anticipated costs of building new storage capacity.

Their paper also described the role EV batteries could play at times of peak demand, such as hot summer days. “V2G technology has the ability to inject electricity back into the system to cover these episodes, so we don’t need to install or invest in additional natural gas turbines,” says Owens. “The way that EVs and V2G can influence the future of our power systems is one of the most exciting and novel aspects of our study.”

Modeling Power

To investigate the impacts of V2G on their hypothetical New England power system, the researchers integrated their EV travel and V2G service models with two of MITEI’s existing modeling tools: the Sustainable Energy System Analysis Modeling Environment (SESAME) to project vehicle fleet and electricity demand growth, and GenX, which models the investment and operation costs of electricity generation, storage, and transmission systems. They incorporated such inputs as different EV participation rates, costs of generation for conventional and renewable power suppliers, charging infrastructure upgrades, travel demand for vehicles, changes in electricity demand, and EV battery costs.

Their analysis found benefits from V2G applications in power systems (in terms of displacing energy storage and firm generation) at all levels of carbon emission restrictions, including one with no emissions caps at all. However, their models suggest that V2G delivers the greatest value to the power system when carbon constraints are most aggressive — at 10 grams of carbon dioxide per kilowatt hour load. Total system savings from V2G ranged from $183 million to $1,326 million, reflecting EV participation rates between 5 percent and 80 percent.

“Our study has begun to uncover the inherent value V2G has for a future power system, demonstrating that there is a lot of money we can save that would otherwise be spent on storage and firm generation,” says Owens.

Harnessing V2G

For scientists seeking ways to decarbonize the economy, the vision of millions of EVs parked in garages or in office spaces and plugged into the grid for 90 percent of their operating lives proves an irresistible provocation. “There is all this storage sitting right there, a huge available capacity that will only grow, and it is wasted unless we take full advantage of it,” says Gençer.

This is not a distant prospect. Startup companies are currently testing software that would allow two-way communication between EVs and grid operators or other entities. With the right algorithms, EVs would charge from and dispatch energy to the grid according to profiles tailored to each car owner’s needs, never depleting the battery and endangering a commute.

“We don’t assume all vehicles will be available to send energy back to the grid at the same time, at 6 p.m. for instance, when most commuters return home in the early evening,” says Gençer. He believes that the vastly varied schedules of EV drivers will make enough battery power available to cover spikes in electricity use over an average 24-hour period. And there are other potential sources of battery power down the road, such as electric school buses that are employed only for short stints during the day and then sit idle.

The MIT team acknowledges the challenges of V2G consumer buy-in. While EV owners relish a clean, green drive, they may not be as enthusiastic handing over access to their car’s battery to a utility or an aggregator working with power system operators. Policies and incentives would help.

“Since you’re providing a service to the grid, much as solar panel users do, you could be paid for your participation, and paid at a premium when electricity prices are very high,” says Gençer.

“People may not be willing to participate ’round the clock, but if we have blackout scenarios like in Texas last year, or hot-day congestion on transmission lines, maybe we can turn on these vehicles for 24 to 48 hours, sending energy back to the system,” adds Owens. “If there’s a power outage and people wave a bunch of money at you, you might be willing to talk.”

“Basically, I think this comes back to all of us being in this together, right?” says Gençer. “As you contribute to society by giving this service to the grid, you will get the full benefit of reducing system costs, and also help to decarbonize the system faster and to a greater extent.”

Actionable Insights

Owens, who is building his dissertation on V2G research, is now investigating the potential impact of heavy-duty electric vehicles in decarbonizing the power system. “The last-mile delivery trucks of companies like Amazon and FedEx are likely to be the earliest adopters of EVs,” Owen says. “They are appealing because they have regularly scheduled routes during the day and go back to the depot at night, which makes them very useful for providing electricity and balancing services in the power system.”

Owens is committed to “providing insights that are actionable by system planners, operators, and to a certain extent, investors,” he says. His work might come into play in determining what kind of charging infrastructure should be built, and where.

“Our analysis is really timely because the EV market has not yet been developed,” says Gençer. “This means we can share our insights with vehicle manufacturers and system operators — potentially influencing them to invest in V2G technologies, avoiding the costs of building utility-scale storage, and enabling the transition to a cleaner future. It’s a huge win, within our grasp.”

The research for this study was funded by MITEI’s Future Energy Systems Center.

Reprinted with permission of MIT News” (http://news.mit.edu/)

Why Central Banks Will Choose Recession Over Inflation

Image Credit: Focal Foto (Flickr)

The Difficult Reality of Rising Core and Super-Core Inflation

While many market participants are concerned about rate increases, they appear to be ignoring the largest risk: the potential for a massive liquidity drain in 2023.

Even though December is here, central banks’ balance sheets have hardly, if at all, decreased. Rather than real sales, a weaker currency and the price of the accumulated bonds account for the majority of the fall in the balance sheets of the major central banks.

In the context of governments deficits that are hardly declining and, in some cases, increasing, investors must take into account the danger of a significant reduction in the balance sheets of central banks. Both the quantitative tightening of central banks and the refinancing of government deficits, albeit at higher costs, will drain liquidity from the markets. This inevitably causes the global liquidity spectrum to contract far more than the headline amount.

Liquidity drains have a dividing effect in the same way that liquidity injections have an obvious multiplier effect in the transmission mechanism of monetary policy. A central bank’s balance sheet increased by one unit of currency in assets multiplies at least five times in the transmission mechanism. Do the calculations now on the way out, but keep in mind that government expenditure will be financed.

Our tendency is to take liquidity for granted. Due to the FOMO (fear of missing out) mentality, investors have increased their risk and added illiquid assets over the years of monetary expansion. In periods of monetary excess, multiple expansion and rising valuations are the norm.

Since we could always count on rising liquidity, when asset prices corrected over the past two decades, the best course of action was to “buy the dip” and double down. This was because central banks would keep growing their balance sheets and adding liquidity, saving us from almost any bad investment decision, and inflation would stay low.

Twenty years of a dangerous bet: monetary expansion without inflation. How do we handle a situation where central banks must cut at least $5 trillion off their balance sheets? Do not believe I am exaggerating; the $20 trillion bubble generated since 2008 cannot be solved with $5 trillion. A tightening of $5 trillion in US dollars is mild, even dovish. To return to pre-2020 levels, the Fed would need to decrease its balance sheet by that much on its own.

Keep in mind that the central banks of developed economies need to tighten monetary policy by $5 trillion, which is added to over $2.50 trillion in public deficit financing in the same countries.

The effects of contraction are difficult to forecast because traders for at least two generations have only experienced expansionary policies, but they are undoubtedly unpleasant. Liquidity is already dwindling in the riskiest sectors of the economy, from high yield to crypto assets. By 2023, when the tightening truly begins, it will probably have reached the supposedly safer assets.

In a recent interview, Bundesbank President Joachim Nagel said that the ECB will begin to reduce its balance sheet in 2023 and added that “a recession may be insufficient to get inflation back on target.” This suggests that the “anti-fragmentation tool” currently in use to mask risk in periphery bonds may begin to lose its placebo impact on sovereign assets. Additionally, the cost of equity and weighted average cost of capital increases as soon as sovereign bond spreads begin to rise.

Capital can only be made or destroyed; it never remains constant. And if central banks are to effectively fight inflation, capital destruction is unavoidable.

The prevalent bullish claim is that because central banks have learned from 2008, they will not dare to allow the market to crash. Although a correct analysis, it is not enough to justify market multiples. The fact that governments continue to finance themselves, which they will, is ultimately what counts to central banks. The crowding out effect of government spending over private sector credit access has never been a major concern for a central bank. Keep in mind that I am only estimating a $5 trillion unwind, which is quite generous given the excess produced between 2008 and 2021 and the magnitude of the balance sheet increase in 2020–21.

Central banks are also aware of the worst-case scenario, which is elevated inflation and a recession that could have a prolonged impact on citizens, with rising discontent and generalized impoverishment. They know they cannot keep inflation high just to satisfy market expectations of rising valuations. The same central banks that assert that the wealth effect multiplies positively are aware of the disastrous consequences of ignoring inflation. Back to the 1970s.

The “energy excuse” in inflation estimates will likely evaporate, and that will be the key test for central banks. The “supply chain excuse” has disappeared, the “temporary excuse” has gotten stale, and the “energy excuse” has lost some of its credibility since June. The unattractive reality of rising core and super-core inflation has been exposed by the recent commodity slump.

Central banks cannot accept sustained inflation because it means they would have failed in their mandate. Few can accurately foresee how quantitative tightening will affect asset prices and credit availability, even though it is necessary. What we know is that quantitative tightening, with a minimal decrease in central bank balance sheets, is expected to compress multiples and valuations of risky assets more than it has thus far. Given that capital destruction appears to be only getting started, the dividing effect is probably more than anticipated. And the real economy is always impacted by capital destruction

About the Author

Daniel Lacalle, PhD, economist and fund manager, is the author of the bestselling books Freedom or Equality (2020),Escape from the Central Bank Trap (2017), The Energy World Is Flat (2015), and Life in the Financial Markets (2014).

Daniel Lacalle is a professor of global economy at IE Business School in Madrid.

Synthetic Biology Creating T Cells to Destroy Cancers

Image: Killer T Cells Surround Cancer Cell – NICHD (Flickr)

Anti-Cancer CAR-T Therapy Reengineers T-cells to Kill Tumors – and Researchers are Expanding the Limited Types of Cancer it Can Target

Teaching the body’s immune cells to recognize and fight cancer is one of the holy grails in medicine. Over the past two decades, researchers have developed new immunotherapy drugs that stimulate a patient’s immune cells to significantly shrink or even eliminate tumors. These treatments often focus on increasing the cancer-killing ability of cytotoxic T cells. However, these treatments appear to only work for the small group of patients who already have T cells within their tumors. One 2019 study estimated that under 13% of cancer patients responded to immunotherapy.

To bring the benefits of immunotherapy to more patients, scientists have turned to synthetic biology, a new field of study that seeks to redesign nature with new and more useful functions. Researchers have been developing a novel type of therapy that directly gives patients a new set of T cells engineered to attack tumors: chimeric antigen receptor T cells, or CAR-T cells for short.

This article was republished with permission from The Conversation, a news site dedicated to sharing ideas from academic experts. It represents the research-based findings and thoughts of, Gregory Allen, Assistant Professor of Medicine, the University of California, San Francisco.

As an oncology physician and researcher, I believe that CAR-T cell therapy has the potential to transform cancer treatment. It’s already being used to treat lymphoma and multiple myeloma, and has shown remarkable response rates where other treatments have failed.

However, similar success against certain types of tumors such as lung or pancreatic cancer has been slower to develop because of the unique obstacles they put up against T cells. In our newly published research, my colleagues and I have found that adding a synthetic circuit to CAR-T cells could potentially help them bypass the barriers that tumors put up and enhance their ability to eliminate more types of cancer.

How Does CAR-T Cell Therapy Work?

CAR-T cell therapy starts with doctors isolating a patient’s T cells from a sample of their blood. These T cells are then taken back to the lab, where they are genetically engineered to produce a chimeric antigen receptor, or CAR.

CARs are synthetic receptors specifically designed to redirect T cells from their usual targets have them recognize and hone in on tumor cells. On the outside of a CAR is a binder that allows the T cell to stick to tumor cells. Binding to a tumor cell activates the engineered T cell to kill and produce inflammatory cytokines proteins that support T cell growth and function and boost their cancer-killing

CAR-T therapy involves engineering a patient’s own T cells to attack their cancer. National Cancer Institute (NCI)

These CAR-T cells are then stimulated to divide into large numbers over seven to 10 days, then given back to the patient via infusion. The infusion process usually takes place at a hospital where clinicians can monitor for signs of an overactive immune response against tumors, which can be deadly for the patient.

Driving T Cells Into Solid Tumors

While CAR-T cell therapy has seen success in blood cancers, it has faced hurdles when fighting what are called solid tumor cancers like pancreatic cancer and melanoma. Unlike cancers that begin in the blood, these types of cancers grow into a solid mass that produces a microenvironment of molecules, cells and structures that prevent T cells from entering into the tumor and triggering an immune response. Here, even CAR-T cells engineered to specifically target a patient’s unique tumor are unable to access it, suppressing their ability to kill tumor cells.

For the synthetic biology community, the failures of the first generation of CAR-T cell therapy was a call to action to develop a new family of synthetic receptors to tackle the unique challenges solid tumors posed. In 2016, my colleagues in the Lim Lab at the University of California, San Francisco developed a new synthetic receptor that could complement the first CAR design. This receptor, called synthetic Notch receptor, or synNotch, is based on the natural form of Notch in the body, which plays an important role in organ development across many species.

Similar to CARs, the outside of synNotch has a binder that allows T cells to stick to tumor cells. Unlike CARs, the inside of synNotch has a protein that is released when a T cell binds to the tumor. This protein, or transcription factor, allows researchers to better control the T cell by inducing it to produce a specific protein.

For example, one of the most useful applications of synNotch thus far has been to use it to ensure that engineered T cells are only activated when bound to a tumor cell and not healthy cells. Because a CAR may bind to both tumor and healthy cells and induce T cells to kill both, my colleagues engineered T cells that are only activated when both synNotch and CAR are bound to the tumor cell. Because T cells now require both CAR and synNotch receptors to recognize tumors, this increases the precision of T cell killing.

We wondered if we could use synNotch to improve CAR-T cell activity against solid tumors by inducing them to produce more of the inflammatory cytokines, such as IL-2, that enable them to kill tumor cells. Researchers have made many attempts to provide extra IL-2 to help CAR-T cells clear tumors. But because these cytokines are highly toxic, there is a limit to how much IL-2 a patient can safely tolerate, limiting their use as a drug.

So we designed CAR-T cells to produce IL-2 using synNotch. Now, when a CAR-T cell encounters a tumor, it produces IL-2 within the tumor instead of outside it, avoiding causing harm to surrounding healthy cells. Because synNotch is able to bypass the barriers tumors put up, it is able to help T cells amp up and maintain the amount of IL-2 they can make, allowing the T cells to keep functioning even in a hostile microenvironment.

We tested our CAR-T cells modified with synNotch on mice with pancreatic cancer and melanoma. We found that CAR-T cells with synNotch-induced IL-2 were able to produce enough extra IL-2 to overcome the tumors’ defensive barriers and fully activate, completely eliminating the tumors. While all of the mice receiving synNotch modified CAR-T cells survived, none of the CAR-T-only mice did.

Furthermore, our synNotch modified CAR-T cells were able to trigger IL-2 production without causing toxicity to healthy cells in the rest of the body. This suggests that our method of engineering T cells to produce this toxic cytokine only where it is needed can help improve the effectiveness of CAR-T cells against cancer while reducing side effects.

Next Steps

Fundamental questions remain on how this work in mice will translate to people. Our group is currently conducting more studies on using CAR-T cells with synNotch to produce IL-2, with the goal of entering early stage clinical trials to examine its safety and efficacy in patients with pancreatic cancer.

Our findings are one example of how advances in synthetic biology make it possible to engineer solutions to the most fundamental challenges in medicine.

In The Global Race for Fusion Energy – the U.S. Leaps Ahead

U.S. Department of Energy (Flickr)

Why Fusion Ignition is Being Hailed as a Major Breakthrough in Fusion – a Nuclear Physicist Explains

American scientists have announced what they have called a major breakthrough in a long-elusive goal of creating energy from nuclear fusion.

The U.S. Department of Energy said on Dec. 13, 2022, that for the first time – and after several decades of trying – scientists have managed to get more energy out of the process than they had to put in.

But just how significant is the development? And how far off is the long-sought dream of fusion providing abundant, clean energy? Carolyn Kuranz, an associate professor of nuclear engineering at the University of Michigan who has worked at the facility that just broke the fusion record, helps explain this new result.

What Happened in the Fusion Chamber?

Fusion is a nuclear reaction that combines two atoms to create one or more new atoms with slightly less total mass. The difference in mass is released as energy, as described by Einstein’s famous equation, E = mc2 , where energy equals mass times the speed of light squared. Since the speed of light is enormous, converting just a tiny amount of mass into energy – like what happens in fusion – produces a similarly enormous amount of energy.

Fusion is the same process that powers the Sun. NASA/Wikimedia Commons

Researchers at the U.S. Government’s National Ignition Facility in California have demonstrated, for the first time, what is known as “fusion ignition.” Ignition is when a fusion reaction produces more energy than is being put into the reaction from an outside source and becomes self-sustaining.

The technique used at the National Ignition Facility involved shooting 192 lasers at a 0.04 inch (1 mm) pellet of fuel made of deuterium and tritium – two versions of the element hydrogen with extra neutrons – placed in a gold canister. When the lasers hit the canister, they produce X-rays that heat and compress the fuel pellet to about 20 times the density of lead and to more than 5 million degrees Fahrenheit (3 million Celsius) – about 100 times hotter than the surface of the Sun. If you can maintain these conditions for a long enough time, the fuel will fuse and release energy.

The fuel is held in a tiny canister designed to keep the reaction as free from contaminants as possible. U.S. Department of Energy/Lawrence Livermore National Laboratory

The fuel and canister gets vaporized within a few billionths of a second during the experiment. Researchers then hope their equipment survived the heat and accurately measured the energy released by the fusion reaction.

So What Did They Accomplish?

To assess the success of a fusion experiment, physicists look at the ratio between the energy released from the process of fusion and the amount of energy within the lasers. This ratio is called gain.

Anything above a gain of 1 means that the fusion process released more energy than the lasers delivered.

On Dec. 5, 2022, the National Ignition Facility shot a pellet of fuel with 2 million joules of laser energy – about the amount of power it takes to run a hair dryer for 15 minutes – all contained within a few billionths of a second. This triggered a fusion reaction that released 3 million joules. That is a gain of about 1.5, smashing the previous record of a gain of 0.7 achieved by the facility in August 2021.

How Big a Deal is this Result?

Fusion energy has been the “holy grail” of energy production for nearly half a century. While a gain of 1.5 is, I believe, a truly historic scientific breakthrough, there is still a long way to go before fusion is a viable energy source.

While the laser energy of 2 million joules was less than the fusion yield of 3 million joules, it took the facility nearly 300 million joules to produce the lasers used in this experiment. This result has shown that fusion ignition is possible, but it will take a lot of work to improve the efficiency to the point where fusion can provide a net positive energy return when taking into consideration the entire end-to-end system, not just a single interaction between the lasers and the fuel.

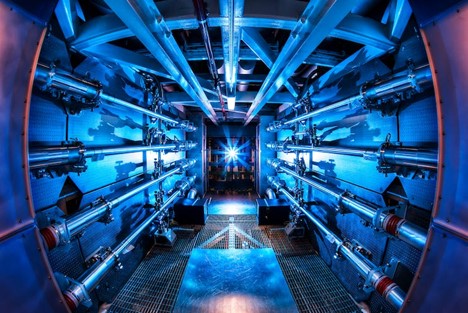
Machinery used to create the powerful lasers, like these pre-amplifiers, currently requires a lot more energy than the lasers themselves produce. Lawrence Livermore National Laboratory, CC BY-SA

What Needs to Be Improved?

There are a number of pieces of the fusion puzzle that scientists have been steadily improving for decades to produce this result, and further work can make this process more efficient.

First, lasers were only invented in 1960. When the U.S. government completed construction of the National Ignition Facility in 2009, it was the most powerful laser facility in the world, able to deliver 1 million joules of energy to a target. The 2 million joules it produces today is 50 times more energetic than the next most powerful laser on Earth. More powerful lasers and less energy-intensive ways to produce those powerful lasers could greatly improve the overall efficiency of the system.

Fusion conditions are very challenging to sustain, and any small imperfection in the capsule or fuel can increase the energy requirement and decrease efficiency. Scientists have made a lot of progress to more efficiently transfer energy from the laser to the canister and the X-ray radiation from the canister to the fuel capsule, but currently only about 10% to 30% of the total laser energy is transferred to the canister and to the fuel.

Finally, while one part of the fuel, deuterium, is naturally abundant in sea water, tritium is much rarer. Fusion itself actually produces tritium, so researchers are hoping to develop ways of harvesting this tritium directly. In the meantime, there are other methods available to produce the needed fuel.

These and other scientific, technological and engineering hurdles will need to be overcome before fusion will produce electricity for your home. Work will also need to be done to bring the cost of a fusion power plant well down from the US$3.5 billion of the National Ignition Facility. These steps will require significant investment from both the federal government and private industry.

It’s worth noting that there is a global race around fusion, with many other labs around the world pursuing different techniques. But with the new result from the National Ignition Facility, the world has, for the first time, seen evidence that the dream of fusion is achievable.

This article was republished with permission from The Conversation, a news site dedicated to sharing ideas from academic experts. It represents the research-based findings and thoughts of, Carolyn Kuranz, Associate Professor of Nuclear Engineering, University of Michigan. Carolyn Kuranz receives funding from the National Nuclear Security Administration and Lawrence Livermore National Laboratory. She serves on a review board for Lawrence Livermore National Laboratory. She is a member of the Fusion Energy Science Advisory Committee.

Fed Pivot, Money Supply, and Investment Returns

Image Credit: Karolina Grabowska (Pexels)

Why Investors Are Obsessed with the Fed “Pivot”

“Investors should not care whether the Fed pivots or not if they analyze investment opportunities based on fundamentals and not on monetary laughing gas,” writes economist Daniel Lacalle, PhD. In his latest article, published below. LaCalle takes on the journalists and economists that see market risk differently than himself. This is a thought-provoking read for anyone who has been living on a diet of mostly CNBC, and Yahoo Finance, as exposure to diverse market viewpoints is considered healthy. – Paul Hoffman, Channelchek

Obsessed Investors

In a recent Bloomberg article, a group of economists voiced their fears that the Federal Reserve’s inflation fight may create an unnecessarily deep downturn. However, the Federal Reserve does not create a downturn due to rate hikes; it creates the foundations of a crisis by unnecessarily lowering rates to negative territory and aggressively increasing its balance sheet. It is the malinvestment and excessive risk-taking fuelled by cheap money that lead to a recession.

Those same economists probably saw no risk in negative rates and massive money printing. It is profoundly concerning to see that experts who remained quiet as the world accumulated $17 trillion in negative yielding bonds and central banks’ balance sheets soared to more than $20 trillion now complain that rate hikes may create a debt crisis. The debt crisis, like all market imbalances, was created when central banks led investors to believe that a negative yielding bond was a worthwhile investment because the price would rise and compensate for the loss of yield. A good old bubble.

Multiple expansion has been an easy investment thesis. Earnings downgrades? No problem. Macro weakness? Who cares. Valuations soared simply because the quantity of money was rising faster than nominal GDP (gross domestic product). Printing money made investing in the most aggressive stocks and the riskiest bonds the most lucrative alternative. And that, my friends, is massive asset inflation. The Keynesian crowd repeated that this time would be different and consistently larger quantitative easing programs would not create inflation because it did not happen in the past. And it happened.

Inflation was already evident in assets all over the investment spectrum, but no one seemed to care. It was also evident in non-replicable goods and services. The FAO food price index already reached all-time highs in 2019 without any “supply chain disruption” excuse or blaming it on the Ukraine war. House prices, insurance, healthcare, education… The bubble of cheap money was clear everywhere.

Now many market participants want the Fed to pivot and stop hiking rates. Why? Because many want the easy multiple expansion carry trade back. The fact that investors see a Fed pivot as the main reason to buy tells you what an immensely perverse incentive monetary policy is and how poor the macro and earnings’ outlook are.

Earnings estimates have been falling for 2022 and 2023 all year. The latest S&P 500 earnings’ growth estimates published by Morgan Stanley show a modest 8 and 7 percent rise for this and next year respectively. Not bad? The pace of downgrades has not stopped, and the market is not even adjusting earnings to the downgrade in macroeconomic estimates. When I look at the details of these expectations, I am amazed to see widespread margin growth in 2023 and a backdrop of rising sales and low inflation. Excessively optimistic? I think so.

Few of us seem to realize a Fed pivot is a bad idea, and, in any case, it will not be enough to drive markets to a bull run again because inflationary pressures are stickier than what consensus would want. I find it an exercise in wishful thinking to read so many predictions of a rapid return to 2% inflation, even less, when history shows that once inflation rises above 5% in developed economies, it takes at least a decade to bring it down to 2%, according to Deutsche Bank. Even the OECD expects persistent inflation in 2023 against a backdrop of weakening growth.

Stagflation. That is the risk ahead, and a Fed pivot would do nothing to bring markets higher in that scenario. Stagflation periods have proven to be extremely poor for stocks and bonds, even worse when governments are unwilling to cut deficit spending, because the crowding out of the private sector works against a rapid recovery.

Current inflation expectations suggest the Fed will pivot in the first quarter of 2023. That is an awfully long time in the investment world if you want to bet on a V-shaped market recovery. Even worse, that pivot expectation is based on a surprisingly accelerated reduction in inflation. How can it happen when central banks’ balance sheets have barely moved in local currency, reverse repo liquidity injections reach trillion-dollar levels every month and money supply has barely corrected from the all-time highs of 2022? Many are betting on statistical bodies tweaking the calculation of CPI (consumer price index), and believe me, it will happen, but it will not disguise earnings and margin erosion.

To cut inflation drastically three things need to happen, and only one is not enough. 1) Hike rates. 2) Reduce the balance sheet of central banks meaningfully. 3) Stop deficit spending. This is unlikely to happen anytime soon.

Investors that see the Fed as too hawkish look at money supply growth and how it is falling, but they do not look at broad money accumulation and the insanity of the size of central banks’ balance sheets that have barely moved in local currency. By looking at money supply growth as a variable of tightness in monetary policy they may make the mistake of believing that the tightening cycle is over too soon.

Investors should not care whether the Fed pivots or not if they analyze investment opportunities based on fundamentals and not on monetary laughing gas. Betting on a Fed pivot by adding risk to cyclical and extremely risky assets may be an extremely dangerous position even if the Fed does revert its pace, because it would be ignoring the economic cycle and the earnings reality. 

Central banks do not print growth. Governments do not boost productivity. However, both perpetuate inflation and have an incentive to increase debt. Adding these facts to our investment analysis may not guarantee high returns, but it will prevent enormous losses.

About the Author

Daniel Lacalle

Daniel Lacalle, PhD, economist and fund manager, is the author of the bestselling books Freedom or Equality (2020), Escape from the Central Bank Trap (2017), The Energy World Is Flat (2015), and Life in the Financial Markets (2014).

Information

The Winners of California’s Floating Wind Turbine Projects

Image Credit: Scottish Government (Flickr)

How Do Floating Wind Turbines Work? Five Companies Just Won the First US Leases for Building them off California’s Coast

Northern California has some of the strongest offshore winds in the U.S., with immense potential to produce clean energy. But it also has a problem. Its continental shelf drops off quickly, making building traditional wind turbines directly on the seafloor costly if not impossible.

Once water gets more than about 200 feet deep – roughly the height of an 18-story building – these “monopile” structures are pretty much out of the question.

A solution has emerged that’s being tested in several locations around the world: wind turbines that float.

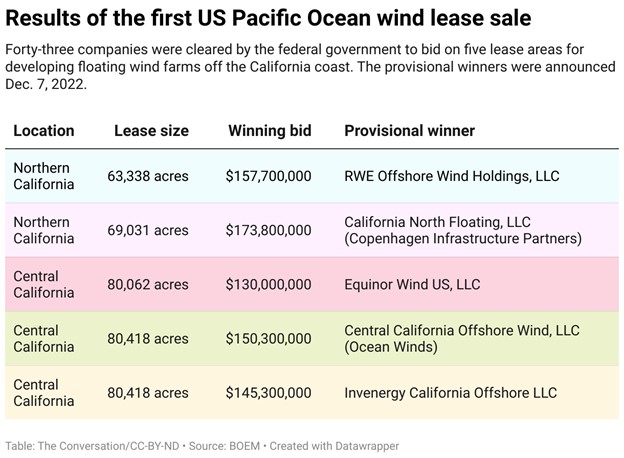
In California, where drought has put pressure on the hydropower supply, the state is moving forward on a plan to develop the nation’s first floating offshore wind farms. On Dec. 7, 2022, the federal government auctioned off five lease areas about 20 miles off the California coast to companies with plans to develop floating wind farms. The bids were lower than recent leases off the Atlantic coast, where wind farms can be anchored to the seafloor, but still significant, together exceeding US$757 million.

So, how do floating wind farms work?

Three Main Ways to Float a Turbine

A floating wind turbine works just like other wind turbines – wind pushes on the blades, causing the rotor to turn, which drives a generator that creates electricity. But instead of having its tower embedded directly into the ground or the seafloor, a floating wind turbine sits on a platform with mooring lines, such as chains or ropes, that connect to anchors in the seabed below.

These mooring lines hold the turbine in place against the wind and keep it connected to the cable that sends its electricity back to shore.

Most of the stability is provided by the floating platform itself. The trick is to design the platform so the turbine doesn’t tip too far in strong winds or storms.

Three of the common types of floating wind turbine platform. Josh Bauer/NREL

There are three main types of platforms:

A spar buoy platform is a long hollow cylinder that extends downward from the turbine tower. It floats vertically in deep water, weighted with ballast in the bottom of the cylinder to lower its center of gravity. It’s then anchored in place, but with slack lines that allow it to move with the water to avoid damage. Spar buoys have been used by the oil and gas industry for years for offshore operations.

Semisubmersible platforms have large floating hulls that spread out from the tower, also anchored to prevent drifting. Designers have been experimenting with multiple turbines on some of these hulls.

Tension leg platforms have smaller platforms with taut lines running straight to the floor below. These are lighter but more vulnerable to earthquakes or tsunamis because they rely more on the mooring lines and anchors for stability.

Each platform must support the weight of the turbine and remain stable while the turbine operates. It can do this in part because the hollow platform, often made of large steel or concrete structures, provides buoyancy to support the turbine. Since some can be fully assembled in port and towed out for installation, they might be far cheaper than fixed-bottom structures, which require specialty vessels for installation on site.

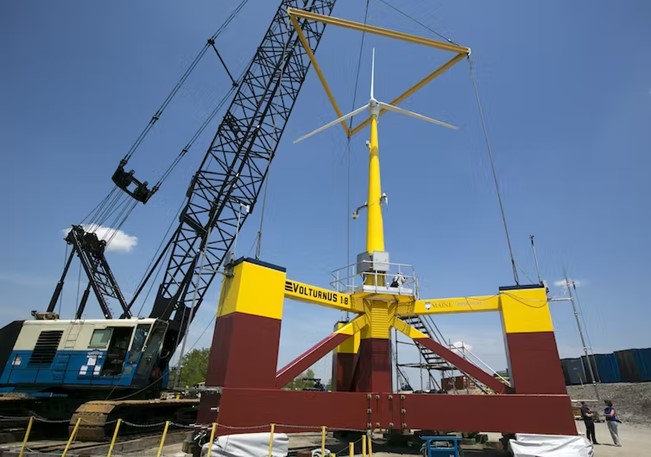
The University of Maine has been experimenting with a small floating wind turbine, about one-eighth scale, on a semisubmersible platform with RWE, one of the winning bidders.

Floating platforms can support wind turbines that can produce 10 megawatts or more of power – that’s similar in size to other offshore wind turbines and several times larger than the capacity of a typical onshore wind turbine you might see in a field.

Why Do We Need Floating Turbines?

Some of the strongest wind resources are away from shore in locations with hundreds of feet of water below, such as off the U.S. West Coast, the Great Lakes, the Mediterranean Sea and the coast of Japan.

Some of the strongest offshore wind power potential in the U.S. is in areas where the water is too deep for fixed turbines, including off the West Coast. NREL

The U.S. lease areas auctioned off in early December cover about 583 square miles in two regions – one off central California’s Morro Bay and the other near the Oregon state line. The water off California gets deep quickly, so any wind farm that is even a few miles from shore will require floating turbines.

Once built, wind farms in those five areas could provide about 4.6 gigawatts of clean electricity, enough to power 1.5 million homes, according to government estimates. The winning companies suggested they could produce even more power.

But getting actual wind turbines on the water will take time. The winners of the lease auction will undergo a Justice Department anti-trust review and then a long planning, permitting and environmental review process that typically takes several years.

The first five federal lease areas for Pacific coast offshore wind energy development. Bureau of Ocean Energy Management

Globally, several full-scale demonstration projects with floating wind turbines are already operating in Europe and Asia. The Hywind Scotland project became the first commercial-scale offshore floating wind farm in 2017, with five 6-megawatt turbines supported by spar buoys designed by the Norwegian energy company Equinor.

Equinor Wind US had one of the winning bids off Central California. Another winning bidder was RWE Offshore Wind Holdings. RWE operates wind farms in Europe and has three floating wind turbine demonstration projects. The other companies involved – Copenhagen Infrastructure Partners, Invenergy and Ocean Winds – have Atlantic Coast leases or existing offshore wind farms.

While floating offshore wind farms are becoming a commercial technology, there are still technical challenges that need to be solved. The platform motion may cause higher forces on the blades and tower, and more complicated and unsteady aerodynamics. Also, as water depths get very deep, the cost of the mooring lines, anchors and electrical cabling may become very high, so cheaper but still reliable technologies will be needed.

But we can expect to see more offshore turbines supported by floating structures in the near future.

This article was republished with permission from The Conversation, a news site dedicated to sharing ideas from academic experts. It represents the research-based findings and thoughts of, Matthew Lackner, Professor of Mechanical Engineering, UMass Amherst.

Why the Fed Adjusts to Steer Inflation to 2%

Image Credit: Shvets Production (Pexels)

Fed Wants Inflation to Get Down to 2% – But Why Not Target 3%? Or 0%?

What’s so special about the number 2? Quite a lot, if you’re a central banker – and that number is followed by a percent sign.

That’s been the de facto or official target inflation rate for the Federal Reserve, the European Central Bank and many other similar institutions since at least the 1990s.

But in recent months, inflation in the U.S. and elsewhere has soared, forcing the Fed and its counterparts to jack up interest rates to bring it down to near their target level.

This article was republished with permission from The Conversation, a news site dedicated to sharing ideas from academic experts. It represents the research-based findings and thoughts of, Veronika Dolar, Assistant Professor of Economics, SUNY Old Westbury.

As an economist who has studied the movements of key economic indicators like inflation, I know that low and stable inflation is essential for a well-functioning economy. But why does the target have to be 2%? Why not 3%? Or even zero?

Soaring Inflation

The U.S. inflation rate hit its 2022 peak in July at an annual rate of 9.1%. The last time consumer prices were rising this fast was back in 1981 – over 40 years ago.

Since March 2022, the Fed has been actively trying to decrease inflation. In order to do this, the Fed has been hiking its benchmark borrowing rate – from effectively 0% back in March 2022 to the current range of 3.75% to 4%. And it’s expected to lift interest rates another 0.5 percentage point on Dec. 14 and even more in 2023.

Most economists agree that an inflation rate approaching 8% is too high, but what should it be? If rising prices are so terrible, why not shoot for zero inflation?

Maintaining Stable Prices

One of the Fed’s core mandates, alongside low unemployment, is maintaining stable prices.

Since 1996, Fed policymakers have generally adopted the stance that their target for doing so was an inflation rate of around 2%. In January 2012, then-Chairman Ben Bernanke made this target official, and both of his successors, including current Chair Jerome Powell, have made clear that the Fed sees 2% as the appropriate desired rate of inflation.

Until very recently, though, the problem wasn’t that inflation was too high – it was that it was too low. That prompted Powell in 2020, when inflation was barely more than 1%, to call this a cause for concern and say the Fed would let it rise above 2%.

Many of you may find it counterintuitive that the Fed would want to push up inflation. But inflation that is persistently too low can pose serious risks to the economy.

These risks – namely sparking a deflationary spiral – are why central banks like the Fed would never want to adopt a 0% inflation target.

Perils of Deflation

When the economy shrinks during a recession with a fall in gross domestic product, aggregate demand for all the things it produces falls as well. As a result, prices no longer rise and may even start to fall – a condition called deflation.

Deflation is the exact opposite of inflation – instead of prices rising over time, they are falling. At first, it would seem that falling and lower prices are a good thing – who wouldn’t want to buy the same thing at a lower price and see their purchasing power go up?

But deflation can actually be pretty devastating for the economy. When people feel prices are headed down – not just temporarily, like big sales over the holidays, but for weeks, months or even years – they actually delay purchases in the hopes that they can buy things for less at a later date.

For example, if you are thinking of buying a new car that currently costs US$60,000, during periods of deflation you realize that if you wait another month, you can buy this car for $55,000. As a result, you don’t buy the car today. But after a month, when the car is now for sale for $55,000, the same logic applies. Why buy a car today, when you can wait another month and buy a car for $50,000 next month.

This lower spending leads to less income for producers, which can lead to unemployment. In addition, businesses, too, delay spending since they expect prices to fall further. This negative feedback loop – the deflationary spiral – generates higher unemployment, even lower prices and even less spending.

In short, deflation leads to more deflation. Throughout most of U.S. history, periods of deflation usually go hand in hand with economic downturns.

Everything in Moderation

So it’s pretty clear some inflation is probably necessary to avoid a deflation trap, but how much? Could it be 1%, 3% or even 4%?

Maybe. There isn’t any strong theoretical or empirical evidence for an inflation target of exactly 2%. The figure’s origin is a bit murky, but some reports suggest it simply came from a casual remark made by the New Zealand finance minister back in the late 1980s during a TV interview.

Moreover, there’s concern that creating economic targets for economic indicators like inflation corrupts the usefulness of the metric. Charles Goodhart, an economist who worked for the Bank of England, created an eponymous law that states: “When a measure becomes a target, it ceases to be a good measure.”

Since a core mission of the Fed is price stability, the target is beside the point. The main thing is that the Fed guide the economy toward an inflation rate high enough to allow it room to lower interest rates if it needs to stimulate the economy but low enough that it doesn’t seriously erode consumer purchasing power.

Like with so many things, moderation is key.