InPlay Oil is a junior oil and gas exploration and production company with operations in Alberta focused on light oil production. The company operates long-lived, low-decline properties with drilling development and enhanced oil recovery potential as well as undeveloped lands with exploration possibilities. The common shares of InPlay trade on the Toronto Stock Exchange under the symbol IPO and the OTCQX Exchange under the symbol IPOOF.
Mark Reichman, Managing Director, Equity Research Analyst, Natural Resources, Noble Capital Markets, Inc.
Hans Baldau, Research Associate, Noble Capital Markets, Inc.
Refer to the full report for the price target, fundamental analysis, and rating.
Full-year 2024 financial results. InPlay Oil reported full-year net income and earnings per share of C$9.5 million and C$0.10, respectively, below our estimates of approximately C$11.4 million and C$0.12. The variance was primarily due to lower-than-expected natural gas revenue driven by weaker AECO pricing. Production for the year averaged 8,712 barrels of oil equivalent per day (boe/d) compared to 9,025 boe/d in 2023. Consequently, revenue decreased to C$153.7 million compared to C$179.4 million in 2023. Adjusted funds flow in 2024 was C$68.5 million, down from C$91.8 million in 2023.
Updated 2025 estimates. Please note that our revised estimates assume the closing of the pending Pembina acquisition on April 15th, 2025. For 2025, our oil and gas revenue estimate is C$333.5 million compared to our prior estimate of C$159.4 million. We have raised our 2025 AFF and EPS estimates to C$161.6 million and C$0.27, respectively, from C$71.7 million and C$0.14. We forecast net income of C$40.9 million, up from our previous estimate of C$13.2 million. Our 2025 estimates are based on an average annual production of 15,879 boe/d compared to our prior forecast of 8,901 boe/d.
Equity Research is available at no cost to Registered users of Channelchek. Not a Member? Click ‘Join’ to join the Channelchek Community. There is no cost to register, and we never collect credit card information.
This Company Sponsored Research is provided by Noble Capital Markets, Inc., a FINRA and S.E.C. registered broker-dealer (B/D).
*Analyst certification and important disclosures included in the full report. NOTE: investment decisions should not be based upon the content of this research summary. Proper due diligence is required before making any investment decision.
CALGARY, AB, March 14, 2025 /CNW/ – InPlay Oil Corp. (TSX: IPO) (OTCQX: IPOOF) (“InPlay” or the “Company”) is pleased to announce its financial and operating results for the three and twelve months ended December 31, 2024, along with the results of its independent oil and gas reserves evaluation effective December 31, 2024 (the “Reserve Report”) prepared by Sproule Associates Limited (“Sproule”). InPlay’s audited annual financial statements and notes, and Management’s Discussion and Analysis (“MD&A”) for the year ended December 31, 2024 will be available at “www.sedarplus.ca” and the Company’s website at “www.inplayoil.com“. An updated presentation will be available after closing of the Pembina Cardium asset acquisition which is expected in April.
Message to Shareholders:
The upcoming year is set to be a transformational year for InPlay. We believe that the highly accretive acquisition of Pembina Cardium assets from Obsidian Energy Ltd. announced on February 19, 2025 will fundamentally shift the future of the Company. The acquired assets strategically complement InPlay’s existing holdings in the Pembina Cardium, an area where the Company has proven operational expertise. The acquisition will significantly expand our operational scale, with attributes including large oil in place, a higher oil weighting, strong netbacks, low decline rates and a robust inventory of high-quality drilling locations, enhancing our overall sustainability. This is expected to strengthen free adjusted funds flow (“FAFF”)(4) generation, allowing for debt reduction while supporting our shareholder return strategy, with over three times FAFF coverage of our existing base dividend (11.3%) expected for 2025. We are excited to begin operations of these newly acquired assets acquired in this synergistic acquisition and to demonstrate our expertise and ability to unlock the intrinsic value of our share price. We will remain committed to financial discipline maintaining our strong balance sheet, to ultimately generate shareholder value through FAFF growth and return of capital to shareholders.
The resumption of development of our Pembina Cardium Unit # (“PCU7”) asset was a key highlight in 2024. This area is our most prolific asset as it offers high production rates and lower declines. As a result of significantly improved capital costs, PCU7 yields the highest returns and strongest capital efficiencies in our current asset portfolio. Our 2024 development of PCU7 exceeded internal expectations. Operational enhancements since our last PCU7 drilling program in spring of 2022 resulted in costs 25% below budget. These new techniques can be leveraged across our Cardium asset base, including those acquired as part of the Pembina Cardium asset acquisition. Three additional 100% PCU7 extended reach horizontal (“ERH”) wells were drilled in the first quarter of 2025 and recently brought on production.
During 2024, InPlay remained focused on operational execution, disciplined capital allocation and prioritizing FAFF while preserving a strong balance sheet which resulted in adjusting our operational and capital activities accordingly. InPlay’s disciplined approach allowed the Company to capitalize on the transformational Pembina Cardium asset acquisition.
Following closing of the Pembina Cardium asset acquisition, InPlay will provide updated development plans and revised full-year 2025 guidance. The acquisition is currently expected to close in April 2025.
2024 was a year of disciplined execution, operational efficiency, and delivering shareholder returns. We remain focused on financial strength, sustainable production, and value creation for our shareholders. As we move into 2025, we believe the Pembina Cardium asset acquisition positions InPlay for significant growth and long-term success. On behalf of our employees, management team and Board of Directors, we would like to thank our shareholders for their support.
2024 Financial and Operating Results:
Achieved average annual production of 8,712 boe/d(1) (58% light crude oil and NGLs) with fourth quarter production average of 9,376 boe/d(1) (57% light crude oil and NGLs).
Generated adjusted funds flow (“AFF”)(2) of $68.5 million ($0.76 per basic share(3)) despite a 44% drop in AECO natural gas prices compared to 2023.
Distributed $16.4 million in dividends, equating to a 10.4% yield relative to year-end market capitalization. Since November 2022, total dividends distributed amounted to $39.2 million ($0.435 per share, including dividends declared to date in 2025).
Invested $63 million in development capital which was $2.5 million below the mid-range of our $64 – $67 million budget and 25% less than 2023. The majority of capital was spent on our drilling program, consisting of 12 (11.9) operated horizontal wells and three (0.65 net) non-operated horizontal wells, including strategic infrastructure projects, and an extensive downhole optimization program. $5.4 million was spent on the optimization program to replace plunger lifts with downhole pumps and lowering pumps in horizontal wells, helping to decrease our base decline rate to 26%.
Materially enhanced capital efficiencies through a 25% reduction in drilling and completion costs experienced in PCU7 as a result of operational enhancements on our four H2 2024 wells drilled in the area.
Exited 2024 at 0.8x net debt to earnings before interest, taxes and depletion (“EBITDA”)(4) which is among the lowest among industry peers.
Generated a strong operating income profit margin(4) of 54% and net income of $9.5 million ($0.11 per basic share, $0.10 per diluted share).
Renewed our $110 million revolving Senior Credit Facility, providing significant liquidity for tactical capital investment and strategic acquisitions.
Allocated $3.4 million to the successful abandonment of 40 wellbores, 37 pipelines and the reclamation of 25 wellsites.
2024 Financial & Operations Overview:
Our 2024 results reflect our disciplined capital allocation approach to maintain financial strength while delivering strong returns to shareholders. We executed our capital program under budget, generated meaningful adjusted funds flow and returned $16.4 million to shareholders. Production averaged 9,376 boe/d(1) (57% light crude oil & NGLs) in the fourth quarter of 2024.
InPlay’s capital program for 2024 consisted of $63.1 million of exploration and development capital. Efficient operational execution in 2024 led to capital expenditures coming in $2.5 million below the mid-point of our $64 – $67 million budget and approximately 25% less than 2023. The Company drilled, completed and brought on production two (1.9 net) ERH wells in Willesden Green, two (2.0 net) one-mile horizontal wells in Willesden Green, three (3.0 net) ERH wells in Pembina, four (4.0 net) PCU7 ERH wells, one (1.0 net) Belly River well, and three (0.65 net) non-operated Willesden Green ERH wells during 2024. This activity amounted to the drilling of 15 (12.6 net) wells. Additionally, the Company incurred drilling costs on one (1.0 net) Glauconite well where drilling challenges resulted in casing failure and led to the termination of drilling operations. In addition, $5.4 million was spent on the optimization of wells during 2024 to change plunger lifts to downhole pumps and lowering pumps in horizontal wells which has led to improved base decline rates. Going forward, InPlay’s improved decline rate results in reduced drilling capital required to maintain production and further enhancing our ability to generate FAFF.
Natural gas prices remained low in 2024 due to production growth in North America with higher than normal inventory levels in North America and Europe. This resulted in a 44% decrease in AECO pricing compared to already low prices in 2023. These lower prices resulted in a 11% decline in our realized boe sales price, which was partially offset by realized hedging gains.
Financial and Operating Results:
Operations Update:
InPlay’s capital program for 2025 is underway with three (3.0 net) ERH wells drilled in PCU7 recently coming on production and are in the early cleanup stage. These wells will offset the three well pad drilled in 2024 which has exceeded internal expectations. Despite the extreme cold temperatures in February, the costs for our first three wells of 2025 came in on time and on budget. Building on the success of our 2024 PCU7 development, we are excited to continue the focused development of this highly prolific area with an additional three net wells planned for the second half of 2025 included in our pre-acquisition 2025 budget. The majority of our remaining 2025 pre-acquisition capital program was scheduled for the second half of the year with minimal spending planned in the second quarter resulting in strong forecasted FAFF.
On March 4, 2025 the government of the United Stated announced tariffs on goods imported from Canada, including a 10% tariff on Canadian energy imports. The situation continues to be fluid and we believe the volatility surrounding these tariffs is already impacting valuations in the energy industry. We continue to monitor the impact of these tariffs on the Company and will make decisions keeping our strategy of disciplined capital allocation, financial flexibility and returns to shareholders at the forefront. InPlay’s financial hedges and a resulting weaker Canadian dollar are expected to mitigate the impact of these tariffs on the Company.
Hedging Update
The Company has reacted to commodity price volatility by securing commodity hedges extending through 2025 and into 2026. InPlay has hedged over 60% of pre-acquisition natural gas production and approximately 55% of pre-acquisition light crude oil production during 2025 at favorable pricing levels. Refer below for a summary of the Company’s commodity-based hedges.
2024 Reserves Results(1):
An organic 2024 capital program without acquisition/disposition (“A&D”) activity resulted in:
Proved developed producing (“PDP”) reserves of 17,207 mboe (54% light and medium crude oil & NGLs)
Total proved (“TP”) reserves of 43,912 mboe (60% light and medium crude oil & NGLs)
Total proved plus probable (“TPP”) reserves of 58,724 mboe (61% light and medium crude oil & NGLs)
Reserves life index (“RLI”)(2) for PDP, TP and TPP of approximately 5.4 years, 13.8 years and 18.5 years, respectively highlights a sizable drilling inventory for long-term development potential.
Achieved NPV BT10 reserve values(1) of:
PDP: $222 million
TP: $485 million
TPP: $706 million
Corporate Reserves Information:
The following summarizes certain information contained in the Reserve Report. The Reserve Report was prepared in accordance with the definitions, standards and procedures contained in the COGE Handbook and National Instrument 51-101 Standards of Disclosure for Oil and Gas Activities (“NI 51-101”). Additional reserve information as required under NI 51-101 will be included in the Company’s Annual Information Form (“AIF”) which will be filed on SEDAR+ by the end of March 2025.
Net Present Values of Reserves:
InPlay achieved strong before tax estimated net present values (“NPV”) of future net revenues associated with our 2024 year-end reserves discounted at 10% (“NPV BT10”), although impacted by weaker future commodity prices in comparison to December 31, 2023. Forecasted WTI and AECO prices used in the Reserve Report decreased by 5% and 30% in year one and 2% and 18% in year two, respectively, compared to 2023. The Company achieved NPV BT10 reserve values of $222 million (PDP), $485 million (TP) and $706 million (TPP) based on the three independent reserve evaluator average pricing, cost forecast and foreign exchange rates as at December 31, 2024 used in the Reserve Report.
Future Development Costs (“FDCs”):
The following FDCs are included in the 2024 Reserve Report:
The $485 million of total FDC in the Reserve Report generates approximately $484 million in future net present value discounted at 10%.
Pricing Assumptions:
The following tables set forth the benchmark reference prices, as at December 31, 2024, reflected in the Reserve Report. These price and cost assumptions were an arithmetic average of the price forecasts of three independent reserve evaluator’s (Sproule, McDaniel & Associates Consultants Ltd. and GLJ Ltd.) then current forecast and Sproule’s foreign exchange rate forecast at the effective date of the Reserve Report.
Forecasted WTI and AECO prices used in the Reserve Report decreased by 5% and 30% in year one and 2% and 18% in year two respectively compared to 2023.
InPlay also confirms that the management information circular (the “Circular”) and form of proxy with respect to the proposed Pembina Cardium asset acquisition and related matters have been mailed to the InPlay shareholders of record as of February 28, 2025. InPlay confirms that the Circular and form of proxy can be accessed and viewed on the Company’s website (www.inplayoil.com) or on the Company’s profile on SEDAR+ (www.sedarplus.ca).
For further information please contact:
Doug Bartole President and Chief Executive Officer InPlay Oil Corp. Telephone: (587) 955-0632
Throughout this document and other materials disclosed by the Company, InPlay uses certain measures to analyze financial performance, financial position and cash flow. These non-GAAP and other financial measures do not have any standardized meaning prescribed under GAAP and therefore may not be comparable to similar measures presented by other entities. The non-GAAP and other financial measures should not be considered alternatives to, or more meaningful than, financial measures that are determined in accordance with GAAP as indicators of the Company performance. Management believes that the presentation of these non-GAAP and other financial measures provides useful information to shareholders and investors in understanding and evaluating the Company’s ongoing operating performance, and the measures provide increased transparency and the ability to better analyze InPlay’s business performance against prior periods on a comparable basis.
Non-GAAP Financial Measures and Ratios
Included in this document are references to the terms “free adjusted funds flow”, “operating income”, “operating netback per boe”, “operating income profit margin” and “Net Debt to EBITDA”. Management believes these measures and ratios are helpful supplementary measures of financial and operating performance and provide users with similar, but potentially not comparable, information that is commonly used by other oil and natural gas companies. These terms do not have any standardized meaning prescribed by GAAP and should not be considered an alternative to, or more meaningful than “profit before taxes”, “profit and comprehensive income”, “adjusted funds flow”, “capital expenditures”, “net debt” or assets and liabilities as determined in accordance with GAAP as a measure of the Company’s performance and financial position.
Free Adjusted Funds Flow/FAFF per share
Management considers FAFF and FAFF per share important measures to identify the Company’s ability to improve its financial condition through debt repayment and its ability to provide returns to shareholders. FAFF should not be considered as an alternative to or more meaningful than AFF as determined in accordance with GAAP as an indicator of the Company’s performance. FAFF is calculated by the Company as AFF less exploration and development capital expenditures and property dispositions (acquisitions) and is a measure of the cashflow remaining after capital expenditures before corporate acquisitions that can be used for additional capital activity, corporate acquisitions, repayment of debt or decommissioning expenditures or potentially return of capital to shareholders. FAFF per share is calculated by the Company as FAFF divided by weighted average shares outstanding. Refer to the “Forward Looking Information and Statements” section for a calculation of forecast FAFF.
Free Adjusted Funds Flow Yield
InPlay uses “free adjusted funds flow yield” as a key performance indicator. When presented on a corporate basis, free adjusted funds flow is calculated by the Company as free adjusted funds flow divided by the market capitalization of the Company. When presented on an asset basis for acquisition purposes, free adjusted funds flow is calculated by the Company as free adjusted funds flow divided by the operating income of the Acquired Assets. Management considers FAFF yield to be an important performance indicator as it demonstrates a Company or asset’s ability to generate cash to pay down debt and provide funds for potential distributions to shareholders. Refer to the “Forward Looking Information and Statements” section for a calculation of forecast FAFF Yield.
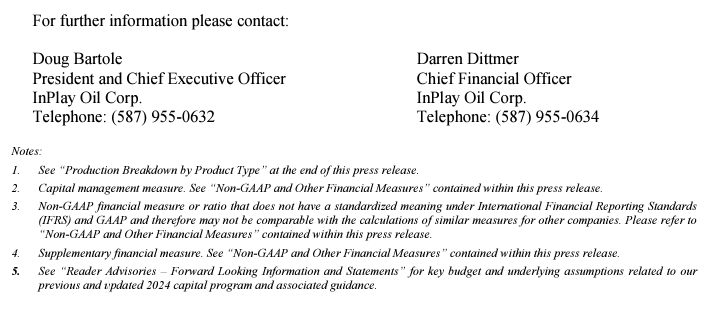
Operating Income/Operating Netback per boe/Operating Income Profit Margin
InPlay uses “operating income”, “operating netback per boe” and “operating income profit margin” as key performance indicators. Operating income is calculated by the Company as oil and natural gas sales less royalties, operating expenses and transportation expenses and is a measure of the profitability of operations before administrative, share-based compensation, financing and other non-cash items. Management considers operating income an important measure to evaluate its operational performance as it demonstrates its field level profitability. Operating income should not be considered as an alternative to or more meaningful than net income as determined in accordance with GAAP as an indicator of the Company’s performance. Operating netback per boe is calculated by the Company as operating income divided by average production for the respective period. Management considers operating netback per boe an important measure to evaluate its operational performance as it demonstrates its field level profitability per unit of production. Operating income profit margin is calculated by the Company as operating income as a percentage of oil and natural gas sales. Management considers operating income profit margin an important measure to evaluate its operational performance as it demonstrates how efficiently the Company generates field level profits from its sales revenue. Refer below for a calculation of operating income, operating netback per boe and operating income profit margin. Refer to the “Forward Looking Information and Statements” section for a calculation of forecast operating income, operating netback per boe and operating income profit margin.
(thousands of dollars)
Three Months EndedDecember 31
Year EndedDecember 31
2024
2023
2024
2023
Revenue
40,039
47,631
153,713
179,366
Royalties
(5,253)
(6,339)
(19,964)
(22,516)
Operating expenses
(12,413)
(13,233)
(48,198)
(49,576)
Transportation expenses
(786)
(940)
(3,083)
(3,130)
Operating income
21,587
27,119
82,468
104,144
Sales volume (Mboe)
862.6
882.8
3,188.5
3,294.1
Per boe
Revenue
46.42
53.95
48.21
54.45
Royalties
(6.09)
(7.18)
(6.26)
(6.84)
Operating expenses
(14.39)
(14.99)
(15.12)
(15.05)
Transportation expenses
(0.91)
(1.06)
(0.97)
(0.95)
Operating netback per boe
25.03
30.72
25.86
31.61
Operating income profit margin
54 %
57 %
54 %
58 %
Net Debt to EBITDA
Management considers Net Debt to EBITDA an important measure as it is a key metric to identify the Company’s ability to fund financing expenses, net debt reductions and other obligations. EBITDA is calculated by the Company as adjusted funds flow before interest expense. When this measure is presented quarterly, EBITDA is annualized by multiplying by four. When this measure is presented on a trailing twelve month basis, EBITDA for the twelve months preceding the net debt date is used in the calculation. This measure is consistent with the EBITDA formula prescribed under the Company’s Senior Credit Facility. Net Debt to EBITDA is calculated as Net Debt divided by EBITDA. Refer to the “Forward Looking Information and Statements” section for a calculation of forecast Net Debt to EBITDA.
Capital Management Measures
Adjusted Funds Flow
Management considers adjusted funds flow to be an important measure of InPlay’s ability to generate the funds necessary to finance capital expenditures. Adjusted funds flow is a GAAP measure and is disclosed in the notes to the Company’s financial statements for the year ended December 31, 2024. All references to adjusted funds flow throughout this document are calculated as funds flow adjusting for decommissioning expenditures. Decommissioning expenditures are adjusted from funds flow as they are incurred on a discretionary and irregular basis and are primarily incurred on previous operating assets. The Company also presents adjusted funds flow per share whereby per share amounts are calculated using weighted average shares outstanding consistent with the calculation of profit per common share.
Net Debt
Net debt is a GAAP measure and is disclosed in the notes to the Company’s financial statements for the year ended December 31, 2024. The Company closely monitors its capital structure with the goal of maintaining a strong balance sheet to fund the future growth of the Company. The Company monitors net debt as part of its capital structure. The Company uses net debt (bank debt plus accounts payable and accrued liabilities less accounts receivables and accrued receivables, prepaid expenses and deposits and inventory) as an alternative measure of outstanding debt. Management considers net debt an important measure to assist in assessing the liquidity of the Company.
Free Funds Flow
Management considers free funds flow to be an important measure of InPlay’s ability to generate the funds necessary after capital expenditures and decommissioning expenditures to improve its financial condition through debt repayment and its ability to provide returns to shareholders. Free funds flow is comprised of GAAP measures disclosed in the notes to the Company’s financial statements for the year ended December 31, 2024. All references to free funds flow throughout this document are calculated as funds flow less exploration and development capital expenditures and property dispositions (acquisitions).
Supplementary Measures
“Average realized crude oil price” is comprised of crude oil commodity sales from production, as determined in accordance with IFRS, divided by the Company’s crude oil volumes. Average prices are before deduction of transportation costs and do not include gains and losses on financial instruments.
“Average realized NGL price” is comprised of NGL commodity sales from production, as determined in accordance with IFRS, divided by the Company’s NGL volumes. Average prices are before deduction of transportation costs and do not include gains and losses on financial instruments.
“Average realized natural gas price” is comprised of natural gas commodity sales from production, as determined in accordance with IFRS, divided by the Company’s natural gas volumes. Average prices are before deduction of transportation costs and do not include gains and losses on financial instruments.
“Average realized commodity price” is comprised of commodity sales from production, as determined in accordance with IFRS, divided by the Company’s volumes. Average prices are before deduction of transportation costs and do not include gains and losses on financial instruments.
“Adjusted funds flow per weighted average basic share” is comprised of adjusted funds flow divided by the basic weighted average common shares.
“Adjusted funds flow per weighted average diluted share” is comprised of adjusted funds flow divided by the diluted weighted average common shares.
“Adjusted funds flow per boe” is comprised of adjusted funds flow divided by total production.
Forward-Looking Information and Statements
This document contains certain forward–looking information and statements within the meaning of applicable securities laws. The use of any of the words “expect”, “anticipate”, “continue”, “estimate”, “may”, “will”, “project”, “should”, “believe”, “plans”, “intends”, “forecast” and similar expressions are intended to identify forward-looking information or statements. In particular, but without limiting the foregoing, this document contains forward-looking information and statements pertaining to the following: the Company’s business strategy, milestones and objectives; the Company’s expectation that an updated presentation will be available after closing of the Pembina Cardium asset acquisition and the timing of such closing; the Company’s belief that the upcoming year will be transformational for InPlay; the Company’s beliefs and expectations regarding the Pembina Cardium asset acquisition, including that it will fundamentally shift the future of the Company, expand the Company’s operational scale, enhance the Company’s overall sustainability, and strengthen FAFF generation, enabling debt reduction and supporting the Company’s shareholder return strategy; the Company’s belief that the acquired assets will strategically complement InPlay’s existing holdings in the Pembina Cardium; the Company’s expectations regarding its expertise and ability to unlock the intrinsic value of its share price; the Company’s belief that it will remain committed to financial discipline maintaining its strong balance sheet, to ultimately generate shareholder value through FAFF growth and return of capital to shareholders; the Company’s belief that the operational enhancements to the drilling PCU7 program can be leveraged to the Company’s other Cardium assets, including those acquired as part of the Pembina Cardium asset acquisition; the Company’s expectation that it following closing of the Pembina Cardium asset acquisition, it will provide updated development plans and revised full-year 2025 guidance; expectations regarding the Company’s PCU7 asset; expectations regarding the Company’s 2025 capital program; the Company’s belief that it will monitor the impact of tariffs and will make decisions keeping the Company’s strategy of disciplined capital allocation, financial flexibility and returns to shareholders at the forefront; expectations regarding the Company’s hedges, including that its financial hedges and a resulting weaker Canadian dollar will mitigate the impact of tariffs on the Company; 2025 forecast production; 2025 guidance and 2025 pro-forma estimates related to the proposed Pembina asset acquisition based on the planned capital program and all associated underlying assumptions set forth in this document including, without limitation, forecasts of 2025 annual average production levels, adjusted funds flow, free adjusted funds flow, Net Debt/EBITDA ratio, operating income profit margin, net debt and Management’s belief that the Company can grow some or all of these attributes and specified measures; light crude oil and NGLs weighting estimates; expectations regarding future commodity prices; future oil and natural gas prices; future liquidity and financial capacity; future results from operations and operating metrics; future costs, expenses and royalty rates; future interest costs; the exchange rate between the $US and $Cdn; future development, exploration, acquisition, development and infrastructure activities and related capital expenditures, including InPlay’s planned 2025 capital program; the amount and timing of capital projects; and methods of funding our capital program.
The internal projections, expectations, or beliefs underlying our Board approved 2025 capital budget and associated guidance are subject to change in light of, among other factors, changes to U.S. economic, regulatory and/or trade policies (including tariffs), the impact of world events including the Russia/Ukraine conflict and war in the Middle East, ongoing results, prevailing economic circumstances, volatile commodity prices, and changes in industry conditions and regulations. InPlay’s 2025 financial outlook and revised guidance provides shareholders with relevant information on management’s expectations for results of operations, excluding any potential acquisitions or dispositions, for such time periods based upon the key assumptions outlined herein. Readers are cautioned that events or circumstances could cause capital plans and associated results to differ materially from those predicted and InPlay’s revised guidance for 2025 may not be appropriate for other purposes. Accordingly, undue reliance should not be placed on same.
Forward-looking statements or information are based on a number of material factors, expectations or assumptions of InPlay which have been used to develop such statements and information, but which may prove to be incorrect. Although InPlay believes that the expectations reflected in such forward-looking statements or information are reasonable, undue reliance should not be placed on forward-looking statements because InPlay can give no assurance that such expectations will prove to be correct. In addition to other factors and assumptions which may be identified herein, assumptions have been made regarding, among other things: the current U.S. economic, regulatory and/or trade policies; the impact of increasing competition; the general stability of the economic and political environment in which InPlay operates; the timely receipt of any required regulatory approvals; the ability of InPlay to obtain qualified staff, equipment and services in a timely and cost efficient manner; drilling results; the ability of the operator of the projects in which InPlay has an interest in to operate the field in a safe, efficient and effective manner; the ability of InPlay to obtain debt financing on acceptable terms; the anticipated tax treatment of the monthly base dividend; that other than the tariffs that came into effect on March 4, 2025 (some of which were subsequently paused on March 6, 2025), neither the U.S. nor Canada (i) increases the rate or scope of such tariffs (if they come into effect in the future), or imposes new tariffs, on the import of goods from one country to the other, including on oil and natural gas, and/or (ii) imposes any other form of tax, restriction or prohibition on the import or export of products from one country to the other, including on oil and natural gas; the potential scope and duration of tariffs, export taxes, export restrictions or other trade actions; magnitude and duration of potential new or increased tariffs may be imposed on goods imported from Canada into the United States, which could adversely impact InPlay’s revenues; the potential for new and increased U.S. tariffs and protectionist trade measures on Canadian oil and gas imports; changes in political and economic conditions, including risks associated with tariffs, export taxes, export restrictions or other trade actions; impacts of any tariffs imposed on Canadian exports into the United States by the Trump administration and any retaliatory steps taken by the Canadian federal government; that InPlay’s results and operations could be adversely affected by economic or geopolitical developments, including protectionist trade policies such as tariffs, or other events; conditions in international markets, including social and political conditions, civil unrest, terrorist activity, governmental changes, restrictions on the ability to transfer capital across borders, tariffs and other protectionist measures; field production rates and decline rates; the ability to replace and expand oil and natural gas reserves through acquisition, development and exploration; the timing and cost of pipeline, storage and facility construction and the ability of InPlay to secure adequate product transportation; future commodity prices; that various conditions to a shareholder return strategy can be satisfied; the ongoing impact of the Russia/Ukraine conflict and war in the Middle East; currency, exchange and interest rates; regulatory framework regarding royalties, taxes and environmental matters in the jurisdictions in which InPlay operates; and the ability of InPlay to successfully market its oil and natural gas products.
Without limitation of the foregoing, readers are cautioned that the Company’s future dividend payments to shareholders of the Company, if any, and the level thereof will be subject to the discretion of the Board of Directors of InPlay. The Company’s dividend policy and funds available for the payment of dividends, if any, from time to time, is dependent upon, among other things, levels of FAFF, leverage ratios, financial requirements for the Company’s operations and execution of its growth strategy, fluctuations in commodity prices and working capital, the timing and amount of capital expenditures, credit facility availability and limitations on distributions existing thereunder, and other factors beyond the Company’s control. Further, the ability of the Company to pay dividends will be subject to applicable laws, including satisfaction of solvency tests under the Business Corporations Act (Alberta), and satisfaction of certain applicable contractual restrictions contained in the agreements governing the Company’s outstanding indebtedness. Further, the actual amount, the declaration date, the record date and the payment date of any dividend are subject to the discretion of the InPlay Board of Directors. There can be no assurance that InPlay will pay dividends in the future.
The forward-looking information and statements included herein are not guarantees of future performance and should not be unduly relied upon. Such information and statements, including the assumptions made in respect thereof, involve known and unknown risks, uncertainties and other factors that may cause actual results or events to defer materially from those anticipated in such forward-looking information or statements including, without limitation: changes in industry regulations and legislation (including, but not limited to, tax laws, royalties, and environmental regulations); the risk that the Pembina Cardium asset acquisition may not be completed on the anticipated terms or timing; risks related to an international trade war, including the risk that the U.S. government imposes additional tariffs on Canadian goods, including crude oil and natural gas, and that such tariffs (and/or the Canadian government’s response to such tariffs) adversely affect the demand and/or market price for InPlay’s products and/or otherwise adversely affects InPlay, or lead to the termination of InPlay’s financing arrangements for the Pembina Cardium asset acquisition, including specifically that the imposition of tariffs or similar measures in excess of 10% would be an adverse tariff event for the purposes of InPlay’s new credit facilities to be entered into in connection with the transaction and that the lenders thereunder may choose not to fund the transaction; the continuing impact of the Russia/Ukraine conflict and war in the Middle East; potential changes to U.S. economic, regulatory and/or trade policies as a result of a change in government; inflation and the risk of a global recession; changes in our planned 2025 capital program; changes in our approach to shareholder returns; changes in commodity prices and other assumptions outlined herein; the risk that dividend payments may be reduced, suspended or cancelled; the potential for variation in the quality of the reservoirs in which InPlay operates; changes in the demand for or supply of InPlay’s products; unanticipated operating results or production declines; changes in tax or environmental laws, royalty rates or other regulatory matters; changes in development plans or strategies of InPlay or by third party operators of InPlay’s properties; changes in InPlay’s credit structure, increased debt levels or debt service requirements; inaccurate estimation of InPlay’s light crude oil and natural gas reserve and resource volumes; limited, unfavorable or a lack of access to capital markets; increased costs; a lack of adequate insurance coverage; the impact of competitors; and certain other risks detailed from time-to-time in InPlay’s continuous disclosure documents filed on SEDAR+ including InPlay’s Annual Information Form dated March 27, 2024 and the annual management’s discussion & analysis for the year ended December 31, 2024.
This document contains future-oriented financial information and financial outlook information (collectively, “FOFI”) about InPlay’s financial and leverage targets and objectives, potential dividends, and beliefs underlying our Board approved 2025 capital budget and associated guidance, all of which are subject to the same assumptions, risk factors, limitations, and qualifications as set forth in the above paragraphs. The actual results of operations of InPlay and the resulting financial results will likely vary from the amounts set forth in this document and such variation may be material. InPlay and its management believe that the FOFI has been prepared on a reasonable basis, reflecting management’s reasonable estimates and judgments. However, because this information is subjective and subject to numerous risks, it should not be relied on as necessarily indicative of future results. Except as required by applicable securities laws, InPlay undertakes no obligation to update such FOFI. FOFI contained in this document was made as of the date of this document and was provided for the purpose of providing further information about InPlay’s anticipated future business operations and strategy. Readers are cautioned that the FOFI contained in this document should not be used for purposes other than for which it is disclosed herein.
The forward-looking information and statements contained in this document speak only as of the date hereof and InPlay does not assume any obligation to publicly update or revise any of the included forward-looking statements or information, whether as a result of new information, future events or otherwise, except as may be required by applicable securities laws.
InPlay’s 2024 annual guidance and a comparison to 2024 actual results are outlined below.
GuidanceFY 2024(1)
ActualsFY 2024
Variance
Variance (%)
Production
Boe/d
8,700 – 8,750
8,712
–
–
Adjusted Funds Flow
$ millions
$68 – $70
$68.5
–
–
Capital Expenditures
$ millions
$63
$63
–
–
Free Adjusted Funds Flow
$ millions
$5 – $7
$5.5
–
–
Net Debt
$ millions
$59 – $61
$61
–
–
(1) As previously released February 4, 2025.
Risk Factors to FLI
Risk factors that could materially impact successful execution and actual results of the Company’s 2025 capital program and associated guidance and estimates include:
risks related to an international trade war, including the risk that the U.S. government imposes additional tariffs on Canadian goods, including crude oil and natural gas, and that such tariffs (and/or the Canadian government’s response to such tariffs) adversely affect the demand and/or market price for the Company’s products and/or otherwise adversely affects the Company;
volatility of petroleum and natural gas prices and inherent difficulty in the accuracy of predictions related thereto;
the extent of any unfavourable impacts of wildfires in the province of Alberta.
changes in Federal and Provincial regulations;
the Company’s ability to secure financing for the Board approved 2025 capital program and longer-term capital plans sourced from AFF, bank or other debt instruments, asset sales, equity issuance, infrastructure financing or some combination thereof; and
those additional risk factors set forth in the Company’s MD&A and most recent Annual Information Form filed on SEDAR+.
Key Budget and Underlying Material Assumptions to FLI
The key budget and underlying material assumptions used by the Company in the development of its 2025 guidance and 2025 pro-forma estimates(3) relating to the proposed acquisition of Pembina Cardium assets from Obsidian Energy Ltd. are as follows:
ActualsFY 2024
GuidanceFY 2024(1)
GuidanceFY 2025(1)
Pro-formaEstimateFY 2025(2)(3)(4)
WTI
US$/bbl
$75.72
$75.72
$72.00
$72.65
NGL Price
$/boe
$32.99
$32.90
35.40
48.65
AECO
$/GJ
$1.39
$1.39
$1.90
$1.85
Foreign Exchange Rate
CDN$/US$
0.73
0.73
0.70
0.70
MSW Differential
US$/bbl
$4.51
$4.50
$4.50
$4.75
Production
Boe/d
8,712
8,700 – 8,750
8,650 – 9,150
18,750
Revenue
$/boe
48.21
47.75 – 48.75
46.00 – 51.00
56.50 – 61.50
Royalties
$/boe
6.26
6.00 – 6.50
5.50 – 7.00
7.00 – 8.50
Operating Expenses
$/boe
15.12
14.50 – 15.50
13.00 – 15.00
16.00 – 18.00
Transportation
$/boe
0.97
0.90 – 1.05
0.90 – 1.15
0.90 – 1.15
Interest
$/boe
2.19
2.00 – 2.25
1.30 – 1.90
2.20 – 2.80
General and Administrative
$/boe
3.06
2.90 – 3.20
3.00 – 3.75
1.50 – 2.25
Hedging loss (gain)
$/boe
(0.86)
(0.75 – (1.00)
0.00 – 0.25
0.00 – 0.50
Decommissioning Expenditures
$ millions
$3.4
$3.2 – $3.4
$3.0 – $3.5
$6.0
Adjusted Funds Flow
$ millions
$68.5
$68 – $70
$69 – $75
$204
Dividends
$ millions
$16
$16
$16.5
$26
ActualsFY 2024
GuidanceFY 2024(1)
GuidanceFY 2025(1)
Pro-formaEstimateFY 2025(2)(3)(4)
Adjusted Funds Flow
$ millions
$68.5
$68 – $70
$69 – $75
$204
Capital Expenditures
$ millions
$63
$63
$41 – $44
$94
Free Adjusted Funds Flow
$ millions
$5.5
$5 – $7
$25 – $34
$104
Shares outstanding, end of year
# millions
90.1
90.1
90.4
158
Assumed share price
$/share
$1.73
$1.73
$1.65
1.55
Market capitalization
$ millions
$156
$156
$150
245
FAFF Yield
%
4 %
3% – 4%
17% – 23%
42 %
ActualsFY 2024
GuidanceFY 2024(1)
GuidanceFY 2025(1)
Pro-formaEstimateFY 2025(2)(3)(4)
Revenue
$/boe
48.21
47.75 – 48.75
46.00 – 51.00
56.50 – 61.50
Royalties
$/boe
6.26
6.00 – 6.50
5.50 – 7.00
7.00 – 8.50
Operating Expenses
$/boe
15.12
14.50 – 15.50
13.00 – 15.00
16.00 – 18.00
Transportation
$/boe
0.97
0.90 – 1.05
0.90 – 1.15
0.90 – 1.15
Operating Netback
$/boe
25.86
25.50 – 26.50
24.75 – 29.75
31.50 – 36.50
Operating Income Profit Margin
54 %
54 %
56 %
58 %
ActualsFY 2024
GuidanceFY 2024(1)
GuidanceFY 2025(1)
Pro-formaEstimateFY 2025(2)(3)(4)
Adjusted Funds Flow
$ millions
$68.5
$68 – $70
$69 – $75
$204
Interest
$/boe
2.19
2.00 – 2.25
1.30 – 1.90
2.20 – 2.80
EBITDA
$ millions
$76
$75 – $77
$74 – $80
$221
Net Debt
$ millions
$61
$59 – $61
$52 – $58
$203
Net Debt/EBITDA
0.8
0.8
0.6 – 0.8
0.9
(1)
As previously released February 4, 2025.
(2)
As previously released February 19, 2025.
(3)
InPlay’s pro-forma estimate for 2025 are preliminary in nature and do not reflect a Board approved capital expenditure budget. Following closing of the Pembina Cardium asset acquisition, InPlay will provide updated development plans and revised full-year 2025 guidance.
(4)
2025E pro forma estimates have been presented as though InPlay acquired the Acquired Assets at January 1, 2025 notwithstanding that income from January 1, 2025 to closing represents a purchase price adjustment and such production will not be directly attributed to InPlay.
See “Production Breakdown by Product Type” below
Quality and pipeline transmission adjustments may impact realized oil prices in addition to the MSW Differential provided above
Changes in working capital are not assumed to have a material impact between the years presented above.
Information Regarding Disclosure on Oil and Gas Reserves and Operational Information
Our oil and gas reserves statement for the year ended December 31, 2024, which will include complete disclosure of our oil and gas reserves and other oil and gas information in accordance with NI 51-101, will be contained within our Annual Information Form which will be available on our SEDAR profile at www.sedarplus.ca on or before March 31, 2025. The recovery and reserve estimates contained herein are estimates only and there is no guarantee that the estimated reserves will be recovered. In relation to the disclosure of estimates for individual properties, such estimates may not reflect the same confidence level as estimates of reserves and future net revenue for all properties, due to the effects of aggregation. The Company’s belief that it will establish additional reserves over time with conversion of probable undeveloped reserves into proved reserves is a forward-looking statement and is based on certain assumptions and is subject to certain risks, as discussed above under the heading “Forward-Looking Information and Statements”.
This press release contains metrics commonly used in the oil and natural gas industry, such as “operating netbacks” and “reserve life index” or “RLI”. Each of these terms are calculated by InPlay as described within this press release. These terms do not have standardized meanings or standardized methods of calculation and therefore may not be comparable to similar measures presented by other companies, and therefore should not be used to make such comparisons. Such metrics have been included herein to provide readers with additional information to evaluate the Company’s performance, however such metrics should not be unduly relied upon.
Management uses these oil and gas metrics for its own performance measurements and to provide shareholders with measures to compare InPlay’s operations over time, however such measures are not reliable indicators of InPlay’s future performance and future performance may not be comparable to the performance in prior periods. Readers are cautioned that the information provided by these metrics, or that can be derived from the metrics presented in this press release, should not be relied upon for investment or other purposes, however such measures are not reliable indicators on InPlay’s future performance and future performance may not be comparable to the performance in prior periods.
References to light crude oil, NGLs or natural gas production in this press release refer to the light and medium crude oil, natural gas liquids and conventional natural gas product types, respectively, as defined in National Instrument 51-101, Standards of Disclosure for Oil and Gas Activities (“Nl 51-101“).
Production Breakdown by Product Type
Disclosure of production on a per boe basis in this document consists of the constituent product types as defined in NI 51–101 and their respective quantities disclosed in the table below:
Light and Medium Crude oil(bbls/d)
NGLs(boe/d)
Conventional Natural gas(Mcf/d)
Total(boe/d)
Q4 2023 Average Production
4,142
1,520
23,606
9,596
2023 Average Production
3,822
1,396
22,839
9,025
Q4 2024 Average Production
3,691
1,651
24,203
9,376
2024 Average Production
3,523
1,499
22,139
8,712
2024 Annual Guidance
3,535
1,495
22,170
8,725(1)
2025 Annual Guidance
3,425
1,510
23,790
8,900(2)
2025 Pro Forma Estimate
9,535
2,180
42,215
18,750
Notes:
1.
This reflects the mid-point of the Company’s 2024 production guidance range of 8,700 to 8,750 boe/d.
2.
This reflects the mid-point of the Company’s 2025 production guidance range of 8,650 to 9,150 boe/d.
3.
With respect to forward–looking production guidance, product type breakdown is based upon management’s expectations based on reasonable assumptions but are subject to variability based on actual well results.
BOE equivalent
Barrel of oil equivalents or BOEs may be misleading, particularly if used in isolation. A BOE conversion ratio of 6 mcf: 1 bbl is based on an energy equivalency conversion method primarily applicable at the burner tip and does not represent a value equivalency at the wellhead. Given that the value ratio based on the current price of crude oil as compared to natural gas is significantly different than the energy equivalency of 6:1, utilizing a 6:1 conversion basis may be misleading as an indication of value.
Initial Production Rates
References in this press release to IP rates, other short-term production rates or initial performance measures relating to new wells are useful in confirming the presence of hydrocarbons; however, such rates are not determinative of the rates at which such wells will commence production and decline thereafter and are not indicative of long-term performance or of ultimate recovery. While encouraging, readers are cautioned not to place reliance on such rates in calculating the aggregate production for the Company. Accordingly, the Company cautions that the test results should be considered to be preliminary.
CALGARY AB, March. 3, 2025 /CNW/ – InPlay Oil Corp. (TSX: IPO) (OTCQX: IPOOF) (“InPlay” or the “Company”) is pleased to confirm that its Board of Directors has declared a monthly cash dividend of $0.015 per common share payable on March 31, 2025, to shareholders of record at the close of business on March 14, 2025. The monthly cash dividend is expected to be designated as an “eligible dividend” for Canadian federal and provincial income tax purposes.
About InPlay Oil Corp.
InPlay is a junior oil and gas exploration and production company with operations in Alberta focused on light oil production. The company operates long-lived, low-decline properties with drilling development and enhanced oil recovery potential as well as undeveloped lands with exploration possibilities. The common shares of InPlay trade on the Toronto Stock Exchange under the symbol IPO and the OTCQX Exchange under the symbol IPOOF.
For further information please contact: Doug Bartole, President and Chief Executive Officer, InPlay Oil Corp., Telephone: (587) 955-0632; Darren Dittmer, Chief Financial Officer, InPlay Oil Corp., Telephone: (587) 955-0634
InPlay Oil is a junior oil and gas exploration and production company with operations in Alberta focused on light oil production. The company operates long-lived, low-decline properties with drilling development and enhanced oil recovery potential as well as undeveloped lands with exploration possibilities. The common shares of InPlay trade on the Toronto Stock Exchange under the symbol IPO and the OTCQX Exchange under the symbol IPOOF.
Mark Reichman, Managing Director, Equity Research Analyst, Natural Resources, Noble Capital Markets, Inc.
Hans Baldau, Research Associate, Noble Capital Markets, Inc.
Refer to the full report for the price target, fundamental analysis, and rating.
Transaction highlights. The acquisition appears to offer significant synergies and benefits to InPlay’s operations. InPlay’s production is expected to more than double to 18,750 boe/d from previous guidance of 8,650-9,150. Additionally, on a per share basis, 2025 adjusted funds flow (AFF) is expected to increase to C$204 million from previous guidance of C$69-75 million. Furthermore, the nature of the assets acquired is expected to enhance operational efficiencies to InPlay’s existing Pembina asset base by increasing the scale and contributing to lower decline, higher oil-weighting, and less capital-intensive production.
Equity Research is available at no cost to Registered users of Channelchek. Not a Member? Click ‘Join’ to join the Channelchek Community. There is no cost to register, and we never collect credit card information.
This Company Sponsored Research is provided by Noble Capital Markets, Inc., a FINRA and S.E.C. registered broker-dealer (B/D).
*Analyst certification and important disclosures included in the full report. NOTE: investment decisions should not be based upon the content of this research summary. Proper due diligence is required before making any investment decision.
InPlay Oil is a junior oil and gas exploration and production company with operations in Alberta focused on light oil production. The company operates long-lived, low-decline properties with drilling development and enhanced oil recovery potential as well as undeveloped lands with exploration possibilities. The common shares of InPlay trade on the Toronto Stock Exchange under the symbol IPO and the OTCQX Exchange under the symbol IPOOF.
Mark Reichman, Managing Director, Equity Research Analyst, Natural Resources, Noble Capital Markets, Inc.
Hans Baldau, Research Associate, Noble Capital Markets, Inc.
Refer to the full report for the price target, fundamental analysis, and rating.
Updated 2024 guidance. Inplay Oil modestly lowered its 2024 production guidance to 8,700 to 8,750 boe/d from 8,700 to 9,000. Additionally, the company lowered its expectations for crude oil prices and slightly raised expense guidance. Due to these changes, the adjusted funds flow (AFF) is expected to range from C$68 million to C$70 million compared to prior guidance of C$70 million to C$73 million. Capital expenditures for 2024 are expected to come in at around C$63 million compared to original expectations of C$64-67 million. The savings are mainly due to cost efficiencies from the Pembina Cardium Unit #7 (PCU7) drilling program.
Outlook for 2025. Management has planned a capital-efficient program in 2025. The company expects to increase production by 2%, in the range of 8,650 to 9,150 boe/d, compared to 2024, while spending around C$20 million less. The total capital budget for 2025 is C$41 million to C$44 million and will primarily be directed toward the Pembina Cardium Unit #7 property. Management expects adjusted funds flow (AFF) to benefit from lower capital expenditures and anticipates 2025 AFF to be between C$69 million and C$75 million.
Equity Research is available at no cost to Registered users of Channelchek. Not a Member? Click ‘Join’ to join the Channelchek Community. There is no cost to register, and we never collect credit card information.
This Company Sponsored Research is provided by Noble Capital Markets, Inc., a FINRA and S.E.C. registered broker-dealer (B/D).
*Analyst certification and important disclosures included in the full report. NOTE: investment decisions should not be based upon the content of this research summary. Proper due diligence is required before making any investment decision.
InPlay Oil is a junior oil and gas exploration and production company with operations in Alberta focused on light oil production. The company operates long-lived, low-decline properties with drilling development and enhanced oil recovery potential as well as undeveloped lands with exploration possibilities. The common shares of InPlay trade on the Toronto Stock Exchange under the symbol IPO and the OTCQX Exchange under the symbol IPOOF.
Mark Reichman, Managing Director, Equity Research Analyst, Natural Resources, Noble Capital Markets, Inc.
Hans Baldau, Research Associate, Noble Capital Markets, Inc.
Refer to the full report for the price target, fundamental analysis, and rating.
Third quarter financial results. InPlay Oil generated third quarter net income of C$146 thousand or C$0.00 per share compared to C$9.2 million or C$0.08 per share during the prior year period. We had predicted net income in the amount of C$423 thousand or C$0.00 per share. Average quarterly production declined to 8,206 barrels of oil equivalents per day (boe/d) compared to 9,003 boe/d in the third quarter of 2023 and our estimate of 8,238 boe/d.
Corporate 2024 guidance. While InPlay has maintained its production guidance of 8,700 to 9,000 boe/d, commodity price expectations were lowered, and operating expenses are expected to be in the range of C$13.50 to C$15.50 per boe/d compared to prior guidance of C$13.00 to C$15.25 per boe/d. Capital expenditures are expected to total $63 million compared with prior guidance of C$64 million to C$67 million. Adjusted funds flow is expected to be in the range of C$70 million to C$73 million compared to previous expectations of C$80 million to C$85 million.
Equity Research is available at no cost to Registered users of Channelchek. Not a Member? Click ‘Join’ to join the Channelchek Community. There is no cost to register, and we never collect credit card information.
This Company Sponsored Research is provided by Noble Capital Markets, Inc., a FINRA and S.E.C. registered broker-dealer (B/D).
*Analyst certification and important disclosures included in the full report. NOTE: investment decisions should not be based upon the content of this research summary. Proper due diligence is required before making any investment decision.
InPlay Oil is a junior oil and gas exploration and production company with operations in Alberta focused on light oil production. The company operates long-lived, low-decline properties with drilling development and enhanced oil recovery potential as well as undeveloped lands with exploration possibilities. The common shares of InPlay trade on the Toronto Stock Exchange under the symbol IPO and the OTCQX Exchange under the symbol IPOOF.
Mark Reichman, Managing Director, Equity Research Analyst, Natural Resources, Noble Capital Markets, Inc.
Refer to the full report for the price target, fundamental analysis, and rating.
Lower third quarter commodity prices. During the third quarter, West Texas Intermediate (WTI) crude oil prices declined 18.2% to $68.17 per barrel and averaged $75.35 per barrel. InPlay sells oil at monthly average Edmonton Par prices which are based on the price of WTI crude oil minus quality differentials, transportation, and marketing fees. Crude oil prices have risen since the end of the quarter due to heightened geopolitical risk with WTI crude oil priced at $74.45 per barrel on October 4. WTI and Henry Hub futures prices average $71.16 per barrel and $3.40 per mcf in 2025. We note that natural gas prices in Canada were weak relative to Henry Hub prices during the third quarter.
Outlook for 2025. For 2024, the company forecast average production of 8,700 to 9,000 barrels of oil equivalent per day (boe/d). We are forecasting 2024 production of 8,682 barrels of oil equivalents per day compared to our previous estimate of 8,952 boe/d due to lower third and fourth quarter expectations. We think the company may start off with a conservative 2025 plan that targets production at the upper end of 2024 guidance and have lowered our production expectations to 8,971 from 9,638 barrels of oil equivalents per day.
Equity Research is available at no cost to Registered users of Channelchek. Not a Member? Click ‘Join’ to join the Channelchek Community. There is no cost to register, and we never collect credit card information.
This Company Sponsored Research is provided by Noble Capital Markets, Inc., a FINRA and S.E.C. registered broker-dealer (B/D).
*Analyst certification and important disclosures included in the full report. NOTE: investment decisions should not be based upon the content of this research summary. Proper due diligence is required before making any investment decision.
InPlay Oil is a junior oil and gas exploration and production company with operations in Alberta focused on light oil production. The company operates long-lived, low-decline properties with drilling development and enhanced oil recovery potential as well as undeveloped lands with exploration possibilities. The common shares of InPlay trade on the Toronto Stock Exchange under the symbol IPO and the OTCQX Exchange under the symbol IPOOF.
Mark Reichman, Managing Director, Equity Research Analyst, Natural Resources, Noble Capital Markets, Inc.
Refer to the full report for the price target, fundamental analysis, and rating.
Second quarter financial results. InPlay Oil reported second quarter net income of C$5.4 million or C$0.06 per compared to C$4.3 million or C$0.05 per during the prior year period. We had forecast net income of C$3.6 million or C$0.04 per share. Average quarterly production increased 2.2% to 8,657 barrels of oil equivalent per day (boe/d) compared to 8,474 in the second quarter of 2023.
Corporate guidance. InPlay trimmed its 2024 production guidance to a range of 8,700 to 9,000 boe/d from 9,000 to 9,500, and lowered expectations for crude oil prices. Lower production reflects foregone production from a Glauconite well that was drilled but experienced casing failure, downtime, and a decision to bring wells on later in the year. Expense guidance is mostly unchanged on a dollar per barrel of oil equivalent basis. Adjusted funds flow is expected to be in the range of C$80 million to C$85 million compared to prior guidance of C$90 million to C$97 million.
Equity Research is available at no cost to Registered users of Channelchek. Not a Member? Click ‘Join’ to join the Channelchek Community. There is no cost to register, and we never collect credit card information.
This Company Sponsored Research is provided by Noble Capital Markets, Inc., a FINRA and S.E.C. registered broker-dealer (B/D).
*Analyst certification and important disclosures included in the full report. NOTE: investment decisions should not be based upon the content of this research summary. Proper due diligence is required before making any investment decision.
InPlay Oil is a junior oil and gas exploration and production company with operations in Alberta focused on light oil production. The company operates long-lived, low-decline properties with drilling development and enhanced oil recovery potential as well as undeveloped lands with exploration possibilities. The common shares of InPlay trade on the Toronto Stock Exchange under the symbol IPO and the OTCQX Exchange under the symbol IPOOF.
Mark Reichman, Managing Director, Equity Research Analyst, Natural Resources, Noble Capital Markets, Inc.
Refer to the full report for the price target, fundamental analysis, and rating.
Looking ahead. While first quarter production was 5% lower than the prior year period, we expect a stronger second quarter due to wells that went into production in late March and early April and stronger crude oil prices. InPlay plans to drill and bring new production online in the third quarter of 2024 that is focused on high oil-weighted properties. The oil-weighted production from new wells is expected to benefit from higher realized oil prices forecasted for the balance of the year.
Updating estimates. We have increased our 2024 and 2025 EPS estimates to $0.18 and $0.26, respectively, from $0.16 and $0.23. Our estimates reflect modestly higher production in the second and third quarters of 2024 and higher crude oil prices. We forecast adjusted funds flow of $91.0 million in 2024 and $99.4 million in 2025. Depending on the company’s production profile, we think our estimates may prove conservative.
Equity Research is available at no cost to Registered users of Channelchek. Not a Member? Click ‘Join’ to join the Channelchek Community. There is no cost to register, and we never collect credit card information.
This Company Sponsored Research is provided by Noble Capital Markets, Inc., a FINRA and S.E.C. registered broker-dealer (B/D).
*Analyst certification and important disclosures included in the full report. NOTE: investment decisions should not be based upon the content of this research summary. Proper due diligence is required before making any investment decision.
InPlay Oil is a junior oil and gas exploration and production company with operations in Alberta focused on light oil production. The company operates long-lived, low-decline properties with drilling development and enhanced oil recovery potential as well as undeveloped lands with exploration possibilities. The common shares of InPlay trade on the Toronto Stock Exchange under the symbol IPO and the OTCQX Exchange under the symbol IPOOF.
Michael Heim, Senior Vice President, Equity Research Analyst, Energy & Transportation, Noble Capital Markets, Inc.
Refer to the full report for the price target, fundamental analysis, and rating.
Production results were below expectations as extremely cold weather affected wells. InPlay was actively drilling in the first quarter. Several wells were completed at the end of the quarter and should help out next quarter’s production. The resumption of drilling in a prolific region this fall should lead to higher production in 2025.
Pricing remains an issue as the discount to WTI oil prices remains large, but the discount shows signs of improving. The discount between realized prices and WTI oil prices (as expressed in Canadian dollars) remains wide. New oil and gas pipelines in western Canada should lower the discount. Oil and gas futures already indicate as much.
Equity Research is available at no cost to Registered users of Channelchek. Not a Member? Click ‘Join’ to join the Channelchek Community. There is no cost to register, and we never collect credit card information.
This Company Sponsored Research is provided by Noble Capital Markets, Inc., a FINRA and S.E.C. registered broker-dealer (B/D).
*Analyst certification and important disclosures included in the full report. NOTE: investment decisions should not be based upon the content of this research summary. Proper due diligence is required before making any investment decision.
CALGARY AB, May 9, 2024 /CNW/ – InPlay Oil Corp. (TSX: IPO) (OTCQX: IPOOF) (“InPlay” or the “Company”) announces its financial and operating results for the three months ended March 31, 2024. InPlay’s condensed unaudited interim financial statements and notes, as well as Management’s Discussion and Analysis (“MD&A”) for the three months ended March 31, 2024 will be available at “www.sedarplus.ca” and our website at “www.inplayoil.com“. An updated presentation will soon be available on our website.
First Quarter 2024 Financial & Operating Results
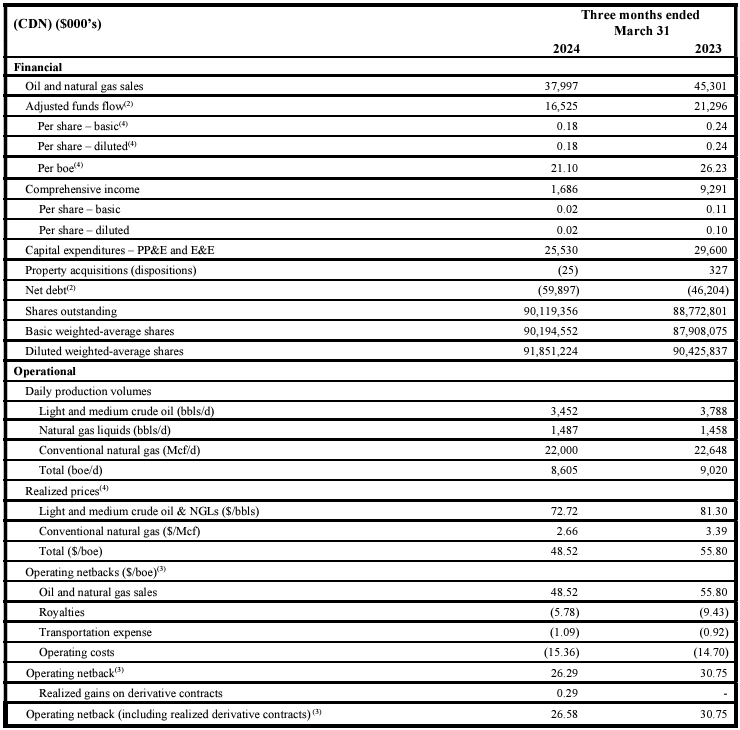
Achieved average quarterly production of 8,605 boe/d(1) (57% light crude oil and NGLs).
Generated strong quarterly AFF(2) of $16.5 million ($0.18 per basic share(3)).
Returned $4.1 million to shareholders through our monthly base dividend, representing an annual yield of 7.6% relative to quarter-end market capitalization. Since November 2022 InPlay has distributed $25.6 million in dividends, or $0.285 per share including dividends declared to date in 2024.
Realized a strong operating income profit margin of 54%.
Completed an active capital program investing $25.5 million to drill, complete and equip 8 (5.6 net) ERH Cardium wells in Pembina and Willesden Green. The majority of production from the program came fully onstream later in March and into April benefiting from April’s higher Edmonton Par price of $109.70/bbl compared to $92.12/bbl average for the first quarter. Current corporate production is approximately 9,350 boe/d(1) (60% light crude oil and NGLs) based on field estimates.
Outlook and Operations Update(5)
We are excited about our capital program for the remainder of the year and plan to drill and bring new production online in the third quarter of 2024 focused on high oil-weighted properties given the current low natural gas pricing environment. The oil-weighted production from new wells is expected to benefit from higher realized oil prices forecasted for the balance of the year as a result of West Texas Intermediate (“WTI”) improvements which started in April. In addition, the Mixed Sweet Blend (“MSW”) differential which was USD $8.65/bbl in Q1 2024 and is forecasted to average USD $3.65/bbl on futures pricing for the balance of the year with the commencement of flow on the Trans Mountain Pipeline expansion adding to takeaway capacity in Canada. InPlay’s second half drilling program is expected to start in June, or potentially July, with over 60% of our net wells for the year remaining to be drilled and brought on production. This activity is projected to lead to strong production rates and free adjusted funds flow (“FAFF”)(3) generation.
The Company looks forward to resuming development of a prolific area of Pembina previously restricted by third party gas plant capacity. In the first quarter, InPlay entered into a long-term Gas Handling Agreement which provides guaranteed access to natural gas processing capacity, allowing the Company to recommence development of this lucrative and strong rate of return growth area where InPlay has not drilled since the spring of 2022. These wells are characterized by strong oil rates similar to other Cardium oil wells while also benefitting from materially higher gas rates and lower overall production declines. InPlay plans to drill a three (3.0 net) extended reach horizontal (“ERH”) Cardium well pad in this area in the third quarter of 2024 with gas production expected to be sold into the stronger winter gas pricing season when forward pricing is approximately $3.45/mcf compared to current pricing of $1.70/mcf.
The Company is well positioned with strong momentum to build upon for the balance of the year as the majority of new production from the Company’s first quarter capital program came on-line in late March and early April. Minimal capital spending is planned for the second quarter, and the combination of higher average production with stronger realized oil prices which started in Q2 2024 is expected to result in significant FAFF generation and net debt reduction.
With the new wells coming on production in late March and early April, current corporate production is approximately 9,350 boe/d(1) (60% light crude oil and NGLs) based on field estimates. InPlay reiterates our 2024 annual average production guidance of 9,000 – 9,500 boe/d (59% – 61% light crude oil and NGLs) supported by strong current production rates and the majority of our wells coming on production in the second half of the year, including 3.0 net wells in our prolific Pembina play. The sustained improvement in WTI prices and a lower MSW differential since the release of our budget in late January results in an updated 2024 Adjusted Funds Flow (“AFF”)(2) forecast of $90 to $97 million based on USD $80 WTI for the remainder of the year, with estimated FAFF(3) of $23 to $33 million. The Company’s leverage metrics are projected to remain at levels which are among the lowest in our peer group. Net debt to EBITDA(3) is forecasted to be 0.4x – 0.5x for 2024 supporting the Company’s sustainable dividend and continued strategy of delivering returns to shareholders. The 2024 capital program will remain flexible and InPlay will revisit this program considering market and economic conditions through the remainder of the year.
Financial and Operating Results:
First Quarter 2024 Financial & Operations Overview:
InPlay completed an active capital program during the first quarter of 2024 consisting of $25.5 million of development capital which is approximately 40% of our capital budget for the year. The Company drilled two (1.9 net) ERH wells in Willesden Green which were brought on production in late February, with three (3.0 net) ERH wells in Pembina and two (0.3 net) non-operated Willesden Green ERH wells brought on production in late March. The Company also participated in one (0.35 net) non-operated Willesden Green ERH well which came on production in April. Drilling and completions operations were affected by cold weather and elevated industry activity limiting the availability of service providers resulting in new production coming on approximately three weeks later than anticipated. This delay however, resulted in new flush production coming on-line in a more favorable crude oil pricing environment with improved differentials resulting in materially higher Edmonton Par prices approximating CAD $109.70/bbl in April compared to CAD $92.12/bbl average for the first quarter.
The three (3.0 net) Pembina ERH wells drilled in the quarter came on production at the end of March and have exceeded internal expectations with average initial production (“IP”) rates per well of 275 boe/d(1) (86% light crude oil and NGLs) over their first 30 days and continue to produce at an average rate of 253 boe/d(1) (84% light crude oil and NGLs). These three wells offset five successful wells drilled in 2023 which have low decline rates and high light oil and liquids weightings contributing to our oil focused development strategy in 2024.
InPlay’s operations were impacted by an extreme cold snap in January including temperatures below -40°C for an extended period, which had not been experienced since 2004. The cold weather led to facility issues, low-rate wells freezing, a pipeline break, and an abnormally high number of producing wells going down and requiring servicing which took most of February to get back online. In aggregate, the impact to production for the quarter was approximately 340 boe/d (57% light crude oil and NGLs). In addition, non-operated downtime impacted production by approximately 115 boe/d in the quarter. Approximately half of this non-operated production has resumed and the majority of the remaining offline production is coming back online soon.
InPlay started a pilot optimization program in the quarter to lower pumps in older, low-rate horizontal oil wells to draw down pressure in the reservoir and increase inflows. The results have been positive to date with capital efficiency adds of approximately $6,000 per producing barrel. The Company has identified over 100 potential horizontal well candidates with pumps that can be lowered. The majority of future pump lowerings will occur as wells require servicing in the normal course of operations.
On behalf of our employees, management team and Board of Directors, we would like to thank our shareholders for their support and look forward to updating you on our progress throughout the year.
Reader Advisories
Non-GAAP and Other Financial Measures
Throughout this document and other materials disclosed by the Company, InPlay uses certain measures to analyze financial performance, financial position and cash flow. These non-GAAP and other financial measures do not have any standardized meaning prescribed under GAAP and therefore may not be comparable to similar measures presented by other entities. The non-GAAP and other financial measures should not be considered alternatives to, or more meaningful than, financial measures that are determined in accordance with GAAP as indicators of the Company performance. Management believes that the presentation of these non-GAAP and other financial measures provides useful information to shareholders and investors in understanding and evaluating the Company’s ongoing operating performance, and the measures provide increased transparency and the ability to better analyze InPlay’s business performance against prior periods on a comparable basis.
Non-GAAP Financial Measures and Ratios
Included in this document are references to the terms “free adjusted funds flow”, “operating income”, “operating netback per boe”, “operating income profit margin” and “Net Debt to EBITDA”. Management believes these measures and ratios are helpful supplementary measures of financial and operating performance and provide users with similar, but potentially not comparable, information that is commonly used by other oil and natural gas companies. These terms do not have any standardized meaning prescribed by GAAP and should not be considered an alternative to, or more meaningful than “profit before taxes”, “profit and comprehensive income”, “adjusted funds flow”, “capital expenditures”, “net debt”, or assets and liabilities as determined in accordance with GAAP as a measure of the Company’s performance and financial position.
Free Adjusted Funds Flow
Management considers FAFF an important measure to identify the Company’s ability to improve its financial condition through debt repayment and its ability to provide returns to shareholders. FAFF should not be considered as an alternative to or more meaningful than AFF as determined in accordance with GAAP as an indicator of the Company’s performance. FAFF is calculated by the Company as AFF less exploration and development capital expenditures and property dispositions (acquisitions) and is a measure of the cashflow remaining after capital expenditures before corporate acquisitions that can be used for additional capital activity, corporate acquisitions, repayment of debt or decommissioning expenditures or potentially return of capital to shareholders. Refer to the “Forward Looking Information and Statements” section for a calculation of forecast FAFF.
Operating Income/Operating Netback per boe/Operating Income Profit Margin
InPlay uses “operating income”, “operating netback per boe” and “operating income profit margin” as key performance indicators. Operating income is calculated by the Company as oil and natural gas sales less royalties, operating expenses and transportation expenses and is a measure of the profitability of operations before administrative, share-based compensation, financing and other non-cash items. Management considers operating income an important measure to evaluate its operational performance as it demonstrates its field level profitability. Operating income should not be considered as an alternative to or more meaningful than net income as determined in accordance with GAAP as an indicator of the Company’s performance. Operating netback per boe is calculated by the Company as operating income divided by average production for the respective period. Management considers operating netback per boe an important measure to evaluate its operational performance as it demonstrates its field level profitability per unit of production. Operating income profit margin is calculated by the Company as operating income as a percentage of oil and natural gas sales. Management considers operating income profit margin an important measure to evaluate its operational performance as it demonstrates how efficiently the Company generates field level profits from its sales revenue. Refer below for a calculation of operating income, operating netback per boe and operating income profit margin.
Net Debt to EBITDA
Management considers Net Debt to EBITDA an important measure as it is a key metric to identify the Company’s ability to fund financing expenses, net debt reductions and other obligations. EBITDA is calculated by the Company as adjusted funds flow before interest expense. When this measure is presented quarterly, EBITDA is annualized by multiplying by four. When this measure is presented on a trailing twelve month basis, EBITDA for the twelve months preceding the net debt date is used in the calculation. This measure is consistent with the EBITDA formula prescribed under the Company’s Senior Credit Facility. Net Debt to EBITDA is calculated as Net Debt divided by EBITDA. Refer to the “Forward Looking Information and Statements” section for a calculation of forecast Net Debt to EBITDA.
Capital Management Measures
Adjusted Funds Flow
Management considers adjusted funds flow to be an important measure of InPlay’s ability to generate the funds necessary to finance capital expenditures. Adjusted funds flow is a GAAP measure and is disclosed in the notes to the Company’s financial statements for the three months ended March 31, 2024. All references to adjusted funds flow throughout this document are calculated as funds flow adjusting for decommissioning expenditures. Decommissioning expenditures are adjusted from funds flow as they are incurred on a discretionary and irregular basis and are primarily incurred on previous operating assets. The Company also presents adjusted funds flow per share whereby per share amounts are calculated using weighted average shares outstanding consistent with the calculation of profit per common share.
Net Debt
Net debt is a GAAP measure and is disclosed in the notes to the Company’s financial statements for the three months ended March 31, 2024. The Company closely monitors its capital structure with the goal of maintaining a strong balance sheet to fund the future growth of the Company. The Company monitors net debt as part of its capital structure. The Company uses net debt (bank debt plus accounts payable and accrued liabilities less accounts receivables and accrued receivables, prepaid expenses and deposits and inventory) as an alternative measure of outstanding debt. Management considers net debt an important measure to assist in assessing the liquidity of the Company.
Supplementary Measures
“Average realized crude oil price” is comprised of crude oil commodity sales from production, as determined in accordance with IFRS, divided by the Company’s crude oil volumes. Average prices are before deduction of transportation costs and do not include gains and losses on financial instruments.
“Average realized NGL price” is comprised of NGL commodity sales from production, as determined in accordance with IFRS, divided by the Company’s NGL volumes. Average prices are before deduction of transportation costs and do not include gains and losses on financial instruments.
“Average realized natural gas price” is comprised of natural gas commodity sales from production, as determined in accordance with IFRS, divided by the Company’s natural gas volumes. Average prices are before deduction of transportation costs and do not include gains and losses on financial instruments.
“Average realized commodity price” is comprised of commodity sales from production, as determined in accordance with IFRS, divided by the Company’s volumes. Average prices are before deduction of transportation costs and do not include gains and losses on financial instruments.
“Adjusted funds flow per weighted average basic share” is comprised of adjusted funds flow divided by the basic weighted average common shares.
“Adjusted funds flow per weighted average diluted share” is comprised of adjusted funds flow divided by the diluted weighted average common shares.
“Adjusted funds flow per boe” is comprised of adjusted funds flow divided by total production.
Forward-Looking Information and Statements
This document contains certain forward–looking information and statements within the meaning of applicable securities laws. The use of any of the words “expect”, “anticipate”, “continue”, “estimate”, “may”, “will”, “project”, “should”, “believe”, “plans”, “intends”, “forecast” and similar expressions are intended to identify forward-looking information or statements. In particular, but without limiting the foregoing, this news release contains forward-looking information and statements pertaining to the following: the Company’s business strategy, milestones and objectives; the Company’s planned 2024 capital program including wells to be drilled and completed and the timing of the same including, without limitation, the timing of wells coming on production; 2024 guidance based on the planned capital program and all associated underlying assumptions set forth in this press release including, without limitation, forecasts of 2024 annual average production levels, adjusted funds flow, free adjusted funds flow, Net Debt/EBITDA ratio, operating income profit margin, and Management’s belief that the Company can grow some or all of these attributes and specified measures; light crude oil and NGLs weighting estimates including the expectation that the high light oil and liquids weighting will continue into 2024; expectations regarding future commodity prices; future oil and natural gas prices including the forecast that MSW differentials to WTI are forecasted to improve through 2024; future liquidity and financial capacity; future results from operations and operating metrics; future costs, expenses and royalty rates; future interest costs; the exchange rate between the $US and $Cdn; future development, exploration, acquisition, development and infrastructure activities and related capital expenditures, including our planned 2024 capital program; the amount and timing of capital projects; and methods of funding our capital program.
The internal projections, expectations, or beliefs underlying our Board approved 2024 capital budget and associated guidance are subject to change in light of, among other factors, the impact of world events including the Russia/Ukraine conflict and war in the Middle East, ongoing results, prevailing economic circumstances, volatile commodity prices, and changes in industry conditions and regulations. InPlay’s 2024 financial outlook and guidance provides shareholders with relevant information on management’s expectations for results of operations, excluding any potential acquisitions or dispositions, for such time periods based upon the key assumptions outlined herein. Readers are cautioned that events or circumstances could cause capital plans and associated results to differ materially from those predicted and InPlay’s guidance for 2024 may not be appropriate for other purposes. Accordingly, undue reliance should not be placed on same.
Forward-looking statements or information are based on a number of material factors, expectations or assumptions of InPlay which have been used to develop such statements and information but which may prove to be incorrect. Although InPlay believes that the expectations reflected in such forward-looking statements or information are reasonable, undue reliance should not be placed on forward-looking statements because InPlay can give no assurance that such expectations will prove to be correct. In addition to other factors and assumptions which may be identified herein, assumptions have been made regarding, among other things: the impact of increasing competition; the general stability of the economic and political environment in which InPlay operates; the timely receipt of any required regulatory approvals; the ability of InPlay to obtain qualified staff, equipment and services in a timely and cost efficient manner; drilling results; the ability of the operator of the projects in which InPlay has an interest in to operate the field in a safe, efficient and effective manner; the ability of InPlay to obtain debt financing on acceptable terms; the anticipated tax treatment of the monthly base dividend; the timing and amount of purchases under the Company’s NCIB; field production rates and decline rates; the ability to replace and expand oil and natural gas reserves through acquisition, development and exploration; the timing and cost of pipeline, storage and facility construction and the ability of InPlay to secure adequate product transportation; future commodity prices; that various conditions to a shareholder return strategy can be satisfied; the ongoing impact of the Russia/Ukraine conflict and war in the Middle East; currency, exchange and interest rates; regulatory framework regarding royalties, taxes and environmental matters in the jurisdictions in which InPlay operates; and the ability of InPlay to successfully market its oil and natural gas products.
Without limitation of the foregoing, readers are cautioned that the Company’s future dividend payments to shareholders of the Company, if any, and the level thereof will be subject to the discretion of the Board of Directors of InPlay. The Company’s dividend policy and funds available for the payment of dividends, if any, from time to time, is dependent upon, among other things, levels of FAFF, leverage ratios, financial requirements for the Company’s operations and execution of its growth strategy, fluctuations in commodity prices and working capital, the timing and amount of capital expenditures, credit facility availability and limitations on distributions existing thereunder, and other factors beyond the Company’s control. Further, the ability of the Company to pay dividends will be subject to applicable laws, including satisfaction of solvency tests under the Business Corporations Act (Alberta), and satisfaction of certain applicable contractual restrictions contained in the agreements governing the Company’s outstanding indebtedness.
The forward-looking information and statements included herein are not guarantees of future performance and should not be unduly relied upon. Such information and statements, including the assumptions made in respect thereof, involve known and unknown risks, uncertainties and other factors that may cause actual results or events to defer materially from those anticipated in such forward-looking information or statements including, without limitation: the continuing impact of the Russia/Ukraine conflict and war in the Middle East; inflation and the risk of a global recession; changes in our planned 2024 capital program; changes in our approach to shareholder returns; changes in commodity prices and other assumptions outlined herein; the risk that dividend payments may be reduced, suspended or cancelled; the potential for variation in the quality of the reservoirs in which we operate; changes in the demand for or supply of our products; unanticipated operating results or production declines; changes in tax or environmental laws, royalty rates or other regulatory matters; changes in development plans or strategies of InPlay or by third party operators of our properties; changes in our credit structure, increased debt levels or debt service requirements; inaccurate estimation of our light crude oil and natural gas reserve and resource volumes; limited, unfavorable or a lack of access to capital markets; increased costs; a lack of adequate insurance coverage; the impact of competitors; and certain other risks detailed from time-to-time in InPlay’s continuous disclosure documents filed on SEDAR including our Annual Information Form and our MD&A.
This press release contains future-oriented financial information and financial outlook information (collectively, “FOFI”) about InPlay’s financial and leverage targets and objectives, potential dividends, share buybacks and beliefs underlying our Board approved 2024 capital budget and associated guidance, all of which are subject to the same assumptions, risk factors, limitations, and qualifications as set forth in the above paragraphs. The actual results of operations of InPlay and the resulting financial results will likely vary from the amounts set forth in this press release and such variation may be material. InPlay and its management believe that the FOFI has been prepared on a reasonable basis, reflecting management’s reasonable estimates and judgments. However, because this information is subjective and subject to numerous risks, it should not be relied on as necessarily indicative of future results. Except as required by applicable securities laws, InPlay undertakes no obligation to update such FOFI. FOFI contained in this press release was made as of the date of this press release and was provided for the purpose of providing further information about InPlay’s anticipated future business operations and strategy. Readers are cautioned that the FOFI contained in this press release should not be used for purposes other than for which it is disclosed herein.
The forward-looking information and statements contained in this news release speak only as of the date hereof and InPlay does not assume any obligation to publicly update or revise any of the included forward-looking statements or information, whether as a result of new information, future events or otherwise, except as may be required by applicable securities laws.
Risk Factors to FLI
Risk factors that could materially impact successful execution and actual results of the Company’s 2024 capital program and associated guidance and estimates include:
volatility of petroleum and natural gas prices and inherent difficulty in the accuracy of predictions related thereto;
the extent of any unfavourable impacts of wildfires in the province of Alberta.
changes in Federal and Provincial regulations;
the Company’s ability to secure financing for the Board approved 2024 capital program and longer-term capital plans sourced from AFF, bank or other debt instruments, asset sales, equity issuance, infrastructure financing or some combination thereof; and
those additional risk factors set forth in the Company’s MD&A and most recent Annual Information Form filed on SEDAR
Key Budget and Underlying Material Assumptions to FLI
The Company’s 2024 guidance remains the same as previously released January 29, 2024 except as noted below. The key budget and underlying material assumptions used by the Company in the development of its 2024 guidance are as follows:
CALGARY, AB, May 1, 2024 /CNW/ – InPlay Oil Corp. (TSX: IPO) (OTCQX: IPOOF) (“InPlay” or the “Company”) is pleased to confirm that its Board of Directors has declared a monthly cash dividend of $0.015 per common share payable on May 31, 2024, to shareholders of record at the close of business on May 15, 2024. The monthly cash dividend is expected to be designated as an “eligible dividend” for Canadian federal and provincial income tax purposes.
About InPlay Oil Corp.
InPlay is a junior oil and gas exploration and production company with operations in Alberta focused on light oil production. The company operates long-lived, low-decline properties with drilling development and enhanced oil recovery potential as well as undeveloped lands with exploration possibilities. The common shares of InPlay trade on the Toronto Stock Exchange under the symbol IPO and the OTCQX Exchange under the symbol IPOOF. For further information: Please contact: Doug Bartole, President and Chief Executive Officer, InPlay Oil Corp., Telephone: (587) 955-0632, www.inplayoil.com; Darren Dittmer, Chief Financial Officer, InPlay Oil Corp., Telephone: (587) 955-0634
InPlay Oil is a junior oil and gas exploration and production company with operations in Alberta focused on light oil production. The company operates long-lived, low-decline properties with drilling development and enhanced oil recovery potential as well as undeveloped lands with exploration possibilities. The common shares of InPlay trade on the Toronto Stock Exchange under the symbol IPO and the OTCQX Exchange under the symbol IPOOF.
Michael Heim, Senior Vice President, Equity Research Analyst, Energy & Transportation, Noble Capital Markets, Inc.
Refer to the full report for the price target, fundamental analysis, and rating.
Quarterly production in line with recently reduced guidance. InPlay reported 2023 production volume of 9,025 boe/day consistent with guidance of 9,000-9,100 boe/day. We had expressed concern that the previous decline in guidance reflected a sharper production decline curve than previously expected. Management assures that the decline curve has not changed and the decline reflects a shift towards drilling oil wells which have a lower initial production rate than gas wells.
InPlay released a reserve report for the 2023 year end. The reserve report shows a modest reduction in reserves and reserve value implying a reserve replacement rate slightly below 1.0 times. The calculation is somewhat complicated by changing assumptions regarding assumed energy pricing and recoverability. The report indicated a finding, development and acquisition cost of $23.36/boe which is attractive compared to current prices.
Equity Research is available at no cost to Registered users of Channelchek. Not a Member? Click ‘Join’ to join the Channelchek Community. There is no cost to register, and we never collect credit card information.
This Company Sponsored Research is provided by Noble Capital Markets, Inc., a FINRA and S.E.C. registered broker-dealer (B/D).
*Analyst certification and important disclosures included in the full report. NOTE: investment decisions should not be based upon the content of this research summary. Proper due diligence is required before making any investment decision.


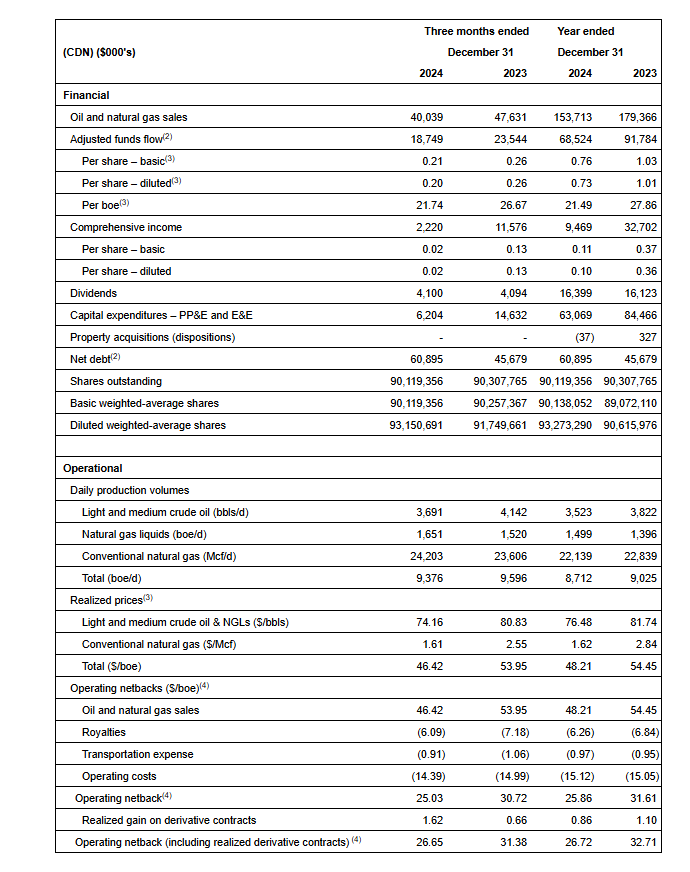
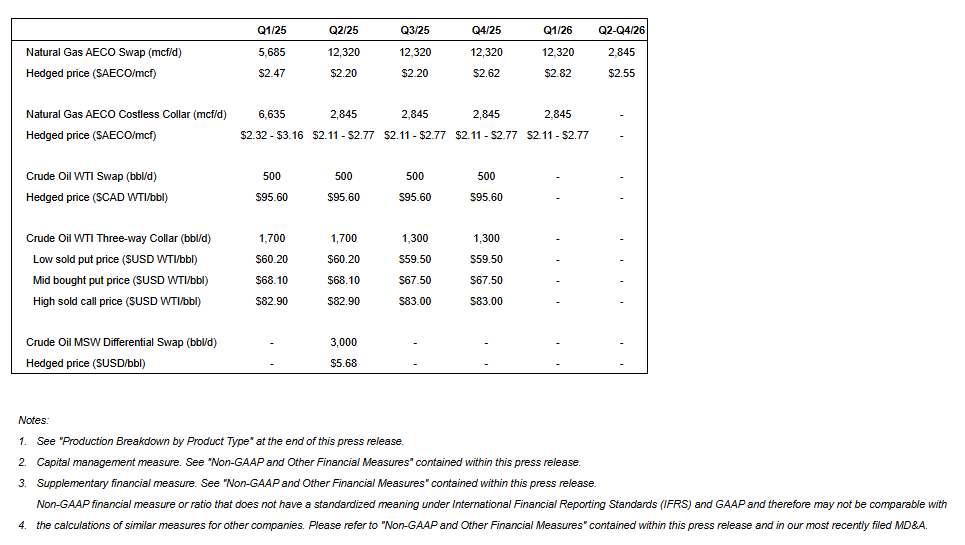
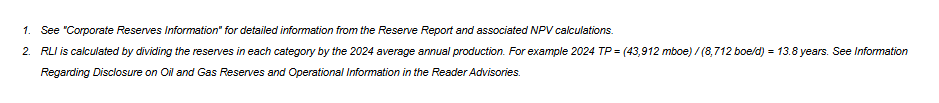
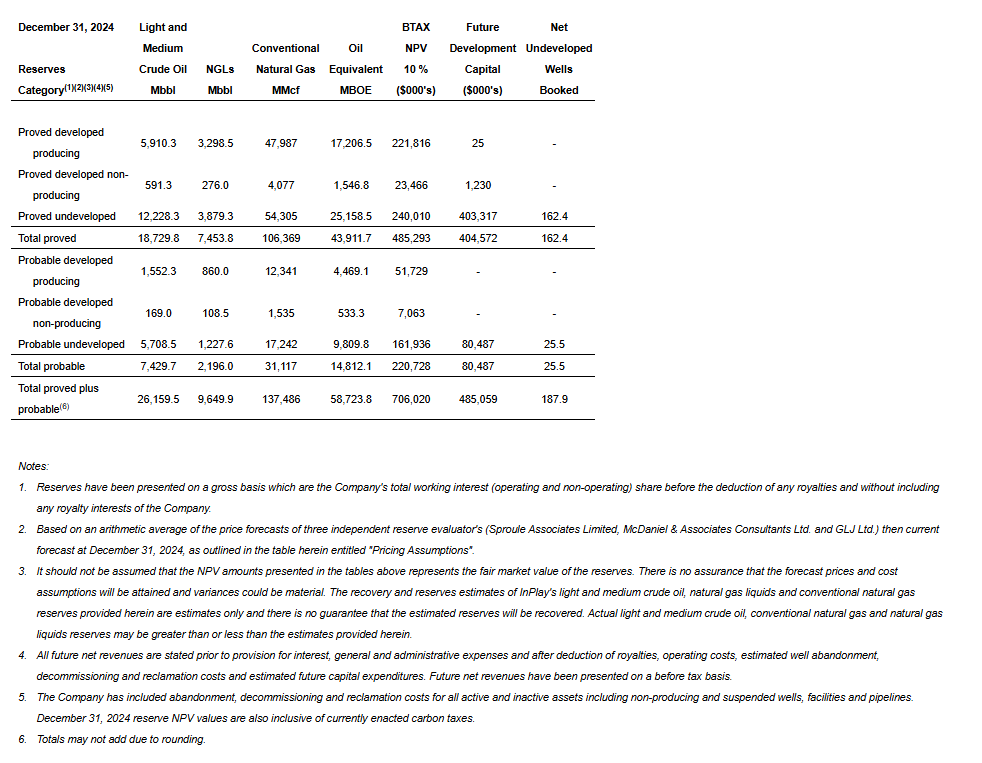
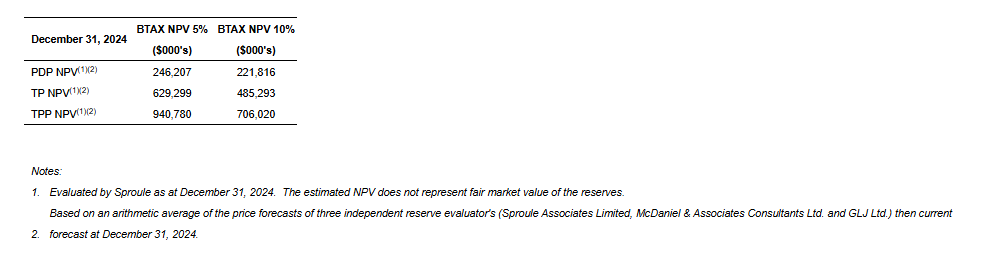
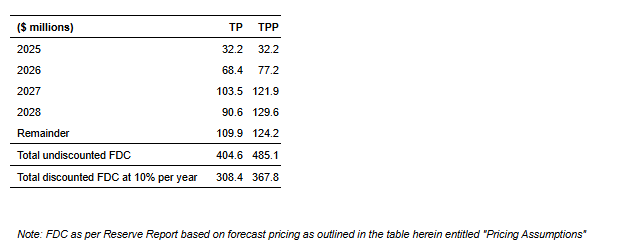
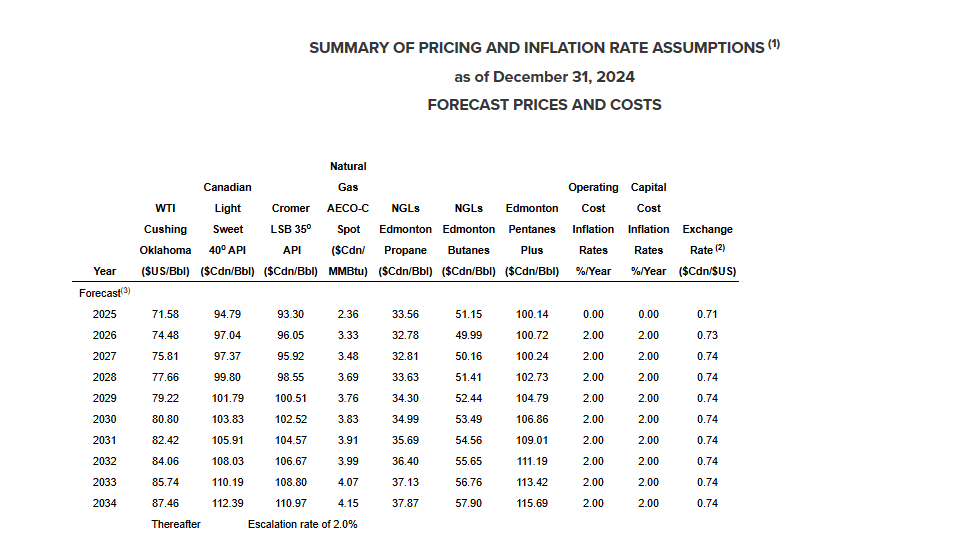

")