Today’s news brings the release of the August data for the Personal Consumption Expenditures (PCE) Index by the U.S. Bureau of Economic Analysis. This report, a crucial indicator of inflation and consumer spending in the United States, has set a positive tone for financial markets as they rally in early trading.
In August, the PCE Index recorded a year-over-year growth rate of 3.5%, showing a modest increase from the previous month’s 3.4%. On a monthly basis, the core PCE, the Federal Reserve’s preferred measure of inflation, inched up by 0.1%, slightly lower than the 0.2% increase in July.
The Federal Reserve has long regarded the core PCE as its favored measure of inflation. While the August PCE report has provided insight into inflation trends, it’s important to note that the Fed made a decision to keep interest rates steady earlier this week. Federal Reserve Chair Jerome Powell consistently references the core PCE figures when assessing inflation. Powell has emphasized that inflation remains above the Fed’s 2% target, which has informed the central bank’s recent decision to maintain interest rates within a range of 5.25%-5.50%. This decision underscores the Fed’s cautious approach to managing inflation while fostering economic growth.
Historically, PCE reports have played a significant role in guiding monetary policy and influencing market dynamics. When inflationary pressures rise, the Fed may respond by raising interest rates to curb price increases. Conversely, when PCE growth moderates, the central bank may opt for rate cuts to stimulate economic activity.
While the report suggests a slower pace of inflation growth in August compared to July, inflation remains a pertinent issue. Investors will closely monitor subsequent reports and Federal Reserve actions to gain insight into the trajectory of inflation and its potential impact on financial markets and the broader economy. The early market rally reflects the market’s optimism following the release of the latest PCE data, as it continues to navigate the evolving economic landscape.
Mortgage rates crossed the 7% threshold this past week, as the 30-year fixed rate hit 7.31% according to Freddie Mac data. This marks the highest level for mortgage rates since late 2000.
The implications extend far beyond the housing market alone. The sharp rise in rates stands to impact the stock market, economic growth, and investor sentiment through various channels.
For stock investors, higher mortgage rates pose risks of slower economic growth and falling profits for rate-sensitive sectors. Housing is a major component of GDP, so a pullback in home sales and construction activity would diminish economic output.
Slower home sales also mean less revenue for homebuilders, real estate brokers, mortgage lenders, and home furnishing retailers. With housing accounting for 15-18% of economic activity, associated industries make up a sizable chunk of the stock market.
A housing slowdown would likely hit sectors such as homebuilders, building materials, home improvement retailers, and home furnishing companies the hardest. Financial stocks could also face challenges as mortgage origination and refinancing drop off.
Broader economic weakness resulting from reduced consumer spending power would likely spillover to impact earnings across a wide swath of companies and market sectors. Investors may rotate to more defensive stocks if growth concerns escalate.
Higher rates also signal tightening financial conditions, which historically leads to increased stock market volatility and investor unease. Between inflation cutting into incomes and higher debt servicing costs, consumers have less discretionary income to sustain spending.
Reduced consumer spending has a knock-on effect of slowing economic growth. If rate hikes intended to fight inflation go too far, it raises the specter of an economic contraction or recession down the line.
For bond investors, rising rates eat into prices of existing fixed income securities. Bonds become less attractive compared to newly issued debt paying higher yields. Investors may need to explore options like floating rate bonds and shorter duration to mitigate rate impacts.
Rate-sensitive assets that did well in recent years as rates fell may come under pressure. Real estate, utilities, long-duration bonds, and growth stocks with high valuations are more negatively affected by rising rate environments.
Meanwhile, cash becomes comparatively more attractive as yields on savings accounts and money market funds tick higher. Investors may turn to cash while awaiting clarity on inflation and rates.
The Fed has emphasized its commitment to bringing inflation down even as growth takes a hit. That points to further rate hikes ahead, meaning mortgage rates likely have room to climb higher still.
Whether the Fed can orchestrate a soft landing remains to be seen. But until rate hikes moderate, investors should brace for market volatility and economic uncertainty.
Rising mortgage rates provide yet another reason for investors to ensure their portfolios are properly diversified. Maintaining some allocation to defensive stocks and income plays can help smooth out risk during periods of higher volatility.
While outlooks call for slower growth, staying invested with a long-term perspective is typically better than market timing. Patience and prudent risk management will be virtues for investors in navigating markets in the year ahead.
Pain at the pump has made an unwelcome return, with gas prices rapidly rising across the United States. The national average recently climbed to $3.88 per gallon, while some states now face prices approaching or exceeding $6 per gallon.
In California, gas prices have spiked to $5.79 on average, up 31 cents in just the past week. It’s even worse in metro Los Angeles where prices hit $6.07, a 49 cent weekly jump. Besides California, drivers in 11 states now face average gas prices of $4 or more.
This resurgence complicates the Federal Reserve’s fight against high inflation. Oil prices are the key driver of retail gas costs. With oil climbing back to $90 per barrel, pushed up by supply cuts abroad, gas prices have followed.
West Texas Intermediate crude rose to $93.74 on Tuesday, its highest level in 10 months, before retreating below $91 on Wednesday. The international benchmark Brent crude hit highs above $96 per barrel. Goldman Sachs warned Brent could reach $107 if OPEC+ nations don’t unwind production cuts.
For consumers, higher gas prices add costs and sap purchasing power, especially for lower-income families. Drivers once again face pain filling up their tanks. Households paid an average of $445 a month on gas during the June peak when prices topped $5 a gallon. That figure dropped to $400 in September but is rising again.
Politically, high gas also causes headaches for the Biden administration. Midterm voters tend to blame whoever occupies the White House for pain at the pump, whether justified or not. President Biden has few tools to immediately lower prices set by global markets.
However, economists say oil and gas prices must rise significantly further to seriously jeopardize the U.S. economy. Past recessions only followed massive oil price spikes of at least 100% within a year. Oil would need to double from current levels, to around $140 per barrel, to inevitably tip the economy into recession, according to analysis.
Nonetheless, the energy resurgence does present challenges for the Fed’s inflation fight. While core inflation has cooled lately, headline inflation has rebounded in part due to pricier gas. Consumer prices rose 0.1% in August, defying expectations of a drop, largely because of rising shelter and energy costs.
This complicates the Fed’s mission to cool inflation through interest rate hikes. Some economists believe the energy volatility will lead the Fed to pencil in an additional quarter-point rate hike this year to around 4.5%. However, a dramatic policy response is unlikely with oil still below $100 per barrel.
In fact, some argue the energy spike may even inadvertently help the Fed. By sapping consumer spending power, high gas prices could dampen demand and ease price pressures. If energy costs siphon purchases away from discretionary goods and services, it may allow inflation to fall without more aggressive Fed action.
Morgan Stanley analysis found past energy price shocks had a “small” impact on core inflation but took a “sizable bite out of” consumer spending. While bad for growth, this demand destruction could give the Fed space to cool inflation without triggering serious economic damage.
For now, energy volatility muddies the inflation outlook and complicates the Fed’s delicate task of engineering a soft landing. Gas prices swinging upward once again present both economic and political challenges. But unless oil spikes drastically higher, the energy complex likely won’t force the Fed’s hand. The central bank will keep rates elevated as long as underlying inflation remains stubbornly high.
The U.S. national debt surpassed $33 trillion for the first time ever this week, hitting $33.04 trillion according to the Treasury Department. This staggering sum exceeds the size of the entire U.S. economy and equals about $100,000 per citizen.
For investors, the ballooning national debt raises concerns about future tax hikes, inflation, and government spending cuts that could impact markets. While the debt level itself may seem abstract, its trajectory has real implications for portfolios.
Over 50% of the current national debt has accumulated since 2019. Massive pandemic stimulus programs, tax cuts, and a steep drop in tax revenues all blew up the deficit during Covid-19. Interest costs on the debt are also piling up.
Some level of deficit spending was needed to combat the economic crisis. But years of expanding deficits have brought total debt to the highest level since World War II as a share of GDP.
With debt now exceeding the size of the economy, there is greater risk of reduced economic output from crowd-out effects. High debt levels historically hamper GDP growth.
Economists worry that high debt will drive up borrowing costs for consumers and businesses as the government competes for limited capital. The Congressional Budget Office projects interest costs will soon become the largest government expenditure as rates rise.
Higher interest rates will consume more tax revenue just to pay interest, leaving less funding available for programs and services. Taxes may have to be raised to cover these costs.
Rising interest costs will also put more pressure on the Federal Reserve to keep rates low and monetize the debt through quantitative easing. This could further feed inflation.
If interest costs spiral, government debt could eventually reach unsustainable levels and require restructuring. But well before that, the debt overhang will influence policy and markets.
As debt concerns mount, investors may rotate to inflation hedges like gold and real estate. The likelihood of higher corporate and individual taxes could hit equity valuations and consumer spending.
But government spending cuts to social programs and defense would also ripple through the economy. Leaner budgets would provide fiscal headwinds reducing growth.
With debt limiting stimulus options, creative monetary policy would be needed in the next recession. More radical measures by the Fed could introduce volatility.
While the debt trajectory is troubling, a crisis is not imminent. Still, prudent investors should account for fiscal risks in their portfolio positioning and outlook. The ballooning national debt will shape policy and markets for years to come.
The Federal Reserve is stuck between a rock and a hard place as it aims to curb high inflation without inflicting too much damage on economic growth. This precarious balancing act has major implications for both average citizens struggling with rising prices and investors concerned about asset values.
For regular households, the current bout of high inflation straining budgets is public enemy number one. Prices are rising at 8.3% annually, squeezing wages that can’t keep pace. Everything from groceries to rent to healthcare is becoming less affordable. Meanwhile, rapid Fed rate hikes intended to tame inflation could go too far and tip the economy into recession, slowing the job market and risking higher unemployment.
However, new economic research suggests the Fed also needs to be cognizant of rate hikes’ impact on the supply side of the economy. Supply chain bottlenecks and constrained production have been key drivers of this inflationary episode. Aggressive Fed action that suddenly squelches demand could backfire by inhibiting business investment, innovation, and productivity growth necessary to expand supply capacity.
For example, sharply higher interest rates make financing more expensive, deterring business investment in new factories, equipment, and technologies. Tighter financial conditions also restrict lending to startups and venture capital for emerging technologies. All of this could restrict supply, keeping prices stubbornly high even in a weak economy.
This means the Fed has to walk a tightrope, moderating demand enough to curb inflation but not so much that supply takes a hit. The goal is to lower costs without forcing harsh rationing of demand through high unemployment. A delicate balance is required.
For investors, rapidly rising interest rates have already damaged asset prices, bringing an end to the long-running stock market boom. Higher rates make safe assets like bonds more appealing versus risky bets like stocks. And expectations for Fed hikes ahead impact share prices and other securities.
But stock markets could stabilize if the Fed manages to engineering the elusive “soft landing” – bringing down inflation while avoiding recession. The key is whether moderating demand while supporting supply expansion provides stable growth. However, uncertainty remains high on whether the Fed’s policies will thread this narrow needle.
Overall, the Fed’s inflation fight has immense stakes for Americans’ economic security and investors’ asset values. Walking the tightrope between high inflation and very slow growth won’t be easy. Aggressive action risks supply problems and recession, but moving too slowly could allow inflation to become entrenched. It’s a delicate dance with high stakes riding on success.
The Consumer Price Index (CPI) increased 0.6% in August on a seasonally adjusted basis, quickening from the 0.2% rise seen in July, according to the Bureau of Labor Statistics’ latest report. Over the past 12 months through August, headline CPI inflation stands at 3.7% before seasonal adjustment, up from 3.2% for the 12-month period ending in July.
The August monthly gain was primarily driven by a spike of 10.6% in the gasoline index. Gasoline was coming off a tamer 0.2% increase in July. Food prices also contributed to inflationary pressures, with the food at home index edging up 0.2% again last month. The food away from home index rose 0.3%.
Meanwhile, the energy index excluding gasoline picked up as well. Natural gas costs ticked up 0.1%, electricity prices rose 0.2%, and fuel oil prices surged 9.1%.
The core CPI, which removes volatile food and energy categories, rose 0.3% in August after a 0.2% gain in July. The shelter index has been a main driver of core inflation. It covers rental costs and owners’ equivalent rent, both of which have rapidly increased due to imbalances between housing supply and demand.
On an annual basis, the energy index has fallen 3.6%, as gasoline, natural gas and fuel oil costs are down over the past 12 months. However, the food and core indexes are up 4.3% and 4.3% year-over-year, respectively.
Within the core CPI, the main drivers have been shelter costs, up 7.3% over the last 12 months, along with auto insurance (+19.1%), recreation services (+3.5%), personal care (+5.8%) and new vehicles (+2.9%). Medical care services inflation has also accelerated to 6.6% over the past year.
Geographically, inflation varies significantly by region. The Northeast has seen 4.2% CPI inflation over the past year, the Midwest 3.9%, the South 3.7%, and the West just 2.9%. By city size, larger metropolitan areas over 1.5 million people have experienced 3.8% inflation, compared to 3.6% for mid-sized cities and 3.7% in smaller cities.
August’s monthly data shows inflation quickened after signs of cooling in July. While gasoline futures retreated in September, shelter inflation remains stubbornly high with no meaningful relief expected until mortgage rates decline substantially.
With core inflation running well above the Fed’s 2% target, further interest rate hikes are anticipated to combat still-high inflation. But the path to a soft economic landing appears increasingly narrow amid recession risks.
The next CPI update will be released in mid-October, shedding light on whether persistent pricing pressures are continuing to squeeze household budgets. For now, the August report shows inflation picking up steam after the prior month’s encouraging data.
Yet the larger concern remains the entrenched inflation in essentials like food, rent and medical care. Shelter inflation in particular has shown little sign of abating, as rental rates and housing prices remain disconnected from incomes.
Mortgage rates have soared above 6% in 2023 after starting the year around 3%. The sharp rise in financing costs continues to shut many homebuyers out of the market. Until mortgage rates meaningfully decline, shelter inflation is likely to persist.
And that will be challenging as long as the Fed keeps interest rates elevated. Monetary policy has lagged in responding to inflation, putting central bankers in catch-up mode. Further rate hikes are expected in the coming months absent a significant cooling in pricing pressures.
But the risks of the Fed overtightening and spurring a recession continue to intensify. The path to a soft landing for the economy is looking increasingly precarious.
For consumers, it means further inflationary pain is likely in store before a sustained moderation emerges. Budgets will remain pressured by pricier essentials, leaving less room for discretionary purchases.
While the monthly data will remain volatile, the overall trend points to stubborn inflation persisting through year-end. The Fed will be closely watching to see if their actions to date have slowed price gains enough. If not, consumers should prepare for more rate hikes and resulting economic uncertainty into 2024.
New applications for U.S. unemployment benefits fell unexpectedly last week to the lowest level since mid-February, signaling the job market remains tight even as broader economic headwinds build.
Initial jobless claims declined by 13,000 to 216,000 in the week ended September 2, the Labor Department reported Thursday. That was below economist forecasts for a rise to 234,000 and marked the fourth straight week of declines.
Continuing claims, which track ongoing unemployment, also dropped to 1.679 million for the week ended August 26. That was the lowest point since mid-July.
The downward trend in both initial and continuing claims points to ongoing resilience in the labor market amid strong employer demand for workers.
There are some emerging signs of softness, however. The unemployment rate ticked higher to 3.8% in August as labor force participation increased. Job growth also moderated in the latest month, though remains healthy.
Worker productivity rebounded at a 3.5% annualized pace in the second quarter, the fastest rise since 2020. Moderating labor cost growth could also help the Federal Reserve combat high inflation.
While jobless claims remain near historic lows, economists will keep a close eye on any notable changes that could indicate potential layoffs, although the Federal Reserve has recently taken a more measured approach to rate hikes aimed at moderating economic demand.
Currently, the most recent data confirms a remarkably robust job market, despite concerns about inflation and slowing growth. This resilience provides hope that any potential economic downturn in the future might be less severe than previously anticipated.
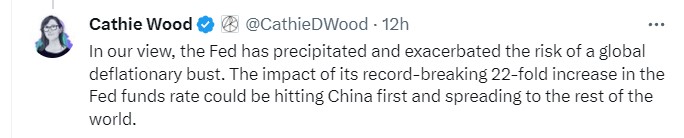
Ark Invest Warns of a Deflationary Ripple that Could Spread Around the Globe
Pricing, whether it be of the stock market, private placements, or other alternative investments is impacted by investor demand, and demand is the result of differing views. Cathie Wood, the Ark Investment Management CEO, has held the view that the U.S. and global economies are close to a deflationary spiral. She pointed to more evidence this week, and sounded the alarm for the potential dire consequences of the Federal Reserve’s ongoing rate tightening measures. According to Wood, deflation tied to China and actions by the U.S. central bank could set off a chain reaction of deflation-induced economic slowdowns, not just within the United States but across international markets.
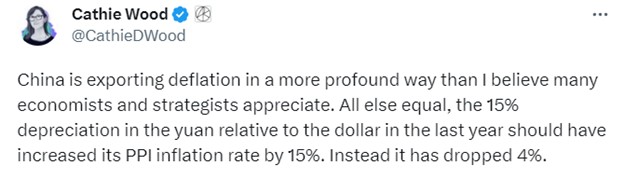
Ms. Wood, the 67-year-old market veteran, who falls in the category of celebrity investor, has many fans and followers. She shared her concerns in a string of posts on X, the platform formerly known as Twitter. Wood stated, “China is exporting deflation in a more profound way than I believe many economists and strategists appreciate.”
She explained that producer prices in China, the world’s second largest economy, were impacted by the U.S. dollar strengthening by 15% against the Chinese yuan, despite the devaluation adding around 15% to Chinese PPI, the Chinese reported a decline in the PPI inflation measure by 4%.
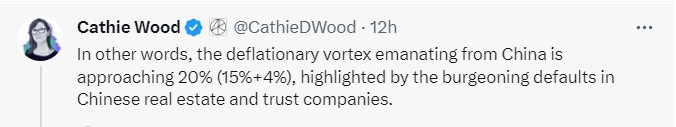
Wood expressed China is exporting deflation. She posted that, under normal circumstances, the 15% depreciation of the yuan against the dollar in 2022 should have led to a 15% increase in China’s annual producer inflation rate. Since it instead dropped 4%, In her math, this is creating near a 20% downdraft on prices of Chinese goods.
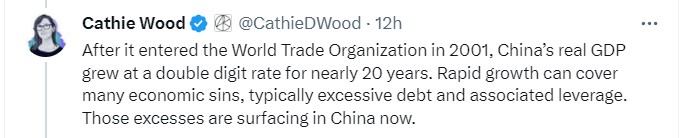
Turning her focus to China’s economic trajectory, Wood recounted the country’s impressive growth following its entry into the World Trade Organization in 2001. Over nearly two decades, China’s real GDP experienced a sustained double-digit expansion. However, Wood pointed out that rapid growth often conceals underlying economic vulnerabilities, including excessive debt and leverage. Her firm believes these vulnerabilities are now creating cracks in China’s economy.
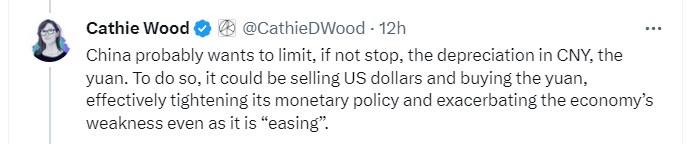
Wood suggested that China might attempt to halt the depreciation of the yuan. However, this would necessitate selling off U.S. dollars and acquiring yuan, which, in turn, tightens monetary policy and fuels the economy’s fragility, even amid efforts to stimulate it.
Ark Invest’s CEO posted, “The Fed has precipitated and exacerbated the risk of a global deflationary bust.” Drawing attention to the central bank’s remarkable 22-fold increase in the Fed funds rate, Wood warned that the repercussions of this move would first impact China and subsequently ripple through the rest of the world.
Recent economic data from China underscores the challenges it currently faces. Second-quarter GDP growth came in at 6.3%, falling short of the 7.3% projection by economists. Furthermore, new bank loans for July plummeted by 89% month-over-month, marking the lowest level since 2009, according to data from the People’s Bank of China.
The deflationary trend is evident in inflation figures as well. July inflation data showed both consumer and producer price inflation rates in negative territory.
Adding to the concerns, a trio of data released from the China National Bureau of Statistics revealed lackluster performance. Retail sales rose by a modest 2.5% year-over-year in July, well below the anticipated 4.5% increase. Industrial Production also lagged, with a 3.7% rise compared to the consensus estimate of 4.4%. Moreover, fixed asset investment figures raised further questions about the country’s economic health.
Take Away
There are certainly competing inflation forecasts opposing those coming out of Cathie Wood’s firm. However, her warnings do serve as a reminder, from a veteran in the asset management business, of the interconnectedness of global economies and the potential ramifications of central bank policy decisions. As markets continue to navigate the crosscurrents, attention remains on policymakers and economic indicators for signs of any change in trends.
It Seems Likely that Grandma and Grandpa are Getting a Much Smaller Raise Next Year
In 2023, Social Security recipients received the highest COLA in more than 40 years, 8.7%. At the same time, the entire U.S., including those retired, was impacted by the highest annual inflation in over 40 years. The result is the increased pay impacted recipients differently. Those with a higher percentage of variable costs or expenses, especially where inflation was worst, such as rent, travel, or fuel did not benefit as much, if at all. Those with a greater percentage of fixed costs may have found themselves with more money at the end of each month.
Consumers in the U.S., including Social Security recipients, have not had their purchasing power eroded as much during the first seven months of 2023, as they experienced in 2022. Social Security cost of living adjustments (COLA) are based on a formula that will cause the increase paid next year to rise almost by a third of what it rose at the beginning of 2023.
While not yet official, the new forecast comes after the release of July’s Consumer Price Index (CPI), and is largely based on little change over the next 45 days.
How is a COLA Calculated?
Ignore for a moment the inflation rate percentages you see in the news headlines. The 12-month CPI is calculated by using the set cost of a basket of goods during the month, divided into the cost of the same basket a year earlier. SSA COLA is calculated by the average price of the basket July, August, and September, and dividing it by the average of these months a year earlier. The CPI used in this case is not the CPI-U (all urban consumers) typically reported in the news, but instead, CPI-W (Urban Wage Earners and Clerical Workers). CPI-W is calculated on a monthly basis by the Bureau of Labor Statistics. The most recent release was August 10, 2023.
COLA increases are rounded to the nearest tenth. The adjusted benefit payments are effective as of the first month of the new year.
What to Expect
Social Security recipients could see a 3% bump up next year, based on July’s CPI data, and the current stagnation in the level of inflation. A 3% COLA would raise an average monthly benefit of $1,789 by $53.70 and the maximum benefit by $136.65 per month.
Retired Americans who find Social Security a nice addition to 401(k) or 403(B) investment returns or ample pensions may find themselves with a few extra dollars to take road trips or treat themselves to dining out, or gifts for grandchildren. But investors looking for industries that may benefit from the fatter checks older Americans will receive may find that there is little difference in spending for the majority.
In its recent survey of retirees, the Senior Citizens League found that more than 66% of those that completed its survey have postponed dental care, including major services such as bridges, dentures, and implants. Another 43% said they have delayed optical exams or getting prescription eyeglasses. Almost one-third of survey participants said they have postponed getting medical care or filling prescriptions due to deductibles, out-of-pocket costs, and unexpected bills.
Persistent high prices aren’t the only challenge. Findings from the survey suggest more than one in five Social Security beneficiaries (23%) report they paid tax on a portion of their benefits for the first time this past tax season.
Take Away
When economic numbers are released, they are of interest to a expansive variety of economic stakeholders. This includes investors determining how new statistics will impact corporate earnings, economists deciding how it could impact the Fed’s next move, equity analysts reviewing their industry and companies in the sector, the young couple looking to furnish a new home, and those past their working years that are in general more vulnerable.
The CPI number from July and those that will be reported for August and September will have a noticeable impact on the high percentage of elderly in the U.S. come January 2024.
The Surprisingly High Economic Growth Numbers Aren’t Spooking Investors
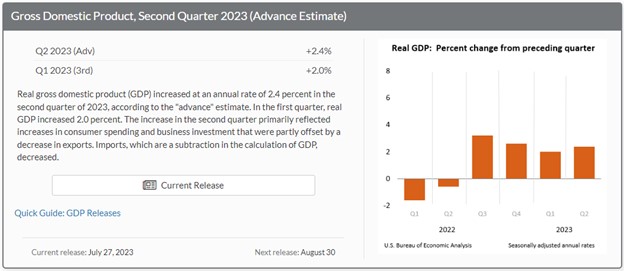
Gross Domestic Product, or GDP, is one of the best measures of U.S. economic health. The second quarter GDP report as well as the first quarter upward revision, fully support the idea that the economy is growing above expectations and that the Fed’s rate hike in July was justified. This places equity investors in the position they have become very familiar with, wondering if they should be bullish on stocks as the economy rolls on, or should they be bearish as the Fed’s reaction could cause a period of negative growth (recession). Seeing how the Dow is on a winning streak of a dozen days in a row, even as the Fed resumed tightening, it may be that the forward-looking stock market has turned the corner and is now taking good news as good news, and bad news as bad, once again.
Source: Bureau of Economic Analysis (BEA)
GDP was much stronger than expected – economists surveyed by FactSet were expecting a 1.5% gain. This was the first data release since the July FOMC meeting; it will however be followed on Friday by two other key indicators. The U.S. economy grew at a 2.4% annual rate in the second quarter (first estimate of GDP). This is significantly better than economists’ projections and makes abundantly clear that through last quarter, the economy was far from contracting or recessionary.
Contributors to the better-than-expected growth are increases in consumer spending, nonresidential fixed investment, state and local government spending, private inventory investment, and federal government spending, according to the BEA. Non-manufacturing contributors (services) included housing and utilities, health care, financial services and insurance, and transportation services. The contribution to goods spending was led by recreational goods and vehicles as well as gasoline and other energy goods.
Other Market-Moving Releases
The GDP report was the first piece of economic data following the Federal Reserve’s meeting on Tuesday and Wednesday; this concluded with a quarter-point increase in the central bank’s target for the fed-funds rate. That now leaves the Fed’s benchmark rate at a range of 5.25% to 5.5%.
Jobs and the tight employment market, where there are currently more jobs available than workers looking for employment, should still be a big focus of monetary policymakers. On Friday July 28, the employment cost index (ECI) is expected to show that the hourly labor cost to employers in the second quarter grew at a 4.8% annual rate, and by 1.1% quarter to quarter, according to the consensus estimate by FactSet. That’s little changed from the first quarter, when compensation costs for civilian workers increased by 4.8% annually and at a 1.2% rate quarter over quarter, according to the Bureau of Labor Statistics. Labor tightness and wage inflation are both concerning for the Fed and provide evidence that a more restrictive policy is needed.
Investors should look for ECI to provide some insight into how sticky service inflation is right now. This is of high importance because, within the service sector, wages tend to be the highest input cost. If the number comes in higher than expected, that could be a worrisome sign of continued stubborn inflation, which then indicates the need for additional rate hikes.
At the same time the ECI report is released on Friday, the PCE data is released. While the market’s tendency over the months has been to hyperfocus on the “Fed’s favorite inflation measure,” PCE may take a back seat in terms of significance to ECI data.
Take Away
Inflation rates coming down while the economy grows is, if inflation declines enough, a soft economic landing. The stock market, which had been reacting negatively to strong economic news, is beginning to show signs that it expects a soft landing – while this lasts, the markets could continue their winning streak.
Why Economic Data Doesn’t Reconcile With Personal Experience
Does grocery shopping and eating out cost the same as it did in 2019? Government statistics on personal consumption and expenditures would seem to indicate they do. Most of us know that we are paying noticeably more to eat than we did a few years ago. Below is an article explaining the flaws in government data and the nuances that hide actual experience from this set of numbers. It is written by Dr. Jonathan Newman, he is a Fellow at the Mises Institute, his research focuses on inflation and business cycles, and the history of economic thought. – Paul Hoffman, Managing Editor, Channelchek.
Economist Jeremy Horpedahl dismissed the silly claim by anticapitalists that capitalism must engineer food scarcity for the sake of profits. He presented a graph of Bureau of Labor Statistics (BLS) data demonstrating a substantial decrease in household food expenditure as a percentage of income—from 44 percent in 1901 to a mere 9 percent in 2021. This is something to celebrate and certainly can be attributed to the abundance of market economies.
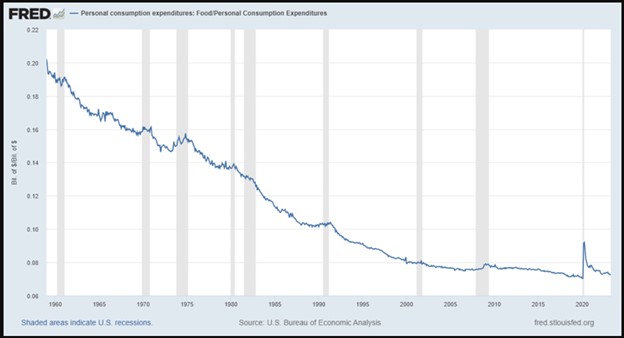
But when Jordan Peterson asked, “And what’s happened the last two years?” I went digging. First, I confirmed Horpedahl’s observation: the amount we spend on food as a proportion of our budget has fallen dramatically. Second, I saw what Peterson hinted at: a significant spike in food spending when covid and the associated mess of government interventions hit (figure 1).
Figure 1: Food and personal consumption expenditures, 1959–2023
Source: US Bureau of Economic Analysis, FRED.
Interestingly, the spike looks like a blip. Someone oblivious to the events of the past few years might see this chart and say, “Yeah, something strange happened in 2020, but it looks like everything is back to normal.” I’m certain that this doesn’t align with anyone’s experience, however. Even today, no one would say that restaurant visits and grocery store trips cost the same as they did in 2019.
What changed in 2020? Why does this graph not feel right? Assuming the Bureau of Economic Analysis data isn’t totally off (and it is important to be skeptical of government data), why would a January 2023 report on consumer inflation sentiment conclude that “there is a disconnect between the inflation data reported by the government and what consumers say they now pay for necessities”?
The difference lies in the qualitative aspects of our experience as consumers. Spending proportions may have returned to their trend, but that isn’t the whole story. “Shrinkflation” and “skimpflation” have taken their toll on the quantity and quality of the food we enjoy—or maybe the food we tolerate is more apt.
Businesses know that charging higher prices is unpopular, especially when many consumers are convinced that greed is driving price inflation. So businesses resort to reducing the amount of food in the package, diluting the product but keeping the same amount, or otherwise cutting corners in ways that consumers may not immediately notice.
Thankfully, websites such as mouseprint.org document some of these cases:
Sara Lee blueberry bagels reduced from 1 lb., 4.0 oz. per bag to 1 lb., 0.7 oz.
Bounty “double rolls” reduced from 98 sheets to 90 (how is it still a “double roll”?)
Gain laundry detergent containers reduced from 92 fl. oz. to 88 fl. oz. without any obvious difference in the size of the container
Dawn dish soap bottles reduced from 19.4 fl. oz. to 18.0 fl. oz.
Green Giant frozen broccoli and cheese sauce packages reduced from 10.0 oz. to 8.0 oz. with no change in the advertised number of servings per package
In some instances of skimpflation, the volume or weight of a product remains the same, but the proportions change. For example, Hungry-Man Double Chicken Bowls (a frozen dinner of fried chicken and macaroni and cheese) maintained a net weight of 15.0 oz., but the protein content dropped from 39 grams to 33 grams.
And while firms are reducing the quantity and quality of the food they sell, consumers are also choosing to purchase less food and even lower-quality food. The January 2023 report on consumer inflation sentiment shows that 69.4 percent of respondents “reduced quantity, quality or both in their grocery purchases due to price increases over the last 12 months.”
We have also seen a widespread and long-lasting change in customer service at restaurants. Many restaurants switched to providing only takeout for months or years. Even though the dine-in option has been reintroduced at some restaurants, the service hasn’t quite been the same, with QR-code menus, shorter hours, less staff, and terse demeanors.
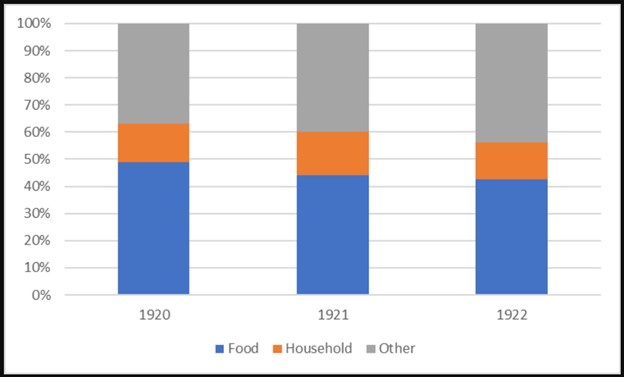
It’s not surprising that the massive government interventions, including creating trillions of new dollars, would have countless effects—some that show up in various statistics but many that do not. For example, if we look back at the period of German hyperinflation, we see surprisingly boring data on food spending proportions (figure 2).
Figure 2: Household expenditures in Germany, 1920–22
Historian Gerald D. Feldman commented on the German household expenditure data in a way that sounds familiar: “As one study after another pointed out, however, the full impact of these changes had to be understood in qualitative terms.” There was “reduced quality and quantity of the food consumed” and “poorer quality clothing,” among other qualitative changes.
Government statistics are unable to capture these subtleties. This should be obvious—your personal experience as a consumer is more than just the price you pay for a certain weight of food. We aren’t merely machines; we don’t describe our lives in miles per gallon or kilowatt hours.
This is why Ludwig von Mises attacked the conceited aggregates and indexes purported to measure various aspects of consumers’ lives: “The pretentious solemnity which statisticians and statistical bureaus display in computing indexes of purchasing power and cost of living is out of place. These index numbers are at best rather crude and inaccurate illustrations of changes which have occurred.”
He concludes: “A judicious housewife knows much more about price changes as far as they affect her own household than the statistical averages can tell.”
Is the U.S. economy headed toward a soft landing? While rare, the numbers are beginning to argue in favor on the side of a soft landing versus a hard one. An economic soft landing is a situation in which the Federal Reserve is able to slow economic growth without causing a recession. A hard landing, on the other hand, is a situation in which the central bank’s efforts to slow down economic growth lead to a recession. Recent inflation reports, employment numbers, and economic growth figures are looking more and more like monetary policy over the past year and a half, may be defying past performance; the U.S. might be able to avoid a situation where the economy shrinks (negative growth).
Background
The Federal Reserve has been facing a difficult challenge for almost two years as inflation spiked well above the Fed’s 2% target. In fact increases in prices were at a 40-year high as inflation began to soar toward double-digits. Fed monetary policy, which effectively controls the money in the economy, that in turn impacts interest rates, has been acting to raise rates to bring inflation under control. Less money increases the cost of that money (rates), which dampens economic activity.
There has been, and continues to be, a risk that the Fed raises interest rates too high or too quickly, this is the hard landing economic path. The hard landing scenario is more common than soft landings.
The Federal Reserve has a miserable record of achieving soft landings. There have been a few occasions when the Fed has been able to slow down economic growth without causing a recession. One example of success is 1994-1995. During this period the Fed raised interest rates by 2.5% from a starting point of 4.25% in order to bring inflation under control. However, the economy continued to grow during this period, and there was no recession.
Today’s Scenario
The current state of the U.S. economy is uncertain. Inflation is at a 40-year high, and the Fed has been raising interest rates in an effort to bring it under control. However, there is a risk that the Fed will raise interest rates too high or too quickly, which could lead to an economic hard landing, with job losses and negative growth. In fact, after an FOMC meeting in November, Fed Chair Powell said it would be easier to revive the economy if they overtighten, than it would be to lower it if they don’t tighten enough. So to the Fed Chair, a hard landing is better than no landing at all.
There has been a high level of concern amongst stakeholders in the U.S. economy. One reason is that the U.S. economy is already slow. GDP growth in the first quarter of 2023 was 2.0%, and it is expected to slow in the second quarter. Maintaining growth while pulling money from the system to reduce stimulus is a difficult maneuver. In fact, it usually ends as a hard, undesirable economic landing.
Another factor that is of concern this time around is the state of the housing market. Home prices rallied with low interest rates during and post pandemic. A fall-off in housing would have a ripple effect throughout the economy, leading to job losses and lower consumer spending. So far, housing has held up as new home sales are strong, and demand for existing homes remains elevated as homeowners with low mortgage rates are deciding to stay put.
Where from Here?
On Monday (July 11), Loretta J. Mester, president and CEO of the Federal Reserve Bank of Cleveland, warned during an address in San Diego that the central bank may need to keep hiking rates as inflation has remained “stubbornly high.” Fed governors go into a blackout period on July 15 as they always do before an FOMC meeting. That meeting will be held on July 25-26. So there is no telling if the voting FOMC members are going to dial back their hawkishness in light of this week’s more favorable CPI report that shows yoy inflation at 3%.
The Fed’s favored inflation gauge is PCE. The next PCE report is not to be released until July 28, after the July FOMC meeting. The previous report showed that in May, inflation was running at 3.8% over 12 months.
The banking system, which showed some cracks back in March, seems to be shored up; although some problems still exist, a full-scale banking crisis does not seem likely. The Fed would obviously like to keep it this way.
Employment gains were the smallest in 2-1/2 years in June, however the unemployment rate is close to historically low levels and wage growth is still strong, so although wages are not fully working their way into the final cost of goods or services, the industries having to pay the higher wages are likely absorbing some of the cost, which could pull from profits.
Part of the Fed’s tightening has been the less talked about quantitative tightening. This reduces the Fed’s balance sheet which swelled as part of the reaction to the pandemic. Reducing this in a meaningful way will take time, but even if the Fed remains paused on rate hikes, there is still $90 billion scheduled to be pulled from the economy each month as maturities will be allowed to mature from the Fed’s holdings without being rolled. This my eventually cause U.S. Treasury rates and mortgage rates to tick up as increased Treasury borrowing, and decreased Fed ownership may put downward pressure on prices.
Take Away
The recent CPI report is causing some that argued a soft landing is achievable to celebrate and those that thought it impossible to consider it a possibility. The chances appear greater, and a soft landing is certainly a desirable outcome for stock prices and U.S. economy stakeholders. From here, there are a number of factors that can increase the risk of a hard landing, they include the pace of additional interest rate hikes, and the behavior of the housing markets. We’re entering a period where we will not hear any commentary from Fed governors, and the next major inflation indicator comes after the FOMC meeting, so markets will be on the edge of their seats until July 26 at 2 PM Eastern.
Inflation in Argentina so far in 2023 is running at 126.4%. Meanwhile, its GDP has declined by 3.1%. This certainly meets the definition of hyperinflation. Can this situation occur in the U.S. economy? Hyperinflation is when prices of goods and services in the economy run up rapidly; at the same time, it causes the value of the nation’s currency to fall rapidly. It’s a devastating phenomenon that has serious consequences for businesses, investors, and households. Below we explore the causes of hyperinflation, its effects on the economy, and some ways to protect investable assets against it.
Causes of Hyperinflation
Hyperinflation can be caused by a variety of factors, but one ingredient that is most common is excessive money printing by the country’s central bank. When a central bank allows excessive cash in circulation, especially if it is during a period of low or negative growth, natural economic forces that occur when there is an abundance of currency chasing the same or fewer goods, serves to drive up prices and down currency values. This inflation can quickly spiral out of control, leading to hyperinflation. Other causes could include shortages of goods or services driving prices up as demand outstrips available supply.
Effects on the Economy
Excessive inflation is not good for anyone that holds the impacted currency. Businesses can command higher prices, but they will also be paying higher prices to run their business and receiving payment with notes with far less purchasing power. This is because hyperinflation increases costs for labor and raw materials, weighing down profit margins. Less obvious, but certainly adding to the hardship, is that businesses may have trouble securing financing and loans during hyperinflation; this can limit their ability to function or grow.
For households and individuals, hyperinflation also rapidly decreases purchasing power, as prices for goods and services jump up. This lowers living standards in the country as people are forced to pay more for the same goods and services. Additionally, hyperinflation can lead to a loss of confidence in the currency. Behavior including the belief that items should be purchased now because they will be more expensive tomorrow leads to hoarding and other actions that create shortages and drives up prices even further.
How Some Prepare for Hyperinflation
Hyperinflation is rare, yet, once the wheels start turning, such as they did in Venezuela in 2016, or Germany in 1923, it is important for businesses and individuals to take steps to prepare for the possibility. Here are ways that people have prepared for excessive inflation in their native currency.
Diversify Your Investments: While some believe it is always prudent to stay widely diversified, it may offer even more protection when the economy goes through the turmoil of excessive inflation. Preparing in this way means spreading your investments across a variety of asset classes, such as stocks, bonds, real estate, and commodities. This will help by avoiding any one particular asset class that gets hit hard. Keep in mind, stocks are often a good hedge against moderate inflation, and precious metals have historically been looked to for protection in times of extreme inflation. Earnings of companies that export are not expected to suffer as much as importers.
Hold Some Assets Denominated in Other Currencies: This can include established digital currencies, foreign stocks, bonds, that are not denominated in your own home currency. By holding assets denominated in other currencies, you can protect yourself from its devaluation versus others.
Invest in Hard Assets: Hard assets, such as gold and silver, land, and even tools can be a good way to protect yourself or your business from hyperinflation. These assets have intrinsic value and can retain their value even if the currency they are denominated in loses value. Remember that if inflation remains, it is likely to cost more in the coming months for the same piece of office equipment that helps your business run more efficiently.
Cryptocurrencies: Keeping within the guidelines of diversification, more established tokens such as bitcoin and ether are considered by some to help protect from hyperinflation. A word of caution, cryptocurrencies have little history against currency devaluation and inflation. The theory however is these digital currencies are decentralized and not subject to the same inflationary pressures as fiat currencies.
Take Away
In 2018 inflation in Venezuela exceeded 1,000,000%, proving, when the recipe for higher prices is in place, the unimaginable can happen.
While there is no consumer or investor that can proactively impact a rising price freight train, if hyperinflation is expected, there are steps one can take to reduce the negative impacts. These financial steps can be as simple as buying things today that you expect to need later, and more substantially diversifying your portfolio toward hard assets, companies that export to countries not experiencing inflation, and even bonds with either short maturities or an inflation factor as part of the return.