GameSquare’s SaaS solutions to enable Bungie to elevate its content and creator programs
FRISCO, TX / ACCESSWIRE / December 11, 2023 /Stream Hatchet, a GameSquare company (“GameSquare”, or the “Company”) (NASDAQ:GAME)(TSXV:GAME), proudly announces an innovative partnership with Bungie, a leading force in the game publishing world. Bungie will utilize Stream Hatchet’s advanced analytics capabilities to gain profound insights into audience engagement across live streaming and social media platforms. The partnership includes the influencer CRM capabilities of Sideqik, also a GameSquare company, to seamlessly scale and manage Bungie’s creator and affiliate programs.
Justin Kenna, CEO of GameSquare, stated: “Our collaboration with Bungie marks a significant milestone for Stream Hatchet and Sideqik as we benefit from the complementary nature of their offerings. We’re thrilled to empower Bungie with the data and insights that are needed to elevate engagement with the gaming community. We are excited to work with Bungie and support their innovative content and experiences.”
Bungie, renowned for creating iconic franchises like Destiny and Marathon, will use GameSquare’s SaaS based tools to develop a data-driven approach that will empower Bungie to fine-tune their content delivery strategies and enhance their connection with the gaming community. Furthermore, Stream Hatchet enables Bungie to strategically plan and benchmark content and title releases against competitors, ensuring each launch captures the attention of the gaming community to reach its full potential.
About GameSquare Holdings, Inc.
GameSquare is a vertically integrated, digital media, entertainment and technology company that connects global brands with gaming and youth culture audiences. GAME’s end-to-end platform includes GCN, a digital media company focused on gaming and esports audiences, Cut+Sew (Zoned), a gaming and lifestyle marketing agency, USA, Code Red Esports Ltd., a UK based esports talent agency, Complexity Gaming, a leading esports organization, Fourth Frame Studios, a creative production studio, Mission Supply, a merchandise and consumer products business, Frankly Media, programmatic advertising, Stream Hatchet, live streaming analytics, and Sideqik a social influencer marketing platform.
This news release contains “forward-looking information” and “forward-looking statements” (collectively, “forward-looking statements”) within the meaning of the applicable Canadian and United States securities legislation. All statements, other than statements of historical fact, are forward-looking statements and are based on expectations, estimates and projections as at the date of this news release. Any statement that involves discussions with respect to predictions, expectations, beliefs, plans, projections, objectives, assumptions, future events or performance (often but not always using phrases such as “expects”, or “does not expect”, “is expected”, “anticipates” or “does not anticipate”, “plans”, “budget”, “scheduled”, “forecasts”, “estimates”, “believes” or “intends” or variations of such words and phrases or stating that certain actions, events or results “may” or “could”, “would”, “might” or “will” be taken to occur or be achieved) are not statements of historical fact and may be forward-looking statements. In this news release, forward-looking statements relate, among other things, to the closing of the proposed transaction, the Company’s future performance and revenue; the Company’s ability to execute its business plan; and the proposed use of net proceeds of the transaction. These forward-looking statements are provided only to provide information currently available to us and are not intended to serve as and must not be relied on by any investor as, a guarantee, assurance or definitive statement of fact or probability. Forward-looking statements are necessarily based upon a number of estimates and assumptions which include, but are not limited to: the Company being able to grow its business and being able to execute on its business plan, the Company being able to complete and successfully integrate acquisitions, the Company being able to recognize and capitalize on opportunities and the Company continuing to attract qualified personnel to supports its development requirements. These assumptions, while considered reasonable, are subject to known and unknown risks, uncertainties, and other factors which may cause the actual results and future events to differ materially from those expressed or implied by such forward-looking statements. Such factors include, but are not limited to: the Company’s ability to achieve its objectives, the Company successfully executing its growth strategy, the ability of the Company to obtain future financings or complete offerings on acceptable terms, failure to leverage the Company’s portfolio across entertainment and media platforms, dependence on the Company’s key personnel and general business, economic, competitive, political and social uncertainties including impact of the COVID-19 pandemic and any variants. These risk factors are not intended to represent a complete list of the factors that could affect the Company which are discussed in the Company’s most recent MD&A. There can be no assurance that forward-looking statements will prove to be accurate, as actual results and future events could differ materially from those anticipated in such statements. Accordingly, readers should not place undue reliance on the forward-looking statements and information contained in this news release. GameSquare assumes no obligation to update the forward-looking statements of beliefs, opinions, projections, or other factors, should they change, except as required by law.
Neither TSX Venture Exchange nor its Regulation Services Provider (as that term is defined in the policies of the TSX Venture Exchange) accepts responsibility for the adequacy or accuracy of this release.
Corporate Contact
Lou Schwartz, President Phone: (216) 464-6400 Email: ir@gamesquare.com
Michael Kupinski, Director of Research, Noble Capital Markets, Inc.
Jacob Mutchler, Research Associate, Noble Capital Markets, Inc.
Refer to the bottom of the report for important disclosures
Overview: Is The Recession Here? Economic activity is slowing, taking pressure off of inflation. But, the Fed seems intent on pushing interest rates higher, likely through the balance of this year. As such, recent economic forecasts anticipate GDP to contract over the next few quarters. This does not paint a favorable picture for advertising in the very near term. But, given the increased likelihood of a recession, has timeliness in media stocks improved?
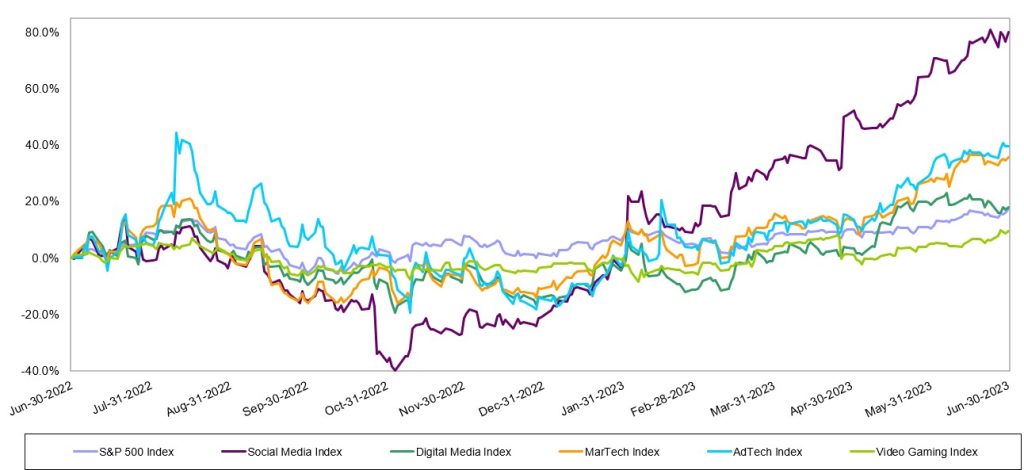
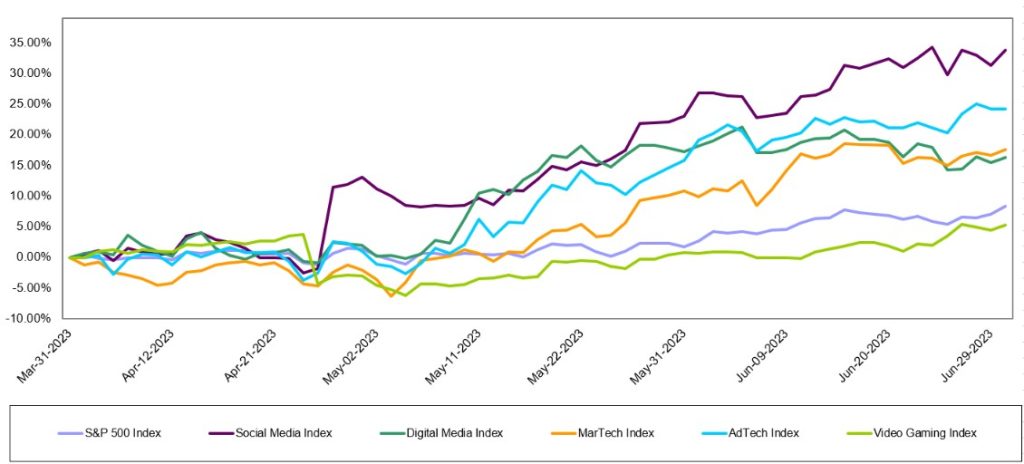
Digital Media & Technology:A broad based recovery? For the second quarter in a row, the best performing index was Noble’s Social Media Index, which increased by 34% in 2Q 2023, followed by Noble’s Ad Tech Index (+24%), MarTech Index (+18%), Digital Media Index (+16%), and Video Gaming Index (+5%). The largest stocks carried the performance in each of the indices. Can the stocks hold on to recent gains?
Broadcast Television: Are ad trends really improving? Recent reports indicate that television advertising is showing some improvement. While it is likely that Auto and Political advertising are bright spots, we remain skeptical that core advertising pacings are improving in the third quarter given the weak economic outlook. Nonetheless, the TV stocks appear to be cheap and we highlight a few of our key favorites.
Broadcast Radio:The pall over radio. Soft advertising trends heading into an economic downturn does not bode well for companies, like Audacy, that are in the midst of a financial restructuring. We believe that high debt leverage is the pall over the stocks. It is likely that many radio companies will go through a round of cost cutting to shore up cash flow in the midst of an economic downturn.
Publishing: Cash flow gurus. We do not believe that the Publishing industry will be spared from the weak advertising environment. The industry has a playbook for cutting costs, however, and has a history of maintaining cash flow through difficult times.
Overview
The Recession Is Here
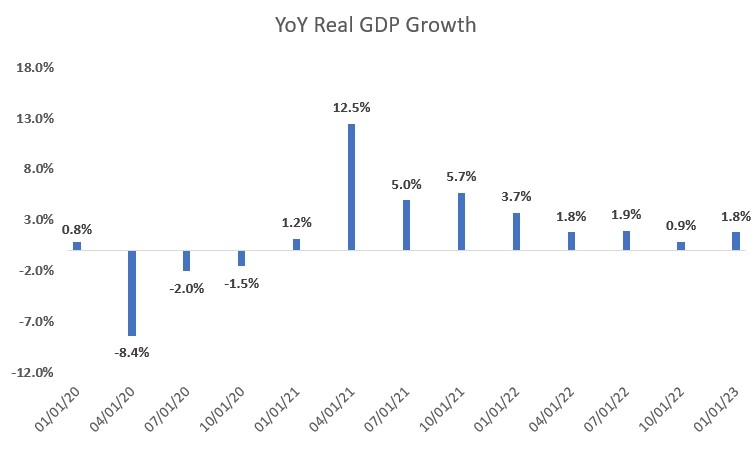
Figure #1 YoY Real GDP Growth illustrates that the economy grew post pandemic through the first quarter 2023, reflecting a rebounding economy, fueled by government spending. But, economic activity is slowing, taking pressure off of inflation. Nonetheless, the Fed seems intent on pushing interest rates higher, likely through the balance of this year. Most economists anticipate that the Fed will raise interest rates by 25 basis points two times in the second half of this year. Not only will the interest rate increases be a headwind for the economy, but government spending, a key driver to the economy this year, is likely to wane. Recent economic forecasts anticipate GDP to contract over the next few quarters, a classic definition of an economic recession. The Conference Board of Economic Forecasts anticipate that the US economy will contract -1.2% in Q3 2023, -1.9% in Q4 2023, and -1.1% in Q1 2024.
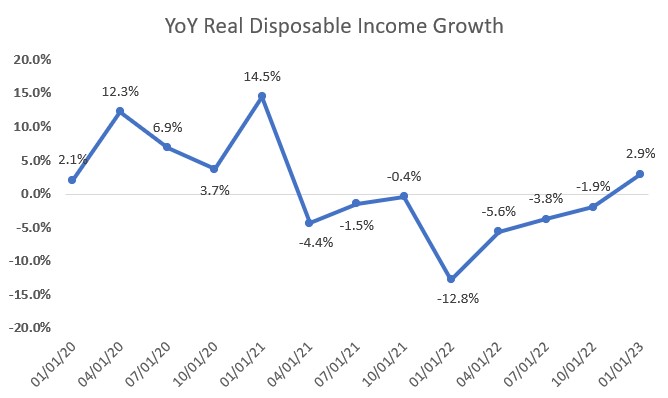
This does not paint a favorable picture for advertising in the very near term. Advertising is highly correlated to personal disposable income, particularly discretionary income. If consumers have discretionary income, companies advertise for them to spend. As Figure #2 YoY Real Disposable Income Growth highlights, disposable income has declined over the past 18 months. Not surprisingly, economically sensitive National advertising has been down nearly 4 quarters and at high double digit rates. Given the significant declines, as much as 25% in each quarter for the past year, National advertising trends should moderate, given that the comps get easier. As such, even with an economic downturn becoming more visible, it is possible that National advertising declines may moderate.
National advertisers tend to spend when there is light toward the end of an economic recession, when consumer personal disposable income shows signs that it will improve and consumers have the propensity to spend. In our view, that light at the end of the tunnel is still pretty dim given the economic forecast that anticipates a decline in GDP through the Q1 2024. While the visibility of an improvement in National advertising seems to have improved as we enter an economic downturn, especially given the easing comps and the benefit from Political advertising (expected to begin in Q3 2023), we think that it is too early to be optimistic. The length and severity of an economic downturn is not yet visible.
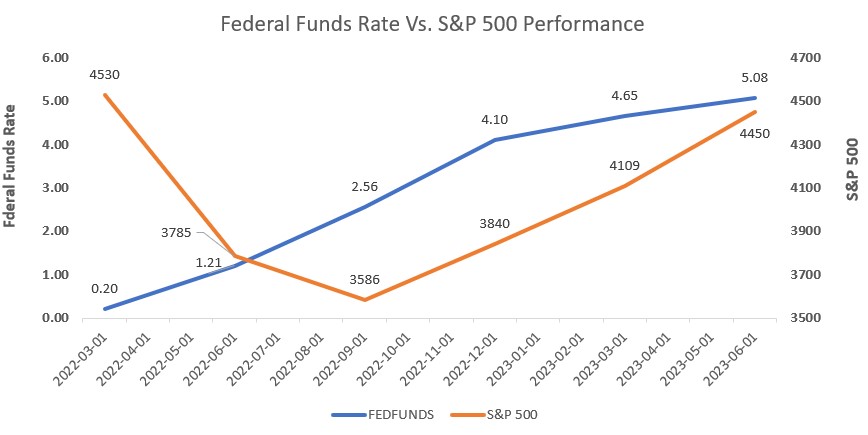
What does this mean for the stock market and for media stocks? Figure #3 Federal Funds Rate Vs. S&P 500 performance illustrates the recent increases in Fed Funds rates had little effect on the general stock market as measured by the S&P 500 Index. Unfortunately, late cycle and economically sensitive media companies declined or under performed the stock market. In spite of Fed Fund rate increases over the past year, the S&P 500 Index increased 18% in the last 12 months. The anticipation of an economic recession, however, weighed on media stocks. The stock performance of the various media sectors that we follow are discussed in this report, but have generally under performed the market. The exception to the poor performance were the Internet and Digital Media stocks, which had a broad based recovery. Is it possible that early cycle media stocks will outperform the general market in the near term? In our view, yes. But, this may mean that the general market may decline as media stocks decline less. Historically, it has been the case to buy media stocks in the midst of a recession as media stocks strongly outperform the general market in a economic recovery. But given the likely disappointment in revenue in the coming quarters, it is likely that media stocks will be volatile as investors weigh the near term revenue and earnings disappointments to the prospect of a revenue rebound in an improved economic scenario. This would suggest that if one would try to time the stocks, investors may want to wait a quarter or two, buy on the improved momentum. This may mean that one might miss the large gains. As such, for long term investors, we believe that we are nearer to the bottom and that the downside appears relatively limited, valuations appear compelling. But, given the anticipate volatility in the near term, media investors should look for opportunistic purchases and accumulate positions in our favorite media names highlighted in this report.
Figure #1 YoY Real GDP Growth
Source: Federal Reserve Bank of St. Louis
Figure #2 YoY Real Disposable Income Growth
Source: Federal Reserve Bank of St. Louis
Figure #3 Federal Funds Rate Vs. S&P 500 performance
Source: Federal Reserve Bank of St. Louis & Yahoo Finance
Digital Media & Technology
A Broad-Based Recovery in Shares
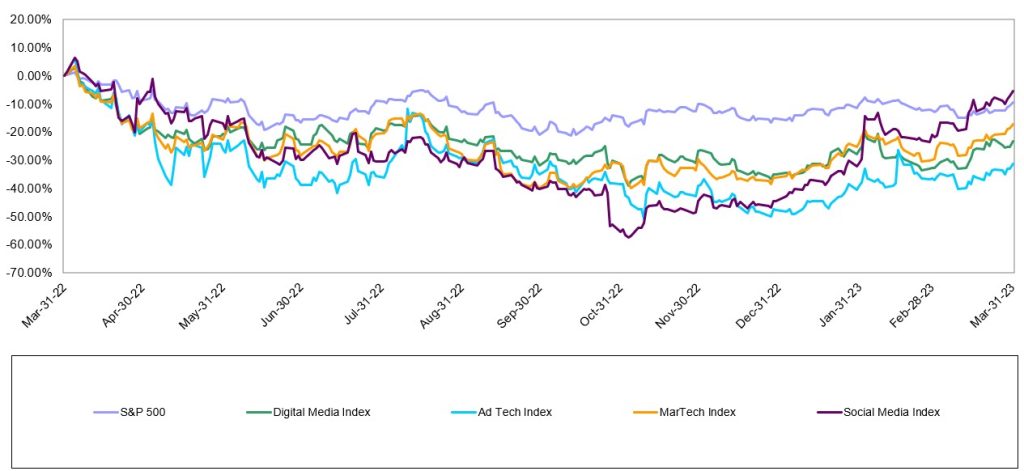
The Internet and Digital Media sectors rebounded nicely over the last 12 months (LTM). As Figure #4 LTM Internet & Digital Technology Performance illustrates, the Video Gaming index was the only sector that underperformed the S&P 500 over the last year. The S&P 500 Index was up 17.6% over the LTM, outperforming the Video gaming index’s increase of 9.7% and in line with Noble’s Digital Media Index increase of 18%. The MarTech Index and AdTech Index both performed strongly, increasing 35.8% and 39.8%, respectively. The Social Media index had the strongest performance of the indices, increasing an impressive 80.2% over the LTM.
Figure #4 LTM Internet & Digital Technology Performance
Source: Capital IQ
Despite macroeconomic headwinds that include higher interest rates, a regional banking crisis, elevated inflation and a war in Europe, the S&P 500 powered higher for the third quarter in a row. The S&P 500 Index continued its streak of steady increases, with an 8% increase in the Index in 2Q 2023, which followed a 7% increase in 1Q 2023 and a 7% increase in 4Q 2022. The broad index is up a healthy 24% since the end of the third quarter of 2022. The S&P 500 bottomed on October 12, 2022, and is up 26% from that date through mid-July.
The S&P 500’s performance was driven primarily by its largest constituents. As a market weighted index, the largest stocks have an outsized impact on its performance, and that was certainly the case in 2Q. Eight of the largest stocks in the S&P 500 Index were up in 2Q 2023 by 2x-3x or more than the Index’s 8% gain. Stocks that powered the Index higher included Nvidia (NVDA, +52%), Meta Platforms (a.k.a Facebook, META, +35%), Netflix (NFLX, +28%), Amazon (AMZN, +26%), Tesla (TSLA, +26%), Microsoft (MSFT, +18%), Apple (AAPL, +18%) and Google (GOOGL, +15%).
Noble’s Internet and Digital Media Indices, which are also market cap weighted, also powered higher thanks to the biggest constituents in their respective Indices. Each of these Indices posted double digital percent increases, with only the exception being Noble’s Video Gaming Index (+5%), which slightly underperformed the broader market/S&P Index. For the second quarter in a row, the best performing index was Noble’s Social Media Index, which increased by 34% in 2Q 2023, followed by Noble’s Ad Tech Index (+24%), MarTech Index (+18%), Digital Media Index (+16%), and Video Gaming Index (+5%).
Meta Powers the Social Media Index Higher
We attribute the strength of the Social Media Index to its largest constituent, Meta Platforms, whose shares increased by 35% in the second quarter. We noted last quarter that Meta appeared to be returning to its roots and focusing on profitability, rather than its nascent and riskier web3 initiatives. That return to its core strengths has been greatly rewarded by investors. Shares of Meta were up 225% from its 52-week low of $88.09 per share in early November through the end of June. Shares are up another 8% since the start of the third quarter with the launch of Threads, Meta’s answer to Twitter. Over 100 million people signed up for Threads within the first five days of its rollout. Meta has not yet begun to monetize this opportunity, but it will clearly add to its growth in coming quarters.
Ad Tech Stocks Embark on a Broad-Based Recovery Following a Difficult 2022
Noble’s AdTech Index increased by 24% in 2Q 2023, and this performance was very broad based, with 15 of the 24 stocks in the sector up, and a dozen of the stocks up by double digits. Ad Tech stocks that performed best during the quarter include Applovin (APP, +63%), Magnite (MGNI, +47%), Tremor International (TRMR, +37%), Pubmatic (PUBM, +32%), Double Verify (DV, +29%), The Trade Desk (+27%), and Integral Ad Science (IAS, +26%). Ad Tech stocks were the worst performing sector in our universe in 2022, with the index down 63% for the year in 2022. The strong performance in 2Q 2023 in many respects reflects a bounce back off multi-year lows for several stocks. Year-to-date, one standout in particular is Integral Ad Science, whose shares were up 104% in the first half of 2023.The company continues to expand its product suite, scale its social media offerings (i.e., for TikTok) and is well positioned to continue to benefit from the shift from linear TV to connected TV (CTV). The company is benefiting from new partnerships with YouTube and Netflix and shares likely benefited during the quarter from anticipation of the company’s mid-June analyst day presentation.
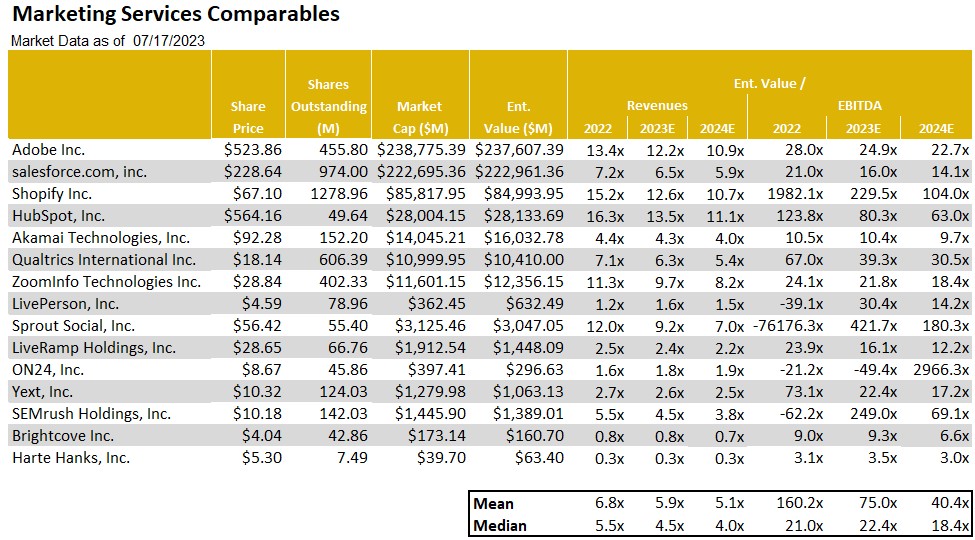
Noble’s MarTech Index was up 18%, with performance within the group also broad based. The Digital Media & Technology indices market-cap weighted performances in 2Q are illustrated in Figure #5 2Q Internet & Digital Technology Performance. Thirteen of the 20 stocks in the Index were up in the quarter. MarTech stocks that performed best during the quarter include Cardlytics (CDLX, +86%), Shopify (SHOP, +35%), Live Ramp (RAMP, +30%), Adobe (ADBE, +27%), and Hubspot (NUBS, +24%). One of the poor performers in the group was one of our closely followed stocks, Harte Hanks, which declined 42% in the latest quarter. The stock gave back nearly all of its 54% gains in the prior year. The weakness was due to a disappointing quarterly revenue outlook as the company indicated that it is seeing economic headwinds and more difficult second half comparables. Notably, the company has significant levers to maintain much of its favorable cash flow outlook and is well positioned for growth as those headwinds diminish. We believe that downside risk in the HHS shares appear limited and view the shares as among our favorite rebound plays. Overall, MarTech stocks were victims of their own success: the group traded at double digit revenue multiples in 2021, but the sector’s revenue multiples were more than halved in 2022. The group currently trades at 5.9x 2023E revenues, up from 4.1x 2023E revenues at the end of the first quarter, and 3.5x 2023E revenues at the start of the year. Current trading multiples are illustrated in Figure #7 MarTech Comparables.
Finally, the Digital Media Index was up 16% in 2Q 2023, and here again, the performance was broad based with 8 of the 12 stocks in the Index posting gains. Digital Media stocks that performed best during the quarter include Fubo TV (FUBO, +72%), Travelzoo (TZOO, +31%), Netflix (NFLX, +28%), Interactive Corp (IAC, +22%), and Spotify (SPOT, +20%). Year-to-date, the two best performing Digital Media stocks are Spotfiy (+103% YTD), which has shifted its priority to running a profitable company and took additional steps in 2Q to achieve it, for instance, by consolidating and streamlining several of its podcast company acquisitions from recent years. The second best performing Digital Media stock through the first half of the year was Travelzoo (TZOO), whose shares were up 77% in the first half of the year. The company continues to benefit from pent up demand that helped a surge in travel as the pandemic ebbed. Lodging and domestic travel demand rebounded first, but Travelzoo appears to be benefiting from cruises and international travel, where pent up demand took longer to recover. Management indicated that travel related advertising may increase as economic headwinds adversely affect hotel and air travel occupancy, forcing these travel businesses to offer discounts. We rate the TZOO shares as Outperform.
Figure #5 2Q Internet & Digital Technology Performance
Source: Capital IQ
Figure #6 AdTech Comparables
Source: Company filings & Eikon
Figure #7 MarTech Comparables
Source: Noble estimates & Eikon
Traditional Media
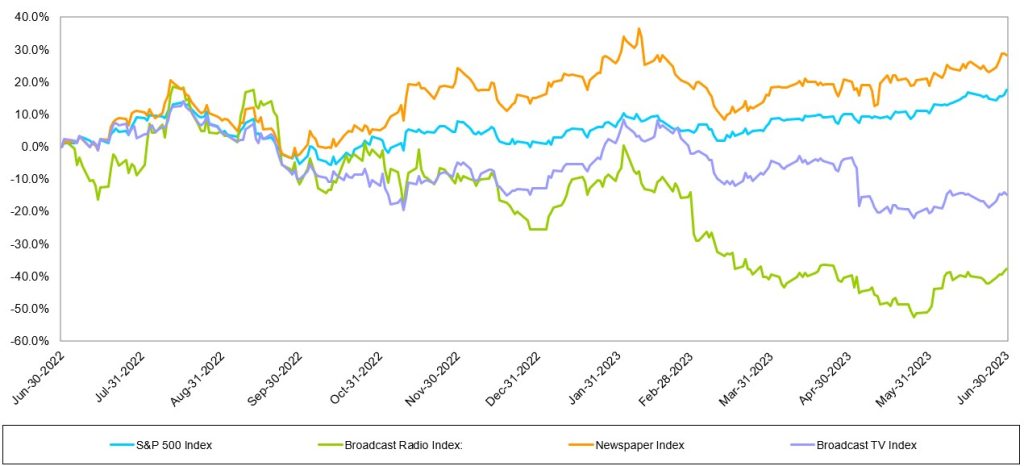
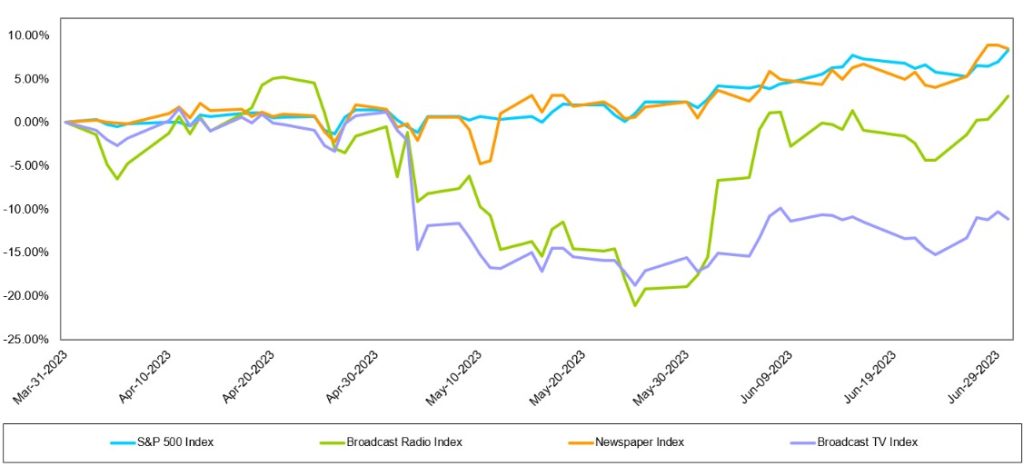
Traditional media stocks largely underperformed the general market over the LTM, the Radio sector was the hardest hit. As Figure #8 LTM Traditional Media Performance illustrates, the Noble Radio Index decreased 37.7% over the LTM, compared with the general market increasing 17.6%, as measured by the S&P 500 over the same period. The Television Index was down 14.8% and the Publishing index outperformed the general market, increasing 28.4% over the LTM. Notably, there were company stock performance disparities within each sector, highlighted later in this report. Given the indices are market cap weighted, larger market capitalized companies skewed the indices’ performance.
The traditional media industry is still finding its footing in the difficult economic environment, given the indices performance in Q2. While the Newspaper and Radio indices performed better in Q2 than Q1, the TV Index did not. The general market, as measured by the S&P 500, increased 8.3% over the last quarter and outperformed all but one traditional media sector. The Newspaper Index, which increased 8.5% over the same period narrowly outperformed the general market. The TV Index was the hardest hit traditional media sector and decreased -11.1%. While the Radio index underperformed the market in Q2, it improved upon a difficult Q1 and increased 3.1%, as illustrated in Figure #9 Q2 Traditional media performance.
Figure #8 LTM Traditional Media Performance
Source: Capital IQ
Figure #9 Q2 Traditional Stock Performance
Source: Capital IQ
Broadcast Television
Are ad trends really improving?
The TV Index underperformed the general market in the second quarter. While none of the stocks in the TV Index increased in the second quarter, many performed better than the market cap weighted return of -11.1%. Fox Corporation (FOXA; down 0.1%), E.W Scripps (SSP; down 2.8%), Nexstar (NXST; down 3.5%) and Gray Television (GTN; down 9.6%) were among the best performing stocks in the hard-hit TV index. The stocks hit the hardest in Q2 were Sinclair Broadcast Group (SBGI; down 19.5%) and Entravision (EVC; down 27.4%). Given the recent turmoil in TV stock performances we view the depressed prices as a potential opportunity given the prospect of an advertising recovery over the next few quarters.
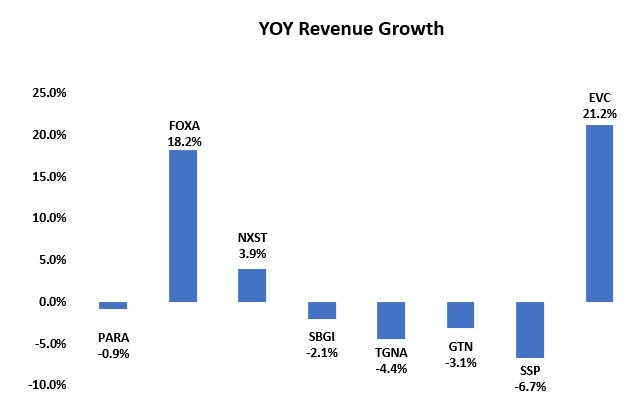
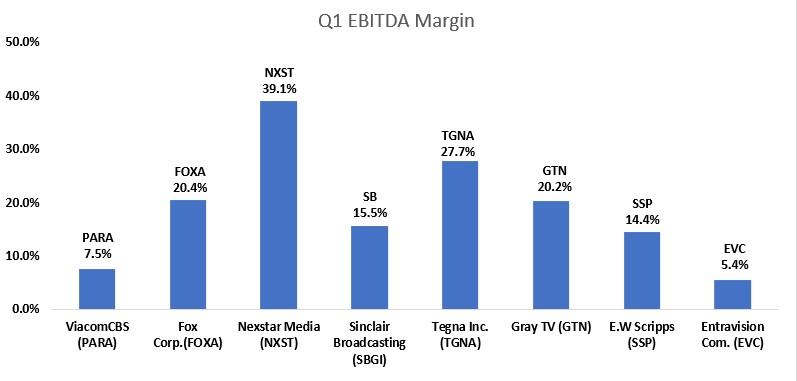
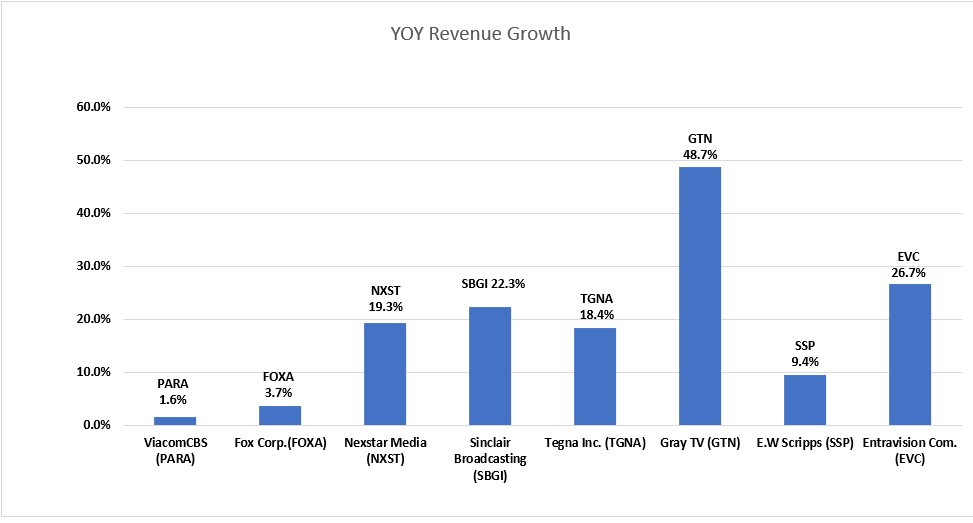
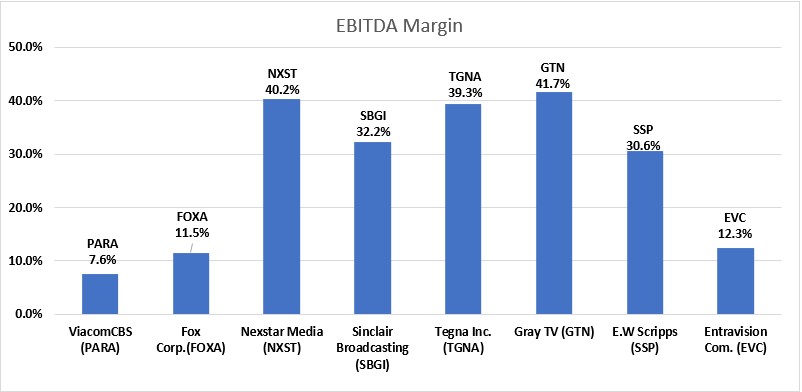
While there have been some recent reports indicating that television advertising is improving, possibly related to increased political advertising and Auto advertising in the third quarter, we remain skeptical that the improvement is sustainable given the prospect of a weakening economy. Nonetheless, the TV stocks appear cheap. One of our favorites in the index is Entravision (EVC) which is among the industry leaders in revenue growth as illustrated in Figure #10 TV Q1 YoY Revenue Growth. While the EVC shares had a poor performance in Q2, down 27.4%, the shares had increased 26% in Q1. Entravision’s revenue growth is the product of a robust digital business that comprises approximately 80% of total revenue. We believe that the recent under performance is related to Meta’s (Facebook’s) announcement that it plans to implement efficiencies, implying that it may take margin away from some of its advertising agencies, like Entravision, which represents Facebook in Latin America. In our view, Entravision is in a strong position to push back on that prospect given its favorable business relationship with the company. Given the influx of lower margin digital revenues, Entravision’s EBITDA margin is much lower than industry peers, illustrated in Figure #11 TV Industry Q1 EBITDA Margin. But, importantly, the company has one of the better revenue and cash flow growth profiles.
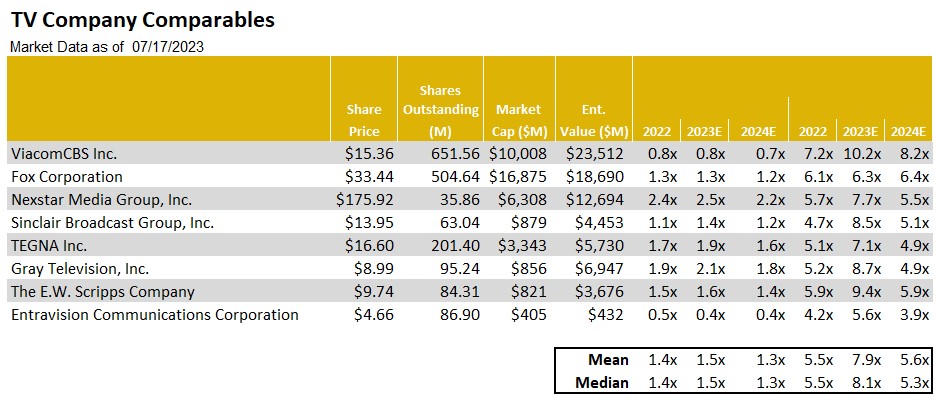
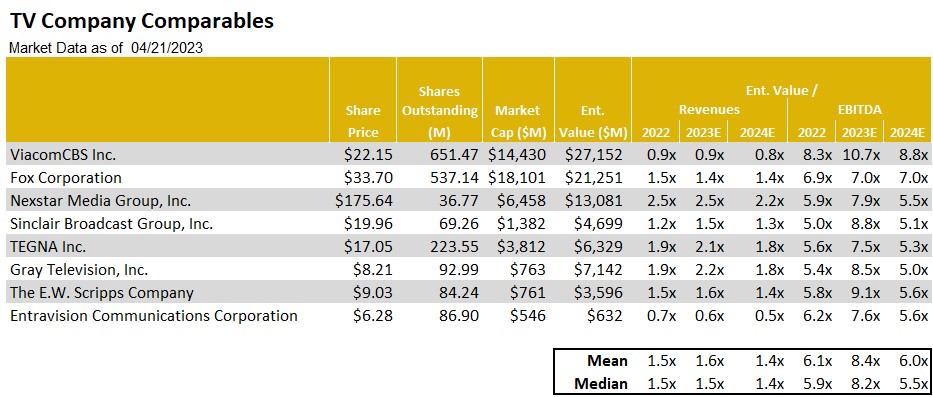
Figure #12 TV Company Comparablesillustrates the trading levels of the companies in the index. Some of our favorites Entravision (EVC) and E.W Scripps (SSP) trade at multiples well below the industry peer group highs. While E.W Scripps had modest year over year revenue decline, we believe it will benefit from favorable Retransmission revenue, strong Political advertising and improved margins in 2024. Given the SSP shares low float, the shares tend to underperform when industry is out of favor and outperform when the industry is back in favor. As for Entravision, we view the company’s digital transformation favorably and, notably, the shares are trading at a modest 3.9 times Enterprise Value to our 2024 Adj. EBITDA estimate. In our view, there appearas to be limited downside risk. The EVC shares and SSP shares, in our view, both offer a favorable risk reward relationship.
Figure #10 TV Q1 YoY Revenue Growth
Source: Company filings
Figure #11 TV Industry Q1 EBITDA Margin
Source: Company filings & Eikon
Figure #12 TV Company Comparables
Source: Noble Estimates & Eikon
Broadcast Radio
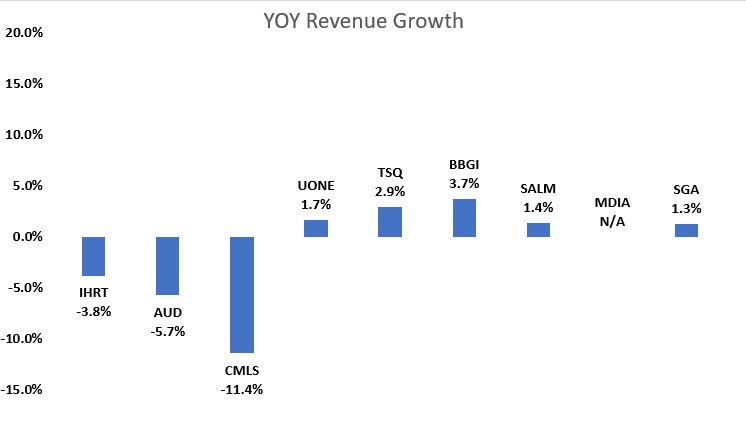
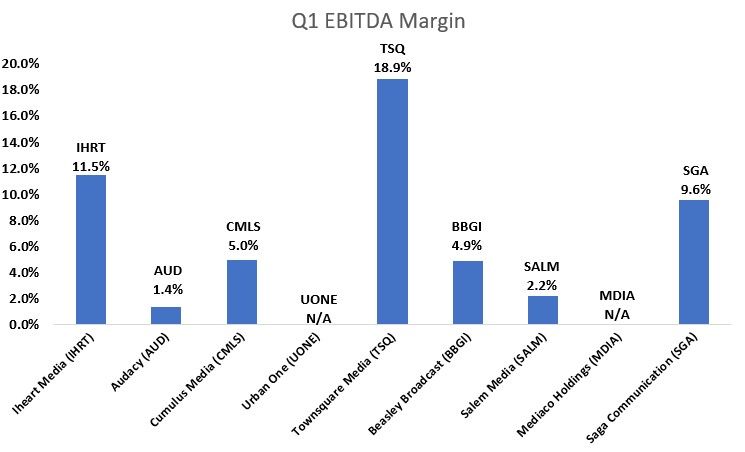
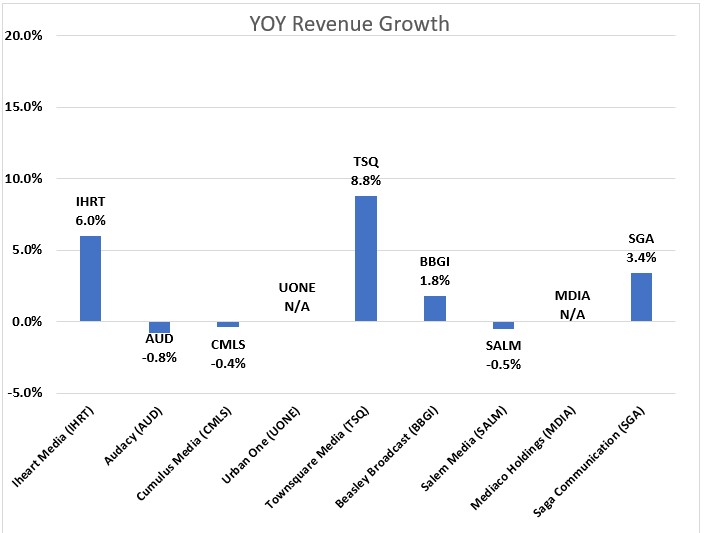
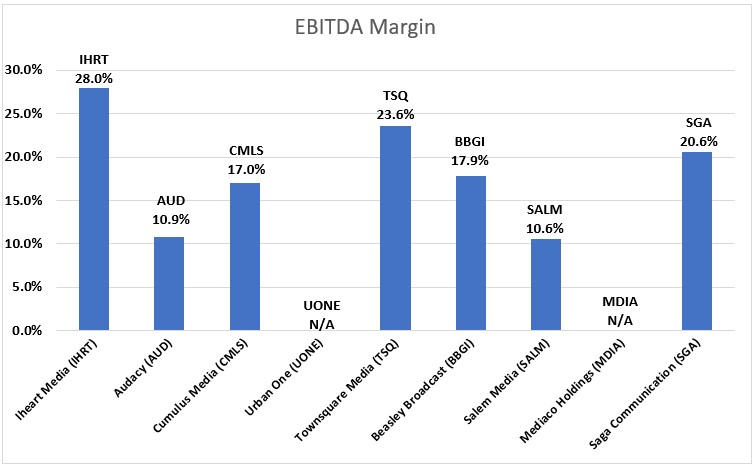
While the Radio Index underperformed the S&P 500 in Q2, it was an improvement from a difficult Q1. Notably, there were a few strong performances in the market cap weighted index. Beasley Broadcast Group (BBGI, up 24.4%) , Cumulus Media (CMLS, up 11.1%) and Townsquare (TSQ, up 48.9%) all strongly outperformed the S&P 500 in Q2. The largest stocks in the group did not perform well in the quarter skewing the index lower, Audacy (AUD, up 2.6%) and iHeart Media (IHRT, down 6.7%). The second quarter stock performances were a mixed bag and largely did not reflect the first quarter operating results. As Figure #13 Radio Q1 YoY Revenue Growth illustrates, most companies had modest revenue growth. The larger Radio companies that rely more on National advertising had the greatest declines of YoY revenue. With CMLS being the exception, the larger Radio companies underperformed relative to Radio companies with a stronger digital and highly localized presence. Figure #14 Radio Industry Q1 EBITDA Margin Margins illustrate that the margins for the industry remain relatively healthy.
Some of our favorite Radio stocks have strong digital businesses and highly localized footprints, which provides some shelter from weakness in national advertising. Those stocks included Townsquare, Beasley Broadcast Group, Salem Media (SALM; down 12.1%) and Saga Communications (SGA, down 3.9%). While the shares of Saga Communications (SGA) were down 3.9%, the performance did not reflect its favorable first quarter operating results. Importantly, Saga grew revenues a modest 1.3% and had an above average Q1 EBITDA margin of 9.6%. Saga has a highly localized footprint, as approximately 90% of revenues come from local sources. Furthermore, the company has been placing more importance on growing a profitable digital business in recent years. While Saga’s Digital business is early in its development, management is focused on growing digital revenues from 7.5% of total revenue in Q1 to 20% of total revenue over the next couple years. Additionally, we believe the company is likely to maintain a strong cash position given the economic uncertainty.
We view Townsquare Media (TSQ), Salem Media (SALM), Beasley Broadcast (BBGI) and Saga Communications (SGA) as among our favorites in the industry given the diverse revenue streams and localized footprints. While these companies are not immune to the economic headwinds, we believe that its Digital businesses and local footprints should offer some ballast to its more sensitive Radio business. Beasley’s recent digital revenue growth has been robust, digital revenue was 17% of total revenue in Q1 and is expected to reach 20% to 30% of total revenue for full year 2023. In the case of Salem, 30% of its revenues are from reliable block programming.
We believe that Radio advertising pacings likely will be problematic in the second half given the economic headwinds. Unlike Television, the industry does not benefit as much from Political advertising. As such, we expect that advertising pacings likely will be lower in Q3 than the Q2 results. It is likely that many radio companies, especially those with higher debt leverage, will implement cost cutting measures. With many of the radio companies already relatively lean from the Pandemic, it is likely that such measures will be difficult.
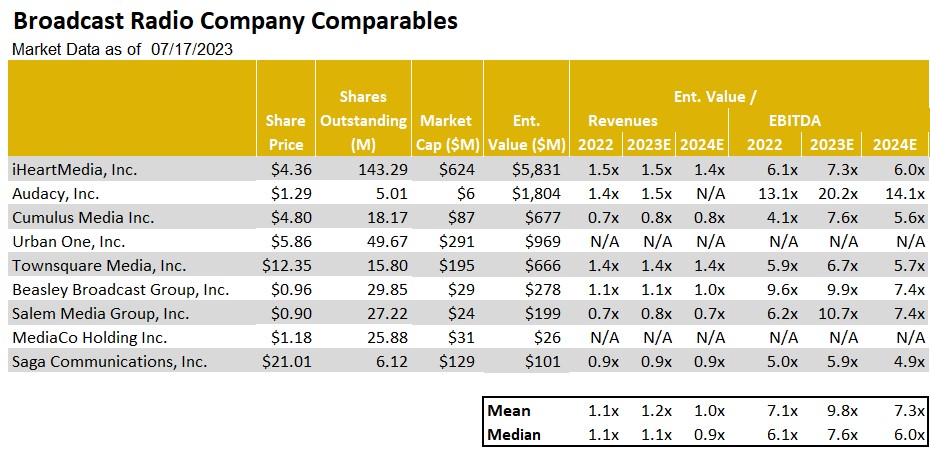
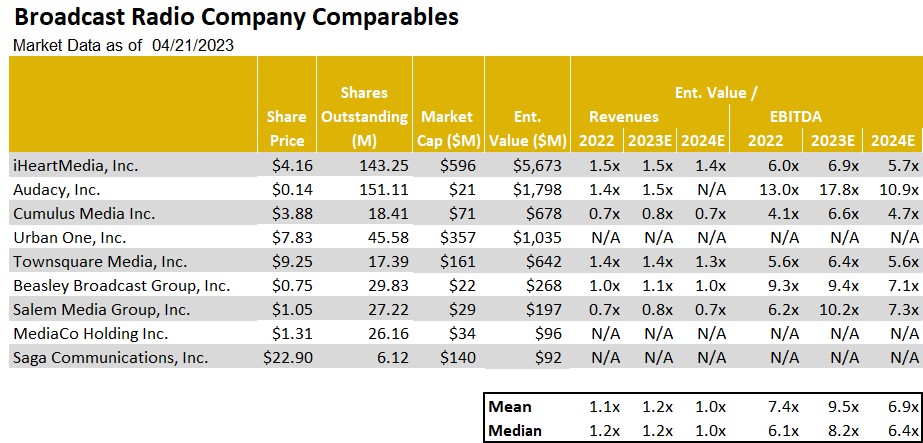
As Figure #15 Radio Company Comparables illustrates, the shares of Townsquare and Saga are among the cheapest in the industry, trading below peer group averages. Notably, Townsquare implemented a hefty dividend in Q1, providing the unique opportunity to get a return of capital while waiting for a turn toward more favorable fundamentals. As such, the shares of TSQ tops our list of favorites. We also view the shares of Saga as among our favorites. The company is early in its transition toward digital and has a lot of headroom for enhanced revenue growth.
Figure #13 Radio Q1 YoY Revenue Growth
Source: Company filings
Figure #14 Radio Industry Q1 EBITDA Margin
Source: Company filings & Eikon
Figure #15 Radio Company Comparables
Source: Noble estimates & Eikon
Publishing
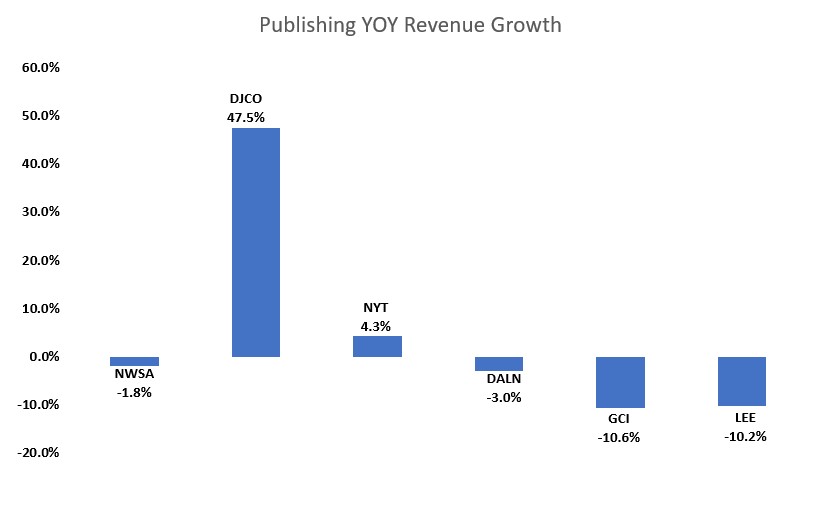
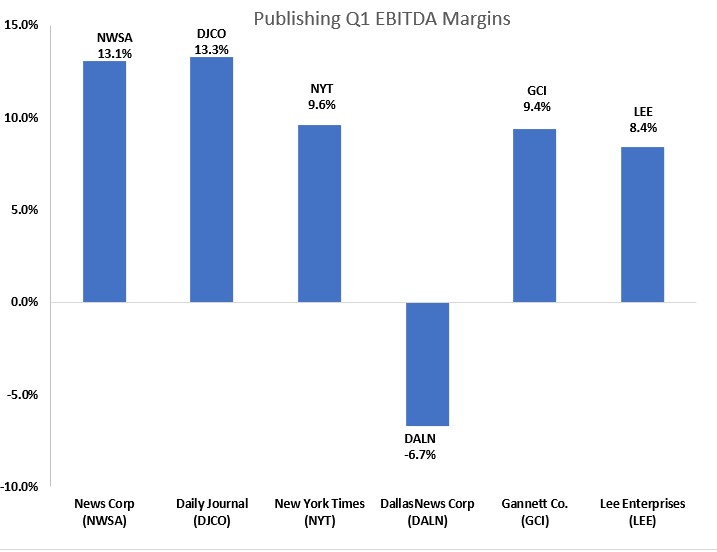
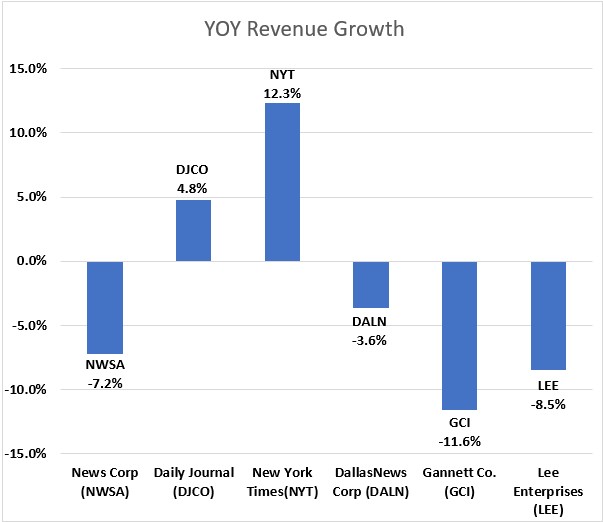
The Publishing industry is no exception to the advertising weakness that is impacting the broader Media landscape. As such, revenues are likely to continue to decline, despite an already weak performance in the first quarter of the year. Figure #16 Publishing Q1 YoY Revenue Growth illustrates the predominantly negative trends in the industry in the most recently reported quarter. The advertising challenges are hitting the traditional Print side of the publishing business hardest. For example, Lee Enterprises (LEE), one of our favorites in the industry, reported a 10% Print advertising revenue decline for the quarter ended March 31st, while Digital advertising grew a modest 2%. The company’s adj. EBITDA generation fell 15% compared with a more moderate 2% drop in total company revenues.
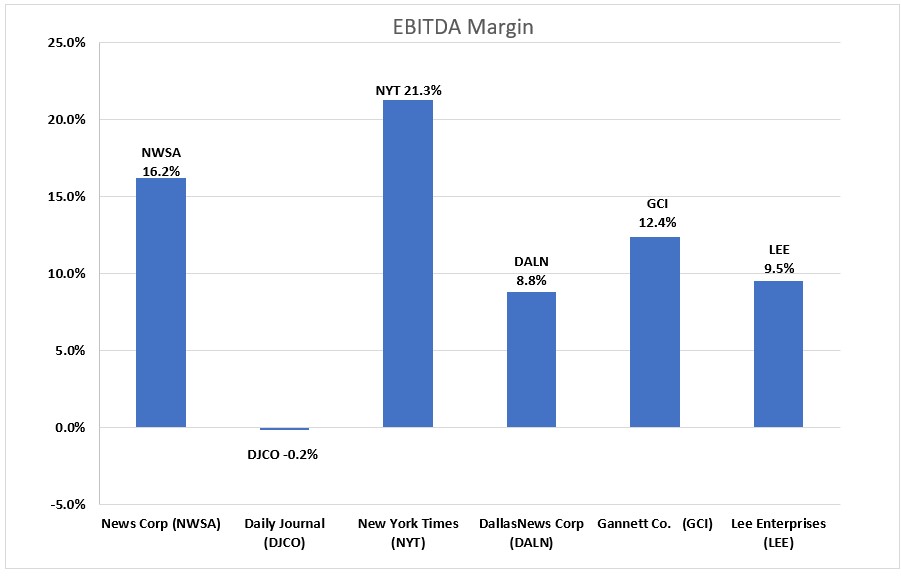
Not surprisingly, the dampened industry revenue resulted in lower industry cash flow generation with EBITDA margins averaging in the 10% range, as illustrated in Figure #17 Publishing Industry Q1 EBITDA Margins. Yet despite the constraints on cash flow generation on Lee and the other Publishers, we believe the companies have the ability to cut costs to help offset the pressure on cash flow generation. In particular, companies could cut costs in their Print manufacturing and distribution operations, reducing overhead in the same business segments where revenues are expected to lag. Publishing companies have a playbook on cutting legacy print costs and have the ability to maintain cash flow. However, cost cuts can take time to go into full effect, which could result in poor cash flow performance over the next quarter or so.
In spite of the nearer term economic headwinds impacting the operating performance of the industry, we believe that the industry is near an inflection point towards revenue growth. This dynamic is related to the degree of the recovery in its digital media businesses, a key driver to the industry’s overall revenue performance. While there are secular challenges to the industry’s print business, digital revenues account for an increasing portion of total revenues. For companies like Lee Enterprises, digital accounts for over 38% of total revenues in the most recent quarter. In our view, publishing companies will be a player in the advertising recovery as economic prospects improve. Furthermore, we believe that stock valuations are compelling.
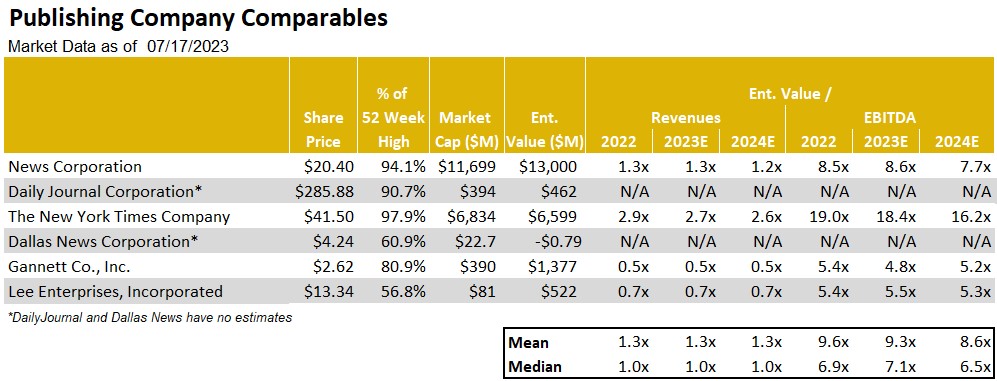
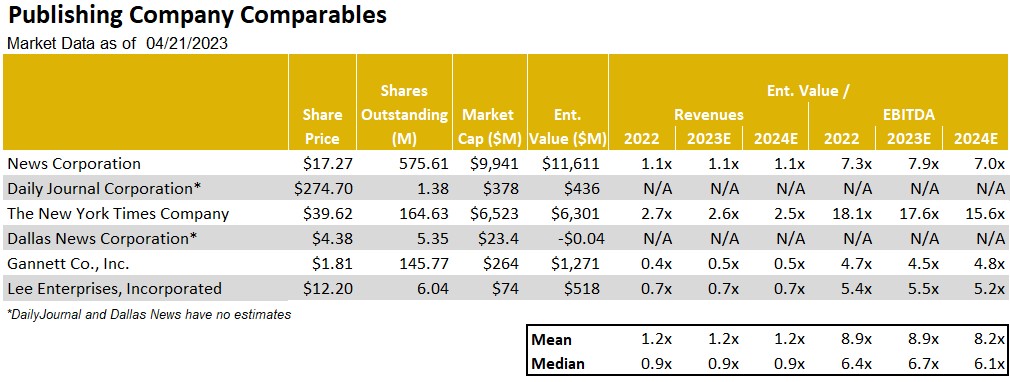
Figure #18 Publishing Company Comparables illustrates the Publishing companies trading levels. Notably, the New York Times (NYT) trades well above the levels of the rest of its peers. In comparison, Lee and Gannett appear to be compelling. However, both Lee and Gannett are highly levered. Yet, in our view, Lee’s debt profile has several favorable characteristics, such as a fixed 9% annual rate, no fixed principal payments, no performance covenants and a 25 year maturity. Given that the LEE shares trade near 5.3 times enterprise value to our 2024 adj. EBITDA forecast, we believe the shares offer limited downside risk. With a favorable Digital transformation of the business well underway, we believe the LEE shares could close the valuation gap with some of its higher trading peers. As such, the LEE shares represent one of our favorites in the industry, especially as the economic downturn bottoms out and the prospect for a recovery begins to come to the forefront. As such, the LEE shares are among our favorite recovery plays.
Figure #16 Publishing Q1 YoY Revenue Growth
Source: Company filings & Eikon
Figure #17 Publishing Industry Q1 EBITDA Margins
Source: Company filings & Eikon
Figure # 18 Publishing Company Comparables
Source: Noble estimates & Eikon
The following companies are highlighted in this report. Click on the links for additional information and disclosures.
All statements or opinions contained herein that include the words “we”, “us”, or “our” are solely the responsibility of Noble Capital Markets, Inc.(“Noble”) and do not necessarily reflect statements or opinions expressed by any person or party affiliated with the company mentioned in this report. Any opinions expressed herein are subject to change without notice. All information provided herein is based on public and non-public information believed to be accurate and reliable, but is not necessarily complete and cannot be guaranteed. No judgment is hereby expressed or should be implied as to the suitability of any security described herein for any specific investor or any specific investment portfolio. The decision to undertake any investment regarding the security mentioned herein should be made by each reader of this publication based on its own appraisal of the implications and risks of such decision.
This publication is intended for information purposes only and shall not constitute an offer to buy/sell or the solicitation of an offer to buy/sell any security mentioned in this report, nor shall there be any sale of the security herein in any state or domicile in which said offer, solicitation or sale would be unlawful prior to registration or qualification under the securities laws of any such state or domicile. This publication and all information, comments, statements or opinions contained or expressed herein are applicable only as of the date of this publication and subject to change without prior notice. Past performance is not indicative of future results. Noble accepts no liability for loss arising from the use of the material in this report, except that this exclusion of liability does not apply to the extent that such liability arises under specific statutes or regulations applicable to Noble. This report is not to be relied upon as a substitute for the exercising of independent judgement. Noble may have published, and may in the future publish, other research reports that are inconsistent with, and reach different conclusions from, the information provided in this report. Noble is under no obligation to bring to the attention of any recipient of this report, any past or future reports. Investors should only consider this report as single factor in making an investment decision.
IMPORTANT DISCLOSURES
This publication is confidential for the information of the addressee only and may not be reproduced in whole or in part, copies circulated, or discussed to another party, without the written consent of Noble Capital Markets, Inc. (“Noble”). Noble seeks to update its research as appropriate, but may be unable to do so based upon various regulatory constraints. Research reports are not published at regular intervals; publication times and dates are based upon the analyst’s judgement. Noble professionals including traders, salespeople and investment bankers may provide written or oral market commentary, or discuss trading strategies to Noble clients and the Noble proprietary trading desk that reflect opinions that are contrary to the opinions expressed in this research report. The majority of companies that Noble follows are emerging growth companies. Securities in these companies involve a higher degree of risk and more volatility than the securities of more established companies. The securities discussed in Noble research reports may not be suitable for some investors and as such, investors must take extra care and make their own determination of the appropriateness of an investment based upon risk tolerance, investment objectives and financial status.
Company Specific Disclosures
The following disclosures relate to relationships between Noble and the company (the “Company”) covered by the Noble Research Division and referred to in this research report. Noble is not a market maker in any of the companies mentioned in this report. Noble intends to seek compensation for investment banking services and non-investment banking services (securities and non-securities related) with any or all of the companies mentioned in this report within the next 3 months
ANALYST CREDENTIALS, PROFESSIONAL DESIGNATIONS, AND EXPERIENCE
Senior Equity Analyst focusing on Basic Materials & Mining. 20 years of experience in equity research. BA in Business Administration from Westminster College. MBA with a Finance concentration from the University of Missouri. MA in International Affairs from Washington University in St. Louis. Named WSJ ‘Best on the Street’ Analyst and Forbes/StarMine’s “Best Brokerage Analyst.” FINRA licenses 7, 24, 63, 87
WARNING
This report is intended to provide general securities advice, and does not purport to make any recommendation that any securities transaction is appropriate for any recipient particular investment objectives, financial situation or particular needs. Prior to making any investment decision, recipients should assess, or seek advice from their advisors, on whether any relevant part of this report is appropriate to their individual circumstances. If a recipient was referred to Noble Capital Markets, Inc. by an investment advisor, that advisor may receive a benefit in respect of transactions effected on the recipients behalf, details of which will be available on request in regard to a transaction that involves a personalized securities recommendation. Additional risks associated with the security mentioned in this report that might impede achievement of the target can be found in its initial report issued by Noble Capital Markets, Inc.. This report may not be reproduced, distributed or published for any purpose unless authorized by Noble Capital Markets, Inc..
RESEARCH ANALYST CERTIFICATION
Independence Of View All views expressed in this report accurately reflect my personal views about the subject securities or issuers.
Receipt of Compensation No part of my compensation was, is, or will be directly or indirectly related to any specific recommendations or views expressed in the public appearance and/or research report.
Ownership and Material Conflicts of Interest Neither I nor anybody in my household has a financial interest in the securities of the subject company or any other company mentioned in this report.
Michael Kupinski, Director of Research, Noble Capital Markets, Inc.
Jacob Mutchler, Research Associate, Noble Capital Markets, Inc.
Refer to the bottom of the report for important disclosures
Overview: Key takeaways from the NAB. Media investors are unpacking the information from the National Association of Broadcaster’s (NAB) convention. While there are promising new technologies that are sure to create shiny new objects to catch investor’s attention, particularly AI, the chatter is about the current advertising environment. Looking for the key takeaways? Sign up here for the virtual conference on April 27th.
Digital Media & Technology:Head fake? Every one of Noble’s Internet and Digital Media Indices not only finished the quarter up, but significantly outperformed the S&P 500. The best performing index was Noble’s Social Media Index, which increased by 70% in the first quarter of 2023, followed by Noble’s Ad Tech Index (+31%), MarTech Index (+30%), and Digital Media Index (+18%).
Television Broadcasting: Weak current revenue trends.While auto advertising appears to be faring better, the weight of the economic challenges appear to be causing further moderation in advertising. Will auto and, potentially Political, carry the second half 2023 revenue performance?
Radio Broadcasting: All out of love.The industry is reeling from a Wall Street research downgrade to an underperform on iHeart Media, which sent all radio stocks tumbling. Some stocks performed better than others. What’s behind the downgrade and which stocks performed better?
Publishing:Advertising takes a hit. After a period of moderating revenue trends, Publishers reported a weakened advertising environment. The downturn was due to Print advertising which took a nose dive. As a result, publishing companies implemented another round of expense cuts to bolster cash flow. There is a bright spot as Digital continues to perform strongly.
Overview
The NAB Show Stopper
Media investors are unpacking all of the information from last week’s National Association of Broadcaster’s (NAB) convention. There is a lot to digest given that there were over 1,400 exhibits, 140 new exhibitors this year. Because of the overwhelming number of exhibitors, many that go to Vegas for this annual convention do not go to the convention floor. It is a shame. There was a lot to see and learn. As Noble’s Media & Entertainment Analyst I walked the convention floor, which covers 4.6 million square feet of exhibit halls and meeting rooms. I stopped by booths and taped presentations to explain the new technologies, the plan for implementation of new services, and the prospect for revenue monetization. One important demonstration focused on the new broadcast standard, ATSC 3.0, the hope for a bright future for the television industry. This new standard should allow the industry to become more contemporary in terms of how its audience consumes video and information. In addition, it offers the ability for the industry to participate in new revenue streams, including Datacasting, which may become bigger than Retransmission revenue in the future.
In addition to touring the floor, I attended NAB panel discussions and hosted meetings with media management teams in a fireside chat format to discuss current business trends, the new technologies (including Artificial Intelligence (AI) and the new broadcast standard). In addition, these C-suite management teams provided their key takeaways from the NAB convention and offered why they participated in the conference this year. These discussions are available to you for free on Channelchek.com on April 27th in a virtual conference. In this upcoming Channelchek Takeaway Series on the NAB Show, I offer my key takeaways, including the current advertising outlook, my take on the monetization of the new technologies and what media investors should do now given the current economic and advertising environment. Your free registration to this informative event is available here.
This report highlights the performance of the media sectors over the past 12 months and past quarter. Overall, media stocks struggled in the past year, but there has been some improved quarterly performance, particularly in Digital Media and Broadcast Television, discussed later. All media stocks are struggling to offset losses over the course of the past year with trailing 12 months stocks down in the range of 5% on the low end to down 68% on the high end. The best performing sector in the past 12 months were Social Media stocks, down 5% versus the general market decline of 9% over the comparable period.
In the first quarter, stock performance was mixed. The best performers in the traditional media sectors were Broadcast Television stocks, up nearly 10% versus the general market which increased 7% in the comparable period. But, the individual TV stock performance reflected a different story, explained later in this report. The worse performer for the quarter were the radio stocks, driven by a Wall Street downgrade of one of the leading radio broadcasters. The Digital Media stocks had another good performance. We believe that stock performance will be a roller coaster for at least another quarter or two as the weight of the Fed rate increases begin to adversely affect the economy.
While National advertising has remained weak, we believe that Local advertising is now beginning to moderate as well. The Local advertising weakness appears to be in the smaller markets as well as the larger markets. This is somewhat different than the most recent economic cycles whereby the smaller markets were somewhat resilient. It seems that the smaller markets are feeling the adverse affects from inflation, rising employment costs and tightening bank credit. In our view, the disappointing advertising outlook likely will cause second quarter revenue estimates to come down, creating a difficult environment for media stocks. As such, we encourage investors to be opportunistic and take an accumulation approach to building positions for the prospective economic and advertising improvement. Our favorites have digital media exposure, given that we expect Digital Advertising (while softening as well) will be more resilient than traditional advertising mediums. Our favorites include Travelzoo (TZOO), Townsquare Media (TSQ), Harte Hanks (HHS), E.W. Scripps (SSP), and Direct Digital (DRCT).
Digital Media
Head fake?
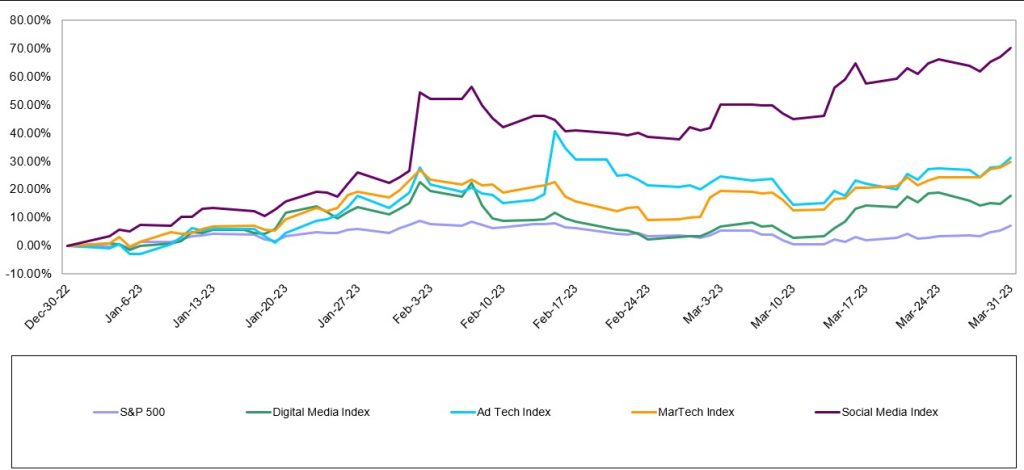
Last quarter we wrote that the S&P 500 increased for the first time since the fourth quarter of 2021 and that we were beginning to see signs of life in Noble’s Internet and Digital Media Indices as well. Those signs of life continued to bear fruit throughout the first quarter, as every one of Noble’s Internet and Digital Media Indices not only finished the quarter up, but significantly outperformed the S&P 500. Figure #1 LTM Digital Media Performance highlights that many of the Digital Media sectors are now approaching year earlier levels given the most recent favorable performance. The best performing index was Noble’s Social Media Index, which increased by 70% in the first quarter of 2023, followed by Noble’s Ad Tech Index (+31%), MarTech Index (+30%), and Digital Media Index (+18%).
Figure #1 LTM Digital Media Performance
Source: Capital IQ
Noble’s Indices are market cap weighted, and we attribute the strength of the Social Media Index to its largest constituent, Meta Platforms (META; a.k.a. Facebook) whose shares increased by 76% in the first quarter. Figure #2 Q1 Digital Media Performancehighlights the first quarter performance for the digital stocks.Meta’s management stirred interest in the shares from its 4Q 2022 earnings call when they spent most of their time talking about “efficiency”, which investors interpreted to mean that Meta was newly focused on profitability. After a relatively disastrous 3Q 2022 earnings call, after which shares fell by 25%, the company demonstrated on its 4Q 2022 earnings call that it clearly had gotten the message: investors were not enamored about the company’s plans in October 2022 to spend billions of dollars to develop its Metaverse initiatives. Rather, on its fourth quarter call, management focused on driving its short form video initiative, Reels (i.e., becoming more TikTok like), reducing its headcount by reducing layers of management, lowering its operating expenses and reducing its capital expenditures. Investors applauded this newfound focus on profitability and shares rebounded from a low of $88.90 per share in early November to $211.94 at the March quarter-end.
The next best performing index was Noble’s Ad Tech Index which increased by 31% during 1Q 2023. Fourteen of the 23 stocks in the index were up in the first quarter. Standouts during the quarter were Integral Ad Science (IAS; +62%) and Perion Networks (PERI; +56%). Integral Ad Science exceeded expectations in its fourth quarter results and guided to better-than-expected results in 1Q 2023. The company continues to expand its product suite, scale its social media offerings (i.e., for TikTok) and is well positioned to continue to benefit from the shift from linear TV to connected TV (CTV). Perion shares continued their winning: Perion was the only ad tech stock whose shares were up in 2022. Perion’s 56% increase in 1Q 2023 reflected beat on both revenues (by 2%) and EBITDA (by 10%) as well as improved guidance for 1Q 2023. Perion’s profitability increased significantly in 2022, with EBITDA nearly doubling (+90%) from 2021 ($70M) to 2022 ($132M).
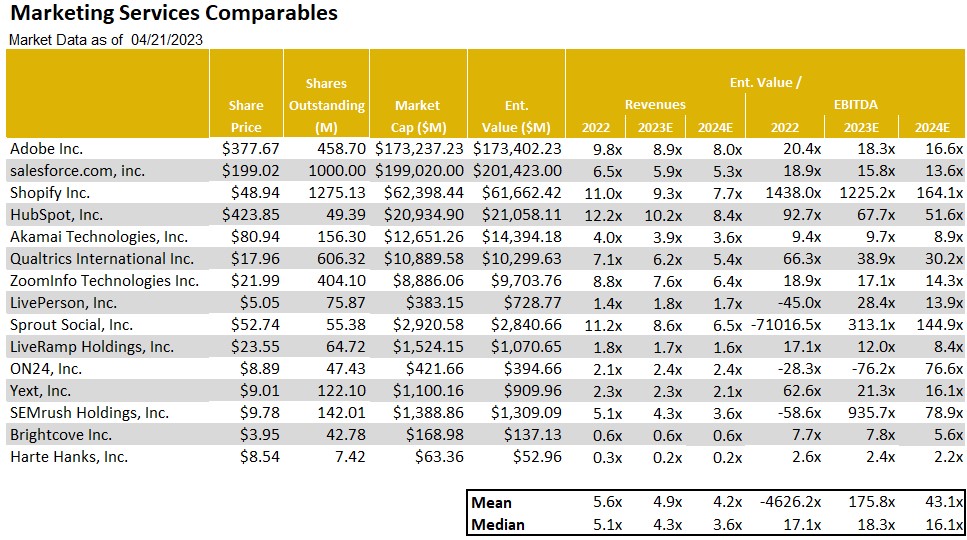
Noble’s MarTech Index increased by 30% with 14 of the 22 stocks in the index posting increases in 1Q 2023. The best performing stocks were Qualtrics (XM; +70%) Sprinklr (CXM; +59%), Salesforce (CRM; +51%), Hubspot (HUBS; +48%) and Yext (YEXT; +47%). Qualtrics agreed to be acquired for $12.5 billion by Silver Lake and the Canadian Pension Plan Investment Board, which came at a 73% premium to its 30-day volume weighted stock price. Sprinklr beat revenue expectations and significantly beat EBITDA expectations (doubling the Street expectations) and guided to a current year forecast that focuses more on efficiency and profitability.
MarTech stocks have been victims of their own success. Two years ago at this time the sector was trading at 11.3x forward revenue estimates, and a year ago the group was trading at 6.5x forward revenues. Today the group trades at 4x forward revenues and investors appear to be wading back into the sector. Figure #3 Marketing Tech Comparables highlights the compelling stock valuations.One of the laggards in the sector has been Harte Hanks (HHS), which declined 20% in the first quarter. We believe that the shares have not gained traction following the successful rebound toward profitability in 2022. The shares advanced a powerful 136% in 2022 from lows in May to highs achieved in August 2022. Since that time, investors appear to be taking chips off the table. In our view, the HHS shares appear to be oversold. Its business appears to be resilient. Given the recent weakness in the shares, the shares appear to be undervalued and offer a favorable risk reward relationship. As such, the HHS shares are among our favorites in the sector.
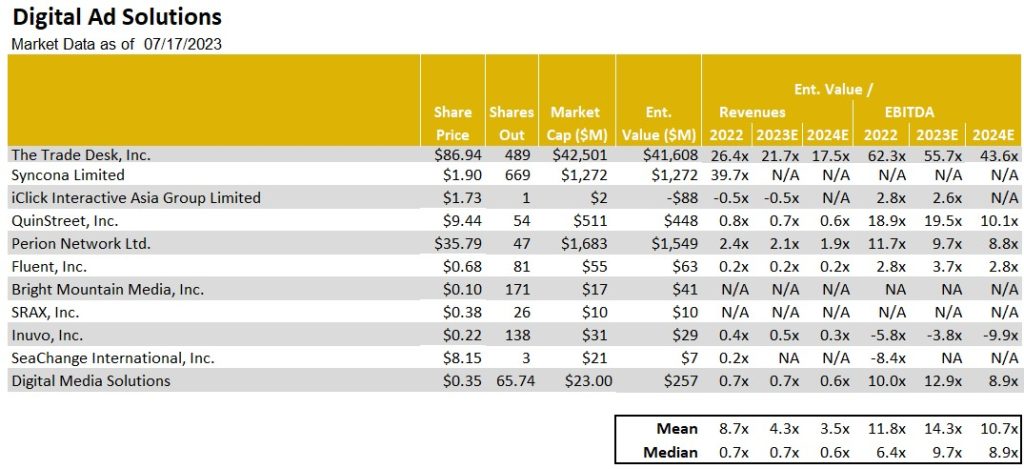
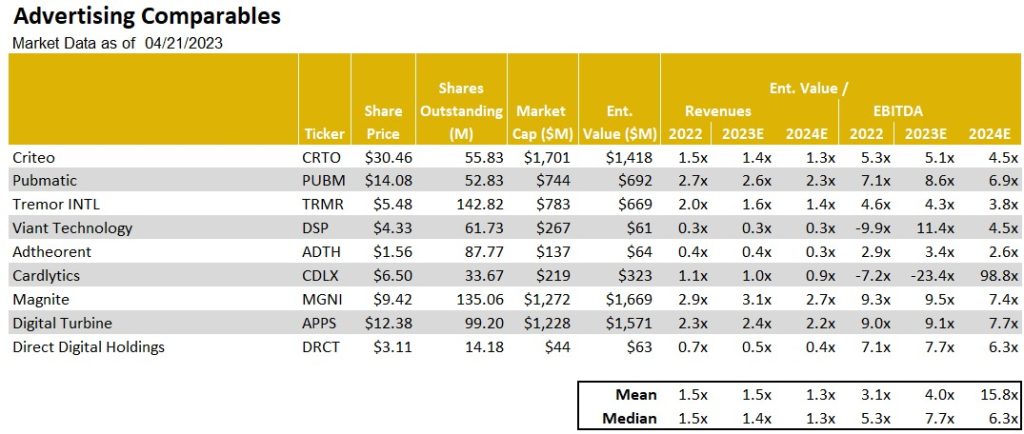
Another one of our current favorites is Direct Digital Holdings (DRCT). As Figure #4 Advertising Tech Comparables illustrates, the DRCT shares trade in line with the averages for the group at roughly 5.4 times 2024 adj. EBITDA. Notably, the company recently restated upward its 2022 full year revenue and adj. EBITDA results. Given the favorable operating momentum, we raised our full year 2023 and 2024 revenue and adj. EBITDA estimates, keeping our previous growth estimates. With the higher 2024 adj. EBITDA, we tweaked upward our price target from $5.50 to $6.00. Given a favorable fundamental outlook and compelling stock valuation, we view the shares as among our favorites.
Finally, Noble’s Digital Media Index, while lagging that of its digital peers at an 18% increase, significantly outperformed the S&P 500 (+7%), with a broad based recovery in which 9 of the sector’s 11 stocks increased during 1Q 2023. The best performing stock was Spotify (SPOT; +69%), whose revenues fell short of expectations by less than 1%, significantly beat consensus Street EBITDA expectations by $58M and more importantly pivoted towards demonstrating operating leverage. Spotify, which posted an EBITDA loss of nearly $500 billion in 2022, is expected to generate $650 billion in EBITDA in 2024, according to Street estimates. A deteriorating ad market in 2022 combined with higher interest rates likely prompted the company to shift its priorities to running a profitable company and doing it more quickly and with some urgency. The second best performing stock was Travelzoo (TZOO; +36%), as the company’s 4Q 2022 revenues and EBITDA increased by 31% and 328%, respectively. Notably, Travelzoo’s EBITDA came in 58% higher than Street consensus. The company appears to be benefiting from pent up travel demand for travel and management highlighted the opportunity for margin expansion in the coming quarters. Given the favorable outlook, we raised our price target to $10. Near current levels, the TZOO shares appear to offer above average returns and we reiterate our Outperform rating.
Figure #2 Q1 Digital Media Performance
Source: Capital IQ
Figure #3 Marketing Tech Comparables
Source: Eikon, Company filings & Noble estimates
Figure #4 Advertising Tech Comparables
Source: Eikon, Company filings & Noble estimates
Traditional Media
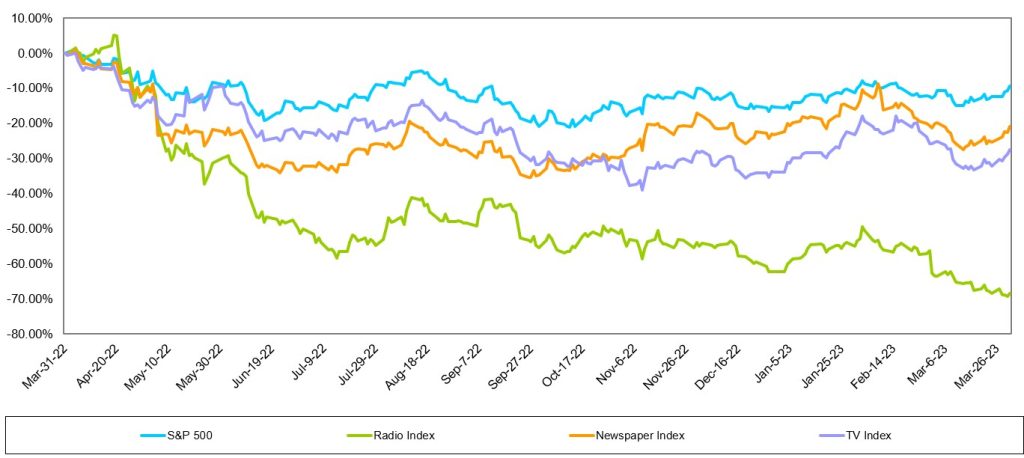
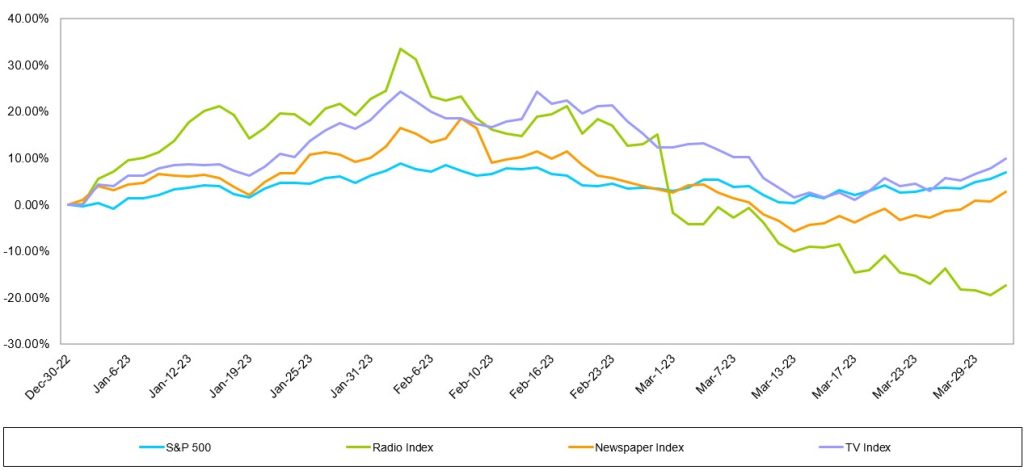
As Figure #5 LTM Traditional Media Performance illustrates, these stocks have struggled to gain sea legs, trending lower over the course of the past year. All traditional media sectors have underperformed over the past year, with Radio the poorest performing group. As Figure #6 Q1 Traditional Media Performance illustrates, only the TV Broadcast stocks edged out the general market performance in the latest quarter.
Figure #5 LTM Traditional Media Performance
Source: Capital IQ
Figure #6 Q1 Traditional Media Performance
Source: Capital IQ
Television Broadcast
Weak current revenue trends
As illustrated in the previous chart, the TV stocks outperformed the general market in the first quarter. This market cap weighted index masked the performance of many poor performing stocks in the quarter. Sinclair Broadcasting (SBGI; up 10%), Entravision (EVC; up a strong 26%), and Fox (FOX; up 12%) were among the best performing stocks and favorably influenced the TV index in the quarter. But, there were many poor performing stocks including E.W. Scripps (SSP; down 29%), Gray Television (GTN; down 22%) and Tegna (TGNA; down 20%). We believe that there was heightened interest in Entravision given its favorable Q1 results which was fueled by its fast growing Digital business. Figure #7 TV Q4 YoY Revenue Growth illustrates the Entravision’s Q4 revenue performance was among the best in the industry. While Entravision was among the best revenue performers, its margins are below that of its peer group as illustrated in Figure #8 TV Q4 EBITDA Margins. This is due to the accounting treatment of its Digital revenues given that it is an agency business. Given that Digital represents roughly 80% of the company’s total company revenue, we plan to put the EVC shares into the Digital Media sector to more accurately reflect its business. The poorer performing stocks are among the higher debt levered in the industry. As such, we believe the underperformance reflects concern of a slowing economy and investors flight to quality in the sector.
We do not believe that we are out of the woods with the TV stocks and the market is expected to be volatile. The advertising environment appears to be deteriorating given weakening economic conditions. There are bright spots which include some improvement in the Auto category. Dealerships appear to be stepping up advertising given higher inventory levels. In addition, broadcasters appear optimistic about Political advertising, which could begin in the third quarter 2023. There is a planned Republican presidential candidate debate scheduled in August. As such, there is some promise that candidates will advertise in advance of that debate and into the fourth quarter given the early primary season. We do not believe that Political and Auto will be enough to offset the weakness in National and in the weakening Local category. In our view, Q2 and full year 2023 estimates are likely to come down. Furthermore, we believe that broadcasters will be shy about predicting Political advertising even into 2024 given the past disappointments in management forecasts in the last Political cycle.
We encourage investors to take an accumulation approach to the sector. Notably, as Figure #9 TV Comparables highlights, nearly all of the stocks are trading near each other, with the exception of the larger media stocks. In our view, the valuations are near recession type valuations and appear to have limited downside risk. Our current favorite is E.W. Scripps (SSP). While the company is not immune to the current weak advertising environment, we believe that there is a favorable Retransmission revenue opportunity as 75% of its subscribers are due in the next 12 months. In addition, we believe that Retransmission margins will improve. Given the relatively small float for the shares, the SSP shares tend to underperform when the industry is out of favor, but then outperform when the industry is back in favor. In our view, the SSP shares offer a favorable risk/reward relationship and top our favorites in the sector.
Figure #7 TV Q4 YoY Revenue Growth
Source: Eikon & Company filings
Figure #8 TV Q4 EBITDA Margins
Source: Eikon & Company filings
Figure #9 TV Comparables
Source: Noble Estimates & Eikon
Radio Broadcasting
All out of love
The Radio stocks had another tough quarter, down 17% versus a 7% gain for the general market. Notably, there was a wide variance in the individual stock performance, with the largest stocks in the group having the worst performance in the quarter, including Audacy (AUD; down 40%), Cumulus Media (CMLS; down 41%) and iHeart Media (IHRT; down 36%). The first quarter stock performance did not appear to reflect the fourth quarter results. As Figure #10 Radio Industry Q4 YoY Revenue Growth illustrates, revenues were relatively okay, with some exceptions. Some of the larger Radio companies which have a large percentage of National advertising, underperformed relative to the more diversified Radio companies, especially those with a strong Digital segment presence. Figure #11 Radio Industry Q4 YoY EBITDA Margins illustrate that the margins for the industry remain relatively healthy.
The weakness in the Radio stocks was fueled in the quarter from a downgrade to under perform on the shares of iHeart by a Wall Street firm. Many radio stocks were down in sympathy. The analyst attributed the downgrade to the current macro environment and its heavy floating rate debt burden. The company is not expected to generate enough free cash flow to de-lever its balance sheet. We believe the downgrade as well as the excessive debt profile of Audacy, another industry leader which likely will need to restructure, sent all radio stocks tumbling. Some stocks performed better than others. While Cumulus Media’s debt profile is not as levered as iHeart or Audacy, the shares were caught in the net of a weak advertising outlook. Cumulus is among the most sensitive to National advertising, which currently continues to be weak.
Some of our favorite stocks which are diversified and have developing digital businesses performed better. Those stocks included Townsquare Media (TSQ; up 10%), and Salem Media (SALM; up 4%). Notably, while the shares of Beasley Broadcasting (BBGI) were down 10%, the shares performed better than the 17% decline for the industry in the quarter. Importantly, Beasley recently provided favorable updated Q1 guidance for the first quarter. Q1 revenues are expected to increase 1% to 2.5% and EBITDA growth is expected to be in the range of 40% to 50%, significantly better than our estimates. Furthermore, management provided a sanguine outlook for 2023 and 2024. Digital revenue is expected to reach 20% to 30% of total revenue with a goal of reaching 40% in 2024. By comparison, Digital revenue was 17% of total revenue in the fourth quarter 2022. Furthermore, the company is sitting on roughly $35 million in cash. It has opportunistically repurchased $10 million of its bonds at a significant discount. We believe that it is likely to maintain a strong cash position given the economic uncertainty.
We view Townsquare Media (TSQ), Salem Media (SALM) and Beasley Broadcast (BBGI) as among our favorites in the industry given the diverse revenue streams. While these companies are not immune to the economic headwinds, we believe that its Digital businesses should offer some ballast to its more sensitive Radio business. In the case of Salem, 30% of its revenues are relatively stable with block programming. As Figure #12 Broadcast Radio Comparables illustrates, the shares of Townsquare are among the cheapest in the industry, trading below peer group averages. Notably, the company instituted a hefty dividend. As a result, investors get paid while we await a favorable upturn in fundamentals. As such, the shares of TSQ tops our list of favorites.
Figure #10 Radio Industry Q4 YoY Revenue Growth
Source: Eikon & Company filings
Figure #11 Radio Industry Q4 YoY EBITDA Margins
Source: Eikon & Company filings
Figure #12 Broadcast Radio Comparables
Source: Noble estimates & Eikon
Publishing
Advertising takes a hit
After a period of moderating revenue trends, Publishers reported a weakened advertising environment. As illustrated in Figure #13 Publishing Industry YOY Revenue Growth, illustrates that revenue trends deteriorated with Print advertising taking a nose dive. This trend was illustrative in the results from Lee Enterprises, one of our current favorites in the sector. After a fiscal fourth quarter flat revenue performance, the company reported a 8.5% decline in its fiscal first quarter. The Q1 revenue performance reflected an 18.5% decrease in Print advertising, an acceleration in the rate of the 11% decline in the previous quarter.
The surprisingly weak quarter hit the company’s adj. EBITDA margins. Traditionally, Lee maintained some of the best margins in the industry. As Figure #14 Q4 Publishing Industry EBITDA Margins illustrates, the company fell in ranking to among the lowest in the sector. Importantly, in spite of the revenue weakness, the company maintains its previous adj. EBITDA guidance of $94 million to $100 million. To achieve its cash flow target in light of the soft revenue outlook, Lee implemented a round of expense cuts to bolster cash flow. Cost reductions are expected to result in $40 million of savings in FY23, and $60 million in annualized savings going forward. While we are disappointed that the company’s Print business is not moderating as previously expected, the company’s Digital businesses remain favorably robust. In addition, its Digital business is turning toward contributing margins. As such, we remain sanguine about the company’s digital transition.
As Figure #15 Publishing Comparables highlights, there is a wide gap between the valuation of the New York Times (NYT) and the rest of the industry, including Lee. While the highly debt levered shares of Gannett appear cheaper, we believe that Lee has a more favorable debt profile with a fixed 9% annual rate, no fixed principal payments, no performance covenants and a 25 year maturity. With the shares trading at 5.3 times our 2024 adj. EBITDA estimate compared with 15.4 times at the New York Times, we believe that there is limited downside risk in the LEE shares. Furthermore, we believe that the company is well positioned as economic and advertising prospects improve. Given the company’s favorable outlook for its Digital transition, we believe that the shares should close the gap in valuations with the leadership stock in the group. Consequently, the shares of LEE are among our favorite play for an improving economic outlook.
Figure #13 Publishing Industry YoY Revenue Growth
Source: Eikon & Company filings
Figure #14 Q4 Publishing Industry EBITDA Margins
Source: Eikon & Company filings
Figure #15 Publishing Comparables
Source: Noble estimates & Eikon
For more information on companies mentioned in this report click on the following:
All statements or opinions contained herein that include the words “we”, “us”, or “our” are solely the responsibility of Noble Capital Markets, Inc.(“Noble”) and do not necessarily reflect statements or opinions expressed by any person or party affiliated with the company mentioned in this report. Any opinions expressed herein are subject to change without notice. All information provided herein is based on public and non-public information believed to be accurate and reliable, but is not necessarily complete and cannot be guaranteed. No judgment is hereby expressed or should be implied as to the suitability of any security described herein for any specific investor or any specific investment portfolio. The decision to undertake any investment regarding the security mentioned herein should be made by each reader of this publication based on its own appraisal of the implications and risks of such decision.
This publication is intended for information purposes only and shall not constitute an offer to buy/sell or the solicitation of an offer to buy/sell any security mentioned in this report, nor shall there be any sale of the security herein in any state or domicile in which said offer, solicitation or sale would be unlawful prior to registration or qualification under the securities laws of any such state or domicile. This publication and all information, comments, statements or opinions contained or expressed herein are applicable only as of the date of this publication and subject to change without prior notice. Past performance is not indicative of future results. Noble accepts no liability for loss arising from the use of the material in this report, except that this exclusion of liability does not apply to the extent that such liability arises under specific statutes or regulations applicable to Noble. This report is not to be relied upon as a substitute for the exercising of independent judgement. Noble may have published, and may in the future publish, other research reports that are inconsistent with, and reach different conclusions from, the information provided in this report. Noble is under no obligation to bring to the attention of any recipient of this report, any past or future reports. Investors should only consider this report as single factor in making an investment decision.
IMPORTANT DISCLOSURES
This publication is confidential for the information of the addressee only and may not be reproduced in whole or in part, copies circulated, or discussed to another party, without the written consent of Noble Capital Markets, Inc. (“Noble”). Noble seeks to update its research as appropriate, but may be unable to do so based upon various regulatory constraints. Research reports are not published at regular intervals; publication times and dates are based upon the analyst’s judgement. Noble professionals including traders, salespeople and investment bankers may provide written or oral market commentary, or discuss trading strategies to Noble clients and the Noble proprietary trading desk that reflect opinions that are contrary to the opinions expressed in this research report. The majority of companies that Noble follows are emerging growth companies. Securities in these companies involve a higher degree of risk and more volatility than the securities of more established companies. The securities discussed in Noble research reports may not be suitable for some investors and as such, investors must take extra care and make their own determination of the appropriateness of an investment based upon risk tolerance, investment objectives and financial status.
Company Specific Disclosures
The following disclosures relate to relationships between Noble and the company (the “Company”) covered by the Noble Research Division and referred to in this research report. Noble is not a market maker in any of the companies mentioned in this report. Noble intends to seek compensation for investment banking services and non-investment banking services (securities and non-securities related) with any or all of the companies mentioned in this report within the next 3 months
ANALYST CREDENTIALS, PROFESSIONAL DESIGNATIONS, AND EXPERIENCE
Senior Equity Analyst focusing on Basic Materials & Mining. 20 years of experience in equity research. BA in Business Administration from Westminster College. MBA with a Finance concentration from the University of Missouri. MA in International Affairs from Washington University in St. Louis. Named WSJ ‘Best on the Street’ Analyst and Forbes/StarMine’s “Best Brokerage Analyst.” FINRA licenses 7, 24, 63, 87
WARNING
This report is intended to provide general securities advice, and does not purport to make any recommendation that any securities transaction is appropriate for any recipient particular investment objectives, financial situation or particular needs. Prior to making any investment decision, recipients should assess, or seek advice from their advisors, on whether any relevant part of this report is appropriate to their individual circumstances. If a recipient was referred to Noble Capital Markets, Inc. by an investment advisor, that advisor may receive a benefit in respect of transactions effected on the recipients behalf, details of which will be available on request in regard to a transaction that involves a personalized securities recommendation. Additional risks associated with the security mentioned in this report that might impede achievement of the target can be found in its initial report issued by Noble Capital Markets, Inc.. This report may not be reproduced, distributed or published for any purpose unless authorized by Noble Capital Markets, Inc..
RESEARCH ANALYST CERTIFICATION
Independence Of View All views expressed in this report accurately reflect my personal views about the subject securities or issuers.
Receipt of Compensation No part of my compensation was, is, or will be directly or indirectly related to any specific recommendations or views expressed in the public appearance and/or research report.
Ownership and Material Conflicts of Interest Neither I nor anybody in my household has a financial interest in the securities of the subject company or any other company mentioned in this report.
NEW YORK, March 22, 2023 /PRNewswire/ — Travelzoo® (NASDAQ: TZOO):
Revenue of $18.6 million, up 36% year-over-year
In constant currencies, revenue was $19.4 million, up 42% year-over-year
Non-GAAP consolidated operating profit of $4.8 million
Earnings per share (EPS) of $0.20
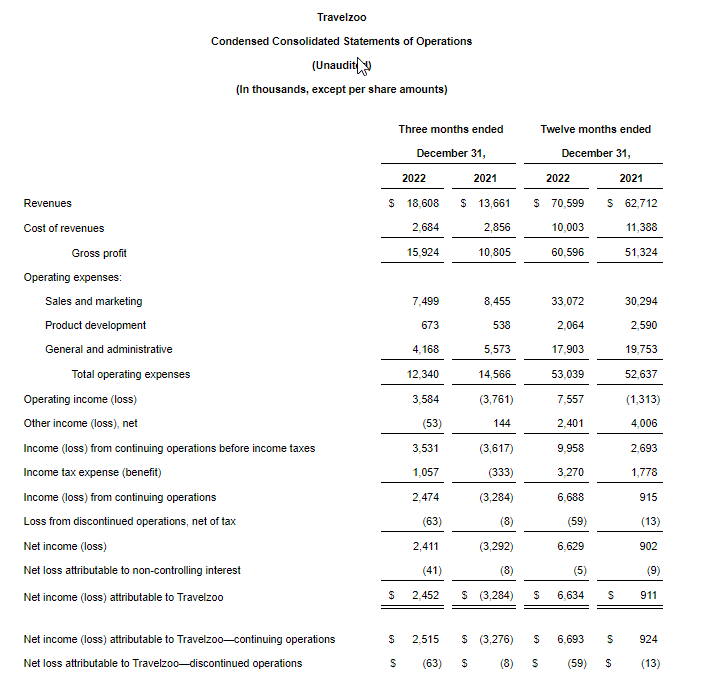
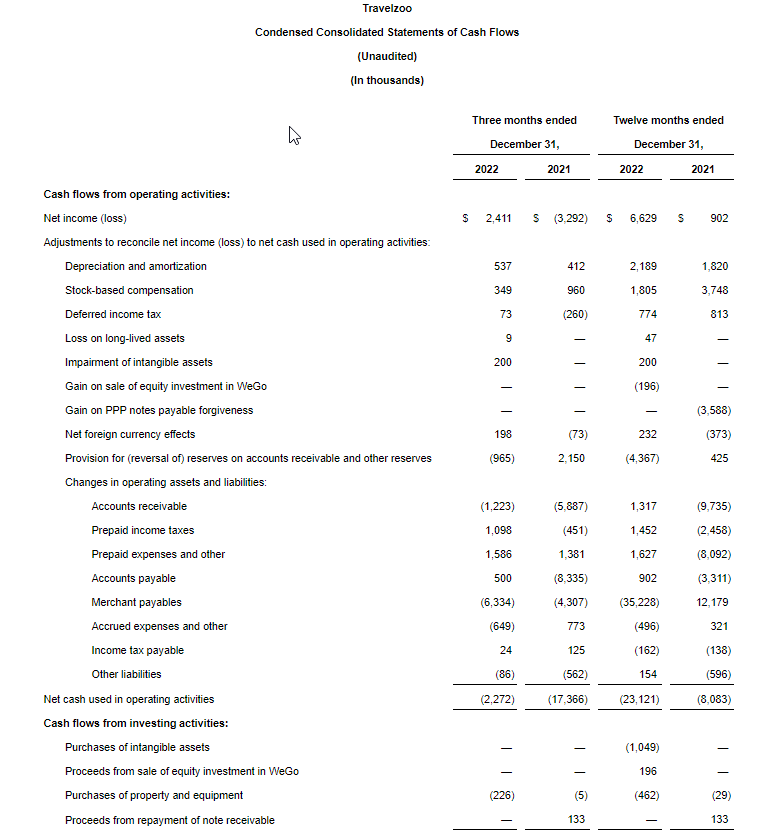
Travelzoo, a global Internet media company that provides exclusive offers and experiences for members, today announced financial results for the fourth quarter ended December 31, 2022. Consolidated revenue was $18.6 million, up 36% from $13.7 million year-over-year. In constant currencies, revenue was $19.4 million. Travelzoo’s reported revenue consists of advertising revenues and commissions, derived from and generated in connection with purchases made by Travelzoo members.
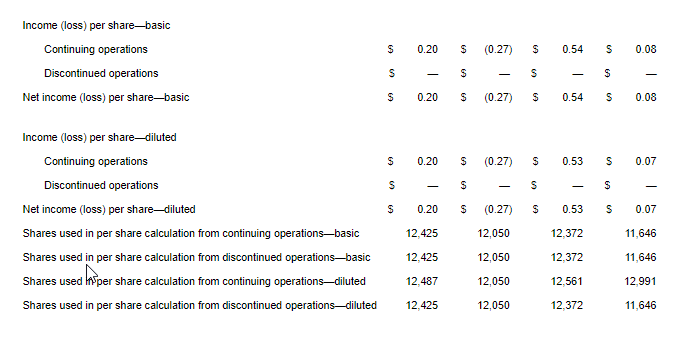
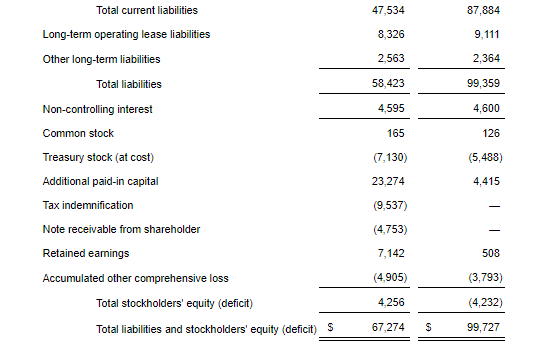
The reported net income attributable to Travelzoo from continuing operations was $2.5 million for Q4 2022. At the consolidated level, including minority interests, the reported net income from continuing operations was $2.5 million. EPS from continuing operations was $0.20, compared to EPS of ($0.27) in the prior-year period.
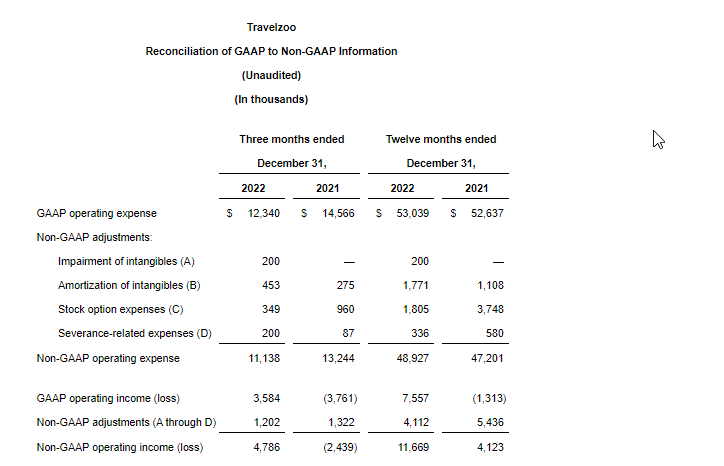
Non-GAAP operating profit was $4.8 million. The calculation of non-GAAP operating profit excludes impairment of intangible assets ($200,000), amortization of intangibles ($453,000), stock option expenses ($348,000) and severance-related expenses ($200,000). GAAP operating profit was $3.6 million. See section “Non-GAAP Financial Measures” below.
“Revenue growth accelerated in both North America and in Europe, leading to much stronger earnings,” said Holger Bartel, Travelzoo’s Global CEO. “As the recovery from the pandemic continues, we will leverage Travelzoo’s global reach and trusted brand to further improve earnings in future periods.”
“With more than 30 million members, 7 million mobile app users, and 4 million social media followers, Travelzoo is loved by travel enthusiasts who are affluent, active and open to new experiences.”
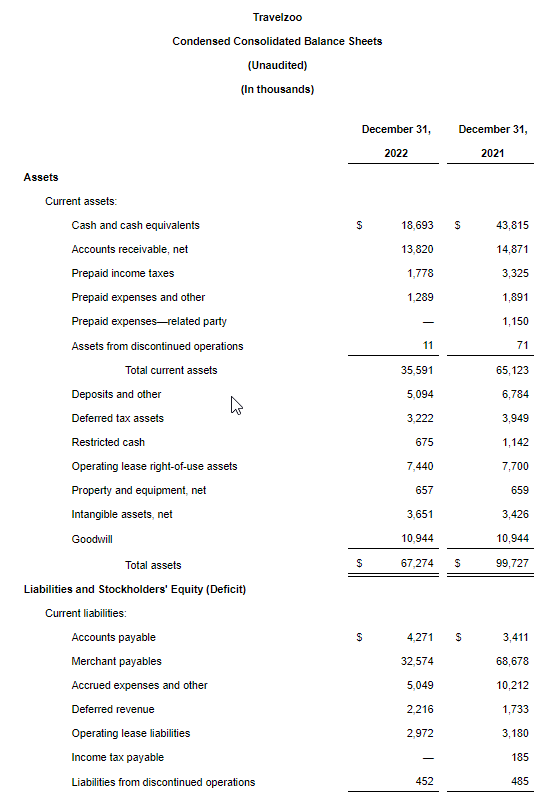
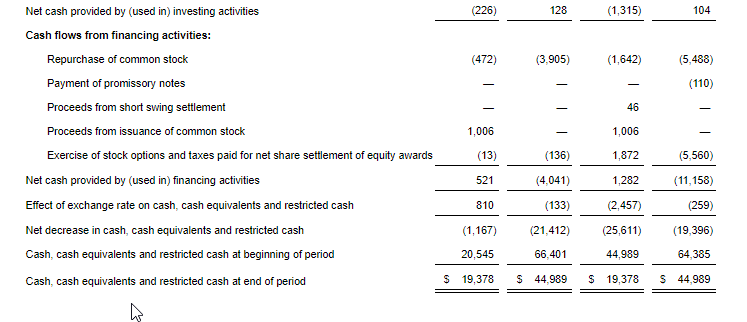
Cash Position As of December 31, 2022, consolidated cash, cash equivalents and restricted cash were $19.4 million. Net cash used in operations was $2.3 million for the three months ended December 31, 2022. Cash was used primarily in connection with a decrease of merchant payables by $6.3 million.
Reserve Reported revenues include a reserve of $1.3 million related to commissions to be earned from vouchers sold. The reserve is booked as contra revenue.
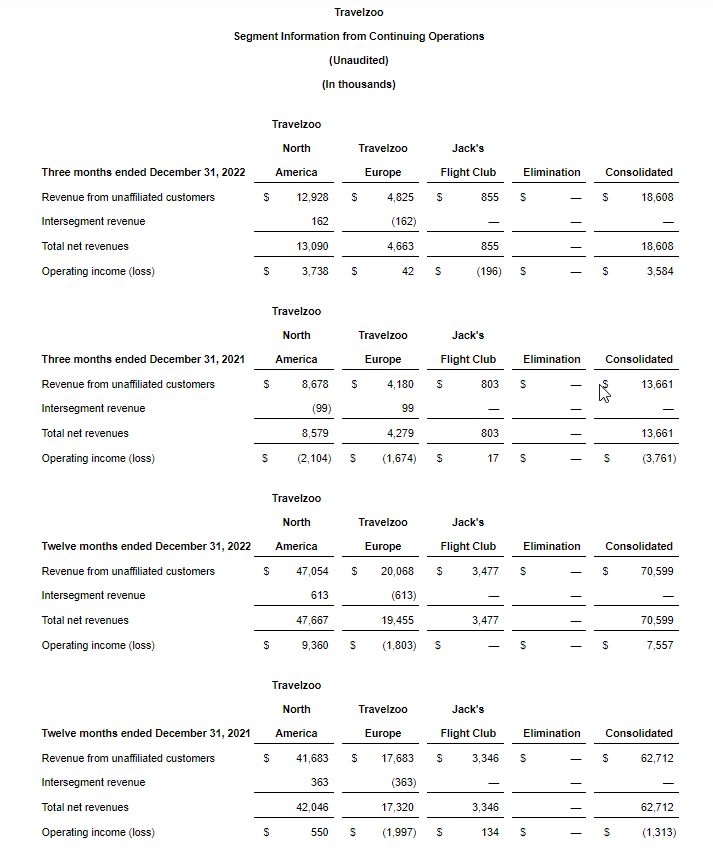
Travelzoo North America North America business segment revenue increased 53% year-over-year to $13.1 million. Operating profit for Q4 2022 was $3.7 million, or 29% of revenue, compared to an operating loss of $2.1 million in the prior-year period.
Travelzoo Europe Europe business segment revenue increased 9% year-over-year to $4.7 million. At constant currencies, Europe business segment revenue increased 23% year-over-year. Operating profit for Q4 2022 was $42,000, compared to an operating loss of $1.7 million in the prior-year period.
Jack’s Flight Club On January 13, 2020, Travelzoo acquired 60% of Jack’s Flight Club, a membership subscription service. Jack’s Flight Club revenue increased 6% year-over-year to $855,000. During Q4 2022, premium subscribers increased 27%. Revenue from increases in subscribers is reported with a lag because we recognize revenue from subscriptions monthly pro rata over the subscription period (quarterly, semi-annually, annually). Non-GAAP operating profit for Q4 2022 was $220,000, compared to a non-GAAP operating profit of $292,000 in the prior-year period. After consolidation with Travelzoo, Jack’s Flight Club’s net loss was $102,000, with $61,000 attributable to Travelzoo as a result of recording $200,000 of intangible assets impairment and $216,000 of amortization of intangible assets related to the acquisition.
Licensing In June 2020, Travelzoo entered into a royalty-bearing licensing agreement with a local licensee in Japan for the exclusive use of Travelzoo’s brand, business model, and members in Japan. In August of 2020, Travelzoo entered into a royalty-bearing licensing agreement with a local licensee in Australia for the exclusive use of Travelzoo’s brand, business models, and members in Australia, New Zealand, and Singapore. Under these arrangements, Travelzoo’s existing members in Australia, Japan, New Zealand, and Singapore will continue to be owned by Travelzoo as the licensor. Licensing revenue is booked with a lag of one quarter. Travelzoo recorded $7,000 in licensing revenue from the licensee in Australia, New Zealand, and Singapore in Q4 2022. Licensing revenue is expected to increase going forward.
Members and Subscribers As of December 31, 2022, we had 30.4 million members worldwide. In North America, the unduplicated number of Travelzoo members was 16.3 million as of December 31, 2022, down 4% from December 31, 2021. In Europe, the unduplicated number of Travelzoo members was 9.0 million as of December 31, 2022, up 8% from December 31, 2021. Jack’s Flight Club had 1.9 million subscribers as of December 31, 2022, up 8% from December 31, 2021.
Discontinued Operations As announced in a press release on March 10, 2020, Travelzoo decided to exit its Asia Pacific business and operate it as a licensing business going forward. Consequently, the Asia Pacific business has been classified as discontinued operations since March 31, 2020. Prior periods have been reclassified to conform with the current presentation. Certain reclassifications have been made for current and prior periods between the continued operations and the discontinued operations in accordance with U.S. GAAP.
Income Taxes Income tax expense was $1.1 million in Q4 2022, compared to an income tax benefit of $333,000 in the prior-year period.
Non-GAAP Financial Measures Management calculates non-GAAP operating income when evaluating the financial performance of the business. Travelzoo’s calculation of non-GAAP operating income, also called “non-GAAP operating profit” in this press release and today’s earnings conference call, excludes the following items: impairment of intangibles, amortization of intangibles, stock option expenses, and severance-related expenses. This press release includes a table which reconciles GAAP operating income to the calculation of non-GAAP operating income. Non-GAAP operating income is not required by, or presented in accordance with, generally accepted accounting principles in the United States of America (“GAAP”). This information should be considered as supplemental in nature and should not be considered in isolation or as a substitute for the financial information prepared in accordance with GAAP. In addition, these non-GAAP financial measures may not be the same as similarly titled measures reported by other companies.
Looking Ahead For Q1 2023, we currently expect higher revenue and profitability. During the pandemic, we have been able to lower our fixed costs. We believe we can keep our fixed costs relatively low in the foreseeable future.
Conference Call Travelzoo will host a conference call to discuss fourth quarter 2022 results today at 11:30 a.m. ET. Please visit http://ir.travelzoo.com/events-presentations to
download the management presentation (PDF format) to be discussed in the conference call
access the webcast.
About Travelzoo Travelzoo® provides its 30 million members with exclusive offers and one-of-a-kind experiences personally reviewed by our deal experts around the globe. We have our finger on the pulse of outstanding travel, entertainment, and lifestyle experiences. We work in partnership with more than 5,000 top travel suppliers—our long-standing relationships give Travelzoo members access to irresistible deals.
Certain statements contained in this press release that are not historical facts may be forward-looking statements within the meaning of Section 27A of the Securities Act of 1933 and Section 21E of the Securities and Exchange Act of 1934. These forward-looking statements may include, but are not limited to, statements about our plans, objectives, expectations, prospects and intentions, markets in which we participate and other statements contained in this press release that are not historical facts. When used in this press release, the words “expect”, “predict”, “project”, “anticipate”, “believe”, “estimate”, “intend”, “plan”, “seek” and similar expressions are generally intended to identify forward-looking statements. Because these forward-looking statements involve risks and uncertainties, there are important factors that could cause actual results to differ materially from those expressed or implied by these forward-looking statements, including changes in our plans, objectives, expectations, prospects and intentions and other factors discussed in our filings with the SEC. We cannot guarantee any future levels of activity, performance or achievements. Travelzoo undertakes no obligation to update forward-looking statements to reflect events or circumstances occurring after the date of this press release.
Travelzoo, Top 20, and Jack’s Flight Club are registered trademarks of Travelzoo.
RICHMOND, Va.–(BUSINESS WIRE)– Bowlero Corp., (NYSE: BOWL) the global leader in bowling entertainment, completed the acquisition of The Big Event in New Jersey on February 14th. This announcement marks the Company’s first completed acquisition in calendar year 2023, out of a robust pipeline of remaining acquisitions.
Brett Parker, President & Chief Financial Officer of Bowlero Corp., stated, “Today’s announcement illustrates our continued commitment to expanding our unit base and simultaneously improving our average unit volumes.”
The Big Event is located in Cherry Hill, NJ, 20 miles outside of Philadelphia. This impressive 36 lane center features billiards, ping pong, shuffleboard, arcade games and VIP private event rooms. The acquisition of The Big Event marks the Company’s 10th location in the state of New Jersey. This center opened under Bowlero Corp. management on Friday, February 17th.
Parker stated in closing, “We look forward to welcoming this center to our growing national footprint and, as always, we remain focused on growth while continuing to prioritize a world-class experience for our guests.”
Thus far in fiscal year 2023 Bowlero Corp completed 12 acquisitions.
About Bowlero Corp Bowlero Corp. is the global leader in bowling entertainment, media, and events. With more than 325 bowling centers across North America, Bowlero Corp. serves more than 30 million guests each year through a family of brands that includes Bowlero, Bowlmor Lanes, and AMF. In 2019, Bowlero Corp. acquired the Professional Bowlers Association, the major league of bowling, which boasts thousands of members and millions of fans across the globe. For more information on Bowlero Corp., please visit BowleroCorp.com
RICHMOND, Va.–(BUSINESS WIRE)– Bowlero Corp. (NYSE: BOWL) (“Bowlero” or the “Company”), the world’s largest owner and operator of bowling centers, will participate in the following investor conferences:
Raymond James Institutional Investors Conference on March 6, 2023
J.P. Morgan Global High Yield & Leveraged Finance Conference on March 7, 2023
Brett Parker, Vice Chairman, President & Chief Financial Officer of Bowlero, will participate in a fireside chat at 4:35 PM ET on Monday, March 6, 2023 at the Raymond James Institutional Investors Conference. He will also participate in a fireside chat at 2:00 PM ET on Tuesday, March 7, 2023 at the J.P. Morgan Global High Yield & Leverage Finance Conference. Mr. Parker will be available for meetings during both conferences.
If available, a live webcast and replay of the presentation will be posted to the Events & Presentations section of the Bowlero Investor Relations website at https://ir.bowlerocorp.com/overview/default.aspx.
About Bowlero Corp.
Bowlero Corp. is the worldwide leader in bowling entertainment. With more than 325 bowling centers across North America, Bowlero Corp. serves nearly 30 million guests each year through a family of brands that includes Bowlero and AMF. Bowlero Corp. is also home to the Professional Bowlers Association, which boasts thousands of members and millions of fans across the globe. For more information on Bowlero Corp., please visit BowleroCorp.com.
Michael Kupinski, Director of Research, Noble Capital Markets, Inc.
Patrick McCann, Research Associate, Noble Capital Markets, Inc.
Jacob Mutchler, Research Associate, Noble Capital Markets, Inc.
Refer to the bottom of the report for important disclosures
Overview: Entertainment and Leisure stocks have had a good start to the New Year, but the better performance has not erased the disaster that was 2022. We believe that stocks appear to be baking in a mild economic downturn, a soft landing, so to speak. Given that we are skeptic of the conventional thought, we take a cautious stance regarding the recent lift in valuations and encourage investors to take an accumulation approach.
Entertainment:Bowlero on a roll. The Noble Entertainment Index performed well, up 1.5% in the last 12 months, compared with negative returns for the S&P 500 (-7.1%). Although there were broad economic challenges over the past year, entertainment companies benefited from the general public’s return to “normal” following the COVID pandemic. We believe that in-person experiential entertainment recovery is still in its early stage and should continue into 2024.
Gaming: Looking for value in the rubble.The Noble Gaming Index is down 53.1% in the past year, well below the S&P 500, down 7.1%. But, recently, the Noble Gaming Index increased 12.9% in the last quarter, outperforming the 3.2% increase in the general market, as measured by the S&P 500 Index. A reflex bounce? Short squeeze? Or, were the shares oversold? We encourage investors to play it safe.
Esports: Motorsport Games revs its engine. The company was full steam ahead in investing in its new product launches in 2023, but it was running out of cash. Fortunately, a couple of favorable moves to add liquidity set the stock soaring, up 1,600% in one day, creating further opportunities to raise cash. Now, flush with cash, investors look toward the product rollouts.
Leisure: Travel to new heights. The U.S. Travel Association updated its 2023 outlook, projecting a resilient domestic leisure travel market. Consumers appear eager to splurge on travel, in spite of the economic headwinds. We focus on one of our favorite internet media plays, Travelzoo. The company recently updated Fourth Quarter 2022 guidance with revenues expected to be roughly $18.5 million, a strong 31% increase year over year.
Overview
Have economic prospects improved?
The Entertainment & Leisure industries performed better since the beginning of the year, providing some relief to the downturn that investors suffered in 2022. As Figure #1 Entertainment 12 Month Trailing Stock Performance highlights, the Entertainment and Leisure Indices are still recovering and many have yet to offset the 2022 declines, except for the Entertainment stocks. The Entertainment stocks not only have performed well in the first quarter, but have beat the general market as measured by the S&P 500 Index over the past year. The Noble Entertainment Index is up a modest 1.5% in the past year, better than the general market’s 7.1% decline. It is important to note that the Noble Indices are market cap weighted. As such, not all stocks reflected the favorable relative performance.
What is driving the improved stock performance in the latest quarter? We believe that investors have become more positive about the economic outlook, with conventional wisdom now anticipating a soft economic landing or a mild economic recession. This is a shift toward an optimistic tone from one that anticipated a severe economic recession. The Federal Reserve caused the dire outlook. The Fed signaled that it will continue to raise interest rates until inflation is arrested, in spite of the adverse impact on the economy and jobs. But, since then, conventional wisdom on the economy has brightened as inflation seems to have subsided. The more favorable economic outlook is exemplified by a Wall Street firm that decreased the risk of an economic recession in 2023 by a sizable 25%.
We tend to be skeptics and conservative. As such, we tend not to buy into strength. Our view is that the stocks were oversold and reflected recessionary type valuations. But, have the economic prospects really improved that much? We encourage investors to take an accumulation approach, focusing on some of our favorite stocks highlighted in this report, including Bowlero, Codere Online Luxembourg, Engine Gaming and Media, and Travelzoo.
Figure #1 Entertainment 12 Month Trailing Stock Performance
Source: Capital IQ
Entertainment
Bowlero on a roll
The Noble Entertainment Index performed well, up 1.5% in the last 12 months, compared with negative returns for the S&P 500 down 7.1%. Although there were broad economic challenges over the past year, entertainment companies benefited from the general public’s return to “normal” following the COVID pandemic. We believe that the trend toward social gathering and in-person activities are helping to offset broader macroeconomic headwinds. While some industries received a boost during late 2020 and 2021 when consumers were spending stimulus checks on online shopping, the recovery for in-person entertainment has been more recent. In our view, the recovery in experiential, in-person entertainment appears to be gaining traction and the recovery could continue into 2024.
As Figure #2 Entertainment Revenue Growth illustrates, virtually all of the experiential entertainment companies reported strong revenue growth in the latest reported quarter, (the calendar third quarter end September 2022). One of the examples of the in-person recovery is in bowling centers, in general, and Bowlero, specifically. The company recently announced that it eclipsed $1 billion in Trailing Twelve Month (TTM) revenue as of December 31, 2022, which included 48% same store sales growth over the prior year. Additionally, Bowlero added 40 bowling centers over the past 18 months as it continues to successfully execute on its roll-up strategy. As revenues have improved, so too have margins. As Figure #3 Entertainment EBITDA Marginsillustrates, Bowlero delivered industry leading margins in the latest reported quarter at 24.8%.
Bowlero is on a roll. With the BOWL shares up roughly 50% in the past 12 months, the shares have outperformed both the Noble Entertainment Index up 1.5%, as well as the broader market, as measured by the S&P 500, which decreased -7.1%. In spite of the favorable fundamental tailwind, the shares trade in line with its experiential entertainment peers. Figure #4 Entertainment Comparables illustrates that the BOWL shares trade at 9.7 times Enterprise Value to our estimated 2023 adj. EBITDA, below the peer average of 10.7 times, despite the company’s industry leading fundamentals. Given its favorable fundamental outlook, prospects for enhanced revenue and cash flow growth through acquisitions and favorable internal growth, and compelling stock valuation, the BOWL shares lead our list for favorites in the Entertainment industry.
Figure #2 Entertainment Revenue Growth
Source: Company 10Qs
Figure #3 Entertainment EBITDA Margins
Source: Company 10Qs
Figure #4 Entertainment Comparables
Source: Company filings and Noble estimates
Gaming
Looking for value in the rubble
The Noble Gaming Index is down 53.1% in the past year, well below the S&P 500, down 7.1%. In our view, the poor performance of Gaming stocks was the result of investors trying to take risk off the table. Many Gaming companies are still in developmental stages, with high marketing and customer acquisition costs. As such, many in the industry are unprofitable and rely on the balance sheets to fund operations. Before Covid, these companies benefited from the easy money policies and favorable capital markets, which many relied on for funding. But, with the recent sharp rise in interest rates and difficult general market conditions to raise capital, the music has stopped. Gaming stock valuations are now more scrutinized, in an environment of increasing cost of capital. As such, we believe industry players that are already profitable, and those with little to no debt and ample cash on the balance sheet are best positioned for to lead the industry.
Our focus is on the shares of Codere Online Luxembourg, CDRO. The CDRO shares are down 42.4% in the last year, underperforming the S&P 500’s -7.1% return. However, despite a tough 12-month period, the CDRO shares outperformed the Noble Gaming Index, which dropped 53.1%. We believe that the relative outperformance of the CDRO shares over the past year reflects its better financial position than most of its peers. Most recently, the Noble Gaming Index improved, as illustrated in Figure #5 Three Month Stock Performance. The Noble Gaming Index increased 12.9%, outperforming the 3.2% increase in the general market, as measured by the S&P 500 Index. A reflex bounce? Short squeeze? Or, were the shares oversold? It appears to be all the above for many of the stocks in the index. The largest gains were from companies that appeared to be struggling and had favorable news. We believe that investing in struggling companies with limited access to capital is a dangerous place to be.
In terms of Codere Online Luxembourg, the fundamentals of the company appear favorable. Codere Online’s cash burn has been within expectations and the company had a strong cash balance of €72 million and virtually no long-term debt as of September 30, 2022. As such, the company appears positioned to continue executing its growth strategy in Latin America, which for the time being consists of broadening its presence in key markets such as Mexico and Columbia, and aggressively expanding in Argentina.
The company’s growth could be bolstered if Brazil begins regulating sports betting in 2023. Importantly, Entain CEO Jette Nygaard-Anderson, recently stated that she expects Brazil to complete process of regulating sports betting in 2023, citing new administration of President Lula. In summary, Codere Online is distinguished from many of its peers, with an established foothold in key Latin American markets, flush with cash to penetrate existing markets and enter new ones. It has the ability to become the industry leader in many of its markets.
Near current levels, the iGaming industry peer group is trading at 5.0 times Enterprise Value to 2023 revenues, illustrated in Figure #6 Gaming Comparables. Codere Online Luxemburg (CDRO) is one of our favorite plays in the iGaming industry due to several factors. As mentioned above, the company has virtually no long-term debt and €72 million in cash, as of September 30, 2022. We believe that the company has a favorable runway to reach cash flow breakeven while continuing to fund its expansion in the meantime. Furthermore, in our view, given its ability to invest in its developing markets, the company appears to have the ability to become the preeminent online gambling leader in many Latin American markets. Finally, the CDRO shares appear compelling, trading near 2.6 times expected 2023 revenue, well below peers. As a result, we view the CDRO shares as among our favorite online gambling plays, with the shares rated Outperform with $9 price target.
Figure #5 Three Month Stock Performance
Source: Capital IQ
Figure #6 Gaming Comparables
Source: Company filings and Noble estimates
Esports
Motorsport revs its engine
The Noble Esports Index was down 53% over the past year, underperforming the broader market, which was down 7%, as as measured by the S&P 500 Index. Not unlike many other emerging industries, Esports has been battered by macroeconomic headwinds over the past year. Investors are placing more importance on companies that are generating positive cash flow, rather than speculating on future profitability, given recessionary concerns and elevated interest rates. While the Esports industry has shown favorable trends in the number of viewers and hours watched, many companies are still burning cash and may need to raise additional capital. Total hours watched of esports content was up 40% in Q3 of 2022, illustrated in Figure #7 Esports Viewership.
The best performing stock in the Esports index was HUYA, which only declined by 9.7% on a TTM basis. Huya is the largest Esports live streaming platform in China and recently expanded into a variety of real-time events. Huya benefits from the favorable growth trends of the Esports and live streaming industries, as it does not rely on the popularity of a single game or tournament. The worst performing stock in the Esports index is Esports Entertainment Group (GMBL), which declined 97.2% on a TTM basis. The company burned through its cash and had limited access to additional capital.
In the latest quarter, however, the Noble Esports Index rebounded, up a strong 47.9%, as depicted in the earlier in Figure #5 Three Month Stock Performance. The strength in the quarter was due to a relatively few number of stocks, including HUYA (up 135.8%) and two of our favorite plays, Motorsport Games (MSGM) and Engine Gaming and Media (GAME), which increased 68.9% and 149.8%, respectively. In fact, Motorsport Games increased a stunning 1,618.8% with a trading day following news of a debt for equity swap.
Motorsport Games revs its engine
Motorsport Games is a publisher of motorsport video games, with the rights to iconic racing franchises such as NASCAR and 24 Hour of LeMans. The company recently completed a debt for equity swap which led to a surprisingly strong increase in the stock valuation. This allowed the company to complete several direct offerings, eliminating all company debt and raising over $11 million in cash. The capital raise alleviated liquidity concerns, allowing the company to continue developing games. In our view, the launch of several games in 2023 should allow the company to swing toward cash flow break even. We have moved our rating to Market Perform given that the shares blew through our $9 price target. Our rating is under review as the company updates investors on its product rollout roadmap and the level of cash burn until it launches its upcoming products.
Engine Gaming & Media
Another one of our favorites is Engine Gaming & Media (GAME). Engine Gaming & Media is a multi-platform media company engaged in most aspects of the Esports industry. The company’s media division coordinates video access and advertising, data analytics, and connects advertisers to social influencers in the gaming industry. Figure #7 Esports Viewership and Figure #8 Esports Live Streaming are from Stream Hatchet, the company’s live streaming data and Esports analytics business.
The company reported its fiscal first quarter results on January 17, 2023, which beat our expectations. Notably, the company’s influencer and gaming analytics software as a service revenue, a key growth vehicle, grew revenue by a strong 34.6% on a year over year basis. In addition, the company plans to merge with GameSquare Esports, which it expects will provide scale and provide cost synergies. Management indicated that the combination should accelerate the new company’s path toward profitability. We plan to update our models as more details emerge regarding the upcoming merger.
Figure #9 Esports Comparables highlight the stock valuations in the Esports industry. The valuations of many of the stocks, including Motorsport Games and Engine Gaming and Media are in flux. As mentioned, Motorsport Games significantly improved its financial position with recent equity raises and debt for equity swaps. Engine Gaming and Media’s fundamentals likely will change with a planned merger. In our view, the latest quarter has been a watershed moment for these companies. We look forward toward reevaluating our models, ratings and price targets upon more details on the developments from the respective companies.
Figure #7 Esports Viewership
Source: Stream Hatchet
Figure #8 Esports Live Streaming
Source: Stream Hatchet
Figure #9 Esports Comparables
Source: Company filings and Noble estimates
Leisure
Travel to new heights
Once again, we focus on the travel industry in our Leisure section due to some favorable developments and outlook. Notably, the U.S. Travel Foundation forecasts an increase in travel spending in 2023 above both 2022 and 2019 levels. This would indicate that the travel industry has fully recovered from the depressed Covid impacted levels. Airline flights are full and there is high demand for hotels, even though pricing for those rooms are significantly higher. What is driving the demand and will it continue?
For the U.S., there are three factors influencing the relatively favorable outlook for the U.S. travel industry. The domestic leisure travel has been resilient in spite of higher gas prices, hotel rooms and airline tickets. A recent article from Forbes suggests that U.S. leisure travel is rebounding despite inflation as it is one area where people are willing to splurge. A second contributing factor to the favorable outlook is Business travel. Business travel is expected to be somewhat weaker in 2023 given the prospect of a mild economic recession in 2023. But, the business travel outlook is improved as a severe economic downturn appears less likely. The weak area has been international inbound travel to the U.S. We believe that this is a function of the strong U.S. dollar relative to other major currencies. On the flip side, international travel from the U.S. appears to be favorable given the U.S. dollar strength.
We believe that the inflationary trends, higher airline fares and hotel rates, as well as sluggish international travel, all have prompted travelers to seek travel deals. Consequently, one of our favorite plays on the travel industry, Travelzoo, has seen fundamental improvement. As an internet media company, its business is derived from its advertisers and travel partners to offer travel deals to its customers. This is different from travel suppliers and online travel agencies that rely on travel demand. Notably, Travelzoo recently updated its fourth quarter revenue guidance to be roughly $18.5 million, an increase of a strong 31% year over year, in line with our forecast.
Travelzoo is one of our favorite plays for the recovering travel industry. The shares are down roughly 46% in the past year, which we believe could present an attractive entry point for investors. Since reaching lows in December near $4.11 per share, the TZOO shares have rallied, up roughly 25% since that time. In our view, the shares may have reacted to a recent merger involving its founder, Ralph Bartel. The merger brought with it an influx of cash, but increased Mr. Bartels ownership of the company from slightly over 50% to over 60%. We view the move favorably as it provides increase liquidity for the company. Given the prospect for a favorable environment for travel deals, we view Travelzoo as among our favored ways to play the travel industry and the subsequent improved advertising from its travel partners. We rate the shares Outperform with a $9 price target.
Research reports on companies mentioned in this report are available by clicking below:
All statements or opinions contained herein that include the words “we”, “us”, or “our” are solely the responsibility of Noble Capital Markets, Inc.(“Noble”) and do not necessarily reflect statements or opinions expressed by any person or party affiliated with the company mentioned in this report. Any opinions expressed herein are subject to change without notice. All information provided herein is based on public and non-public information believed to be accurate and reliable, but is not necessarily complete and cannot be guaranteed. No judgment is hereby expressed or should be implied as to the suitability of any security described herein for any specific investor or any specific investment portfolio. The decision to undertake any investment regarding the security mentioned herein should be made by each reader of this publication based on its own appraisal of the implications and risks of such decision.
This publication is intended for information purposes only and shall not constitute an offer to buy/sell or the solicitation of an offer to buy/sell any security mentioned in this report, nor shall there be any sale of the security herein in any state or domicile in which said offer, solicitation or sale would be unlawful prior to registration or qualification under the securities laws of any such state or domicile. This publication and all information, comments, statements or opinions contained or expressed herein are applicable only as of the date of this publication and subject to change without prior notice. Past performance is not indicative of future results. Noble accepts no liability for loss arising from the use of the material in this report, except that this exclusion of liability does not apply to the extent that such liability arises under specific statutes or regulations applicable to Noble. This report is not to be relied upon as a substitute for the exercising of independent judgement. Noble may have published, and may in the future publish, other research reports that are inconsistent with, and reach different conclusions from, the information provided in this report. Noble is under no obligation to bring to the attention of any recipient of this report, any past or future reports. Investors should only consider this report as single factor in making an investment decision.
IMPORTANT DISCLOSURES
This publication is confidential for the information of the addressee only and may not be reproduced in whole or in part, copies circulated, or discussed to another party, without the written consent of Noble Capital Markets, Inc. (“Noble”). Noble seeks to update its research as appropriate, but may be unable to do so based upon various regulatory constraints. Research reports are not published at regular intervals; publication times and dates are based upon the analyst’s judgement. Noble professionals including traders, salespeople and investment bankers may provide written or oral market commentary, or discuss trading strategies to Noble clients and the Noble proprietary trading desk that reflect opinions that are contrary to the opinions expressed in this research report. The majority of companies that Noble follows are emerging growth companies. Securities in these companies involve a higher degree of risk and more volatility than the securities of more established companies. The securities discussed in Noble research reports may not be suitable for some investors and as such, investors must take extra care and make their own determination of the appropriateness of an investment based upon risk tolerance, investment objectives and financial status.
Company Specific Disclosures
The following disclosures relate to relationships between Noble and the company (the “Company”) covered by the Noble Research Division and referred to in this research report. Noble is not a market maker in any of the companies mentioned in this report. Noble intends to seek compensation for investment banking services and non-investment banking services (securities and non-securities related) with any or all of the companies mentioned in this report within the next 3 months
ANALYST CREDENTIALS, PROFESSIONAL DESIGNATIONS, AND EXPERIENCE
Senior Equity Analyst focusing on Basic Materials & Mining. 20 years of experience in equity research. BA in Business Administration from Westminster College. MBA with a Finance concentration from the University of Missouri. MA in International Affairs from Washington University in St. Louis. Named WSJ ‘Best on the Street’ Analyst and Forbes/StarMine’s “Best Brokerage Analyst.” FINRA licenses 7, 24, 63, 87
WARNING
This report is intended to provide general securities advice, and does not purport to make any recommendation that any securities transaction is appropriate for any recipient particular investment objectives, financial situation or particular needs. Prior to making any investment decision, recipients should assess, or seek advice from their advisors, on whether any relevant part of this report is appropriate to their individual circumstances. If a recipient was referred to Noble Capital Markets, Inc. by an investment advisor, that advisor may receive a benefit in respect of transactions effected on the recipients behalf, details of which will be available on request in regard to a transaction that involves a personalized securities recommendation. Additional risks associated with the security mentioned in this report that might impede achievement of the target can be found in its initial report issued by Noble Capital Markets, Inc.. This report may not be reproduced, distributed or published for any purpose unless authorized by Noble Capital Markets, Inc..
RESEARCH ANALYST CERTIFICATION
Independence Of View All views expressed in this report accurately reflect my personal views about the subject securities or issuers.
Receipt of Compensation No part of my compensation was, is, or will be directly or indirectly related to any specific recommendations or views expressed in the public appearance and/or research report.
Ownership and Material Conflicts of Interest Neither I nor anybody in my household has a financial interest in the securities of the subject company or any other company mentioned in this report.
Record-breaking revenue performance bolstered by TTM Same Store Sales Growth of approximately 48% year over year1
TTM revenue exceeds the $878 million revenue projection from December 2021 go-public transaction by more than $122 million or 14%
MoneyBowl™, the Company’s proprietary skill-based gamification app, is expected to be active in 27 centers by January 13, 2023, and is already operational in 16 locations
Bowlero added 40 bowling centers over the last 18 months, ending Q2 of FY23 with 326 locations
RICHMOND, Va.–(BUSINESS WIRE)– Bowlero Corp. (NYSE: BOWL) (“Bowlero” or the “Company”), the world’s largest owner and operator of bowling centers, today provided a preliminary business update covering activity through January 1, 2023, the close of its second quarter of fiscal year 2023.2
Bowling Center Trailing 13-week Revenue Growth Trend (Graphic: Business Wire)
The Company’s revenue exceeded $1.0 billion on a trailing twelve month basis, marking a major milestone in the Company’s history following record revenue generation throughout calendar year 2022. This performance was driven by strong ongoing demand for bowling, the country’s largest participatory sport, across the portfolio exemplified by Bowlero’s same store sales growth of approximately 48% year over year. In particular, the TTM revenue performance was fueled by dramatic year over year growth in events and continued strong performance from walk-in retail and leagues.
The Company’s deployment of Moneybowl™ continues to gain momentum, growing from two locations on November 16, 2022 to an expected 27 locations by January 13, 2023.
Bowling center additions remain a significant factor in driving total revenue growth. Since June 28, 2021, Bowlero has added 40 new centers and has grown its operating center count by 14%. Of the 40 centers added, two locations were new builds and 38 were acquisitions. The pipeline for new locations remains robust.
Thomas Shannon, Founder and Chief Executive Officer, stated, “The last twelve months have been transformational for Bowlero. Exceeding $1.0 billion in TTM revenue is a remarkable milestone for the Company, capping off a year of notable accomplishments. We ended December of 2022 with 326 locations, after continuing our robust unit addition plan. We launched MoneyBowl™, and it should be in pilot at 27 locations, almost ten percent of our footprint, by the end of this week. These accomplishments were almost unimaginable when we operated only six centers back in 2013, and they are a testament to our world-class team and our relentless pursuit of providing world-class experiences across our growing portfolio of nearly 330 centers and maximizing shareholder value.”
Bowling Center Trailing 13-week Revenue Growth Trend3
[Please see Bowling Center Trailing 13-week Revenue Growth Trend]
About Bowlero Corp.
Bowlero Corp. is the worldwide leader in bowling entertainment. With more than 325 bowling centers across North America, Bowlero Corp. serves nearly 30 million guests each year through a family of brands that includes Bowlero and AMF. Bowlero Corp. is also home to the Professional Bowlers Association, which boasts thousands of members and millions of fans across the globe. For more information on Bowlero Corp., please visit BowleroCorp.com.
Forward Looking Statements
This press release contains “forward-looking statements” within the meaning of the “safe harbor” provisions of the Private Securities Litigation Reform Act of 1995 that involve risk, assumptions and uncertainties, such as statements of our plans, objectives, expectations, intentions and forecasts. These forward-looking statements are generally identified by the use of forward-looking terminology, including the terms “anticipate,” “believe,” “confident,” “could,” “estimate,” “expect,” “intend,” “may,” “plan,” “possible,” “potential,” “predict,” “project,” “should,” “target,” “will,” “would” and, in each case, their negative or other various or comparable terminology. These forward-looking statements reflect our views with respect to future events as of the date of this press release and are based on our management’s current expectations, estimates, forecasts, projections, assumptions, beliefs and information. Although management believes that the expectations reflected in these forward-looking statements are reasonable, it can give no assurance that these expectations will prove to have been correct. All such forward-looking statements are subject to risks and uncertainties, many of which are outside of our control, and could cause future events or results to be materially different from those stated or implied in this press release. It is not possible to predict or identify all such risks. These risks include, but are not limited to: the impact of COVID-19 pandemic and any future outbreaks of contagious diseases on our business; our ability to design and execute our business strategy; changes in consumer preferences and buying patterns; our ability to compete in our markets; the occurrence of unfavorable publicity; risks associated with long-term non-cancellable leases for our centers; our ability to retain key managers; risks associated with our substantial indebtedness and limitations on future sources of liquidity; our ability to carry out our expansion plans; our continued ability to produce content, build infrastructure and market Professional Bowlers Association (“PBA”) events; our ability to successfully defend litigation brought against us; our ability to adequately obtain, maintain, protect and enforce our intellectual property and proprietary rights and claims of intellectual property and proprietary right infringement, misappropriation or other violation by competitors and third parties; failure to hire and retain qualified employees and personnel; the cost and availability of commodities and other products we need to operate our business; cybersecurity breaches, cyber-attacks and other interruptions to our and our third-party service providers’ technological and physical infrastructures; catastrophic events, including war, terrorism and other conflicts; public health issues or natural catastrophes and accidents; changes in the regulatory atmosphere and related private sector initiatives; fluctuations in our operating results; economic conditions, including the impact of increasing interest rates, inflation and recession; and other risks, uncertainties and factors described under the section titled “Risk Factors” in the Company’s Annual Report on Form 10-K filed with the U.S. Securities and Exchange Commission (the “SEC”) by the Company on September 15, 2022, as well as other filings that the Company will make, or has made, with the SEC, such as Quarterly Reports on Form 10-Q and Current Reports on Form 8-K. These factors should not be construed as exhaustive and should be read in conjunction with the other cautionary statements that are included in this press release and in other filings. We expressly disclaim any obligation to publicly update or review any forward-looking statements, whether as a result of new information, future developments or otherwise, except as required by applicable law.
1Same-store sales are measured by comparing revenues for centers open for the entire duration of both the current and comparable measurement periods.
2Our independent registered public accounting firm has not completed its review of our results for our second quarter ended on January 1, 2023. The revenue amounts for this quarter are preliminary estimates of the results of operations that we expect to report for our second quarter ended on January 1, 2023. Our actual results may differ from these estimates due to the completion of our financial closing procedures, final adjustments and other developments that may arise between now and the time the financial results for our second quarter are finalized.
3Revenue growth is calculated as the growth in Bowling Center Revenue compared to the comparable week during the pre-pandemic 52-week period beginning March 2019 and ending February 2020. Total Bowling Center Revenue (i) excludes media-related revenue and closed bowling centers from both current period and pre-pandemic and prior year periods and (ii) includes new bowling centers that have opened since March 2020. For weeks ending between September 26, 2021 and December 26, 2021, the percentages above are calculated by comparing each week to the comparable week in 2019. For weeks ending between January 2, 2022 and February 27, 2022, the percentages above are calculated by comparing each week to the comparable week in 2020. For weeks ending between March 6, 2022 and January 1, 2023, the percentages above are calculated by comparing each week to the comparable week in 2019. Total Bowling Center Revenue for each date is the 13-week rolling average of weekly Total Bowling Center Revenue. We use the 13-week rolling average because the revenue performance in individual weeks can be positively or negatively impacted by timing shift of holiday/sporting events, holidays moving to weekends, and extreme weather events. Data for all weeks following the close of the quarter ended on October 2, 2022 are preliminary and have not been audited or reviewed and are forward-looking statements based solely on information available to us as of the date of this announcement.
Adds Great Escape in Pleasant Hill, Iowa to Growing Portfolio
RICHMOND, Va.–(BUSINESS WIRE)– Bowlero Corp., (NYSE: BOWL) the global leader in bowling entertainment, announced today that it has completed the acquisition of Great Escape in Iowa. This is the Company’s 15th completed acquisition in calendar year 2022, bringing the Company’s total center count to 326.
Great Escape, located in Pleasant Hill, a suburb of Des Moines, is a 24-lane bowling center featuring laser tag, over 50 arcade games, virtual reality, and a full-service restaurant. Great Escape marks the Company’s second acquisition in Iowa this calendar year, the first being Thunderbowl located in Council Bluffs.
Brett Parker, President & Chief Financial Officer of Bowlero Corp. stated, “The addition of Great Escape is another exciting acquisition for Bowlero. We remain committed to bringing our guests a world-class entertainment experience, and furthering our presence nationwide.”
Great Escape is expected to open under Bowlero Corp. management on December 9th.
About Bowlero Corp Bowlero Corp. is the global leader in bowling entertainment, media, and events. With more than 300 bowling centers across North America, Bowlero Corp. serves more than 27 million guests each year through a family of brands that includes Bowlero, Bowlmor Lanes, and AMF. In 2019, Bowlero Corp. acquired the Professional Bowlers Association, the major league of bowling, which boasts thousands of members and millions of fans across the globe. For more information on Bowlero Corp., please visit BowleroCorp.com
RICHMOND, Va.–(BUSINESS WIRE)– Bowlero Corp. (NYSE: BOWL) (“Bowlero”), the global leader in bowling entertainment, announced today that management will participate in The UBS Global TMT Conference taking place December 5-7, 2022 at the Sheraton New York Times Square Hotel in New York, NY.
Brett Parker, President & Chief Financial Officer of Bowlero, will participate in a fireside chat at 3:50 PM ET on Tuesday, December 6, 2022. Mr. Parker will also be available for meetings during the conference.
For more information, or to request a meeting with management, please reach out to your UBS representative.
About Bowlero Corp
Bowlero Corp. is the global leader in bowling entertainment, media, and events. With more than 300 bowling centers across North America, Bowlero Corp. serves more than 27 million guests each year through a family of brands that includes Bowlero, Bowlmor Lanes, and AMF. In 2019, Bowlero Corp. acquired the Professional Bowlers Association, the major league of bowling, which boasts thousands of members and millions of fans across the globe. For more information on Bowlero Corp., please visit BowleroCorp.com.
SANTA MONICA, Calif.–(BUSINESS WIRE)– Entravision Communications Corporation (NYSE: EVC), a leading global advertising solutions, media and technology company, today announced financial results for the three- and nine-month periods ended September 30, 2022.
Third Quarter 2022 Highlights
Record third quarter advertising revenue
Net revenue up 21% over the prior-year quarter
Net income attributable to common stockholders down 23% over the prior-year quarter
Consolidated adjusted EBITDA up 12% over the prior-year quarter
Operating cash flow up 62% over the prior-year quarter
Free cash flow down 31% over the prior-year quarter
Quarterly cash dividend of $0.025 per share
“Entravision continued to see progress in the third quarter of 2022, with revenue up 21% versus the prior-year period. Adjusted EBITDA also improved double-digits, increasing 12% year-over-year,” said Walter Ulloa, Chairman and Chief Executive Officer. “Entravision’s strength throughout the quarter was again driven by our digital segment, where revenue improved 29% versus the third quarter of 2021. In our television and audio businesses, political ad spend, in particular, continued to perform strongly.”
Mr. Ulloa continued, “Entravision’s solid performance in the third quarter, together with our progress year-to-date, demonstrates the resiliency and growth of our business in a tough macro environment. We continue to strategically expand across the globe and now have operations in 40 countries across five continents in service of more than 7,000 clients. We are thoughtfully positioning our digital teams in emerging economies where Entravision’s unique offerings have a key first-mover advantage and where a critical mass of connected consumers exists alongside a growing advertising industry. We remain optimistic in finding multiple growth opportunities around the world for our digital business and look forward to sharing our progress as we continue to grow and expand globally.”
Quarterly Cash Dividend
The Company announced today that its Board of Directors approved a quarterly cash dividend to shareholders of $0.025 per share on the Company’s Class A, Class B and Class U common stock, in an aggregate amount of approximately $2.1 million. The quarterly dividend will be payable on December 30, 2022 to shareholders of record as of the close of business on December 15, 2022, and the common stock will trade ex-dividend on December 14, 2022. The Company currently anticipates that future cash dividends will be paid on a quarterly basis; however, any decision to pay future cash dividends will be subject to approval by the Board.
Non-GAAP Financial Measures
This press release contains certain non-GAAP financial measures as defined by SEC Regulation G. The GAAP financial measure most directly comparable to each of these non-GAAP financial measures, and a table reconciling each of these non-GAAP financial measures to its most directly comparable GAAP financial measure is included beginning on page 10.
Net revenue in the third quarter of 2022 totaled $241.0 million, up 21% from $199.0 million in the prior-year period. Of the overall increase, approximately $42.8 million was attributable to our digital segment and was primarily due to advertising revenue growth from our digital commercial partnerships business, and due to our investment in a variable interest entity during the third quarter of 2022 and our acquisition of 365 Digital during the fourth quarter of 2021, neither of which contributed to net revenue in the comparable period ended September 30, 2021. In addition, of the overall increase, approximately $0.1 million was attributable to our audio segment, primarily due to increases in political advertising revenue and local advertising revenue, partially offset by a decrease in national advertising revenue. The overall increase was partially offset by a decrease of approximately $0.8 million attributable to our television segment, primarily due to decreases in local and national advertising revenue, and a decrease in retransmission consent revenue. These decreases were mainly attributed to the expiration of our Univision and UniMás network affiliation agreements in Orlando, Tampa and Washington, D.C. on December 31, 2021. The decrease in our television segment revenue was partially offset by increases in political advertising revenue and spectrum usage rights revenue.
Cost of revenue in the third quarter of 2022 totaled $157.1 million, up 26% from $124.3 million in the prior-year period. The increase was primarily due to increased cost of revenue related to advertising revenue growth from our digital commercial partnerships business, and due to our investment in a variable interest entity during the third quarter of 2022 and our acquisition of 365 Digital during the fourth quarter of 2021, neither of which incurred cost of revenue for us in the comparable period ended September 30, 2021.
Operating expenses in the third quarter of 2022 totaled $49.3 million, up 14% from $43.1 million in the prior-year period. Of the overall increase, approximately $5.9 million was attributable to our digital segment and was primarily due to an increase in expenses associated with the increase in digital advertising revenue, an increase in salary expense and our investment in a variable interest entity during the third quarter of 2022 and our acquisition of 365 Digital during the fourth quarter of 2021, which did not incur operating expenses for us in the comparable period. Additionally, of the overall increase in operating expenses, approximately $0.4 million was attributable to our audio segment primarily due to an increase in expenses associated with the increase in local advertising revenue. The overall increase in operating expenses was partially offset by a decrease of approximately $0.1 million that was attributable to our television segment primarily due to a decrease in expenses associated with the decrease in local and national advertising revenue, partially offset by an increase in rent expense and an increase in bad debt expense.
Corporate expenses in the third quarter of 2022 totaled $9.5 million, up 31% from $7.3 million in the prior-year period. The increase was primarily due to increases in non-cash stock-based compensation and an increase in salaries.
Net revenue for the nine-month period of 2022 totaled $659.9 million, up 25% from $526.3 million in the prior-year period. Of the overall increase, approximately $139.1 million was attributable to our digital segment and was primarily due to advertising revenue growth from our digital commercial partnerships business. In addition, the increase in net revenue in our digital segment was due to our investment in a variable interest entity and our acquisition of 365 Digital during the third quarter of 2022 and fourth quarter of 2021, respectively, neither of which contributed to net revenue in the comparable period ended September 30, 2021, and due to our acquisition of MediaDonuts during the third of 2021, which only partially contributed to net revenue in the comparable period ended September 30, 2021. Additionally, of the overall increase, approximately $2.1 million was attributable to our audio segment, primarily due to increases in political advertising revenue and local advertising revenue, partially offset by a decrease in national advertising revenue. The overall increase was partially offset by a decrease of approximately $7.7 million attributable to our television segment, primarily due to decreases in local and national advertising revenue, and a decrease in retransmission consent revenue. These decreases were mainly attributed to the expiration of our Univision and UniMás network affiliation agreements in Orlando, Tampa and Washington, D.C. on December 31, 2021. The decrease in our television segment revenue was partially offset by increases in political advertising revenue and spectrum usage rights revenue.
Cost of revenue for the nine-month period of 2022 totaled $432.0 million, up 36% from $318.1 million in the prior-year period. The increase was primarily due to increased cost of revenue related to advertising revenue growth from our digital commercial partnerships business, and due to our investment in a variable interest entity and our acquisition of 365 Digital during the third quarter of 2022 and fourth quarter of 2021, respectively, neither of which incurred cost of revenue for us in the comparable period ended September 30, 2021, and due to our acquisition of MediaDonuts during the third of 2021, which only partially incurred cost of revenue for us in the comparable period ended September 30, 2021.
Operating expenses for the nine-month period of 2022 totaled $140.5 million, up 12% from $125.0 million in the prior-year period. Of the overall increase, approximately $15.5 million was attributable to our digital segment and was primarily due to an increase in expenses associated with the increase in digital advertising revenue and an increase in salary expense. In addition, the increase in operating expenses in our digital segment was due to our investment in a variable interest entity and our acquisition of 365 Digital during the third quarter of 2022 and fourth quarter of 2021, respectively, neither of which incurred operating expenses for us in the comparable period ended September 30, 2021, and due to our acquisition of MediaDonuts during the third of 2021, which only partially incurred operating expenses for us in the comparable period ended September 30, 2021. Additionally, of the overall increase in operating expenses, approximately $0.6 million was attributable to our audio segment primarily due to an increase in expenses associated with the increase in local advertising revenue. The overall increase in operating expenses was partially offset by a decrease of approximately $0.6 million that was attributable to our television segment primarily due to a decrease in expenses associated with the decrease in local and national advertising revenue, partially offset by an increase in rent expense and bad debt expense.
Corporate expenses for the nine-month period of 2022 totaled $26.8 million, up 23% from $21.8 million in the prior-year period. The increase was primarily due to increases in non-cash stock-based compensation and an increase in salaries.
Balance Sheet and Related Metrics
Cash and marketable securities as of September 30, 2022 totaled approximately $164.8 million. Total debt under the Company’s credit agreement was $210.0 million. Net of $75 million of cash and marketable securities, total leverage as defined in the Company’s credit agreement was 1.4 times as of September 30, 2022. Net of total cash and marketable securities, total leverage was 0.5 times.
Notice of Conference Call
Entravision Communications Corporation will hold a conference call to discuss its third quarter 2022 results on Thursday, November 3, 2022 at 4:30 p.m. Eastern Time. To access the conference call, please dial (844) 836-8739 (U.S.) or (412) 317-5440 (Int’l) ten minutes prior to the start time and reference Conference ID number 10171311. The call will also be available via live webcast on the investor relations portion of the Company’s website located at www.entravision.com.
About Entravision Communications Corporation
Entravision is a leading global advertising, media and ad-tech solutions company connecting brands to consumers by representing top platforms and publishers. Our dynamic portfolio includes digital, television and audio offerings. Digital, our largest revenue segment, is comprised of four business units: our digital sales representation business; Smadex, our programmatic ad purchasing platform; our branding and mobile performance solutions business; and our digital audio business. Through our digital sales representation business, we connect global media companies such as Meta, Twitter, TikTok and Spotify with advertisers in primarily emerging growth markets worldwide. Smadex is our mobile-first demand side platform, enabling advertisers to execute performance campaigns using machine learning. We also offer a branding and mobile performance solutions business, which provides managed services to advertisers looking to connect with global consumers, primarily on mobile devices, and our digital audio business provides digital audio advertising solutions for advertisers in the Americas. In addition to digital, Entravision has 49 television stations and is the largest affiliate group of the Univision and UniMás television networks. Entravision also manages 45 primarily Spanish-language radio stations that feature nationally recognized, Emmy award-winning talent. Shares of Entravision Class A Common Stock trade on the NYSE under ticker: EVC. Learn more about our offerings at entravision.com or connect with us on LinkedIn and Facebook.
Forward-Looking Statements
This press release contains certain forward-looking statements. These forward-looking statements, which are included in accordance with the safe harbor provisions of the Private Securities Litigation Reform Act of 1995, may involve known and unknown risks, uncertainties and other factors that may cause the Company’s actual results and performance in future periods to be materially different from any future results or performance suggested by the forward-looking statements in this press release. Although the Company believes the expectations reflected in such forward-looking statements are based upon reasonable assumptions, it can give no assurance that actual results will not differ materially from these expectations, and the Company disclaims any duty to update any forward-looking statements made by the Company. From time to time, these risks, uncertainties and other factors are discussed in the Company’s filings with the Securities and Exchange Commission.
IRVING, Texas–(BUSINESS WIRE)– Salem Media Group, Inc. (Nasdaq: SALM) released its results for the three and nine months ended September 30, 2022.
Third Quarter 2022 Results
For the quarter ended September 30, 2022 compared to the quarter ended September 30, 2021:
Consolidated
Total revenue increased 1.3% to $66.9 million from $66.0 million;
Total operating expenses increased 50.7% to $75.6 million from $50.2 million;
Operating expenses, excluding stock-based compensation expense, debt modification costs, gains and losses on the sale or disposition of assets, legal settlement, impairments, depreciation expense and amortization expense (1) increased 10.3% to $60.8 million from $55.2 million;
The company had an operating loss of $8.8 million compared to operating income of $15.8 million;
The company recognized $0.1 million in film distribution income from an unconsolidated equity investment;
The company had a net loss of $11.9 million, or $0.44 net loss per share compared to net income of $22.1 million, or $0.81 net income per diluted share;
EBITDA (1) decreased to $(5.7) million from $30.2 million; and
Adjusted EBITDA (1) decreased 78.8% to $2.3 million from $10.8 million.
Broadcast
Net broadcast revenue increased 3.1% to $51.1 million from $49.6 million;
Station Operating Income (“SOI”) (1) decreased 17.9% to $10.0 million from $12.1 million;
Same Station (1) net broadcast revenue increased 3.2% to $51.1 million from $49.5 million; and
Same Station SOI (1) decreased 16.7% to $10.1 million from $12.1 million.
Digital Media
Digital media revenue decreased 4.3% to $10.2 million from $10.6 million; and
Digital Media Operating Income (1) decreased 21.9% to $1.9 million from $2.4 million.
Publishing
Publishing revenue decreased 3.7% to $5.5 million from $5.7 million; and
Publishing Operating Loss (1) was $1.0 million as compared to publishing operating income of $0.5 million.
Included in the results for the quarter ended September 30, 2022 are:
A $7.7 million ($5.7 million, net of tax, or $0.21 per share) impairment charge to the value of broadcast licenses in Boston, Chicago, Columbus, Dallas, Greenville, Honolulu, Little Rock, Orlando, Philadelphia, Portland, Sacramento, and San Francisco;
A $0.1 million loss on the disposal of assets;
A $3.8 million ($2.8 million, net of tax, or $0.10 per share) legal settlement expense; and
A $0.1 million non-cash compensation charge related to the expensing of stock options.
Included in the results for the quarter ended September 30, 2021 are:
A $2.3 million ($1.7 million, net of tax, or $0.06 per share) charge for debt modification costs. On September 10, 2021, the company refinanced $112.8 million of the 2024 Notes by exchanging into $114.7 million (reflecting a call premium of 1.688%) of 2028 Notes. The transaction was assessed on a lender-specific level and was accounted for as a debt modification in accordance with ASC 470 with $2.3 million of fees paid to third parties included in operating expenses for the period;
A $11.2 million ($8.3 million, net of tax, or $0.30 per diluted share) gain on the forgiveness of PPP loans;
A $0.1 million loss from the early retirement of long-term debt associated with the 2024 Notes;
A $10.6 million ($7.8 million, net of tax, or $0.29 per diluted share) net gain on the disposition of assets relates to a $10.5 million pre-tax gain on the sale of land in Lewisville, Texas, and $0.1 million pre-tax gain on the sale of the Hilary Kramer Financial Newsletter and related assets as well as various other fixed asset disposals; and
A $0.1 million non-cash compensation charge ($0.1 million, net of tax) related to the expensing of stock options.
Per share numbers are calculated based on 27,216,787 diluted weighted average shares for the quarter ended September 30, 2022, and 27,280,949 diluted weighted average shares for the quarter ended September 30, 2021.
Year to Date 2022 Results
For the nine months ended September 30, 2022 compared to the nine months ended September 30, 2021:
Consolidated
Total revenue increased 4.8% to $198.2 million from $189.1 million;
Total operating expenses increased 19.2% to $194.6 million from $163.3 million;
Operating expenses, excluding stock-based compensation expense, debt modification costs, gains and losses on the sale or disposition of assets, legal settlement, impairments, depreciation expense and amortization expense (1) increased 9.2% to $176.6 million from $161.6 million;
The company’s operating income decreased 86.4% to $3.5 million from $25.8 million;
The company recognized $4.0 million in film distribution income from an unconsolidated equity investment;
The company had a net loss of $1.0 million, or $0.04 net loss per share compared to net income of $24.7 million, or $0.91 net income per diluted share;
EBITDA (1) decreased 63.6% to $17.0 million from $46.7 million; and
Adjusted EBITDA (1) decreased 24.3% to $20.8 million from $27.5 million.
Broadcast
Net broadcast revenue increased 8.3% to $152.0 million from $140.4 million;
SOI (1) decreased 6.8% to $31.2 million from $33.5 million;
Same station (1) net broadcast revenue increased 8.1% to $151.6 million from $140.2 million; and
Same station SOI (1) decreased 6.7% to $31.3 million from $33.6 million.
Digital media
Digital media revenue increased 2.3% to $31.3 million from $30.6 million; and
Digital media operating income (1) increased 16.7% to $6.2 million from $5.3 million.
Publishing
Publishing revenue decreased 18.0% to $14.8 million from $18.1 million; and
Publishing Operating Loss (1) was $1.6 million compared to publishing operating income of $1.2 million.
Included in the results for the nine months ended September 30, 2022 are:
A $11.7 million ($8.6 million, net of tax, or $0.32 per share) impairment charge to the value of broadcast licenses in Boston, Chicago, Columbus, Dallas, Greenville, Honolulu, Little Rock, Orlando, Philadelphia, Portland, Sacramento and San Francisco;
A $8.5 million ($6.3 million, net of tax, or $0.23 per diluted share) net gain on the disposition of assets relates primarily to the $6.5 million pre-tax gain on the sale of land used in the company’s Denver, Colorado broadcast operations, the $1.8 million pre-tax gain on sale of land used in the company’s Phoenix, Arizona broadcast operations, and $0.5 million pre-tax gain on the sale of the company’s radio stations in Louisville, Kentucky offset by various fixed asset disposals;
A $18,000 loss on the early retirement of long-term debt associated with the 2024 Notes;
A $4.8 million ($3.5 million, net of tax, or $0.13 per share) legal settlement expense;
A $0.1 million ($0.1 million, net of tax) goodwill impairment charge;
A $0.2 million ($0.2 million, net of tax, or $0.01 per share) charge for debt modification costs; and
A $0.2 million non-cash compensation charge ($0.2 million, net of tax, or $0.01 per share) related to the expensing of stock options.
Included in the results for the nine months ended September 30, 2021 are:
A $2.3 million ($1.7 million, net of tax, or $0.06 per share) charge for debt modification costs. On September 10, 2021, the company refinanced $112.8 million of the 2024 Notes by exchanging into $114.7 million (reflecting a call premium of 1.688%) of 2028 Notes. The transaction was assessed on a lender-specific level and was accounted for as a debt modification in accordance with ASC 470 with $2.3 million of fees paid to third parties included in operating expenses for the period;
A $11.2 million ($8.3 million, net of tax, or $0.30 per diluted share) gain on the forgiveness of PPP loans;
A $0.1 million loss from the early retirement of long-term debt associated with the 2024 Notes;
A $10.6 million ($7.8 million, net of tax, or $0.29 per diluted share) net gain on the disposition of assets relating to a $10.5 million pre-tax gain on the sale of land in Lewisville, Texas, a $0.5 million pre-tax gain on the sale of Singing News Magazine and Singing News Radio and a $0.1 million pre-tax gain on the sale of the Hilary Kramer Financial Newsletter and related assets offset by $0.4 million additional loss recorded at closing on the sale of radio station WKAT-AM and FM translator in Miami, Florida and various fixed asset disposals; and
A $0.2 million non-cash compensation charge ($0.2 million, net of tax, or $0.01 per share) related to the expensing of stock options.
Per share numbers are calculated based on 27,202,983 diluted weighted average shares for the nine months ended September 30, 2022, and 27,217,382 diluted weighted average shares for the nine months ended September 30, 2021.
Balance Sheet
As of September 30, 2022, the company had $114.7 million outstanding on the 7.125% senior secured notes due 2028 (“2028 Notes”) and $44.7 million outstanding on 6.75% senior secured notes due 2024 (“2024 Notes”).
Acquisitions and Divestitures
The following transactions were completed since July 1, 2022:
On October 1, 2022, the company acquired websites and the related assets of DayTradeSPY for $0.6 million in cash. As part of the purchase agreement, the company may pay up to an additional $1.0 million of cash in contingent earn-out consideration within one-year of the closing date based on the achievement of certain revenue benchmarks.
Pending Transactions
On September 29, 2022, the company entered into an Asset Purchase Agreement (“APA”) to acquire radio station WMYM-AM and an FM translator in Miami, Florida for $5.0 million. The company paid $0.3 million of cash into an escrow account and plans to operate the radio stations under a Time Brokerage Agreement beginning on November 16, 2022.
On September 22, 2022, the company entered into an APA to acquire radio stations WWFE-AM, WRHC-AM and two FM translators in Miami, Florida for $5.0 million.
On June 2, 2021, the company entered into an APA to acquire radio station KKOL-AM in Seattle, Washington for $0.5 million. The company paid $0.1 million of cash into an escrow account and began operating the station under a Local Marketing Agreement on June 7, 2021.
Conference Call Information
Salem will host a teleconference to discuss its results on November 3, 2022 at 4:00 p.m. Central Time. To access the teleconference, please dial (888) 770-7291, and then ask to be joined into the Salem Media Group Third Quarter 2022 call or listen via the investor relations portion of the company’s website, located at investor.salemmedia.com. A replay of the teleconference will be available through November 17, 2022 and can be heard by dialing (800) 770-2030, passcode 2413416 or on the investor relations portion of the company’s website, located at investor.salemmedia.com.
Follow us on Twitter @SalemMediaGrp.
Fourth Quarter 2022 Outlook
For the fourth quarter of 2022, the company is projecting total revenue to decrease between 3% and 5% from fourth quarter 2021 total revenue of $69.1 million. This decrease is due largely to the fact that Regnery had an extremely strong fourth quarter in book sales last year. The company is also projecting operating expenses before gains or losses on the sale or disposal of assets, stock-based compensation expense, legal settlement, changes in the estimated fair value of contingent earn-out consideration, impairments, depreciation expense and amortization expense (“Recurring Operating Expenses”) to increase between 4% and 7% compared to the fourth quarter of 2021 Recurring Operating Expenses of $58.3 million.
A reconciliation of Recurring Operating Expenses to the most directly comparable GAAP measure is not available without unreasonable efforts on a forward-looking basis due to the potential high variability, complexity and low visibility with respect to the charges excluded from this non-GAAP financial measure, in particular, the change in the estimated fair value of earn-out consideration, impairments and gains or losses from the disposition of fixed assets. The company expects the variability of the above charges may have a significant, and potentially unpredictable, impact on its future GAAP financial results.
About Salem Media Group, Inc.
Salem Media Group is America’s leading multimedia company specializing in Christian and conservative content, with media properties comprising radio, digital media and book and newsletter publishing. Each day Salem serves a loyal and dedicated audience of listeners and readers numbering in the millions nationally. With its unique programming focus, Salem provides compelling content, fresh commentary and relevant information from some of the most respected figures across the Christian and conservative media landscape. Learn more about Salem Media Group, Inc. at www.salemmedia.com, Facebook and Twitter.
Forward-Looking Statements
Statements used in this press release that relate to future plans, events, financial results, prospects or performance are forward-looking statements as defined under the Private Securities Litigation Reform Act of 1995. Actual results may differ materially from those anticipated as a result of certain risks and uncertainties, including but not limited to the ability of Salem to close and integrate announced transactions, market acceptance of Salem’s radio station formats, competition from new technologies, inflation and other adverse economic conditions, and other risks and uncertainties detailed from time to time in Salem’s reports on Forms 10-K, 10-Q, 8-K and other filings filed with or furnished to the Securities and Exchange Commission. Readers are cautioned not to place undue reliance on these forward-looking statements, which speak only as of the date hereof. Salem undertakes no obligation to update or revise any forward-looking statements to reflect new information, changed circumstances or unanticipated events.
(1) Regulation G
Management uses certain non-GAAP financial measures defined below in communications with investors, analysts, rating agencies, banks and others to assist such parties in understanding the impact of various items on its financial statements. The company uses these non-GAAP financial measures to evaluate financial results, develop budgets, manage expenditures and as a measure of performance under compensation programs.
The company’s presentation of these non-GAAP financial measures should not be considered as a substitute for or superior to the most directly comparable financial measures as reported in accordance with GAAP.
Regulation G defines and prescribes the conditions under which certain non-GAAP financial information may be presented in this earnings release. The company closely monitors EBITDA, Adjusted EBITDA, Station Operating Income (“SOI”), Same Station net broadcast revenue, Same Station broadcast operating expenses, Same Station Operating Income, Digital Media Operating Income, Publishing Operating Income (Loss), and operating expenses excluding gains or losses on the disposition of assets, stock-based compensation, changes in the estimated fair value of contingent earn-out consideration, impairments, depreciation and amortization, all of which are non-GAAP financial measures. The company believes that these non-GAAP financial measures provide useful information about its core operating results, and thus, are appropriate to enhance the overall understanding of its financial performance. These non-GAAP financial measures are intended to provide management and investors a more complete understanding of its underlying operational results, trends and performance.
The company defines Station Operating Income (“SOI”) as net broadcast revenue minus broadcast operating expenses. The company defines Digital Media Operating Income as net Digital Media Revenue minus Digital Media Operating Expenses. The company defines Publishing Operating Income (Loss) as net Publishing Revenue minus Publishing Operating Expenses. The company defines EBITDA as net income before interest, taxes, depreciation, and amortization. The company defines Adjusted EBITDA as EBITDA before gains or losses on the disposition of assets, before debt modification costs, before changes in the estimated fair value of contingent earn-out consideration, before impairments, before net miscellaneous income and expenses, before (gain) loss on early retirement of long-term debt and before non-cash compensation expense. SOI, Digital Media Operating Income, Publishing Operating Income (Loss), EBITDA and Adjusted EBITDA are commonly used by the broadcast and media industry as important measures of performance and are used by investors and analysts who report on the industry to provide meaningful comparisons between broadcasters. SOI, Digital Media Operating Income, Publishing Operating Income (Loss), EBITDA and Adjusted EBITDA are not measures of liquidity or of performance in accordance with GAAP and should be viewed as a supplement to and not a substitute for or superior to its results of operations and financial condition presented in accordance with GAAP. The company’s definitions of SOI, Digital Media Operating Income, Publishing Operating Income (Loss), EBITDA and Adjusted EBITDA are not necessarily comparable to similarly titled measures reported by other companies.
The company defines Same Station net broadcast revenue as broadcast revenue from its radio stations and networks that the company owns or operates in the same format on the first and last day of each quarter, as well as the corresponding quarter of the prior year. The company defines Same Station broadcast operating expenses as broadcast operating expenses from its radio stations and networks that the company owns or operates in the same format on the first and last day of each quarter, as well as the corresponding quarter of the prior year. The company defines Same Station SOI as Same Station net broadcast revenue less Same Station broadcast operating expenses. Same Station operating results include those stations that the company owns or operates in the same format on the first and last day of each quarter, as well as the corresponding quarter of the prior year. Same Station operating results for a full calendar year are calculated as the sum of the Same Station-results for each of the four quarters of that year. The company uses Same Station operating results, a non-GAAP financial measure, both in presenting its results to stockholders and the investment community, and in its internal evaluations and management of the business. The company believes that Same Station operating results provide a meaningful comparison of period over period performance of its core broadcast operations as this measure excludes the impact of new stations, the impact of stations the company no longer owns or operates, and the impact of stations operating under a new programming format. The company’s presentation of Same Station operating results are not intended to be considered in isolation or as a substitute for the financial information prepared and presented in accordance with GAAP. The company’s definition of Same Station operating results is not necessarily comparable to similarly titled measures reported by other companies.
For all non-GAAP financial measures, investors should consider the limitations associated with these metrics, including the potential lack of comparability of these measures from one company to another.
The Supplemental Information tables that follow the condensed consolidated financial statements provide reconciliations of the non-GAAP financial measures that the company uses in this earnings release to the most directly comparable measures calculated in accordance with GAAP. The company uses non-GAAP financial measures to evaluate financial performance, develop budgets, manage expenditures, and determine employee compensation. The company’s presentation of this additional information is not to be considered as a substitute for or superior to the directly comparable measures as reported in accordance with GAAP.
Prepared remarks via webcast on November 16 at 4:30 PM ET
RICHMOND, Va.–(BUSINESS WIRE)– Bowlero Corp. (NYSE: BOWL) (“Bowlero” or the “Company”), the world’s largest owner and operator of bowling centers, will report financial results for the first quarter of fiscal 2023 on Wednesday, November 16, 2022 after the U.S. stock market closes. Management will discuss the results via webcast at 4:30 PM ET on the same day.
The live webcast, replay and results presentation will be available in the Events & Presentations section of the Bowlero Investor Relations website at https://ir.bowlerocorp.com/overview/default.aspx.
About Bowlero Corp.
Bowlero Corp. is the worldwide leader in bowling entertainment, media, and events. With more than 300 bowling centers across North America, Bowlero Corp. serves more than 27 million guests each year through a family of brands that includes Bowlero, Bowlmor Lanes, and AMF. In 2019, Bowlero Corp. acquired the Professional Bowlers Association, the major league of bowling, which boasts thousands of members and millions of fans across the globe. For more information on Bowlero Corp., please visit BowleroCorp.com.