Vancouver, British Columbia–(Newsfile Corp. – June 4, 2024) – Hemisphere Energy Corporation (TSXV: HME) (OTCQX: HMENF) (“Hemisphere” or the “Company”) is pleased to announce that its board of directors has approved the declaration of a special dividend to shareholders.
Given the strong financial position and performance outlook of the Company, Hemisphere is pleased to announce that its board of directors has approved the declaration of a special dividend of C$0.03 per common share. The special dividend is part of Hemisphere’s comprehensive shareholder return model, and will be paid on July 26, 2024 to shareholders of record on July 12, 2024. This special dividend is designated as an eligible dividend for Canadian income tax purposes. It is in addition to the Company’s quarterly base dividend of C$0.025 per common share announced on May 29, 2024, and is in accordance with the Company’s dividend policy.
Hemisphere has committed to shareholder returns of $10.7 million thus far in 2024, including shares repurchased and cancelled under the Company’s normal course issuer bid, two quarterly dividend payments in February and June, and the special dividend payment in July. This return of capital is funded entirely by the Company’s free cash flow and is made possible by its high-margin enhanced oil recovery (“EOR”) assets, ultra-low production decline, and healthy balance sheet.
Subsequent to Hemisphere’s last news release, the Company has now brought online all three producers in its new Marsden, Saskatchewan development play. The purpose of primary production at these wells prior to polymer flood start-up is to gather fluid samples, pressure data, and other relevant reservoir data that will assist in EOR project planning. Construction of Hemisphere’s multi-well battery is currently underway, with anticipated polymer skid delivery and EOR project start-up in the third quarter.
About Hemisphere Energy Corporation
Hemisphere is a dividend-paying Canadian oil company focused on maximizing value per share growth with the sustainable development of its high netback, low decline conventional heavy oil assets through polymer flood EOR methods. Hemisphere trades on the TSX Venture Exchange as a Tier 1 issuer under the symbol “HME” and on the OTCQX Venture Marketplace under the symbol “HMENF”.
For further information, please visit the Company’s website at www.hemisphereenergy.ca to view its corporate presentation or contact:
Don Simmons, President & Chief Executive Officer Telephone: (604) 685-9255 Email: info@hemisphereenergy.ca
Certain statements included in this news release constitute forward-looking statements or forward-looking information (collectively, “forward-looking statements”) within the meaning of applicable securities legislation. Forward-looking statements are typically identified by words such as “anticipate”, “continue”, “estimate”, “expect”, “forecast”, “may”, “will”, “project”, “could”, “plan”, “intend”, “should”, “believe”, “outlook”, “potential”, “target” and similar words suggesting future events or future performance. In particular, but without limiting the generality of the foregoing, this news release includes forward-looking statements including that a quarterly dividend will be paid in June 2024; that a special dividend will be paid to shareholders on July 26, 2024 to shareholders of record on July 12, 2024; and the timing of Hemisphere’s anticipated polymer skid delivery and EOR project start-up in the third quarter.
Forward‐looking statements are based on a number of material factors, expectations or assumptions of Hemisphere which have been used to develop such statements and information, but which may prove to be incorrect. Although Hemisphere believes that the expectations reflected in such forward‐looking statements or information are reasonable, undue reliance should not be placed on forward‐looking statements because Hemisphere can give no assurance that such expectations will prove to be correct. In addition to other factors and assumptions which may be identified herein, assumptions have been made regarding, among other things: the timing for payment of the special dividend; no delays in the anticipated timing for delivery of the polymer skid and EOR project; the general continuance of current industry conditions; the timely receipt of any required regulatory approvals; the ability of Hemisphere to obtain qualified staff, equipment and services in a timely and cost efficient manner; drilling results; the ability of the operator of the projects in which Hemisphere has an interest in to operate the field in a safe, efficient and effective manner; the ability of Hemisphere to obtain financing on acceptable terms; field production rates and decline rates; the ability to replace and expand oil and natural gas reserves through acquisition, development and exploration; the timing and cost of pipeline, storage and facility construction and expansion and the ability of Hemisphere to secure adequate product transportation; future commodity prices; currency, exchange and interest rates; regulatory framework regarding royalties, taxes and environmental matters in the jurisdictions in which Hemisphere operates; and the ability of Hemisphere to successfully market its oil and natural gas products.
The forward‐looking statements included in this news release are not guarantees of future performance and should not be unduly relied upon. Such information and statements, including the assumptions made in respect thereof, involve known and unknown risks, uncertainties and other factors that may cause actual results or events to defer materially from those anticipated in such forward‐looking statements including, without limitation: changes in project timelines and workstreams; changes in commodity prices; changes in the demand for or supply of Hemisphere’s products, the early stage of development of some of the evaluated areas and zones; unanticipated operating results or production declines; changes in tax or environmental laws, royalty rates or other regulatory matters; changes in development plans of Hemisphere or by third party operators of Hemisphere’s properties, increased debt levels or debt service requirements; inaccurate estimation of Hemisphere’s oil and gas reserve volumes; limited, unfavourable or a lack of access to capital markets; increased costs; a lack of adequate insurance coverage; the impact of competitors; and certain other risks detailed from time‐to‐time in Hemisphere’s public disclosure documents, (including, without limitation, those risks identified in this news release and in Hemisphere’s Annual Information Form).
The forward‐looking statements contained in this news release speak only as of the date of this news release, and Hemisphere does not assume any obligation to publicly update or revise any of the included forward‐looking statements, whether as a result of new information, future events or otherwise, except as may be required by applicable securities laws.
Neither the TSX Venture Exchange nor its Regulation Services Provider (as that term is defined in the policies of the TSX Venture Exchange) accepts responsibility for the adequacy or accuracy of this news release.
BATAVIA, N.Y.–(BUSINESS WIRE)– Graham Corporation (NYSE: GHM) (“GHM” or “the Company”), a global leader in the design and manufacture of mission critical fluid, power, heat transfer, and vacuum technologies for the defense, space, energy, and process industries, today announced that it has received approximately $17 million of orders for two expansion projects in the energy and petrochemical markets.
Daniel J. Thoren, President and CEO, commented, “We are excited to work with our North American customer as they aim to create the world’s first net-zero carbon emissions integrated ethylene cracker and derivatives site. Graham’s surface condensers with custom venting package allow the turbine drives to operate at peak efficiency and are considered state of the art in our industry. Additionally, we received a notable order to support an expansion project in the Middle East, which we attribute to our strong relationship and our customer’s preference for our high-performance steam jet ejectors.”
The North American order includes three surface condenser systems for critical service in both a main process unit and utility unit. This project aims to advance the eco-friendliness of natural gas refining, with the collective goal to minimize carbon emissions throughout the production process. The order was received in April 2024 and approximately 50% of the revenue is expected to be recognized in fiscal 2025 with the remainder expected in fiscal 2026.
For the Middle East expansion project, the Company was awarded a contract to supply a new vacuum system for a crude to chemical vacuum distillation tower. This project aims to bolster the production of Group II and Group III Base Oils. This order was received in March 2024, with revenue expected to be recognized in fiscal 2025.
About Graham Corporation
GHM is a global leader in the design and manufacture of mission critical fluid, power, heat transfer and vacuum technologies for the defense, space, energy and process industries. The Graham Manufacturing and Barber-Nichols’ global brands are built upon world-renowned engineering expertise in vacuum and heat transfer, cryogenic pumps and turbomachinery technologies, as well as its responsive and flexible service and the unsurpassed quality customers have come to expect from the Company’s products and systems.
Graham Corporation routinely posts news and other important information on its website, www.grahamcorp.com, where additional information on Graham Corporation and its businesses can be found.
Safe Harbor Regarding Forward Looking Statements
This news release contains forward-looking statements within the meaning of Section 27A of the Securities Act of 1933, as amended, and Section 21E of the Securities Exchange Act of 1934, as amended. Forward-looking statements are subject to risks, uncertainties and assumptions and are identified by words such as “aims,” “expects,” “anticipates,” “potential,” and other similar words. All statements addressing operating performance, events, or developments that Graham Corporation expects or anticipates will occur in the future, including but not limited to, winning potential future or multi-year orders, potential revenues and timing of such revenues, capacity, demand growth, and delivering timely or otherwise on schedule are forward-looking statements. Because they are forward-looking, they should be evaluated in light of important risk factors and uncertainties. These risk factors and uncertainties are more fully described in Graham Corporation’s most recent Annual Report filed with the Securities and Exchange Commission, including under the heading entitled “Risk Factors,” its quarterly reports on Form 10-Q, and other filings it makes with the Securities and Exchange Commission. Should one or more of these risks or uncertainties materialize or should any of Graham Corporation’s underlying assumptions prove incorrect, actual results may vary materially from those currently anticipated. In addition, undue reliance should not be placed on Graham Corporation’s forward-looking statements. Except as required by law, Graham Corporation disclaims any obligation to update or publicly announce any revisions to any of the forward-looking statements contained in this news release.
Michael Heim, Senior Vice President, Equity Research Analyst, Energy & Transportation, Noble Capital Markets, Inc.
Refer to the full report for the price target, fundamental analysis, and rating.
Hemisphere Energy reported production results, pricing, and costs in line with expectations. The company remains on track to meet or beat management guidance. With production and oil prices rising, we expect cash flow and earnings to improve in upcoming quarters.
The company is actively drilling, including in a new area. Hemisphere drilled five wells during the quarter which should lead to production growth. Current production has already reached peak levels. The recently acquired property Marsden play represents a step out of current production and could be an important area for future growth.
Equity Research is available at no cost to Registered users of Channelchek. Not a Member? Click ‘Join’ to join the Channelchek Community. There is no cost to register, and we never collect credit card information.
This Company Sponsored Research is provided by Noble Capital Markets, Inc., a FINRA and S.E.C. registered broker-dealer (B/D).
*Analyst certification and important disclosures included in the full report. NOTE: investment decisions should not be based upon the content of this research summary. Proper due diligence is required before making any investment decision.
Vancouver, British Columbia–(Newsfile Corp. – May 29, 2024) – Hemisphere Energy Corporation (TSXV: HME) (OTCQX: HMENF) (“Hemisphere” or the “Company”) provides its financial and operating results for the first quarter ended March 31, 2024, declares a quarterly dividend payment to shareholders, renews credit facility, and provides operations update.
Q1 2024 Highlights
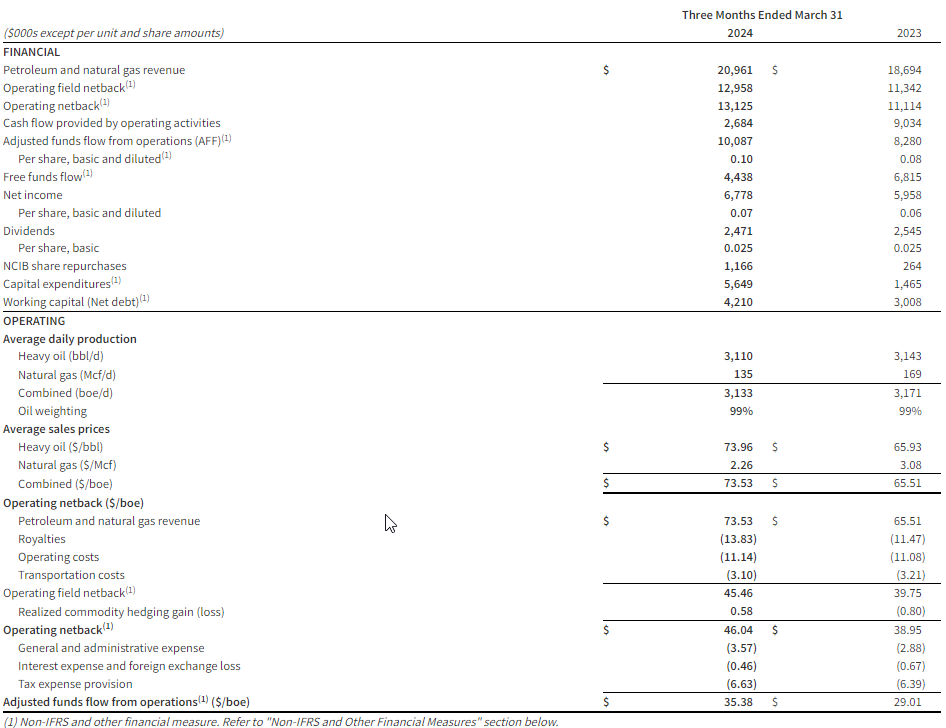
Produced a quarterly average of 3,133 boe/d (99% heavy oil), including significant downtime in January and early February due to extreme cold weather.
Attained quarterly revenue of $21.0 million.
Maintained low operating and transportation costs of $14.24/boe despite reduced quarterly production.
Delivered an operating netback1 of $13.1 million, or $46.04/boe.
Realized quarterly adjusted funds flow from operations (“AFF”)1 of $10.1 million, or $35.38/boe.
Achieved free funds flow1 of $4.4 million, or $0.04 per share.
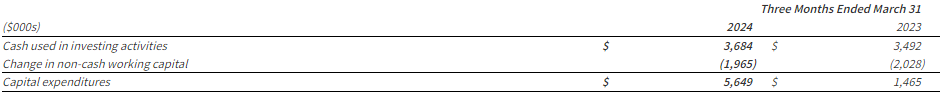
Executed a $5.6 million capital expenditure1 program, including drilling five horizontal wells (three producers, two injectors) in the Company’s new Marsden, Saskatchewan oil play.
Received Enhanced Oil Recovery (“EOR”) project approval from the Ministry of Energy and Resources for a pilot polymer flood in Marsden.
Distributed $2.5 million, or $0.025 per share, in dividends to shareholders during the quarter.
Purchased and cancelled 869,100 shares for $1.2 million under the Company’s Normal Course Issuer Bid (“NCIB”).
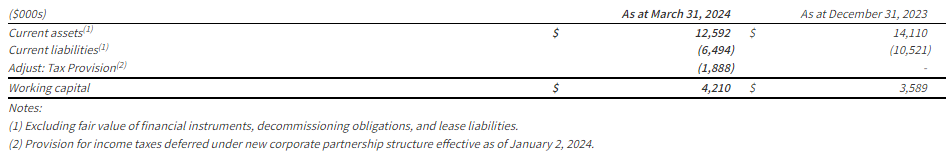
Exited the first quarter with positive working capital1 of $4.2 million, compared to $3.0 million at the end of March 2023.
(1) Operating netback, adjusted funds flow from operations (AFF), free funds flow, capital expenditure, and working capital are non-IFRS measures, or when expressed on a per share or boe basis, non-IFRS ratio, that do not have any standardized meaning under IFRS and therefore may not be comparable to similar measures presented by other entities. Non-IFRS financial measures and ratios are not standardized financial measures under IFRS and may not be comparable to similar financial measures disclosed by other issuers. Refer to the section “Non-IFRS and Other Specified Financial Measures”.
Selected financial and operational highlights should be read in conjunction with Hemisphere’s unaudited consolidated interim financial statements and related notes, and the Management’s Discussion and Analysis for the three months ended March 31, 2024 which are available on SEDAR+ at www.sedarplus.ca and on Hemisphere’s website at www.hemisphereenergy.ca. All amounts are expressed in Canadian dollars unless otherwise noted.
Financial and Operating Summary
Quarterly Dividend
Hemisphere is pleased to announce that its Board of Directors has approved a quarterly cash dividend of $0.025 per common share in accordance with the Company’s dividend policy. The dividend will be paid on June 28, 2024 to shareholders of record as of the close of business on June 20, 2024. The dividend is designated as an eligible dividend for income tax purposes.
Credit Facility
The Company has completed its annual bank review and renewed its $35.0 million two-year extendible credit facility, with the next annual review date set for May 31, 2025.
Operations Update
Hemisphere’s Atlee Buffalo polymer injection projects both continue to perform well, contributing to slight overall corporate production growth. Current production is approximately 3,500 boe/d (99% heavy oil, field estimates between April 1 – May 25, 2024), 3% higher than the fourth quarter of 2023 despite no new wells having been brought online since last September.
In the first quarter of 2024, the Company received EOR project approval from the Ministry of Energy and Resources for a polymer flood pilot in its recently acquired Marsden acreage in Saskatchewan. Subsequently, Hemisphere executed a $5.6 million capital expenditure program, which included drilling five Marsden wells (three producers and two injectors). The Company has recently brought one well on primary production to a single well battery in order to gather initial test data required for EOR project planning. Hemisphere expects to commission a new polymer injection skid and oil treating battery for its Marsden project during the third quarter.
Preparation is also underway for the remainder of Hemisphere’s 2024 capital expenditure program, which includes up to nine new wells in the Atlee Buffalo area being drilled and brought on production to existing facilities later this summer.
Annual General and Special Meeting of Shareholders
Hemisphere’s Annual General and Special Meeting of Shareholders will be held at 10:00 am (Pacific Daylight Time) on May 30, 2024 in the Walker Room of the Terminal City Club located at 837 West Hastings Street, Vancouver, British Columbia.
About Hemisphere Energy Corporation
Hemisphere is a dividend-paying Canadian oil company focused on maximizing value-per-share growth with the sustainable development of its high netback, low decline conventional heavy oil assets through polymer flood enhanced recovery methods. Hemisphere trades on the TSX Venture Exchange as a Tier 1 issuer under the symbol “HME” and on the OTCQX Venture Marketplace under the symbol “HMENF”.
For further information, please visit the Company’s website at www.hemisphereenergy.ca to view its corporate presentation or contact:
Don Simmons, President & Chief Executive Officer Telephone: (604) 685-9255 Email: info@hemisphereenergy.ca
Certain statements included in this news release constitute forward-looking statements or forward-looking information (collectively, “forward-looking statements”) within the meaning of applicable securities legislation. Forward-looking statements are typically identified by words such as “anticipate”, “continue”, “estimate”, “expect”, “forecast”, “may”, “will”, “project”, “could”, “plan”, “intend”, “should”, “believe”, “outlook”, “potential”, “target” and similar words suggesting future events or future performance. In particular, but without limiting the generality of the foregoing, this news release includes forward-looking statements including that the Company expects to commission a new polymer injection skid and oil treating battery for its Saskatchewan production during the third quarter; the timing and execution of Hemisphere’s 2024 capital expenditure program, which includes up to nine new wells in the Atlee Buffalo area being drilled and brought on production to existing facilities later this summer; and that a dividend will be paid June 28, 2024 to shareholders of record as of the close of business on June 20, 2024.
Forward‐looking statements are based on a number of material factors, expectations or assumptions of Hemisphere which have been used to develop such statements and information but which may prove to be incorrect. Although Hemisphere believes that the expectations reflected in such forward‐looking statements or information are reasonable, undue reliance should not be placed on forward‐looking statements because Hemisphere can give no assurance that such expectations will prove to be correct. In addition to other factors and assumptions which may be identified herein, assumptions have been made regarding, among other things: the length of time that oil and gas operations will be impaired by the outbreak of Covid-19; the current and go-forward oil price environment; that Hemisphere will continue to conduct its operations in a manner consistent with past operations; that results from drilling and development activities are consistent with past operations; the quality of the reservoirs in which Hemisphere operates and continued performance from existing wells; the continued and timely development of infrastructure in areas of new production; the accuracy of the estimates of Hemisphere’s reserve volumes; certain commodity price and other cost assumptions; continued availability of debt and equity financing and cash flow to fund Hemisphere’s current and future plans and expenditures; the impact of increasing competition; the general stability of the economic and political environment in which Hemisphere operates; the general continuance of current industry conditions; the timely receipt of any required regulatory approvals; the ability of Hemisphere to obtain qualified staff, equipment and services in a timely and cost efficient manner; drilling results; the ability of the operator of the projects in which Hemisphere has an interest in to operate the field in a safe, efficient and effective manner; the ability of Hemisphere to obtain financing on acceptable terms; field production rates and decline rates; the ability to replace and expand oil and natural gas reserves through acquisition, development and exploration; the timing and cost of pipeline, storage and facility construction and expansion and the ability of Hemisphere to secure adequate product transportation; future commodity prices; currency, exchange and interest rates; regulatory framework regarding royalties, taxes and environmental matters in the jurisdictions in which Hemisphere operates; and the ability of Hemisphere to successfully market its oil and natural gas products.
The forward‐looking statements included in this news release are not guarantees of future performance and should not be unduly relied upon. Such information and statements, including the assumptions made in respect thereof, involve known and unknown risks, uncertainties and other factors that may cause actual results or events to defer materially from those anticipated in such forward‐looking statements including, without limitation: changes in commodity prices; changes in the demand for or supply of Hemisphere’s products, the early stage of development of some of the evaluated areas and zones; unanticipated operating results or production declines; changes in tax or environmental laws, royalty rates or other regulatory matters; changes in development plans of Hemisphere or by third party operators of Hemisphere’s properties, increased debt levels or debt service requirements; inaccurate estimation of Hemisphere’s oil and gas reserve volumes; limited, unfavourable or a lack of access to capital markets; increased costs; a lack of adequate insurance coverage; the impact of competitors; and certain other risks detailed from time‐to‐time in Hemisphere’s public disclosure documents, (including, without limitation, those risks identified in this news release and in Hemisphere’s Annual Information Form).
The forward‐looking statements contained in this news release speak only as of the date of this news release, and Hemisphere does not assume any obligation to publicly update or revise any of the included forward‐looking statements, whether as a result of new information, future events or otherwise, except as may be required by applicable securities laws.
Non-IFRS and Other Financial Measures
This news release contains the terms adjusted funds flow from operations, free funds flow, capital expenditures, operating field netback, operating netback, and working capital/net debt, which are considered “non-IFRS financial measures” and any of these measures calculated on a per boe basis, which are considered “non-IFRS financial ratios”. These terms do not have a standardized meaning prescribed by IFRS. Accordingly, the Company’s use of these terms may not be comparable to similarly defined measures presented by other companies. Investors are cautioned that these measures should not be construed as an alternative to net income (loss) or cashflow from operations determined in accordance with IFRS and these measures should not be considered more meaningful than IFRS measures in evaluating the Company’s performance.
a)Adjusted funds flow from operations (“AFF”) (Non-IFRS Financial Measure and Ratio if calculated on a per share or boe basis): The Company considers AFF to be a key measure that indicates the Company’s ability to generate the funds necessary to support future growth through capital investment and to repay any debt. AFF is a measure that represents cash flow generated by operating activities, before changes in non-cash working capital and adjusted for decommissioning expenditures and may not be comparable to measures used by other companies. The most directly comparable IFRS measure for AFF is cash provided by operating activities. AFF per share is calculated using the same weighted-average number of shares outstanding as in the case of the earnings per share calculation for the period.
A reconciliation of AFF to cash provided by operating activities is presented as follows:
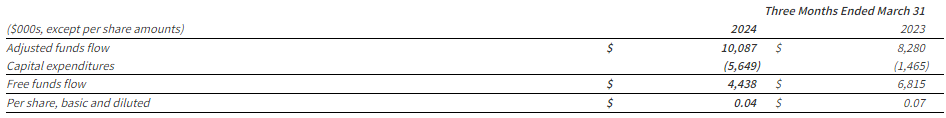
b)Free funds flow (“FFF”) (Non-IFRS Financial Measure): Calculated by taking adjusted funds flow and subtracting capital expenditures, excluding acquisitions and dispositions. Management believes that free funds flow provides a useful measure to determine Hemisphere’s ability to improve returns and to manage the long-term value of the business.
c)Capital Expenditures (Non-IFRS Financial Measure): Management uses the term “capital expenditures” as a measure of capital investment in exploration and production assets, and such spending is compared to the Company’s annual budgeted capital expenditures. The most directly comparable IFRS measure for capital expenditures is cash flow used in investing activities. A summary of the reconciliation of cash flow used in investing activities to capital expenditures is set forth below:
d)Operating field netback (Non-IFRS Financial Measure and Ratio if calculated on a per boe basis): A benchmark used in the oil and natural gas industry and a key indicator of profitability relative to current commodity prices. Operating field netback is calculated as oil and gas sales, less royalties, operating expenses, and transportation costs on an absolute and per barrel of oil equivalent basis. These terms should not be considered an alternative to, or more meaningful than, cash flow from operating activities or net income or loss as determined in accordance with IFRS as an indicator of the Company’s performance.
e)Operating netback (Non-IFRS Financial Measure and Ratio if calculated on a per boe basis): calculated as the operating field netback plus the Company’s realized gain (loss) on derivative financial instruments on an absolute and per barrel of oil equivalent basis.
f)Working Capital/Net debt (Non-IFRS Financial Measure): Closely monitored by the Company to ensure that its capital structure is maintained by a strong balance sheet to fund the future growth of the Company. Working capital/Net debt is used in this document in the context of liquidity and is calculated as the total of the Company’s current assets, less current liabilities, excluding derivative financial instruments, decommissioning obligations, lease liabilities, and tax provisions, and including any bank debt. There is no IFRS measure that is reasonably comparable to working capital/net debt.
The following table outlines the Company calculation of working capital/net debt:
g)Supplementary Financial Measures and Non-IFRS Ratios
“Adjusted Funds Flow from operations per basic share” is comprised of funds from operations divided by basic weighted average common shares. “Adjusted Funds Flow from operations per diluted share” is comprised of funds from operations divided by diluted weighted average common shares. “Annual Free Funds Flow” is comprised of free funds flow from the current three-month period multiplied by four. “Operating expense per boe” is comprised of operating expense, as determined in accordance with IFRS, divided by the Company’s total production. “Realized heavy oil price” is comprised of heavy crude oil commodity sales from production, as determined in accordance with IFRS, divided by the Company’s crude oil production. “Realized natural gas price” is comprised of natural gas commodity sales from production, as determined in accordance with IFRS, divided by the Company’s natural gas production. “Realized combined price” is comprised of total commodity sales from production, as determined in accordance with IFRS, divided by the Company’s total production. “Royalties per boe” is comprised of royalties, as determined in accordance with IFRS, divided by the Company’s total production. “Transportation costs per boe” is comprised of transportation expense, as determined in accordance with IFRS, divided by the Company’s total production.
The Company has provided additional information on how these measures are calculated in the Management’s Discussion and Analysis for the year ended December 31, 2023 and the interim period ended March 31, 2024, which are available under the Company’s SEDAR+ profile at www.sedarplus.ca.
Oil and Gas Advisories
Any references in this news release to initial production rates (including as a result of recent water or polymer flood activities) are useful in confirming the presence of hydrocarbons; however, such rates are not determinative of the rates at which such wells will continue production and decline thereafter and are not necessarily indicative of long-term performance or ultimate recovery. While encouraging, readers are cautioned not to place reliance on such rates in calculating the aggregate production for the Company. Such rates are based on field estimates and may be based on limited data available at this time.
A barrel of oil equivalent (“boe”) may be misleading, particularly if used in isolation. A boe conversion ratio of 6 Mcf:1 Bbl is based on an energy equivalency conversion method primarily applicable at the burner tip and does not represent a value equivalency at the wellhead. In addition, given that the value ratio based on the current price of crude oil as compared to natural gas is significantly different from the energy equivalency of 6:1, utilizing a conversion on a 6:1 basis may be misleading as an indication of value.
Definitions and Abbreviations
bbl
Barrel
Mcf
thousand cubic feet
bbl/d
barrels per day
Mcf/d
thousand cubic feet per day
$/bbl
dollar per barrel
$/Mcf
dollar per thousand cubic feet
boe
barrel of oil equivalent
IFRS
International Financial Reporting Standards
boe/d
barrel of oil equivalent per day
$/boe
dollar per barrel of oil equivalent
US$
United States Dollar
Neither the TSX Venture Exchange nor its Regulation Services Provider (as that term is defined in the policies of the TSX Venture Exchange) accepts responsibility for the adequacy or accuracy of this news release.
In a transaction that could reshape the landscape of domestic energy transportation, private transportation titan Saltchuk Resources is acquiring publicly-traded Overseas Shipholding Group (OSG) for $950 million. The deal will see OSG, one of the leading providers of liquid bulk transportation services for crude oil and petroleum products in the U.S., become a subsidiary of the diversified Saltchuk group.
The acquisition crowns months of corporate maneuvering and deal-making. It began in late January when Saltchuk, already a significant OSG shareholder, made public its non-binding indication of interest to buy the shipowner outright at $6.25 per share. OSG’s board undertook a review of strategic alternatives, engaging with not just Saltchuk but other potential suitors.
That process culminated in Saltchuk’s winning bid of $8.50 per share – a hefty 61% premium to OSG’s price before word of Saltchuk’s initial approach leaked out. Unanimously approved by both companies’ boards, the cash tender offer values OSG’s equity at $653 million.
For Saltchuk, the deal represents a lucrative double down on the Jones Act shipping sector that ensures American crew, boats and resources are utilized for shipping between U.S. ports. OSG boasts a sizable fleet of U.S.-flagged vessels including shuttle tankers, ATBs, and Suezmax crude carriers serving energy industry customers.
“OSG, our nation’s leading domestic marine transporter of energy, has a strong cultural fit with Saltchuk and shares our commitment to operational safety, reliability, and environmental stewardship,” remarked Mark Tabbutt, Saltchuk’s Chairman.
Acquiring OSG significantly expands Saltchuk’s marine services footprint to complement its existing freight transportation and energy distribution operations under brands like TOTE Maritime, Foss Maritime, NorCal Van & Stor, and Hawaii Petroleum. With over $5 billion in consolidated annual revenues, the private Seattle-based holding company gains increased exposure to the lucrative end markets for moving and handling oil, gas and refined products.
From OSG’s perspective, the sale unlocks a premium acquisition price while providing long-term operational stability by tucking into Saltchuk’s family of companies. OSG President and CEO Sam Norton expressed enthusiasm about “soon joining the Saltchuk family of companies” and gaining access to its resources.
However, the deal must first clear customary closing conditions and regulatory approvals. The tender offer is expected to be completed within the next few months, after which any remaining shares will be acquired in a second-step merger. While the acquisition enjoys board support, OSG shareholders will ultimately determine whether to tender their stakes.
If successful, the combination of OSG’s expertise in Jones Act petroleum shipping with Saltchuk’s scale and diversification could create a new domestic energy shipping powerhouse. But questions remain whether the lofty valuation and integration will pay off for the private buyers in an industry facing headwinds from the transition to cleaner fuels. Regardless, this megadeal indicates the importance both parties place on securing reliable domestic shipping services to keep U.S. energy production on the move.
In a transformative transaction for the U.S. shale industry, Crescent Energy Company has agreed to acquire rival Eagle Ford producer SilverBow Resources in an all-stock deal valued at $2.1 billion. The combination solidifies Crescent’s position as a leading player in the prolific Eagle Ford basin of South Texas, creating the second largest operator in the region.
The deal significantly bolsters Crescent’s scale and low-cost inventory. SilverBow shareholders can elect to receive 3.125 Crescent shares for each SilverBow share owned, or opt for $38 per share in cash up to a $400 million cap. Post-closing, expected in Q3 2024, existing Crescent investors will own between 69-79% of the combined entity.
The merged company boasts imposing production of around 250,000 boe/d from a complementary portfolio of high-quality, long-life assets spanning the Eagle Ford and Uinta basins. This large-scale, high-margin asset base underpins robust free cash flow generation backed by a deep inventory of high-return drilling locations to drive compelling growth.
For Crescent, the deal achieves increased scale and premiumization of its portfolio through SilverBow’s attractive Eagle Ford position assembled over 30 years in the region. The combination enhances corporate returns through $65-$100 million of expected annual synergies from combined operating efficiencies and cost of capital benefits.
Crescent characterizes the transaction as highly accretive on all key per share metrics. It aligns with the company’s proven strategy of pursuing disciplined acquisitions at attractive valuations to augment its free cash flow, production, and inventory depth. Maintaining a fortress investment-grade balance sheet post-merger affords financial flexibility to further consolidate the fragmented shale landscape.
The deal represents a compelling value proposition for SilverBow shareholders. They gain exposure to Crescent’s larger-scale diversified assets while participating in the upside from performance improvements, synergy realization, and further consolidation. Alternatively, investors can opt for immediate cash consideration at a premium.
Crescent’s leadership expressed high confidence in the strategic merits of the transaction. Chairman John Goff labeled it “a compelling transaction…creating a premier growth platform”, while CEO David Rockecharlie highlighted SilverBow’s “complementary and high-quality” Eagle Ford position enhancing Crescent’s “unique value proposition.”
The merger exemplifies the accelerating consolidation across the U.S. shale patch as producers pursue scale, streamlining, and consistent shareholder returns. Crescent emerges exceptionally well-positioned to lead this rationalization as a serial acquirer given its sector-leading free cash flow generation, returns philosophy, and strong balance sheet.
Want small cap opportunities delivered straight to your inbox? Channelchek’s free newsletter will give you exclusive access to our expert research, news, and insights to help you make informed investment decisions.
InPlay Oil is a junior oil and gas exploration and production company with operations in Alberta focused on light oil production. The company operates long-lived, low-decline properties with drilling development and enhanced oil recovery potential as well as undeveloped lands with exploration possibilities. The common shares of InPlay trade on the Toronto Stock Exchange under the symbol IPO and the OTCQX Exchange under the symbol IPOOF.
Michael Heim, Senior Vice President, Equity Research Analyst, Energy & Transportation, Noble Capital Markets, Inc.
Refer to the full report for the price target, fundamental analysis, and rating.
Production results were below expectations as extremely cold weather affected wells. InPlay was actively drilling in the first quarter. Several wells were completed at the end of the quarter and should help out next quarter’s production. The resumption of drilling in a prolific region this fall should lead to higher production in 2025.
Pricing remains an issue as the discount to WTI oil prices remains large, but the discount shows signs of improving. The discount between realized prices and WTI oil prices (as expressed in Canadian dollars) remains wide. New oil and gas pipelines in western Canada should lower the discount. Oil and gas futures already indicate as much.
Equity Research is available at no cost to Registered users of Channelchek. Not a Member? Click ‘Join’ to join the Channelchek Community. There is no cost to register, and we never collect credit card information.
This Company Sponsored Research is provided by Noble Capital Markets, Inc., a FINRA and S.E.C. registered broker-dealer (B/D).
*Analyst certification and important disclosures included in the full report. NOTE: investment decisions should not be based upon the content of this research summary. Proper due diligence is required before making any investment decision.
In a move that epitomizes the AI revolution’s inexorable rise and its rippling effects across economic sectors, Sam Altman’s advanced nuclear company Oklo has gone public through a SPAC deal. The transaction netted over $306 million for the fledgling firm to propel its quest to deliver miniaturized, modular nuclear reactors to power everything from military bases to the server farms underpinning large language models like ChatGPT.
Altman, the high-profile CEO of OpenAI, has been vocal about prioritizing sustainable energy solutions like nuclear to meet ballooning computational demands across the AI landscape. Oklo represents a manifestation of that vision, an audacious startup aiming to disrupt antiquated nuclear plant designs with smaller, more nimble fission reactors enclosed in A-frame structures.
As revolutionary AI systems smash through prior technical constraints, their insatiable appetite for energy poses both an opportunity and existential risk. Without abundant, reliable, and climate-friendly power sources, the sector’s terrific growth could stumble or succumb to overreliance on carbon-intensive alternatives. Nascent AI companies embracing pioneers like Oklo could leapfrog that hurdle entirely.
The company’s unconventional public debut via a SPAC merger, while risky, underscores the urgency around securing capital and resources to outpace competing nuclear upstarts and legacy utilities. It also spotlights intensifying investor zeal around potential disruptors servicing the unique infrastructure needs of AI.
At the vanguard are deep-pocketed tech titans like Microsoft, Amazon, and Google parent Alphabet, all operating gargantuan data centers tasked with training and running large language models, computer vision, and myriad other AI workloads. These digital refineries have grown so prodigious they now rank among the world’s top consumers of electricity.
In recent years, the likes of Microsoft and Google have inked deals with nuclear upstarts while voicing public support for next-generation reactors to enhance sustainability and feed AI growth. Amazon cloud chief Andy Jassy has advocated exploring nuclear at scale as a critical lever.
Oklo positions itself as an ideal partner straddling these ambitions. In addition to the company’s modular nuclear plants aimed at localized power generation, the startup’s energy-dense reactors could be co-located at data center campuses requiring immense on-site capacity. Its small-scale model obviates the hazards and complexities of colossal conventional nuclear facilities situated far from demand.
This dystopian vision — fleets of miniature, mobile nuclear generators powering the AI revolution’s factories — may spark backlash from environmental groups wary of distributed radiation risks. But the reality is computing’s ecological footprint has become too ravenous to ignore.
According to one estimate, the energy already consumed by AI could produce the emissions of the entire country of Spain. Left unfettered, ML training workloads alone may comprise a third of the world’s total power demands by 2030. Nuclear proponents cast reactors like Oklo’s as potentially vital circuit-breakers preventing a climate catastrophe.
Altman’s multi-front assault on solving AI’s existential scaling crisis doesn’t stop at Oklo. Through OpenAI and his investment vehicles, the tech mogul is betting big on a range of startups pushing the boundaries in fields like nuclear fusion, data center chips, and ultra-dense computing. Audacious ventures once relegated to science fiction now rank among the most coveted opportunities for VCs and growth investors.
Whether Oklo and its ilk can clear the considerable technical and regulatory hurdles to commercial viability fast enough remains an open question. The challenges of improving nuclear economics, public perception, and building an adept workforce remain immense.
But as AI continues its relentless expansion defying prior predictions, the companies capable of architecting sustainable infrastructure solutions may prove as indispensable to the revolution as the algorithms and models powering the systems themselves. Altman is among the growing chorus sounding that clarion call to action.
CALGARY AB, May 9, 2024 /CNW/ – InPlay Oil Corp. (TSX: IPO) (OTCQX: IPOOF) (“InPlay” or the “Company”) announces its financial and operating results for the three months ended March 31, 2024. InPlay’s condensed unaudited interim financial statements and notes, as well as Management’s Discussion and Analysis (“MD&A”) for the three months ended March 31, 2024 will be available at “www.sedarplus.ca” and our website at “www.inplayoil.com“. An updated presentation will soon be available on our website.
First Quarter 2024 Financial & Operating Results
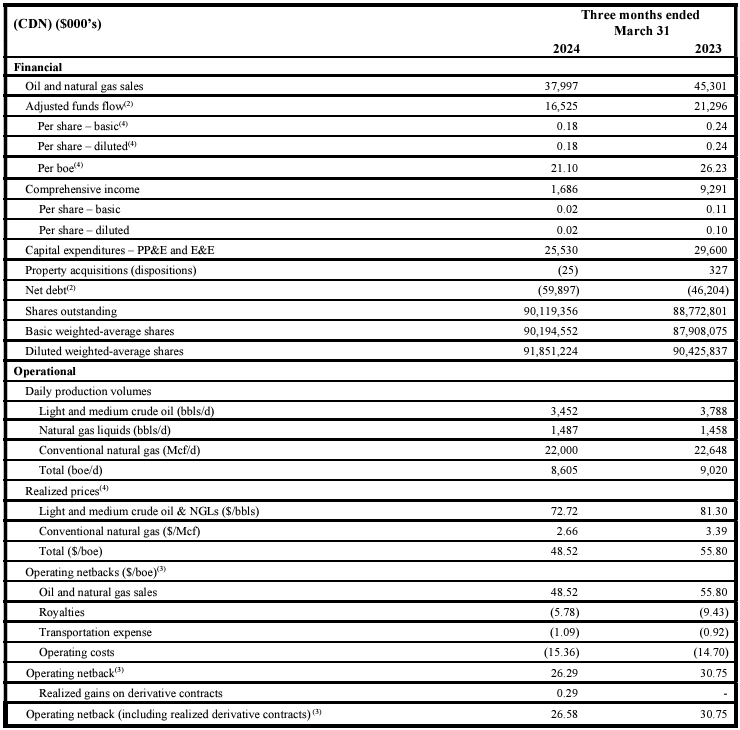
Achieved average quarterly production of 8,605 boe/d(1) (57% light crude oil and NGLs).
Generated strong quarterly AFF(2) of $16.5 million ($0.18 per basic share(3)).
Returned $4.1 million to shareholders through our monthly base dividend, representing an annual yield of 7.6% relative to quarter-end market capitalization. Since November 2022 InPlay has distributed $25.6 million in dividends, or $0.285 per share including dividends declared to date in 2024.
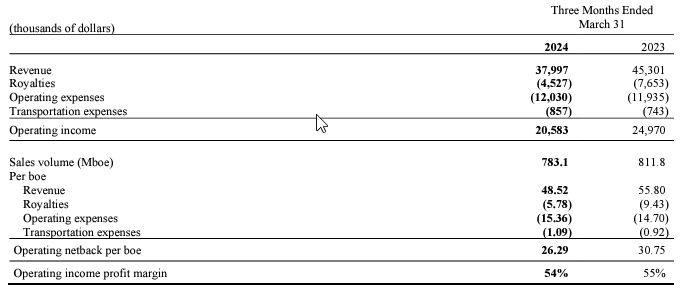
Realized a strong operating income profit margin of 54%.
Completed an active capital program investing $25.5 million to drill, complete and equip 8 (5.6 net) ERH Cardium wells in Pembina and Willesden Green. The majority of production from the program came fully onstream later in March and into April benefiting from April’s higher Edmonton Par price of $109.70/bbl compared to $92.12/bbl average for the first quarter. Current corporate production is approximately 9,350 boe/d(1) (60% light crude oil and NGLs) based on field estimates.
Outlook and Operations Update(5)
We are excited about our capital program for the remainder of the year and plan to drill and bring new production online in the third quarter of 2024 focused on high oil-weighted properties given the current low natural gas pricing environment. The oil-weighted production from new wells is expected to benefit from higher realized oil prices forecasted for the balance of the year as a result of West Texas Intermediate (“WTI”) improvements which started in April. In addition, the Mixed Sweet Blend (“MSW”) differential which was USD $8.65/bbl in Q1 2024 and is forecasted to average USD $3.65/bbl on futures pricing for the balance of the year with the commencement of flow on the Trans Mountain Pipeline expansion adding to takeaway capacity in Canada. InPlay’s second half drilling program is expected to start in June, or potentially July, with over 60% of our net wells for the year remaining to be drilled and brought on production. This activity is projected to lead to strong production rates and free adjusted funds flow (“FAFF”)(3) generation.
The Company looks forward to resuming development of a prolific area of Pembina previously restricted by third party gas plant capacity. In the first quarter, InPlay entered into a long-term Gas Handling Agreement which provides guaranteed access to natural gas processing capacity, allowing the Company to recommence development of this lucrative and strong rate of return growth area where InPlay has not drilled since the spring of 2022. These wells are characterized by strong oil rates similar to other Cardium oil wells while also benefitting from materially higher gas rates and lower overall production declines. InPlay plans to drill a three (3.0 net) extended reach horizontal (“ERH”) Cardium well pad in this area in the third quarter of 2024 with gas production expected to be sold into the stronger winter gas pricing season when forward pricing is approximately $3.45/mcf compared to current pricing of $1.70/mcf.
The Company is well positioned with strong momentum to build upon for the balance of the year as the majority of new production from the Company’s first quarter capital program came on-line in late March and early April. Minimal capital spending is planned for the second quarter, and the combination of higher average production with stronger realized oil prices which started in Q2 2024 is expected to result in significant FAFF generation and net debt reduction.
With the new wells coming on production in late March and early April, current corporate production is approximately 9,350 boe/d(1) (60% light crude oil and NGLs) based on field estimates. InPlay reiterates our 2024 annual average production guidance of 9,000 – 9,500 boe/d (59% – 61% light crude oil and NGLs) supported by strong current production rates and the majority of our wells coming on production in the second half of the year, including 3.0 net wells in our prolific Pembina play. The sustained improvement in WTI prices and a lower MSW differential since the release of our budget in late January results in an updated 2024 Adjusted Funds Flow (“AFF”)(2) forecast of $90 to $97 million based on USD $80 WTI for the remainder of the year, with estimated FAFF(3) of $23 to $33 million. The Company’s leverage metrics are projected to remain at levels which are among the lowest in our peer group. Net debt to EBITDA(3) is forecasted to be 0.4x – 0.5x for 2024 supporting the Company’s sustainable dividend and continued strategy of delivering returns to shareholders. The 2024 capital program will remain flexible and InPlay will revisit this program considering market and economic conditions through the remainder of the year.
Financial and Operating Results:
First Quarter 2024 Financial & Operations Overview:
InPlay completed an active capital program during the first quarter of 2024 consisting of $25.5 million of development capital which is approximately 40% of our capital budget for the year. The Company drilled two (1.9 net) ERH wells in Willesden Green which were brought on production in late February, with three (3.0 net) ERH wells in Pembina and two (0.3 net) non-operated Willesden Green ERH wells brought on production in late March. The Company also participated in one (0.35 net) non-operated Willesden Green ERH well which came on production in April. Drilling and completions operations were affected by cold weather and elevated industry activity limiting the availability of service providers resulting in new production coming on approximately three weeks later than anticipated. This delay however, resulted in new flush production coming on-line in a more favorable crude oil pricing environment with improved differentials resulting in materially higher Edmonton Par prices approximating CAD $109.70/bbl in April compared to CAD $92.12/bbl average for the first quarter.
The three (3.0 net) Pembina ERH wells drilled in the quarter came on production at the end of March and have exceeded internal expectations with average initial production (“IP”) rates per well of 275 boe/d(1) (86% light crude oil and NGLs) over their first 30 days and continue to produce at an average rate of 253 boe/d(1) (84% light crude oil and NGLs). These three wells offset five successful wells drilled in 2023 which have low decline rates and high light oil and liquids weightings contributing to our oil focused development strategy in 2024.
InPlay’s operations were impacted by an extreme cold snap in January including temperatures below -40°C for an extended period, which had not been experienced since 2004. The cold weather led to facility issues, low-rate wells freezing, a pipeline break, and an abnormally high number of producing wells going down and requiring servicing which took most of February to get back online. In aggregate, the impact to production for the quarter was approximately 340 boe/d (57% light crude oil and NGLs). In addition, non-operated downtime impacted production by approximately 115 boe/d in the quarter. Approximately half of this non-operated production has resumed and the majority of the remaining offline production is coming back online soon.
InPlay started a pilot optimization program in the quarter to lower pumps in older, low-rate horizontal oil wells to draw down pressure in the reservoir and increase inflows. The results have been positive to date with capital efficiency adds of approximately $6,000 per producing barrel. The Company has identified over 100 potential horizontal well candidates with pumps that can be lowered. The majority of future pump lowerings will occur as wells require servicing in the normal course of operations.
On behalf of our employees, management team and Board of Directors, we would like to thank our shareholders for their support and look forward to updating you on our progress throughout the year.
Reader Advisories
Non-GAAP and Other Financial Measures
Throughout this document and other materials disclosed by the Company, InPlay uses certain measures to analyze financial performance, financial position and cash flow. These non-GAAP and other financial measures do not have any standardized meaning prescribed under GAAP and therefore may not be comparable to similar measures presented by other entities. The non-GAAP and other financial measures should not be considered alternatives to, or more meaningful than, financial measures that are determined in accordance with GAAP as indicators of the Company performance. Management believes that the presentation of these non-GAAP and other financial measures provides useful information to shareholders and investors in understanding and evaluating the Company’s ongoing operating performance, and the measures provide increased transparency and the ability to better analyze InPlay’s business performance against prior periods on a comparable basis.
Non-GAAP Financial Measures and Ratios
Included in this document are references to the terms “free adjusted funds flow”, “operating income”, “operating netback per boe”, “operating income profit margin” and “Net Debt to EBITDA”. Management believes these measures and ratios are helpful supplementary measures of financial and operating performance and provide users with similar, but potentially not comparable, information that is commonly used by other oil and natural gas companies. These terms do not have any standardized meaning prescribed by GAAP and should not be considered an alternative to, or more meaningful than “profit before taxes”, “profit and comprehensive income”, “adjusted funds flow”, “capital expenditures”, “net debt”, or assets and liabilities as determined in accordance with GAAP as a measure of the Company’s performance and financial position.
Free Adjusted Funds Flow
Management considers FAFF an important measure to identify the Company’s ability to improve its financial condition through debt repayment and its ability to provide returns to shareholders. FAFF should not be considered as an alternative to or more meaningful than AFF as determined in accordance with GAAP as an indicator of the Company’s performance. FAFF is calculated by the Company as AFF less exploration and development capital expenditures and property dispositions (acquisitions) and is a measure of the cashflow remaining after capital expenditures before corporate acquisitions that can be used for additional capital activity, corporate acquisitions, repayment of debt or decommissioning expenditures or potentially return of capital to shareholders. Refer to the “Forward Looking Information and Statements” section for a calculation of forecast FAFF.
Operating Income/Operating Netback per boe/Operating Income Profit Margin
InPlay uses “operating income”, “operating netback per boe” and “operating income profit margin” as key performance indicators. Operating income is calculated by the Company as oil and natural gas sales less royalties, operating expenses and transportation expenses and is a measure of the profitability of operations before administrative, share-based compensation, financing and other non-cash items. Management considers operating income an important measure to evaluate its operational performance as it demonstrates its field level profitability. Operating income should not be considered as an alternative to or more meaningful than net income as determined in accordance with GAAP as an indicator of the Company’s performance. Operating netback per boe is calculated by the Company as operating income divided by average production for the respective period. Management considers operating netback per boe an important measure to evaluate its operational performance as it demonstrates its field level profitability per unit of production. Operating income profit margin is calculated by the Company as operating income as a percentage of oil and natural gas sales. Management considers operating income profit margin an important measure to evaluate its operational performance as it demonstrates how efficiently the Company generates field level profits from its sales revenue. Refer below for a calculation of operating income, operating netback per boe and operating income profit margin.
Net Debt to EBITDA
Management considers Net Debt to EBITDA an important measure as it is a key metric to identify the Company’s ability to fund financing expenses, net debt reductions and other obligations. EBITDA is calculated by the Company as adjusted funds flow before interest expense. When this measure is presented quarterly, EBITDA is annualized by multiplying by four. When this measure is presented on a trailing twelve month basis, EBITDA for the twelve months preceding the net debt date is used in the calculation. This measure is consistent with the EBITDA formula prescribed under the Company’s Senior Credit Facility. Net Debt to EBITDA is calculated as Net Debt divided by EBITDA. Refer to the “Forward Looking Information and Statements” section for a calculation of forecast Net Debt to EBITDA.
Capital Management Measures
Adjusted Funds Flow
Management considers adjusted funds flow to be an important measure of InPlay’s ability to generate the funds necessary to finance capital expenditures. Adjusted funds flow is a GAAP measure and is disclosed in the notes to the Company’s financial statements for the three months ended March 31, 2024. All references to adjusted funds flow throughout this document are calculated as funds flow adjusting for decommissioning expenditures. Decommissioning expenditures are adjusted from funds flow as they are incurred on a discretionary and irregular basis and are primarily incurred on previous operating assets. The Company also presents adjusted funds flow per share whereby per share amounts are calculated using weighted average shares outstanding consistent with the calculation of profit per common share.
Net Debt
Net debt is a GAAP measure and is disclosed in the notes to the Company’s financial statements for the three months ended March 31, 2024. The Company closely monitors its capital structure with the goal of maintaining a strong balance sheet to fund the future growth of the Company. The Company monitors net debt as part of its capital structure. The Company uses net debt (bank debt plus accounts payable and accrued liabilities less accounts receivables and accrued receivables, prepaid expenses and deposits and inventory) as an alternative measure of outstanding debt. Management considers net debt an important measure to assist in assessing the liquidity of the Company.
Supplementary Measures
“Average realized crude oil price” is comprised of crude oil commodity sales from production, as determined in accordance with IFRS, divided by the Company’s crude oil volumes. Average prices are before deduction of transportation costs and do not include gains and losses on financial instruments.
“Average realized NGL price” is comprised of NGL commodity sales from production, as determined in accordance with IFRS, divided by the Company’s NGL volumes. Average prices are before deduction of transportation costs and do not include gains and losses on financial instruments.
“Average realized natural gas price” is comprised of natural gas commodity sales from production, as determined in accordance with IFRS, divided by the Company’s natural gas volumes. Average prices are before deduction of transportation costs and do not include gains and losses on financial instruments.
“Average realized commodity price” is comprised of commodity sales from production, as determined in accordance with IFRS, divided by the Company’s volumes. Average prices are before deduction of transportation costs and do not include gains and losses on financial instruments.
“Adjusted funds flow per weighted average basic share” is comprised of adjusted funds flow divided by the basic weighted average common shares.
“Adjusted funds flow per weighted average diluted share” is comprised of adjusted funds flow divided by the diluted weighted average common shares.
“Adjusted funds flow per boe” is comprised of adjusted funds flow divided by total production.
Forward-Looking Information and Statements
This document contains certain forward–looking information and statements within the meaning of applicable securities laws. The use of any of the words “expect”, “anticipate”, “continue”, “estimate”, “may”, “will”, “project”, “should”, “believe”, “plans”, “intends”, “forecast” and similar expressions are intended to identify forward-looking information or statements. In particular, but without limiting the foregoing, this news release contains forward-looking information and statements pertaining to the following: the Company’s business strategy, milestones and objectives; the Company’s planned 2024 capital program including wells to be drilled and completed and the timing of the same including, without limitation, the timing of wells coming on production; 2024 guidance based on the planned capital program and all associated underlying assumptions set forth in this press release including, without limitation, forecasts of 2024 annual average production levels, adjusted funds flow, free adjusted funds flow, Net Debt/EBITDA ratio, operating income profit margin, and Management’s belief that the Company can grow some or all of these attributes and specified measures; light crude oil and NGLs weighting estimates including the expectation that the high light oil and liquids weighting will continue into 2024; expectations regarding future commodity prices; future oil and natural gas prices including the forecast that MSW differentials to WTI are forecasted to improve through 2024; future liquidity and financial capacity; future results from operations and operating metrics; future costs, expenses and royalty rates; future interest costs; the exchange rate between the $US and $Cdn; future development, exploration, acquisition, development and infrastructure activities and related capital expenditures, including our planned 2024 capital program; the amount and timing of capital projects; and methods of funding our capital program.
The internal projections, expectations, or beliefs underlying our Board approved 2024 capital budget and associated guidance are subject to change in light of, among other factors, the impact of world events including the Russia/Ukraine conflict and war in the Middle East, ongoing results, prevailing economic circumstances, volatile commodity prices, and changes in industry conditions and regulations. InPlay’s 2024 financial outlook and guidance provides shareholders with relevant information on management’s expectations for results of operations, excluding any potential acquisitions or dispositions, for such time periods based upon the key assumptions outlined herein. Readers are cautioned that events or circumstances could cause capital plans and associated results to differ materially from those predicted and InPlay’s guidance for 2024 may not be appropriate for other purposes. Accordingly, undue reliance should not be placed on same.
Forward-looking statements or information are based on a number of material factors, expectations or assumptions of InPlay which have been used to develop such statements and information but which may prove to be incorrect. Although InPlay believes that the expectations reflected in such forward-looking statements or information are reasonable, undue reliance should not be placed on forward-looking statements because InPlay can give no assurance that such expectations will prove to be correct. In addition to other factors and assumptions which may be identified herein, assumptions have been made regarding, among other things: the impact of increasing competition; the general stability of the economic and political environment in which InPlay operates; the timely receipt of any required regulatory approvals; the ability of InPlay to obtain qualified staff, equipment and services in a timely and cost efficient manner; drilling results; the ability of the operator of the projects in which InPlay has an interest in to operate the field in a safe, efficient and effective manner; the ability of InPlay to obtain debt financing on acceptable terms; the anticipated tax treatment of the monthly base dividend; the timing and amount of purchases under the Company’s NCIB; field production rates and decline rates; the ability to replace and expand oil and natural gas reserves through acquisition, development and exploration; the timing and cost of pipeline, storage and facility construction and the ability of InPlay to secure adequate product transportation; future commodity prices; that various conditions to a shareholder return strategy can be satisfied; the ongoing impact of the Russia/Ukraine conflict and war in the Middle East; currency, exchange and interest rates; regulatory framework regarding royalties, taxes and environmental matters in the jurisdictions in which InPlay operates; and the ability of InPlay to successfully market its oil and natural gas products.
Without limitation of the foregoing, readers are cautioned that the Company’s future dividend payments to shareholders of the Company, if any, and the level thereof will be subject to the discretion of the Board of Directors of InPlay. The Company’s dividend policy and funds available for the payment of dividends, if any, from time to time, is dependent upon, among other things, levels of FAFF, leverage ratios, financial requirements for the Company’s operations and execution of its growth strategy, fluctuations in commodity prices and working capital, the timing and amount of capital expenditures, credit facility availability and limitations on distributions existing thereunder, and other factors beyond the Company’s control. Further, the ability of the Company to pay dividends will be subject to applicable laws, including satisfaction of solvency tests under the Business Corporations Act (Alberta), and satisfaction of certain applicable contractual restrictions contained in the agreements governing the Company’s outstanding indebtedness.
The forward-looking information and statements included herein are not guarantees of future performance and should not be unduly relied upon. Such information and statements, including the assumptions made in respect thereof, involve known and unknown risks, uncertainties and other factors that may cause actual results or events to defer materially from those anticipated in such forward-looking information or statements including, without limitation: the continuing impact of the Russia/Ukraine conflict and war in the Middle East; inflation and the risk of a global recession; changes in our planned 2024 capital program; changes in our approach to shareholder returns; changes in commodity prices and other assumptions outlined herein; the risk that dividend payments may be reduced, suspended or cancelled; the potential for variation in the quality of the reservoirs in which we operate; changes in the demand for or supply of our products; unanticipated operating results or production declines; changes in tax or environmental laws, royalty rates or other regulatory matters; changes in development plans or strategies of InPlay or by third party operators of our properties; changes in our credit structure, increased debt levels or debt service requirements; inaccurate estimation of our light crude oil and natural gas reserve and resource volumes; limited, unfavorable or a lack of access to capital markets; increased costs; a lack of adequate insurance coverage; the impact of competitors; and certain other risks detailed from time-to-time in InPlay’s continuous disclosure documents filed on SEDAR including our Annual Information Form and our MD&A.
This press release contains future-oriented financial information and financial outlook information (collectively, “FOFI”) about InPlay’s financial and leverage targets and objectives, potential dividends, share buybacks and beliefs underlying our Board approved 2024 capital budget and associated guidance, all of which are subject to the same assumptions, risk factors, limitations, and qualifications as set forth in the above paragraphs. The actual results of operations of InPlay and the resulting financial results will likely vary from the amounts set forth in this press release and such variation may be material. InPlay and its management believe that the FOFI has been prepared on a reasonable basis, reflecting management’s reasonable estimates and judgments. However, because this information is subjective and subject to numerous risks, it should not be relied on as necessarily indicative of future results. Except as required by applicable securities laws, InPlay undertakes no obligation to update such FOFI. FOFI contained in this press release was made as of the date of this press release and was provided for the purpose of providing further information about InPlay’s anticipated future business operations and strategy. Readers are cautioned that the FOFI contained in this press release should not be used for purposes other than for which it is disclosed herein.
The forward-looking information and statements contained in this news release speak only as of the date hereof and InPlay does not assume any obligation to publicly update or revise any of the included forward-looking statements or information, whether as a result of new information, future events or otherwise, except as may be required by applicable securities laws.
Risk Factors to FLI
Risk factors that could materially impact successful execution and actual results of the Company’s 2024 capital program and associated guidance and estimates include:
volatility of petroleum and natural gas prices and inherent difficulty in the accuracy of predictions related thereto;
the extent of any unfavourable impacts of wildfires in the province of Alberta.
changes in Federal and Provincial regulations;
the Company’s ability to secure financing for the Board approved 2024 capital program and longer-term capital plans sourced from AFF, bank or other debt instruments, asset sales, equity issuance, infrastructure financing or some combination thereof; and
those additional risk factors set forth in the Company’s MD&A and most recent Annual Information Form filed on SEDAR
Key Budget and Underlying Material Assumptions to FLI
The Company’s 2024 guidance remains the same as previously released January 29, 2024 except as noted below. The key budget and underlying material assumptions used by the Company in the development of its 2024 guidance are as follows:
Noble Capital Markets, a full-service SEC / FINRA registered broker-dealer, dedicated exclusively to serving emerging growth companies, is pleased to present the Basic Industries Virtual Equity Conference Emerging Growth Virtual Equity Conference, taking place September 25th and 26th, 2024. This virtual gathering is set to be an immersive experience, bringing together a unique blend of investors, industry leaders, and experts in various sectors surrounding the natural resources, energy, industrials, and transportation spaces.
Part of Noble’s Robust 2024 Events Calendar
The Natural Resources, Energy, Industrials, and Transportation Emerging Growth Virtual Equity Conference is part of Noble’s 2024 event programming, featuring a range of c-suite interviews, in-person non-deal roadshows throughout the United States, two other sector-specific virtual equity conferences, and culminating in Noble’s preeminent in-person investor conference, NobleCon20, to be held at Florida Atlantic University in Boca Raton, Florida December 3-4. Learn more about NobleCon20 here.
The Natural Resources, Energy, Industrials, and Transportation Emerging Growth Virtual Equity Conference will feature 2 days of corporate presentations from up to 50 innovative public companies, showcasing their latest advancements and investment opportunities. Each presentation will be followed by a fireside-style Q&A session proctored by one of Noble’s analysts or bankers, with questions taken from the audience during the presentation. Panel presentations are planned, featuring key opinion leaders in these sectors, providing valuable insights on emerging trends. Scheduled one-on-one meetings with public company executives, coordinated by Noble’s dedicated Investor Outreach team, are also available to qualified investors.
Why Your Company Should Present
Looking to increase awareness in your company and increase liquidity? Paid participation in Noble’s investor conferences, both virtual and in-person, provides that opportunity, with a tailored experience aimed at delivering substantial value. After 40 years of serving emerging growth companies, and the investors who follow them, Noble has built an investor base eager to discover where the next success story lies.
Noble’s investor base is relevant and, in many cases, new to your company. Noble’s dedicated Investor Outreach team provides unmatched exposure to investors that can invest in your company, including small money managers, family offices, RIAs, wealth managers, self-directed investors, and institutions. Most of Noble’s investors specifically seek undervalued, overlooked, emerging investment opportunities.
The cost to present includes your corporate presentation with a Q&A session proctored by one of Noble’s analysts or bankers, a webcast recording, scheduled 1×1 meetings with qualified investors, and marketing on Channelchek.
Benefits for Investors
Hear directly from the c-suite of the next innovators in natural resources, energy, industrials, and transportation and learn about new investment opportunities. The Q&A portion of each presentation gives you the opportunity to have your questions answered during or after the proctored session. The planned panel presentations are sure to provide expert insight on growing trends in these spaces. And, for qualified investors, one-on-one meetings are available with company executives; scheduled by Noble’s dedicated Investor Outreach team. All from the comfort of your own desk, and at no cost.
CALGARY, AB, May 1, 2024 /CNW/ – InPlay Oil Corp. (TSX: IPO) (OTCQX: IPOOF) (“InPlay” or the “Company”) is pleased to confirm that its Board of Directors has declared a monthly cash dividend of $0.015 per common share payable on May 31, 2024, to shareholders of record at the close of business on May 15, 2024. The monthly cash dividend is expected to be designated as an “eligible dividend” for Canadian federal and provincial income tax purposes.
About InPlay Oil Corp.
InPlay is a junior oil and gas exploration and production company with operations in Alberta focused on light oil production. The company operates long-lived, low-decline properties with drilling development and enhanced oil recovery potential as well as undeveloped lands with exploration possibilities. The common shares of InPlay trade on the Toronto Stock Exchange under the symbol IPO and the OTCQX Exchange under the symbol IPOOF. For further information: Please contact: Doug Bartole, President and Chief Executive Officer, InPlay Oil Corp., Telephone: (587) 955-0632, www.inplayoil.com; Darren Dittmer, Chief Financial Officer, InPlay Oil Corp., Telephone: (587) 955-0634
Energy Fuels is a leading U.S.-based uranium mining company, supplying U3O8 to major nuclear utilities. Energy Fuels also produces vanadium from certain of its projects, as market conditions warrant, and is ramping up commercial-scale production of REE carbonate. Its corporate offices are in Lakewood, Colorado, near Denver, and all its assets and employees are in the United States. Energy Fuels holds three of America’s key uranium production centers: the White Mesa Mill in Utah, the Nichols Ranch in-situ recovery (“ISR”) Project in Wyoming, and the Alta Mesa ISR Project in Texas. The White Mesa Mill is the only conventional uranium mill operating in the U.S. today, has a licensed capacity of over 8 million pounds of U3O8 per year, has the ability to produce vanadium when market conditions warrant, as well as REE carbonate from various uranium-bearing ores. The Nichols Ranch ISR Project is on standby and has a licensed capacity of 2 million pounds of U3O8 per year. The Alta Mesa ISR Project is also on standby and has a licensed capacity of 1.5 million pounds of U3O8 per year. In addition to the above production facilities, Energy Fuels also has one of the largest NI 43-101 compliant uranium resource portfolios in the U.S. and several uranium and uranium/vanadium mining projects on standby and in various stages of permitting and development. The primary trading market for Energy Fuels’ common shares is the NYSE American under the trading symbol “UUUU,” and the Company’s common shares are also listed on the Toronto Stock Exchange under the trading symbol “EFR.” Energy Fuels’ website is www.energyfuels.com.
Michael Heim, Senior Vice President, Equity Research Analyst, Energy & Transportation, Noble Capital Markets, Inc.
Refer to the full report for the price target, fundamental analysis, and rating.
Energy Fuels agreed to acquire Base Resources (ASX: BSE) for $242 million. Payment would consist of 0.0260 shares of UUUU stock and $0.042 in cash for each BSE share. UUUU management believes the acquisition will be immediately accretive and significantly add to Energy Fuel’s value given BSE assets with a PV10 estimated value close to $2 billion.
BSE’s Toliara project in Madagascar is the key to the purchase. Toliara is a world-class, advanced-stage, low-cost, and large-scale heavy sands project with large quantities of Monazite sand. The monazite will be shipped to UUUU’s White Mesa Mill for processing. Along with other monazite projects (Chemours, Donald, Bahia) Energy Fuels will now have enough monazite to proceed with the mill’s phase II expansion, which will increase capacity 5-6 times and begin separating heavy REEs.
Equity Research is available at no cost to Registered users of Channelchek. Not a Member? Click ‘Join’ to join the Channelchek Community. There is no cost to register, and we never collect credit card information.
This Company Sponsored Research is provided by Noble Capital Markets, Inc., a FINRA and S.E.C. registered broker-dealer (B/D).
*Analyst certification and important disclosures included in the full report. NOTE: investment decisions should not be based upon the content of this research summary. Proper due diligence is required before making any investment decision.
Michael Heim, Senior Vice President, Equity Research Analyst, Energy & Transportation, Noble Capital Markets, Inc.
Refer to the full report for the price target, fundamental analysis, and rating.
Results were in line with expectations absent charge. Income, cash flow and earnings for the 2023-4Q and 2023 year would have been in line with expectations absent a $4.2 million nonrecurring charge to write down non-core assets.
Quarter production rose 16% year over year due to an active fall drilling program. The increase was expected. Extreme weather hurt production in the first few months of 2024 (2024-1Q production was announced below that in our models) but has risen to all-time high levels recently. We have lowered our 2024-1Q production estimate but raised our estimate for the remaining quarter’s of 2024.
Equity Research is available at no cost to Registered users of Channelchek. Not a Member? Click ‘Join’ to join the Channelchek Community. There is no cost to register, and we never collect credit card information.
This Company Sponsored Research is provided by Noble Capital Markets, Inc., a FINRA and S.E.C. registered broker-dealer (B/D).
*Analyst certification and important disclosures included in the full report. NOTE: investment decisions should not be based upon the content of this research summary. Proper due diligence is required before making any investment decision.