When PPI and CPI are Correlated, and When they are Not

Image Credit: Cottonbro (Flickr)

The Connection Between Producer Price (PPI) and Consumer Price (CPI) Inflation

Does a higher PPI mean a higher CPI? A newly released report shows U.S. suppliers raised prices by 0.4% in September from August, when the Producer Price Index report had shown a 0.2% drop. The inflation measure that has impacted the stock market most severely this year is the Consumer Price Index. The two Bureau of Labor Statistics (BLS) releases are related but not directly correlated and are often used to measure different things by economists and those in industry.

The PPI rose 8.5% in September from a year before, down from its 8.7% annual increase in August and 11.3% in June. – BLS

How CPI and PPI are Different

The PPI for personal consumption includes all marketable production sold by U.S.-domiciled businesses for personal consumption. The majority of the products sold by domestic producers come from non-governmental sectors. However, government produces some marketable output that is under the PPI umbrella. In contrast to the PPI’s components, CPI includes goods and services provided by businesses or governments when direct costs to the consumer are levied.

The most heavily weighted item in CPI is rent. It’s weighted at 24% of the index. What the BLS calls owners’ equivalent rent is the implied rent occupants would have to pay if they were renting their homes. This is how the Bureau of Labor Statistics captures the cost of housing for owner-occupied and rented housing. This heavily weighted component is not in PPI – obviously, owners’ equivalent rent is not a domestically produced output.

The PPI for personal consumption and the CPI also differ in their treatment of imports. The CPI includes, within its basket, goods and services purchased by domestic consumers and therefore includes imports. The PPI, in contrast, does not include imports because imports are, by definition, not produced by domestic firms.

How PPI Impacts CPI

The PPI trends often work their way into consumer price movements, but not at a one-to-one basis or even a standard delayed interval. The demand component of consumer’s impact, what the consumers are willing to consume at certain price levels, is at play with what is charged for goods at the retail level. So even if the cost to manufacture goods has risen, passing the cost on is not always possible without hurting sales. At some level of price increases, demand decreases. This is different for each type of product. For instance, food, medical care, and housing may not be impacted as much as recreation, clothing, and other items which are easier to put off or do without.

Companies are trying to manage higher costs without alienating consumers who are weary of price increases. So far in the 2022 U.S. economy, consumer spending has remained strong despite the rate of CPI, but economists worry that we’re approaching a tipping point.

The Fed has raised the benchmark federal funds rate at its last three meetings by 0.75 percentage points, it now sits in the range of 3% and 3.25%. Officials have indicated they are prepared to raise rates over the course of their final two gatherings this year to around 4.25%.

Today, with consumer inflation running at a four-decade high and savings measurements trending lower, consumers are expected to begin to change buying habits. This overall is bad for business and the economy, which is why the Federal Reserve is expected to continue its fight against price increases, despite their lack of popularity with the financial markets.

“Monetary policy will be restrictive for some time to ensure that inflation moves back” Fed Vice Chair Lael Brainard (October 10).

Prices have begun to fall for some goods and services, including commodities, freight shipping, and housing. Those declines have led some Fed watchers to warn that the central bank risks tightening financial conditions too much.

Take Away

Increases in producer prices are passed to consumers when they can be. However, there is only so much a consumer is willing to pay for a purchase they can put off or substitute for something cheaper. This has ramifications for investors.

Companies where demand will wain when prices rise, may find earnings weaken; these could include producers of discretionary goods. Stocks that are shares of consumer staple companies may not feel the brunt of consumer pushback; those that produce more cost-effective brands, including white label providers, may outshine their brand name competitors if consumers increase their substituting for lower priced alternatives. Health care is one area where demand changes little as prices change at the producer or consumer level.

Paul Hoffman

Managing Editor, Channelchek

Sources
https://www.bls.gov/ppi/methodology-reports/comparing-the-producer-price-index-for-personal-consumption-with-the-us-all-items-cpi

https://www.wsj.com/articles/producer-prices-inflation-september-2022-11665541647?mod=hp_lead_pos2

Savings, Spending, and The Fed’s Challenge

Image Credit: Federal Reserve (Flickr)

Consumer Spending, While Draining Bank Accounts, Could Prolong Fed Tightening

Economics is a social science, and as such, it’s based largely on human behavior, with mathematical models then used to assess decisions and predict outcomes. The U.S. government published consumer savings rates during the first week of October. The results are in line with what economists would expect when the masses’ ability to live the same lifestyle as before is challenged by either high inflation, fewer jobs, or both. There is a delayed effect on consumers’ behavior in the face of higher prices, this is impacting debt levels and savings rates. Also, the upper echelons of earners are not as inclined to cut back, which could make the Fed’s job trickier.

One recognized principle of economics that has proven true throughout history is related to adding stimulus and taking stimulus away and changes in spending. When more money is put in the hands of the citizenry, whether by tax decreases, or direct stimulus checks, that money will be put to work (spent), fairly quickly. Especially by those whose lives would most be impacted, those with stricter budgets. When discretionary income decreases or prices rise, consumers don’t react as quickly. We can think of the reasons why in this way; one is that fixed costs can’t change as quickly if income goes down as they can if the ability to spend increases. The other reason is that we tend to adjust on the downside more slowly while still doing many things that we can not as easily afford to do.

Put another way, we accelerate spending quickly when money is more available than we brake when it becomes less available; in fact, households tend to take their foot off the accelerator, even if it keeps them spending at a pace that puts their household finances in jeopardy.

The Post-Covid Economy is Confounding

At the turn of the year, consumers were thought to have built up about $2.4 trillion of excess savings during the pandemic. Many economists argued the economy would be able to avoid a recession, even as the Fed aggressively raised interest rates. Many of these economists, joined by business owners and investors, are changing their odds of a soft landing; many are still expecting a quick rebound as consumers are believed to have exited the pandemic in strong financial shape.

New data about U.S. consumer savings, however, and a look at consumer finances suggest that they may be overestimating the long-term resilience of consumers.

Last week the FDIC shed some light on savings rates, and the Bureau of Economic Analysis (BEA) provided information on Personal Consumption Expenditures (PCE).

Downward revisions to the savings rate indicated that households had used a much bigger proportion of pandemic savings than seen in previous data, and the starting point is now believed to have been smaller.

According to previous data, through July, households had spent about $270 billion, or 11% of peak excess savings of $2.4 trillion. The updated data show that the peak savings stock was $2.1 trillion. Also, about $630 billion, or 31%, has already been spent.

The  $1.4 trillion that is in savings is still no small amount of money. But, Nancy Lazar, chief global economist at Piper Sandler, told Barron’s that it’s not enough to prevent credit-card borrowing from ballooning and consumer delinquencies from climbing. Credit-card loans are now 6% above their pre-pandemic high. With rates climbing, 60% of revolving debt is extending out and being carried for one year or longer.

“Delinquency risk is rising, especially for low-end consumers who have exhausted their excess savings,” Lazar said.

Lazar told the journal that she calculates the composite 30-day delinquency rate across big financial institutions,  like American Express (AXP), and JPMorgan Chase (JPM), to have risen to 0.82% at the end of August from 0.78% a year earlier. More evidence comes from data from Kroll Bond Rating Agency that showed subprime auto-loan delinquencies are climbing higher, and even prime auto-loan delinquencies are moving up. And Affirm Holdings (ticker: AFRM), which is a buy-now and pay-later company, reported a 290% year-over-year increase in its provision for credit losses.

What Fed Governors Want

Is this “bad news” actually “good news” for stocks and bonds? If consumers have lower means than thought when the Fed began its tightening, this could give hope to those investors that are looking for the Fed to pivot back to an easier policy stance. But economics seldom plays out with just one or two inputs.

Another piece of information economists look at is the Labor Department’s Consumer Expenditure Survey data. Overall, 60% of consumption in the U.S. are from the top 40% of income earners. The lowest quintile, the lowest 20% of earners, those with less discretionary income, make up only 9% of consumption in the U.S.

So the Fed’s predicament has them needing to squelch the relatively high level of consumption of the top 40% that can still pay for the same lifestyle without reducing consumption, and at the same time not overly disrupt those that will feel the impact the most, the lowest 20% of earners in the country.

Take Away

It seems that in the broadest sense, the Fed has impacted consumption in the group that will impact consumption least. Those that would impact the pace of the economy and inflation most are not yet putting their wallets away.   This increases the degree of difficulty the Fed faces when working to bring inflation down to the 2% target.

Paul Hoffman

Managing Editor, Channelchek

Sources

https://www.bea.gov/

https://www.bls.gov/cex/

https://www.kbra.com/sectors/public-finance/issuers

https://www.barrons.com/articles/consumer-savings-fed-problem-51665185301?mod=hp_LEAD_1

The Week Ahead – FOMC Minutes and CPI Late Week

Potential for a Change in Sentiment if Suprised by this Week’s FOMC Minutes, Jobs, and Inflation

When the world’s trading partners move interest rates in concert with each other, their actions are much smoother, this is because currency flows, which influence exchange rates, are less inclined to reprice dramatically. The U.S. has been comparatively aggressive in raising rates. This is part of why the Bank of England (BOE) shoring up its bond market, and the Japanese hawkish hesitancy has created disruptions and a historically strong U.S. dollar.

This week begins with Columbus Day; the bond markets are closed, and so are the banks. Stock market participants shouldn’t expect guidance from interest rate moves related to bond trading. The futures market will be active; moves from Interest rate futures from tickers such as ZB=F can be helpful while bonds are silent.  

Monday 10/10

  • 1:30 PM ET Federal Reserve Vice Chair Lael Brainard discusses restoring price stability at the National Association of Business Economics (NABE). Attend via Zoom.
  • Columbus Day, the potential for thin trading and big price swings.

Tuesday 10/11

  • NY Fed 5-year inflation expectations for one- and three-year-ahead inflation expectations had posted steep declines in August, from 6.2 percent and 3.2 percent in July to 5.7 percent and 2.8 percent, respectively. Investors will be watching to see if the declining expectations continue.
  • NFIB Small Business Optimism Index (NFIB), is a monthly survey that asks small businesses if they have plans to increase employment, plans to expand capital spending, increase inventories, expect economic improvement, expect higher retail sales, is now a good time to expand, current job openings, and earnings trends in their business. Health in small businesses can be an indicator of overall economic health and stock market strength. This report is released at 6 am last month, the index was 91.8, and the consensus is 91.5.
  • The Labor Department’s JOLTS has, in recent years, been referred to as the “Quits” report. The report tracks monthly changes in job openings and contains rates of hiring and quitting. The word JOLTS stands for Job Openings and Labor Turnover Survey.

Wednesday 10/12

  • The Producer Price Index (PPI) from the Bureau of Labor Statistics (BLS) is an inflation gauge that measures the average change over time in the prices received by U.S. producers of goods and services. The prices are typically considered input costs for final products and can impact CPI, it may also impact company costs of production and, therefore, profits. The trend has been lower, YOY PPI has been running at 8,7%, the consensus is for 8.4%.
  • The Mortgage Bankers Association (MBA) creates a statistic from several mortgage loan indexes. The Mortgage Applications index measures applications at mortgage lenders. It’s considered a leading indicator and is especially important for single-family home sales and housing construction. Both are considered foundational in a strong economy. L
  • ast week, the Purchase Index was -12.6%.
  • 10 Year Treasury Note Auction is held in the middle of each month and settles on or around the 15th (depending on weekends). The yield is a benchmark for 30-year mortgages and has recently been noted by investment markets because it has been trading at a yield lower than shorter maturities; this inversion of the yield curve has some market players suggesting a recession is expected in the future. Any surprises at the auction will reverberate through the stock market.
  • FOMC minutes (September meeting) – We’d all love to be a fly on the wall at the Fed’s meetings. The minutes detail the issues debated and the consensus among policymakers. This, of course, has ramifications if the contents of the minutes demonstrate an above-average hawkish or dovish change in tone. The Federal Open Market Committee issues minutes of its latest meeting three weeks after the meeting.

Thursday 10/13

  • US Consumer Price Index (CPI) is the inflation indicator most widely broadcast. With inflation being a primary focus, this will be the big number coming out this week. The number represents a basket of goods considered typical for an urban consumer and is taken as the change in the cost of that basket of goods. A percentage is derived from the change. CPI is also reported with food and energy removed as it is considered that other non-economic factors influence these prices. The August report indicated CPI rose 0.6% for the month and 8.3% YOY. Expectations are for a slowing to 0.4% for September and a YOY rate of 8.1%.
  • U.S. Jobless Claims, which represent the prior weeks of employment are expected to have increased to 225,000 from 219,000. From jobless claims, investors can gain a sense of how tight or how loose the job market is. If wage inflation takes hold, interest rates will likely rise, and bond and stock prices will fall.  Remember, the lower the number of unemployment claims, the stronger the job market, and vice versa.

Friday 10/14

  • U.S. retail sales have been lackluster, neither rising nor falling. As we head toward Thanksgiving and Black Friday sales levels, the market will be taking more and more interest in how strong the consumer is. Expectations for September are a rise of 0.2 percent overall, down 0.1 percent when excluding vehicles and up 0.4 when also excluding gasoline. The number is released at 8:30 am.
  • Business inventories are expressed in dollar value held by manufacturers, wholesalers, and retailers. The level of inventories in relation to sales is an important indicator of the near-term direction of production activity. Rising inventories can be an indication of business optimism that sales will be growing in the coming months. However, if unintended inventory accumulation occurs, then production will probably have to slow while those inventories. The consensus is for a 0.9% increase after only increasing 0.6% for August.
  • U.S. Baker Hughes Rig Count tracks weekly changes in the number of active operating oil & gas rigs. Rigs that are not active are not counted. Components in the data are the United States and Canada, with a separate count for the Gulf of Mexico (which is a subset of the U.S. total). A significant increase or decrease could have ramifications on energy costs in North America. The rig count for the prior period in North America was 977, with 762 of those being from the U.S.

What Else

It is a light week for economic releases and Fed governor addresses, but late week could see a dramatic change in market sentiment as the Fed Minutes, CI, and even employment has the potential to impact thinking.

Paul Hoffman

Managing Editor, Channelchek

Sources

https://www.federalreserve.gov/newsevents/calendar.htm

http://global-premium.econoday.com/byweek.asp?cust=global-premium

https://www.channelchek.com/news-channel/noble_on_the_road___noble_capital_markets_in_person_roadshow_series

Plusses and Minuses of Abundant Jobs

Image Credit: pxhere.com

The Employment Report Can be Viewed as Good for Economic Resilience

Does the Fed need to slow its tightening plans? Thankfully no, and darn it, no. On Friday, a report showed the U.S. economy created 263,000 jobs in September; this confirms a strong labor market, albeit one that has begun to slow somewhat. While this is a deceleration in jobs growth from the 315,000 jobs added in August, the report confirms broad-based strength in the labor market, at the average of what economists had been forecasting.

Why this is Positive for Stocks

The Fed has two main mandates, keep inflation in check (price stability), and make sure people have jobs (maximum employment). Friday’s report offers the clearest sign yet that the labor market is still showing considerable strength, although off its peak, as tighter monetary policy and higher labor costs begin to weigh on demand for workers. Although a slight cooling is evident, there is nothing in the report to suggest the Fed will alter its aggressive path of tightening monetary policy.

The cooling of the labor market is desirable when working to tame inflation. But it is likely employment is still promoting price pressures for labor.  The number should confirm that the Fed is inclined to hike rates by a fourth consecutive 0.75% in November.   

Of particular concern, as it relates to inflation, for the Fed is the continued strength in wages and decline for the month in labor-force participation, which remains well below its pre-pandemic level. The lack of workers allows inflationary bargaining power to those in the workforce or seeking work.

 Growth in average hourly earnings, which had slowed in August, remained steady in September, with wages climbing another 0.3%. And the labor-force participation rate erased a bit and was down 0.1 percentage point to 62.3% as fewer U.S. citizens looked for work than the month before. That contributed to the drop in the unemployment rate, which fell from 3.7% in August to 3.5%.

On the Downside

The resolve of this Fed can be stated this way, as long as the labor market remains healthy, they will remain hyper-focused on reining in inflation without concern for people’s 401ks or other distractions. They can afford to kill a few jobs, and bond or stock investors are not on the Fed’s list of primary concerns.

News to Use From Jobs Report?

Jobs were added in a number of industries, with big gains in the healthcare, leisure, and hospitality sectors. These are industries where positions had been lost during the pandemic. The construction industry, which many economists expected would shrink, added 19,000 jobs in September, in line with the average monthly growth so far this year in construction.

On the bad side, the retail sector lost more than 1,000 jobs in September. It remains broadly strong after three months of gains, 1000 across the population is not yet a concern.

The numbers reflect ongoing catch-up in hiring. Employers are still working to fill jobs lost during steps taken related to Covid-19 fears; the increased demand in many areas makes it difficult to find enough workers. The scenario could keep the labor market strong over the coming months, even if the Fed is successful in slowing the broader economy.

Other data not headlined in the labor market report shows signs the labor market remains strong. The number of workers who were employed part-time for economic reasons, meaning they would have preferred full-time work but had seen their hours cut or were unable to find full-time work, declined by 306,000 in September after rising for two straight months. More work, if wanted, is a strong factor that gives the Fed breathing room.

Another very telling group that showed employment expansion is not as robust as the numbers suggest, is the increased hiring of temporary help. Companies tend to release temporary workers; first, this type of work continued to rise. The sector added another 27,000 jobs in September.

Take Away

Employment remained strong through September. While this may indicate the Fed can continue to raise rates at will for stock market participants, it also means businesses have the potential for more output. So, while the headline news may scream rates ‘will go up!’ and ‘markets should beware!’, the better message is businesses continue to hire. This is especially true for leisure and less accurate for retail companies; the economy can be expected to keep plodding along if everyone who wants a job has a job.

Paul Hoffman

Managing Editor, Channelchek

Sources
https://www.bls.gov/news.release/empsit.nr0.htm

What To Watch Out For October 3rd – October 7th, 2022

Monitoring the Week Ahead – Week Ending October 8th

Today is the first trading week of the new quarter and the first in October. It’s the start of what many hope will be a market turnaround and a strong positive close to the year.

Taking the new month and new quarter one day at a time, below are events scheduled this week that could prove important to our Channelchek subscribers. US data and events will be heavy most days this week, opening with the ISM Manufacturing Survey Monday and ending with monthly Employment on Friday. A variety of Fed Governors will be talking on a number of critical subjects, those talks most likely to move markets are listed.

All times are Eastern Time.

Monday 10/3

  • Noble Capital Markets in Chicago, interview E.W. Scripps (attend live)
  • 9 am Raphael Bostick, Federal Reserve Bank of Atlanta, President/CEO, Discusses technology and Disruption. Follow
  • US Construction Spending 10 am –  This reports the dollar value of new construction activity on residential, non-residential, and public projects. Construction spending fell 0.4 percent in July, marking the sixth straight lower-than-expected result. August’s consensus is a 0.1 percent decline.
  • ISM Manufacturing Index 10 am –  The survey gathers information from managers about the general direction (tracked in volumes) of production, new orders, order backlogs, inventories, employment, supplier deliveries, exports, and imports. It was 52.8 in each of the last two reports, this shows the ISM manufacturing index has stabilized at a level of modest growth. September’s consensus is 52.4.
  • TD Ameritrade’s Investor Movement Index 12:30 – The Investor Movement Index, (IMX), is a behavior-based index created by TD Ameritrade designed to shed insight into Main Street sentiment. The IMX strives to measure what investors are actually doing and how they are positioned in the markets. The index is a snapshot, but when compared to previous periods may be helpful to uncover trends or changes in focus.

Tuesday 10/4

  • Noble Capital Markets in Chicago, interview E.W. Scripps in Milwaukee (attend live)
  • Factory orders are a leading indicator. It is the dollar amount of new orders for both durable and nondurable goods. Factory orders are seen gaining 0.2 percent in August, which would follow a 1.0 percent decline in July. Durable goods orders, which have already been released and are one of two major components of this report, fell 0.2 percent in the month.
  • The Labor Department’s JOLTS has in recent years been referred to as the “Quits” report. The report tracks monthly changes in job openings and contains rates on hiring and quitting. The word JOLTS stands for Job Openings and Labor Turnover Survey.

Wednesday 10/4

  • OPEC meeting. OPEC meetings and the announcements post meeting with changes to production quotas, raising or lowering the global supply of crude oil can have a dramatic impact on energy prices, which currently have been feeding into inflation and business costs. The Organization of Petroleum Exporting Countries and associate members meet monthly.
  • U.S. MBA Mortgage Applications at 7 am. This is a gauge of both the demand for housing and economic momentum. Families and individuals are usually feeling comfortable and confident in their own financial position to buy a house. The changes in housing provide data that has a significant multiplier effect acting on the economy as other purchases follow. The indicated change in economic activity impacts many industries and investment markets.
  • U.S. International Trade in Goods and Services at 8:30. Trade numbers are available by export, import, and trade balance for six principal end-use commodity categories. The numbers will be for August and are expected to show a deficit of $68.0 billion for total goods and services trade which would compare with a $70.6 billion deficit in July. Advance data on the goods side of August’s report showed a nearly $3 billion narrowing in the deficit.
  • The U.S. PMI Composite (Final) or Purchasing Managers Index released at 9:45 am is based on a monthly survey collected from over 400 U.S. companies. The companies provide a leading indicator of what is occurring in the private sector economy.  At 49.2, the first indicator for September showed improvement from August’s 43.7. No change at 49.2 is the expectation for the final.
  • The U.S. Energy Information Administration (EIA) Petroleum report 10:30 am. This report provides weekly information on petroleum inventories in the U.S., whether produced here or abroad. The level of inventories helps determine prices for petroleum products. The report is comprehensive and viewed by people in the industry at all levels.

Thursday 10/6

  • The Challenger Job-Cut Report at 7:30 am provides insight into where layoffs are occurring. There is industry and state-level detail, which makes it more insightful than a weekly jobless claims reports.
  • The Jobless Claims report is released each Thursday at 8:30. Jobless claims for the October 1 week are expected to come in at 203,000 versus 193,000 in the prior week, which was much lower than expected.
  • The U.S. Energy Information Administration (EIA) Natural Gas report 10:30 am. This report provides weekly information on natural gas inventories in the U.S., whether produced here or abroad. With winter approaching in the northern hemisphere, unresolved natural gas distribution issues in Europe have heightened the attention paid to this report.

Friday 10/7

  • U.S. Employment situation at 8:30 am is possibly the most closely followed of all economic indicators. It establishes the official unemployment rate. the employment situation is a set of monthly labor market indicators based on two separate reports: the establishment survey, which tracks 650,000 worksites and offers the nonfarm payroll and average hourly earnings headlines, and the household survey, which interviews 60,000 households. August was the fifth straight month, and in seven of the last eight, payroll growth exceeded expectations. One widely followed estimate is that nonfarm payrolls rose 250,000 in September.
  • U.S. Wholesale Inventories at 10 am. Wholesale trade measures the dollar value of sales made and inventories held by merchant wholesalers. It is a component of business sales and inventories
  • Federal Reserve Governor Lisa Cook, 1 pm address at Peterson Institute for International Economics. Watch
  • U.S. Consumer Credit, released at 3 pm is expected to show an increase to $25.0 billion in August versus a $23.8 billion increase in July.

What Else

The U.S. markets have been taking good news as bad and bad news as good when it relates to the economy. The reasons are fear that if the economy shows too much strength, the Fed will continue its aggressive fight to tame it, possibly overshooting.

A quarterly report Metal & Mining Q3 was released Monday by Noble Capital Markets. Check back with Channelchek this week for other quarter-end industry reports, including energy expected on Tuesday.

When investing and trading, always be aware of your surroundings and what may be lurking in the next influential speech, event, or report. Wishing you all a profitable week.

Paul Hoffman

Managing Editor, Channelchek

Sources
https://www.federalreserve.gov/newsevents/calendar.htm

https://www.channelchek.com/news-channel/noble_on_the_road___noble_capital_markets_in_person_roadshow_series

http://global-premium.econoday.com/byweek.asp?cust=global-premium

https://www.marketwatch.com/economy-politics/calendar

Stock Market Launch Never Happened in September

Image Credit: NASA Kennedy (Flickr)

Looking Back at September and Forward to the Fourth Quarter

September is behind us, and so are the first three quarters of 2022. Yet still, other than the U.S. dollar, there hasn’t been a moonshot in any major market or sector. September 2022 is best characterized by saying a few markets tried to get off the ground, but not unlike the Artemis rocket that was scheduled to go to the moon on September 3rd, the launches were scrubbed and are now on-hold. Maybe they’ll fly in October.

Below we look at the month behind us in stocks, bonds, gold, and crypto. We do this with confidence that they won’t all be grounded forever – and look to find clues as to how the final quarter of the year may treat investors.

Major Market Indicators Tracked Closely

Source: Koyfin

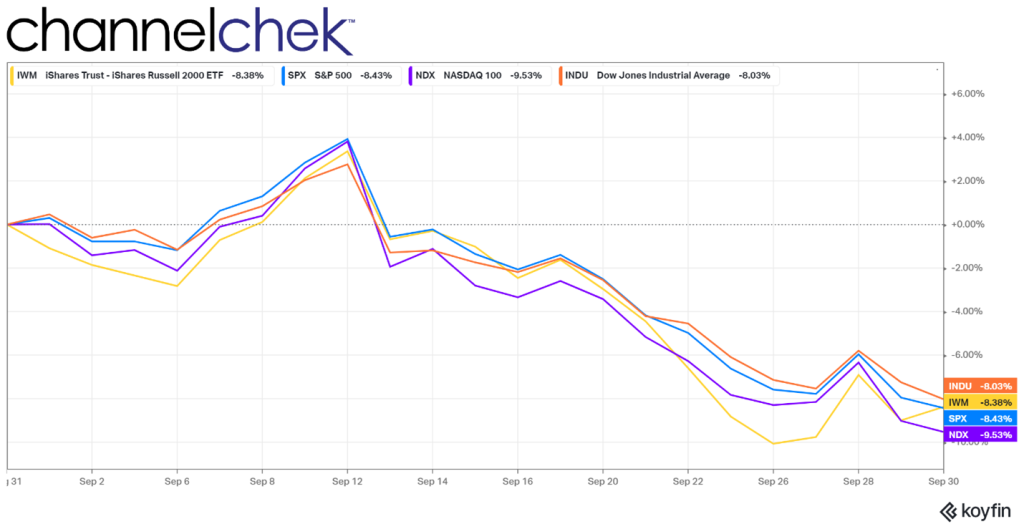
Out of the four closely followed benchmarks, Nasdaq 100, S&P 500, Russell 2000, and Dow 30, there was no runaway index either massively outperforming or underperforming. During the second week in September, the indexes teased that they were ready for take-off after they strung together several consecutive days where they were each up 1%-3%.

Reasons for the bounce that week include that a few of the indexes were approaching a technical floor, through which they’d be considered in a bear market. Stocks rarely break through support levels on their first try. In fact, they often bounce by a large degree.

Adding to the stock market’s climb to as much as up 4% on the month were strong economic numbers, which gave some participants comfort that the economy is still producing jobs and will withstand the Fed’s withdrawing accommodation. Others saw the sign of strong numbers as a sign that the Fed would drive up rates, drag the economy into a recession, and then ease policy by bringing rates back down. This forward-looking reasoning had them bullish.

Eventually, as the month moved along and Jay Powell, the chairman of the Federal Reserve, continued reiterating the central bank’s resolve, stock market investors stopped fighting the Fed – from  September 12th, until month-end, the indexes dropped between 12%-14%

Sectors Within S&P Index

Source: Koyfin

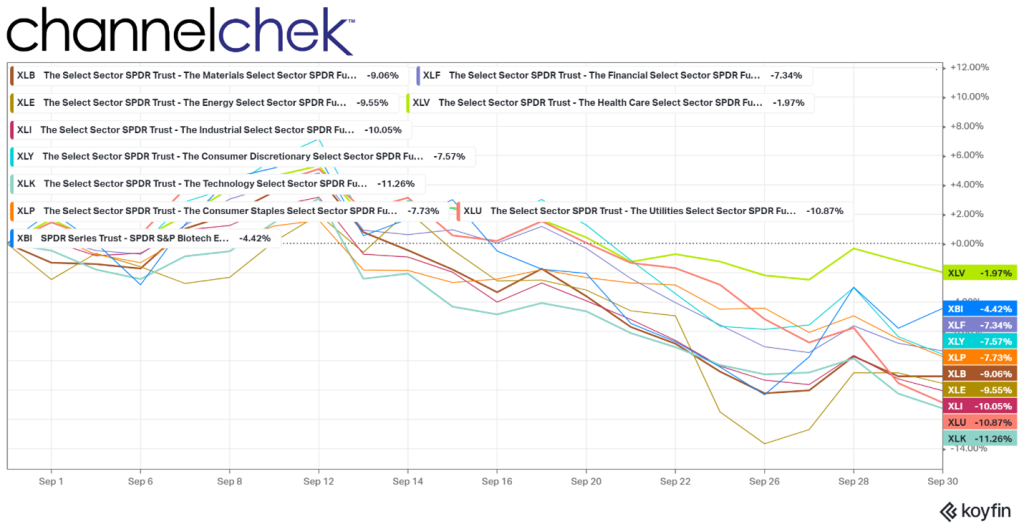
The two standout sectors within the S&P 500 include Health Care which was least negative at down 1.90%, and Biotech, down 4.42%. While this performance doesn’t seem like something to get overly excited about, the dynamics which have taken these two only half as down as the broader index are worth looking into. Both health care and biotech had once been in the stratosphere during the early and mid-pandemic era. As the potential for further benefit waned, these segments fell from their stratospheric highs. Currently, there is potential as large pharmaceutical companies are flush with cash from the pandemic, sit with patents approaching expiration, and biotech, with fresh patents and current R&D on the next generation of medicine, running low on funds. These conditions are ripe for partnerships and acquisitions to accelerate between the two. This may include some individual biotech companies surprising investors with some very good news in the coming months.

On the weak side is technology, which also is still coming down from the pandemic-induced high. The index is down 11.09%. Utilities are also underperforming the broader indexes as higher fuel costs for electric companies and higher interest rates erode the attractiveness of dividends paid on these stocks.

Gold and Bitcoin Performance

Source: Koyfin

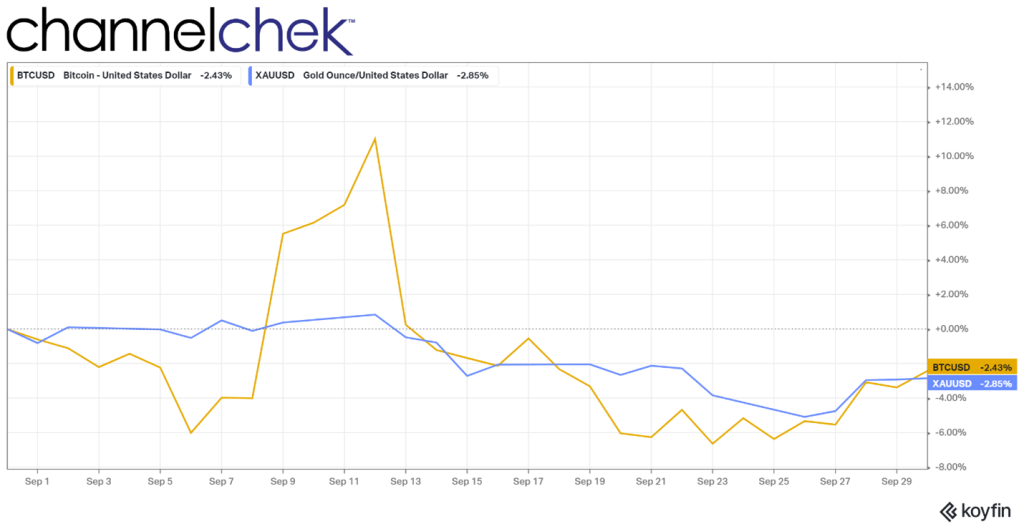
Two non-equity assets, each claiming to be a safe haven during any market, political, or economic upheaval, outperformed the broader stock markets during September. Gold maintained its steady as she goes pace with very little volatility, while bitcoin had dramatic days on the up and downside, with each less than 3% lower than where they began the month.

Fixed Income Performance

Source: Koyfin

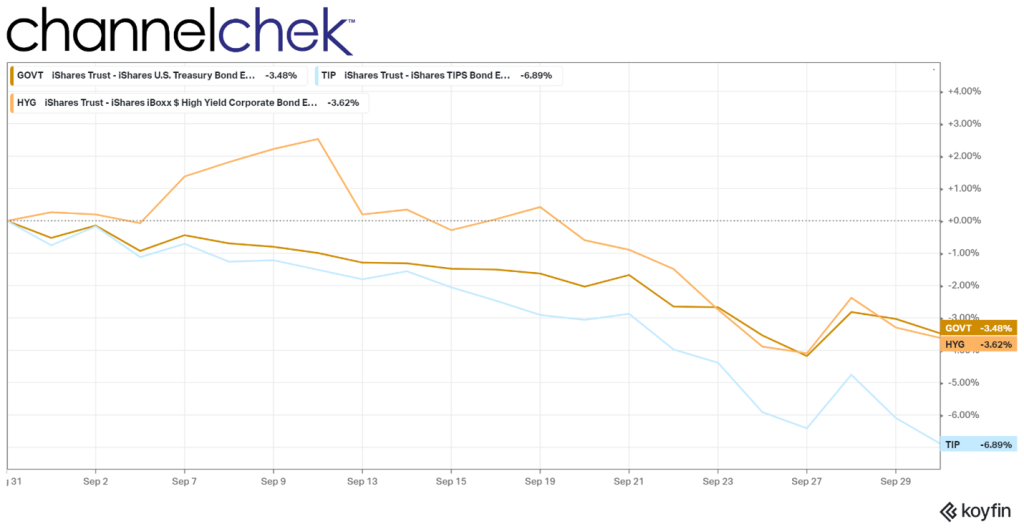
Interest rates were the topic on everyone’s mind throughout the month. Government bonds are valued 3.48% less than they were at the start of September, with uncharacteristic volatility late in the month as markets first began to fear the worst and then reversed with the BOE announcement that it would resume a less restrictive and possibly easier monetary policy.

High-yield bonds more closely track equities (and even bitcoin) than the interest rate markets. These bonds of less creditworthy issuers spent almost half the month in the positive before underperforming treasuries, which were in the red for all of the month. Tips or inflation-indexed treasuries shed 6.89% for its investors. The securities are sold off a spread to a similar maturity treasury, so they will generally move in the same direction. The Fed holds on its balance sheet a large (as a percentage outstanding) of these securities, this has disrupted the bonds’ use as either a hedge against inflation or a gauge to see where the markets think inflation is heading.

A number of Fed governors spoke during the last week of September. They are united in their message that they are only just beginning to move monetary policy to a place where the economy is in a healthy situation where inflation isn’t eroding the dollar’s purchasing power. None have begun to hint that the policy statement from the November 2nd meeting will look any different than the last.

Paul Hoffman

Managing Editor, Channelchek

Sources
https://www.washingtonpost.com/technology/2022/09/03/artemis-launch/

www.koyfin

New Data Indicates Inflationary Recession

Image Credit: Tom Fisk (Pexels)

Inflation Still Surprisingly Strong and Economy Weak

Two important numbers were released on the last day of September. One was based on old news but significant in its finality; it’s the final revision to GDP for the second quarter. The next is viewed as the Fed’s preferred inflation gauge, the PCE deflator. The final GDP number will make it more difficult for public officials or pundits to suggest we can avoid a recession in 2022, and the second did not give any hope that the Fed will have any reason to change course on tightening.

A Recession By Any Other Name

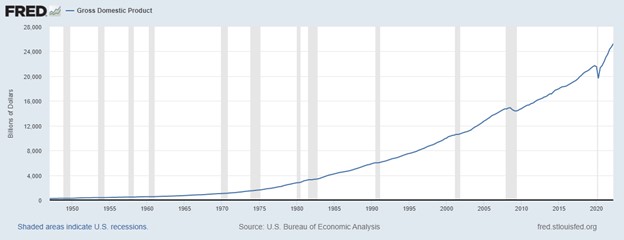
Gross domestic product (GDP) is the indicator that reflects the amount of output produced quarterly in a country. In the U.S., the Bureau of Economic Analysis (BEA) releases two estimates of quarterly GDP, known as the advance and preliminary estimates, in the two months before the release of the final number. So until the final number prints, the number GDP measure is subject to revision.

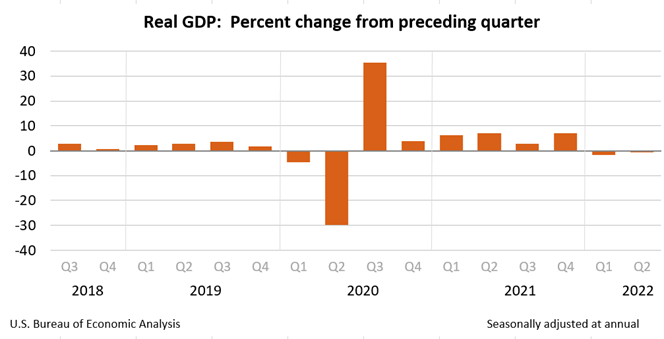
On September 30, 2022, the Final GDP report for the second quarter was released by the BEA. The report shows that GDP decreased at an annual rate of 0.6 percent in the second quarter of 2022 (table 1). This decline in economic output follows a decline of 1.6% in the first quarter of 2022.

Do two-quarters of a receding economy, based on GDP, indicate the U.S. is in the recessionary part of the business cycle? Most textbooks would agree with that definition. However, there is a Business Cycle Dating Committee within the National Bureau of Economic Research (NBER) that determines and labels where the nation is within the economic cycles; they have not made any declaration.

So far, in 2022, the economy has not experienced any economic growth. If the six months of contraction is eventually deemed an official recession, it will thus far have been a shallow one, characterized by strong employment.

Price Increases Higher than Expected

Inflation is still on many investor’s radar. The Fed is targeting reducing inflation to its 2% target. The inflation measure they use for this target is the PCE Deflator. That measure was released this morning, and it validates the aggressive actions being taken by the Federal Reserve. And suggests the Fed has a lot more work to do.

The personal consumption expenditures price index (PCE), which the Fed targets at 2%, rose 6.2% in August from a year earlier, the Commerce Department reported. Underlying inflation, as measured by a core reading that excludes food and energy prices, rose 4.9% from 4.7% previously.

These numbers are well in excess of the Fed’s target and seemingly trending upward. Expectations are the Fed will provide up to another 150 bp increase (1.50%) over the coming months. This would cause the Fed Funds rate to trade near 5%. There is nothing in today’s release that would likely cause expectations to change.

Stagflation?

High inflation and negative growth have many repeating the word “stagflation”. Stagflation has one more element missing, which is high unemployment. The current economic conditions in the U.S. include high demand for workers, this shortage actually helps feed into the inflation the Fed is trying to tame.

Take Away

The economy contracted slightly in the second quarter of 2022. The decline in production was smaller than measured during the first quarter. Federal Reserve policymakers saw one more reason to keep applying the economic brake pedal by taking money out of the economy, increasing upward rate pressures. The Fed caused rates to rise from 40-year lows faster than any time since the 1980s.

Stock market participants are factored into the Fed’s policy only to the extent that market moves may impact inflation or employment. The markets (stocks, bonds, real estate, gold) are negative on the year. There are some who suggest the Fed will use this as a signal to alter policy, if the Fed bowed to any of the markets listed here, the sign of weakness might actually cause a market collapse in stocks and bonds.

Paul Hoffman

Managing Editor, Channelchek

Sources

https://www.bea.gov/news/2022/gross-domestic-product-third-estimate-gdp-industry-and-corporate-profits-revised-2nd

https://www.bea.gov/news/2022/personal-income-and-outlays-august-2022-and-annual-update

https://finance.yahoo.com/news/fed-seen-keeping-big-rate-131814754.html

https://www.stlouisfed.org/on-the-economy/2014/may/do-revisions-to-gdp-follow-patterns

https://www.learningmarkets.com/who-decides-when-we-are-in-a-recession

https://www.bls.gov/news.release/empsit.nr0.htm

Will the Fed Yield on Raising Yields?

Image Credit: QuoteInspector.com (Flickr)

Foundational Changes in Stocks and Bonds

It’s a small world, and as we’ve seen, if something happens with one trading partner, it impacts them all.

Rapid moves and turnarounds in the U.S. Treasury market, considered the bedrock of all other markets, have increased the volatility in equity markets, commodities trading, and, more directly to, currency exchange rates across the globe. The uncertainty has caused investment capital to gravitate to U.S. markets; however, prolonged gyrations, especially in “risk-free” U.S. Treasuries, could put many investors on the sidelines and weaken asset prices globally.

The U.S./U.K. Example

At the end of 2021, the ten-year U.S. Treasury note was yielding 1.5%. Earlier this week a ten-year U.S. Treasury (backed by the same entity that backs the U.S. Currency) rose to yield 4%. That’s a 270% rise in the yield – for bondholders, prices of bonds decline as yields rise. So while the stock market frets over what a Federal Reserve increase in rates may do for equities, bond market investors can usually pull out a calculator and get a fairly precise answer as to how bonds will reprice. If the reaction is radically different, an important foundation is lost. The reaction has been unpredictable.

While the ten-year did hit 4% this week, after lingering around 3.50% the prior week, the yield abruptly dropped after news from across the Atlantic that England’s central bank, the Bank of England (BOE), was taking steps to halt rate increases, effectively implementing quantitative easing. The BOE buying bonds puts pound sterling into their economy and adds to inflation pressures. The immediate reaction was for rates to come down, there, in the U.S., and in other economies that have been tightening. This provided a feeling of relief from equity markets, as it was a sign that the central banks may one by one abandon their plans to fight inflation, choosing instead to fuel it.

The BOE’s move to buy bonds “on whatever scale is necessary” to stabilize its bond market, a move that followed large tax cuts last week by the U.K. government, despite double-digit inflation, many believe indicates a possible problem with a major financial institution or pension fund.

The world’s markets don’t trade in a vacuum. The sudden reversal in the U.K. to stop interest rate hikes and perhaps lower rates brought a positive tone to stocks and bonds in U.S. markets, each having historically challenging years. The conversation in the U.S. is that the Fed may have to pause its own aggressive direction. This would be either because increased rates would further strengthen the dollar, or because the U.S. may have its own underlying time bomb(s), institutions that would fail or bubbles that could burst.

The rallies in the U.S. stock and bond markets gained momentum after the BOE move as the Chicago Mercantile Exchange (CME) data showed reduced expectations of a terminal or neutral Fed Funds rate of 5%, with expectations now for the policy rate to top out around 4.25-4.5%.

Take Away

While the Fed taking its foot off the brake pedal would be a remarkable turnaround after Chairman Powell’s efforts to be clear about his intent to tighten, the reasons for the CME data shift are twofold. First, the Fed won’t be able to keep aggressively raising rates ad simultaneously reducing bond holdings (shrink its balance sheet), because the strong U.S. dollar is disrupting global markets. Secondly, as mentioned before, checking the health of major institutions, housing, and pension funds in the U.S. may be prudent before administering more economic medicine.

Uncertainty has the effect of investors pulling assets out of markets and businesses acting with more caution. Hopefully, clarity, one way or the other, soon presents itself so volatility is reduced and investors can better understand the playing field. 

Paul Hoffman Managing Editor, Channelchek

Sources
https://www.barrons.com/market-data/stocks/cme

https://www.wsj.com/articles/investors-fear-bond-market-turmoil-is-entering-a-new-phase-11664443801?mod=hp_lead_pos3

Understanding Money as the Lubricant for Wealth

Image Credit: John Guccione (Pexels)

Why Does Money Exist?

Imagine a world without money. With no way to buy stuff, you might need to produce everything you wear, eat or use unless you could figure out how to swap some of the things you made for other items.

Just making a chicken sandwich would require spending months raising hens and growing your own lettuce and tomatoes. You’d need to collect your own seawater to make salt.

You wouldn’t just have to bake the bread for your sandwich. You’d need to grow the wheat, mill it into flour and figure out how to make the dough rise without store-bought yeast or baking powder.

And you might have to build your own oven, perhaps fueled by wood you chopped yourself after felling some trees. If that oven broke, you’d probably need to fix it or build another one yourself.

Even if you share the burden of getting all this done with members of your family, it would be impossible for a single family to internally produce all the goods and provide all the services everyone is used to enjoying.

To maintain anything like today’s standard of living, your family would need to include a farmer, a doctor and a teacher. And that’s just a start.

This article was republished  with permission from The Conversation, a news site dedicated to sharing ideas from academic experts. It represents the research-based findings and thoughts of M. Saif Mehkari, Associate Professor of Economics, University of Richmond.

Specializing and Bartering

Economists like me believe that using money makes it a lot easier for everyone to specialize, focusing their work on a specific activity.

A farmer is better at farming than you are, and a baker is probably better at baking. When they earn money, they can pay others for the things they don’t produce or do.

As economists have known since David Ricardo’s work in the 19th century, there are gains for everyone from exchanging goods and services – even when you end up paying someone who is less skilled than you. By making these exchanges easy to do, money makes it possible to consume more.

People have traded goods and services with one kind of money or another, whether it was trinkets, shells, coins and paper cash, for tens of thousands of years.

People have always obtained things without money too, usually through barter. It involves swapping something, such as a cookie or a massage, for something else – like a pencil or a haircut.

Bartering sounds convenient. It can be fun if you enjoy haggling. But it’s hard to pull off.

Let’s say you’re a carpenter who makes chairs and you want an apple. You would probably find it impossible to buy one because a chair would be so much more valuable than that single piece of fruit. And just imagine what a hassle it would be to haul several of the chairs you’ve made to the shopping mall in the hopes of cutting great deals through barter with the vendors you’d find there.

Paper money is far easier to carry. You might be able sell a chair for, say, $50. You could take that $50 bill to a supermarket, buy two pounds of apples for $5 and keep the $45 in change to spend on other stuff later. Another advantage money has over bartering is that you can use it more easily to store your wealth and spend it later. Stashing six $50 bills takes up less room than storing six unsold chairs.

Nowadays, of course, many people pay for things without cash or coins. Instead, they use credit cards or make online purchases. Others simply wave a smartwatch at a designated device. Others use bitcoins and other cryptocurrencies. But all of these are just different forms of money that don’t require paper.

No matter what form it takes, money ultimately helps make the trading of goods and services go more smoothly for everyone involved.

Is a Rail Strike an Economic Train Wreck or an Opportunity?

Image Credit: Katherine Johnson (Flickr)

Any Rail Strike Would Surely Cause Transitory Inflation

There is something I taught myself years ago as a young trader on Wall Street. I appreciate this “skill” less and less as the years go on, but it has served me well. When news breaks, my mind shifts to asking, “for what sectors is this bullish and for what sectors is this bearish?” No attachment except money movement. There will be time for personal involvement with the event after the market closes. The news of a train strike that may begin on Friday is a good example. My investor mind was quick to try and determine what companies would benefit and also which could be hurt. I have no control over whether or not it happens, but I may be able to add to portfolio returns from it.  Meanwhile, at home, I’m stocking up on a few of the items often shipped by rail.

Below is some helpful information about this segment of the freight and shipping industry.

Background

Rail workers may go out on strike as early as Friday, September 16.

In the U.S. the Rail network runs almost 140,000 miles. Freight rail is an $80-billion industry operated by seven Class I railroads (railroads with operating revenues of $490 million or more), and 22 regional and 584 local/short line railroads.

More than 167,000 are employed across the U.S. It’s a safer and often more efficient means of shipping as it uses less energy and rides on a more cost-effective and safer infrastructure than trucking.

Heavy freight such as coal, lumber, metals, and liquids going long distances are likely to travel by rail or some combination of truck, rail, water, or pipeline. The rail network accounts for approximately 28% percent of U.S. freight movement by ton-miles (the distance and weight freight travels). So, by weight, 28% of what is shipped within the U.S. may get stalled in the event of a strike. This would significantly add to any supply chain issues currently being experienced. 

Unlike roadways, U.S. freight railroads are owned by private organizations that are responsible for their own maintenance and improvements.

What Would be Impacted

In all, 52 percent of rail freight cars carry bulk commodities such as agriculture and energy products, automobiles and components, construction materials, chemicals, equipment, food, metals, minerals, paper, and pulp. The remaining 48 percent onboard is generally being shipped in packaging that allows it to easily be moved onboard a plane, van, or other non-bulk carrier.

Source: Federal Railroad Administration

A rail strike would stop a high percentage of the transportation of food, lumber, coal, oil and other goods across the U.S.

Current Status

Rail stocks like Union Pacific ($UNP) and CSX ($CSX) are underperforming the market this week as rail workers’ unions continue to negotiate for higher pay and benefits. The unionized workers have the legal go-ahead to strike at the end of the week if no agreement is reached. This could impact all major U.S. railroads and cripple the supply chain on many raw materials until the dispute is settled. An immediate but temporary impact would be material shortages that would push prices up, largely at the producer level. These shortages should be resolved when the strike ends as increased price pressures should come back down. But the short-lived inflation will be additive to final goods prices for a period of time.

Eight of 12 labor unions have reached tentative agreements with railroad carriers. However, there are still disagreements over vacation, sick days, and attendance policies.

A “cooling off” period expires Friday, at which time workers can strike.

A freight rail shutdown would be expected to cost the U.S. economy around $2 billion per day, according to the Association of American Railroads. It would especially hit the energy sector hard as rail is the number one mode of transportation used by coal producers, according to the Energy Information Administration (EIA).

Take Away

A rail strike would hit multiple sectors as it could stop the transportation of food, lumber, coal, and other goods across the country. Much of what is shipped by train can’t easily be shipped by the already overburdened trucking industry.

A strike, if any, would put upward pressure on lumber, energy, and food prices. Assuming the strike gets resolved, these transit-related higher price pressures should prove to be transitory. As individuals, whether or not there is a strike is beyond our ability to change. If there is an industry sector or company that stands to improve earnings or a sector that may suffer losses, there should be no investor guilt in positioning investments in a way where the investor may prosper.

Paul Hoffman

Managing Editor, Channelchek

Sources
https://railroads.dot.gov/rail-network-development/freight-rail-overview#:

https://www.bts.gov/sites/bts.dot.gov/files/docs/browse-statistical-products-and-data/pocket-guide-transportation/224731/pocket-guide-2019.pdf

https://www.barrons.com/articles/railroad-strike-truck-stocks-51663161990

Will the Dollar and Securities Markets Sink When the War Ends?

Image Credit: Andre Furtado

The Story of War and Peace in the Currency Markets

There is a story of war and peace in the contemporary currency markets. It has a main plot and many subplots. As yet, the story is without end. That may come sooner than many now expect.

The narrator today has a more challenging job than the teller of the story about neutral, Entente, and Central Power currencies during World War I. (See Brown, Brendan “Monetary Chaos in Europe” chapter 2 [Routledge, 2011].)

Today’s Russia war (whether the military conflict in Ukraine or the EU/US-Russia economic war) is not so all-pervasive in global economic and monetary affairs, though it is doubtless prominent. The monetary setting of the story today is much more nuanced than in World War I when the prevailing expectation was that peace would mark the start of a journey where key currencies eventually returned to their prewar gold parities.

In the 1914–18 conflict, any sudden news of a possible end to the conflict—as with the peace notes of President Woodrow Wilson in December 1916—would cause a sharp fall of the neutral currencies (Swiss franc, Dutch guilder, Spanish peseta), a big rise in the German mark and Austrian-Hungarian crown, and lesser rises in sterling and the French franc. Today, in principle, a sudden emergence of peace diplomacy would most plausibly send the euro and British pound higher on the one hand and the Canadian dollar, US dollar, and Swiss franc lower on the other hand.

Mutual exhaustion and military stalemate are a combination from which surprise diplomatic moves to end war can emerge. These circumstances apply today.

Ukraine is falling into an economic abyss—much of its infrastructure reportedly destroyed and its government is resorting to the money printing press to pay its soldiers (see Kenneth Rogoff et al., “Macroeconomic Policies for Wartime Ukraine,” Center for Economic and Policy Research, August 12, 2022). General economic aid from Western donors (as against military aid) is running far short of promises. All these pictures of Russian munitions stores on fire may or may not have excited some potential donors, but they have not heralded any breakthrough.

The human toll—both amongst military personnel and civilians—fans Moscow propaganda that the US and UK are willing to conduct their proxy war against Russia down to the life of the last Ukrainian soldier.

Meanwhile there are these presumably leaked stories in the Washington Post about how President Volodymyr Zelensky betrayed the Ukrainian people by not sharing with them in late 2021 and early 2022 the US intelligence alerts about a looming Russian invasion. According to the stories, many Ukrainians resent that they were not warned by their government and do not accept its shocking excuses (for example, to prevent a flight of capital out of the country).

Is all this preparing ground for a possible power shift in Kiev that might favor an early diplomatic solution even in time for President Joe Biden to claim credit ahead of the midterms? Western Europe will be spared some pain this winter if the initial ceasefire agreement includes a provision that Moscow desist from turning off the gas pipelines.

The purpose here is not to predict the war’s outcome but to describe a peace scenario that is within the mainstream and to map out how the rising likelihood of its realization would influence currency markets.

The main channel of influence on currencies would be the course of the EU/US-Russia economic war. A ceasefire would excite expectations of big relief to the natural gas shortage in Western Europe.

Prices there for natural gas would plunge. In turn, that would lift consumer and business spirits, now depressed by feared astronomic gas bills and even gas rationing this winter. Massive programs to relieve fuel poverty, financed by monetary inflation, would stop in their tracks. The European Central Bank (ECB) could move resolutely to tighten monetary conditions as the depression fears faded.

We could well imagine that the peace scenario would mean the European economies in 2023 would rebound from a winter downturn. That would coincide with the US economy sinking into recession as the “Powell disinflation” works its way through—including continued bubble bursting in the tech space and residential construction sector plus a possible private equity bust.

A big rise of the euro under the peace scenario, though likely, is not a slam-dunk proposition. Russia might delay turning the gas pipelines back on until there is an assurance about its central bank’s frozen deposits in Western Europe. There has been chatter from the top of the Organisation for Economic Co-operation and Development (OECD) down that a reparations commission would sequester these.

More broadly, it could be that most European households are not cutting back their spending to the extent assumed in the consensus economic forecasts. Many individuals may have never believed that the high natural gas prices would persist beyond this winter. Then they faced, in effect, a transitory rather than permanent tax rise. Economic theory suggests that such transitory taxes, paid in this case to North American natural gas producers, have much less impact than permanent ones on spending.

There are still the deep ailments of the euro. How can the ECB ever normalize monetary conditions when so much of the monetary base is backed by loans and credits to weak sovereigns and banks (see Brendan Brown, “ECB’s Long Journey into Currency Collapse Just Got a Lot Shorter,” Mises Wire, July 23, 2022)?

In principle, the US dollar, and even more so the Canadian dollar, would lose from peace as they have gained from war. Both have obtained fuel from the boom in their issuing country’s energy sector. In neither country has there been aggregate real income loss due to the economic war—in fact, there has been a gain in the case of Canada. A further positive for the US dollar has been the boom in the US armaments sector—and this should continue beyond a ceasefire.

Peace will not deflect Europe from seeking to diversify its energy supplies away from Russia and to North American gas and to renewables. But we can imagine that in the long-run, Germany could have a comparative advantage in the renewable space; and North America could lose potential sales outside Europe to Russian gas at discounted prices. Russia is widely expected to prioritize a vamped-up construction program for LNG (liquid natural gas) terminals. These will enable the export of its natural gas to world markets.

Bottom line: peace is likely to be a negative for the US dollar. But transcending this influence is the huge issue of how and when US monetary inflation regains virulence.

About the Author:

Brendan Brown is a founding partner of Macro Hedge Advisors (www.macrohedgeadvisors.com) and senior fellow at Hudson Institute. He is an international monetary and financial economist, consultant, and author, his roles have included Head of Economic Research at Mitsubishi UFJ Financial Group and is also a Senior Fellow of the Mises Institute. Brendan authored Europe’s Century of Crises under Dollar Hegemony: A Dialogue on the Global Tyranny of Unsound Money with Philippe Simonnot.

The article was republished with permission from The Mises Institute. The original version can be found here.