Michael Kupinski, Director of Research, Noble Capital Markets, Inc.
Jacob Mutchler, Research Associate, Noble Capital Markets, Inc.
Refer to the bottom of the report for important disclosures
A proposed new sports streaming service. The Walt Disney Company, Fox Corporation, and Warner Bros. Discovery announced that it plans to launch a new live sports streaming service in the fall 2024. The new service is expected to be offered directly to consumers through an app on a subscription basis.
A lot to work out. There are a number of variables that need to be worked out, including the pricing of the new services. Recent media reports have the streaming service priced at a hefty $40 per month. The app will not include all sports programming and is expected to target sports fans that do not subscribe to a pay-TV package. As such, there will be a limited audience and could even help to expand the reach of local TV stations.
An over-reaction? Television stocks, including our current covered companies, E.W. Scripps (SSP) and Gray Television (GTN) dropped 24% and 15%, respectively. Investors seem to expect that the new service will be a threat to the companies’ retransmission revenue. And, in the case of Scripps, investors may believe that the new potential service will be in competition of Scripps’ Sports strategy.
Impact on Retrans revenue? The service could accelerate cable subscriber declines, but cord cutters likely will subscribe to a virtual service or connected TV for local channels. Such a move would be neutral to TV broadcasters given that broadcasters are paid Retrans on these platforms as well. In terms of Scripps Sports, we believe that it likely will not affect its local sports strategy and that it could offer opportunities for partnerships on it national sports strategy.
Compelling opportunity. We believe that the sell-off in TV stocks is over done. There appears to be a favorable risk/reward relationship for an industry cycling into an improving fundamental story in 2024, with the influx of high margin Political advertising, a swing toward favorable Retrans revenue growth, lowered debt leverage, and compelling stock valuations. Our favorites are E.W. Scripps and Gray Television. Please see our recent reports on SSP and GTN for stock valuations, ratings, price targets and important disclosure information.
GENERAL DISCLAIMERS
All statements or opinions contained herein that include the words “we”, “us”, or “our” are solely the responsibility of Noble Capital Markets, Inc.(“Noble”) and do not necessarily reflect statements or opinions expressed by any person or party affiliated with the company mentioned in this report. Any opinions expressed herein are subject to change without notice. All information provided herein is based on public and non-public information believed to be accurate and reliable, but is not necessarily complete and cannot be guaranteed. No judgment is hereby expressed or should be implied as to the suitability of any security described herein for any specific investor or any specific investment portfolio. The decision to undertake any investment regarding the security mentioned herein should be made by each reader of this publication based on its own appraisal of the implications and risks of such decision.
This publication is intended for information purposes only and shall not constitute an offer to buy/sell or the solicitation of an offer to buy/sell any security mentioned in this report, nor shall there be any sale of the security herein in any state or domicile in which said offer, solicitation or sale would be unlawful prior to registration or qualification under the securities laws of any such state or domicile. This publication and all information, comments, statements or opinions contained or expressed herein are applicable only as of the date of this publication and subject to change without prior notice. Past performance is not indicative of future results. Noble accepts no liability for loss arising from the use of the material in this report, except that this exclusion of liability does not apply to the extent that such liability arises under specific statutes or regulations applicable to Noble. This report is not to be relied upon as a substitute for the exercising of independent judgement. Noble may have published, and may in the future publish, other research reports that are inconsistent with, and reach different conclusions from, the information provided in this report. Noble is under no obligation to bring to the attention of any recipient of this report, any past or future reports. Investors should only consider this report as single factor in making an investment decision.
IMPORTANT DISCLOSURES
This publication is confidential for the information of the addressee only and may not be reproduced in whole or in part, copies circulated, or discussed to another party, without the written consent of Noble Capital Markets, Inc. (“Noble”). Noble seeks to update its research as appropriate, but may be unable to do so based upon various regulatory constraints. Research reports are not published at regular intervals; publication times and dates are based upon the analyst’s judgement. Noble professionals including traders, salespeople and investment bankers may provide written or oral market commentary, or discuss trading strategies to Noble clients and the Noble proprietary trading desk that reflect opinions that are contrary to the opinions expressed in this research report. The majority of companies that Noble follows are emerging growth companies. Securities in these companies involve a higher degree of risk and more volatility than the securities of more established companies. The securities discussed in Noble research reports may not be suitable for some investors and as such, investors must take extra care and make their own determination of the appropriateness of an investment based upon risk tolerance, investment objectives and financial status.
Company Specific Disclosures
The following disclosures relate to relationships between Noble and the company (the “Company”) covered by the Noble Research Division and referred to in this research report. Noble is not a market maker in any of the companies mentioned in this report. Noble intends to seek compensation for investment banking services and non-investment banking services (securities and non-securities related) with any or all of the companies mentioned in this report within the next 3 months
ANALYST CREDENTIALS, PROFESSIONAL DESIGNATIONS, AND EXPERIENCE
Senior Equity Analyst focusing on Basic Materials & Mining. 20 years of experience in equity research. BA in Business Administration from Westminster College. MBA with a Finance concentration from the University of Missouri. MA in International Affairs from Washington University in St. Louis. Named WSJ ‘Best on the Street’ Analyst and Forbes/StarMine’s “Best Brokerage Analyst.” FINRA licenses 7, 24, 63, 87
WARNING
This report is intended to provide general securities advice, and does not purport to make any recommendation that any securities transaction is appropriate for any recipient particular investment objectives, financial situation or particular needs. Prior to making any investment decision, recipients should assess, or seek advice from their advisors, on whether any relevant part of this report is appropriate to their individual circumstances. If a recipient was referred to Noble Capital Markets, Inc. by an investment advisor, that advisor may receive a benefit in respect of transactions effected on the recipients behalf, details of which will be available on request in regard to a transaction that involves a personalized securities recommendation. Additional risks associated with the security mentioned in this report that might impede achievement of the target can be found in its initial report issued by Noble Capital Markets, Inc.. This report may not be reproduced, distributed or published for any purpose unless authorized by Noble Capital Markets, Inc..
RESEARCH ANALYST CERTIFICATION
Independence Of View All views expressed in this report accurately reflect my personal views about the subject securities or issuers.
Receipt of Compensation No part of my compensation was, is, or will be directly or indirectly related to any specific recommendations or views expressed in the public appearance and/or research report.
Ownership and Material Conflicts of Interest Neither I nor anybody in my household has a financial interest in the securities of the subject company or any other company mentioned in this report.
Michael Kupinski, Director of Research, Noble Capital Markets, Inc.
Jacob Mutchler, Research Associate, Noble Capital Markets, Inc.
Refer to the bottom of the report for important disclosures
Optimism For A Good 2024. In this report, we provide our advertising outlook for 2024 and provide our best picks to play the expected advertising rebound. Our take on the year is based on an improving economic outlook, particularly in the second half of the year, and heavy influx of Political advertising. Our favorable advertising outlook is based on a resilient labor market and lower interest rates to avoid a recession in 2024.
Have we seen thetrough for this cycle? With our economic scenario in mind, we anticipate an improving economic environment in the second half of 2024. Notably, we believe that advertising trends are improving into the first quarter 2024, with the rate of decline moderating for both Radio and Television.
National advertising expected to strengthen. The weakness in National was the biggest issue for broadcasters in 2023. We believe that National advertising trends should improve in 2024 both from the perspective of a sluggish consumer in the first half and from an improving economic outlook in the second half.
How big will Political be?We anticipate a strong political advertising environment in 2024, an increase of 13% to roughly $10 billion from 2020 levels. Importantly, about half of the high margin political advertising dollars are expected to be spent with television broadcasters.
Highlights of favorite picks for 2024. Media stocks are typically early cycle stocks, which tend to outperform in the midst of the economic downturn or trough as investors begin to anticipate economic improvement. We believe media stocks are timely and offer a compelling return potential given depressed valuations. In addition, some companies pay a dividend, offering attractive total return potential.
Investment Appraisal
Optimism For A Good 2024
The fortunes of advertising based companies are driven by the economy and the health of the consumer. As such, we start this report with our take on the economy in 2024. On December 4th, at Florida Atlantic University (FAU) in Boca Raton, Florida, Noblecon19 hosted an economic panel to discuss the business environment outlook for 2024. The economic panel consisted of a diverse group of industry professionals with a wide range of expertise and experience. In our economic outlook for 2024, we take into consideration the perspective of Jose Torres, Senior Economist at Interactive Brokers.
Mr. Torres highlighted 2023 as a resilient year for consumer spending, which was driven by excess pandemic savings accumulated in 2020 and 2021. Mr. Torres anticipates a slowdown in consumer spending and a strong labor market in 2024. Notably, he believes a resilient labor market will keep consumers spending and will keep the country from falling into a recession. Additionally, Mr. Torres highlighted that Personal Consumption Expenditures (PCE) annualized inflation over the last six months is running near 2.5%, which is very close to the FED’s goal of 2.0%. With moderating inflation pressures, Mr. Torres highlighted that the FED is likely to cut rates in March of 2024, which would be beneficial for small and mid-cap companies. While Mr. Torres largely has a positive outlook for 2024 and beyond, a point of concern was the federal government’s growing interest expense on debt, he noted that the government will eventually have to reduce spending or accept 3% – 3.5% inflation over the long-term.
The general U.S. economy is expected to soften in 2024, particularly in the first half, with a prospect that the economy could slip into recession. Our economic scenario for 2024 anticipates the economy will soften in the first half of the year and rebound in the second half of the year due to the prospect of a lower interest rate environment and resilient labor market.
The video of the Economic Perspectives panel may be viewed here.
Small Cap Cycle?
Small cap investors have gone through a rough period. For the past several years, investors have anticipated an economic downturn. With these concerns, investors turned toward “safe haven” large cap stocks, which by and large can weather economic downturns and have significant trading volume should investors need to sell their positions. Notably, there is a sizable valuation disparity between the two classes, large cap and small cap, one of the largest since 1999. Some of the small cap stocks we follow trade at a modest 2.5 times Enterprise Value to EBITDA, compared with large cap valuations as high as 15 times. We believe the disparity is due to higher risk in the small cap stocks, given that some companies may not be cash flow positive, have capital needs, or have limited share float. However, investors seem to have overlooked small cap stocks with favorable fundamentals. While small cap stocks are more speculative than large caps, many are growing revenues and cash flow, have capable balance sheets, and/or are cash flow positive. In our view, the valuation gap should resolve itself over time for attractive emerging growth stocks. Some market strategists suggest that small cap stocks trade at the most undervalued in the market.
Dan Thelen, Managing Director of small cap equity at Ancora Advisors, highlighted the valuation gap between small cap and large cap stocks during the economic panel at Noblecon19 on December 5, 2023. Mr. Thelen noted that investors are not recognizing the risk mitigation efforts small cap companies have undertaken in the high interest rate environment. He believes that changes small cap companies have implemented are not reflected in stock prices and should be a tailwind moving forward. Again, his comments can be viewed on the video of the Economic Perspectives panel here.
2024 Advertising Outlook
In our advertising outlook for 2024, we take into consideration the perspective of Lisa Knutson, Chief Operating Officer (COO) of E.W Scripps. Ms. Knutson is on the frontline of the economy as one of the largest TV broadcasters in the country. As a speaker on the Noblecon19 economic panel, she depicted the local and national advertising markets as a tale of two cities. Notably, Ms. Knutson highlighted resilience in local advertising and sequential improvement over the past few quarters in the auto advertising category. Additionally, she highlighted green shoots in local advertising, particularly in the services, home improvement and retail advertising categories. Importantly, political ad spend for the 2024 election cycle is expected to be approximately $10 billion, which is roughly a 13% increase from 2020, as illustrated in Figure #1 Political Ad Spend. About half of the high margin political advertising dollars are expected to be spent with television broadcasters. Our advertising forecast for television, radio and digital are highlighted later in this report.
Figure #1 Political Ad spend
Source: Statista
Stock Recommendations
With our economic scenario in mind, we have identified certain media stocks that should perform well and/or lead the industry as economic prospects improve. Media stocks are typically early cycle stocks. This means that the stocks tend to outperform in the midst of the economic downturn or trough as investors begin to anticipate economic improvement. In addition, small cap stocks in general have been out of favor, with many stocks trading at historic low stock valuations (over the past several economic cycles) and also relative to the valuations of leadership stocks, such as the Magnificent 7 (Apple, Microsoft, Alphabet (Google), Netflix, Amazon, Nvidia and Tesla). This report highlights some of our favorite picks for 2024. Our favorites include companies that are leveraged to benefit from the influx of Political advertising and improving economy, generate positive free cash flow, and have capable balance sheets to invest it growth initiatives. Finally, we recommend stocks that have compelling valuations and/or pay a dividend to provide an attractive total return investment opportunity.
Digital Media & Technology
Decelerating Revenue Growth, But Faster Than Other Advertising Categories
Digital Advertising has been growing rapidly over the past several years, bolstered by cord-cutting trends and generally, by an increasingly digital world. Digital Advertising includes various categories of advertising, such as audio, video, influencer, search, banner, and others. According to Statista, U.S. Digital Advertising spending is expected to grow at 15% Compound Annual Growth Rate (CAGR), from 2017-2028, from $90.1 billion to $402.1 billion. Figure #2 U.S. Digital Advertising Spend illustrates the 2017-2028 forecast, which is inclusive of the various different sub-categories of Digital Advertising.
Figure #2 U.S. Digital Advertising Spend
Source: Statista
Specifically in 2024, U.S. Digital Advertising is expected to grow a healthy 10% above 2023 levels, according to Statista. There are some categories of Digital Advertising, however, that are expected to grow especially fast in 2024, such as Connected TV (CTV) advertising, programmatic advertising, and influencer advertising. All three categorizations of Digital advertising are estimated to have above-average growth in 2024. According to Statista, influencer advertising in the U.S. will grow at 14% in 2024, while, according to eMarketer, U.S. programmatic and CTV advertising will grow at 13% and 17%, respectively.
In our view, there are several key factors strengthening these verticals. For example, influencer advertising allows brands to reach younger demographics through personalities those audiences trust. Moreover, during a time when there is uncertainty around the future of cookies and other forms of User IDs for targeted advertising, influencer advertising offers an alternative vehicle for audience targeting. Google has indicated plans to no longer use 3rd party cookies to deliver advertising in 2024, although the implementation of this plan has been delayed multiple times before. Additionally, we believe cord cutting is a major factor in the growth of connected TV, likely to be a strong growth vertical for programmatic digital advertising.
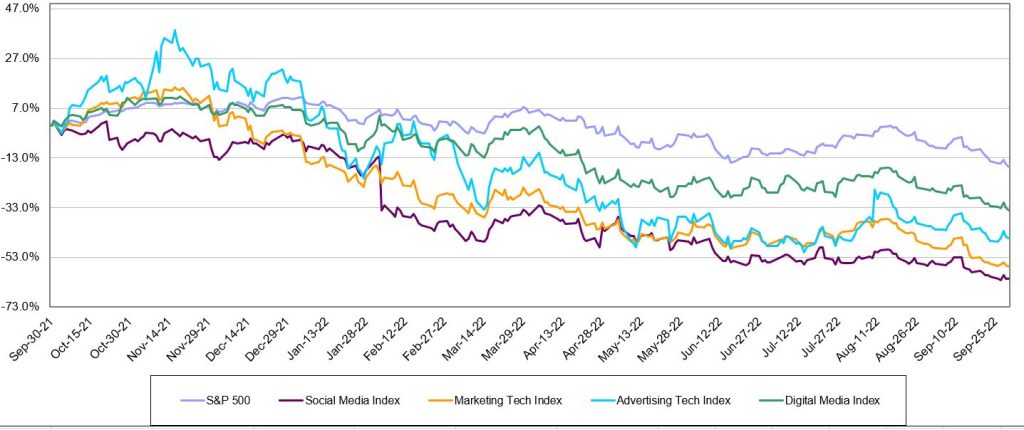
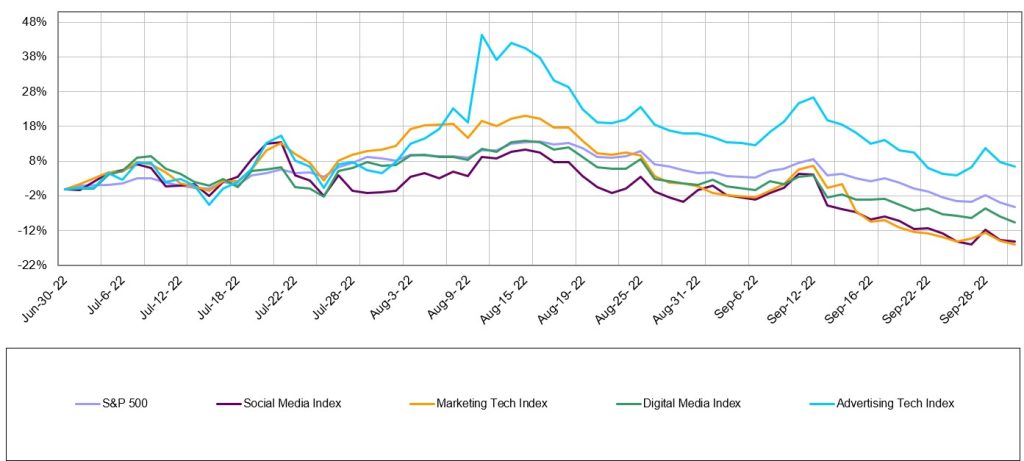
Noble’s Digital Media indices fared well over the past year with most outperforming the S&P 500 over that span, as illustrated in Figure #4 Digital Media LTM Performance. Most recently, the Social Media and Marketing Tech indices have performed strongest, up 18.9% and 24.2%, respectively, over the last 3-months. Figure #3 Digital Media 3-month Performance illustrates the last quarter’s performance by Noble’s Digital Media indices. However, many of the indices were skewed positively by the strong stock performance of the larger cap constituents. For example, META was up 194% over the trailing 12 months, while Adobe (ADBE) and Salesforce (CRM) also performed well, up 77% and 98%, over the same timeframe, respectively. Yet, in Q4 the performance disparity began to abate with the smaller cap constituents of Noble’s Digital indices contributing more to the positive returns, for the most part. We believe this could signal the beginning of shift towards the smaller cap stocks that had depressed valuations in 2023 relative to their large cap counterparts.
Despite the large cap versus small cap valuation disparity in 2023, there are several small cap stocks that performed well over the past 12 months, outshining respective indices. Notably, Direct Digital Holdings (DRCT) was up roughly 500% over the past year. Most of the runup of DRCT occurred late in Q4, after the company reported results far exceeding Street estimates. In our view, DRCT was substantially undervalued and is beginning to be discovered by more investors. Importantly, the increased trading activity has put the stock on investing screens for institutional, small cap investors. Another notable small cap performance was Townsquare Media (TSQ), which has a large Digital Advertising component to its business. TSQ was up 45% in the past year.
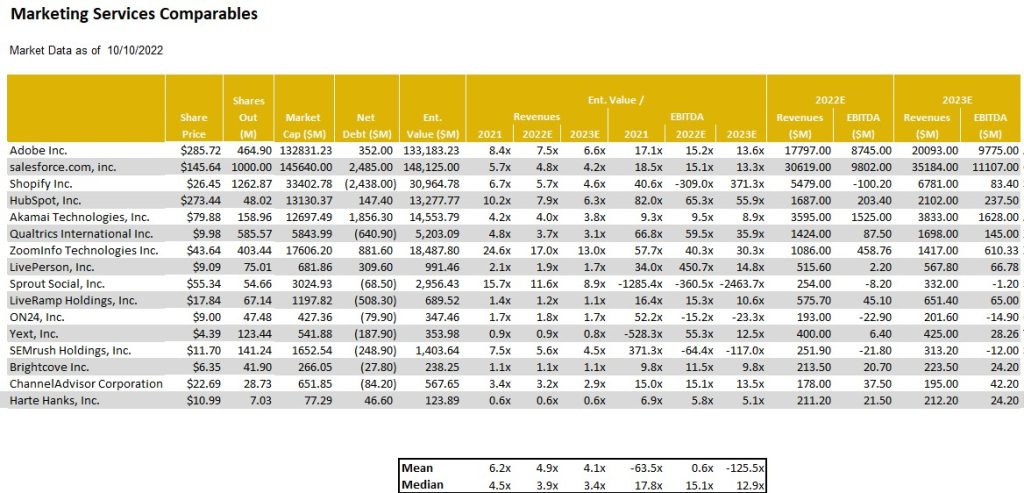
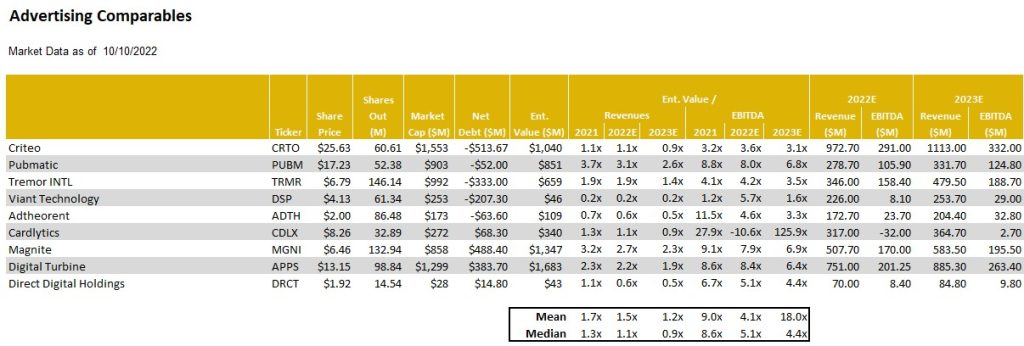
Below, we outlined some of the investment highlights for our closely followed Digital Media companies. In addition, Figure #5 Ad Tech Industry Comparables highlights the stock valuations of the sector. As the chart depicts, our favorite stocks current trade well below the averages for the industry and some of the larger cap names. One of our closely followed companies, AdTheorent, is a stand out. Near current levels, the ADTH shares trade at a modest 2.5 times Enterprise Value to our 2024 Adj. EBITDA estimate, well below the 15.1 times average for the sector. Given the compelling stock valuation, we highlight this company as our current favorite in the industry. In addition, the Direct Digital shares trade at 10 times Enterprise Value to our 2024 Adj. EBITDA estimate, well below the 15.1 times industry average. As such, we view the DRCT shares as compelling.
Figure #3 Digital Media 3-month Performance
Source: Capital IQ
Figure #4 Digital Media LTM Performance
Source: Capital IQ
Direct Digital Holdings (DRCT) – Programmatic Advertising. We view DRCT as a compelling play on the Programmatic Advertising market. The company operates a sell-side platform (SSP), in addition to servicing buy-side advertising clients through managing their digital advertising strategies. Importantly, the company’s niche comes from its deep relationships with multi-cultural publishers, a key competitive advantage in our view. In 2024, we estimate the company’s revenue will grow 30% above our 2023 forecast with adj. EBITDA growth of 33%. For research reports and important disclosures, please click here.
AdTheorent (ADTH) – Programmatic Advertising. ADTH is a unique play on programmatic advertising with cutting-edge audience targeting capabilities, powered by its machine learning (ML) platform. Due to its ML platform, the company does not need to use third-party cookies and other forms of user IDs to target audiences. Not only does this position the company well for Google’s phasing our of third-party cookies, but it also allows the company to offer clients a privacy-forward method of audience targeting. Some key verticals for the company include the healthcare industry as well as connected TV. For research reports and important disclosures, please click here.
Townsquare Media (TSQ) – Programmatic & SMB Digital Advertising. TSQ is a media company that has transformed from primarily a radio station operator to a Digital Advertising business, boasting multiple digital verticals. We believe it is a compelling play on the digital transition occurring in small business across the country. The company provides comprehensive digital marketing services to small and medium-sized businesses in its radio markets, leveraging its deep local relationships. Additionally, the company operates a programmatic advertising business, which is benefiting from the growth of CTV. For research reports and important disclosures, please click here.
Entravision Communications (EVC) – Programmatic & Social Media Advertising. EVC is one of our favorite social media advertising plays. The company serves as Meta’s exclusive ad agency in several emerging markets, such as, certain regions of Latin America. It also represents TikTok in parts of Asia. In addition, the company owns a programmatic agency, known as Smadex. For research reports and important disclosures, please click here.
Figure #5 Ad Tech Industry Comparables
Source: Noble estimates & Company filings
Traditional Media
The Largest Caps Performed The Best
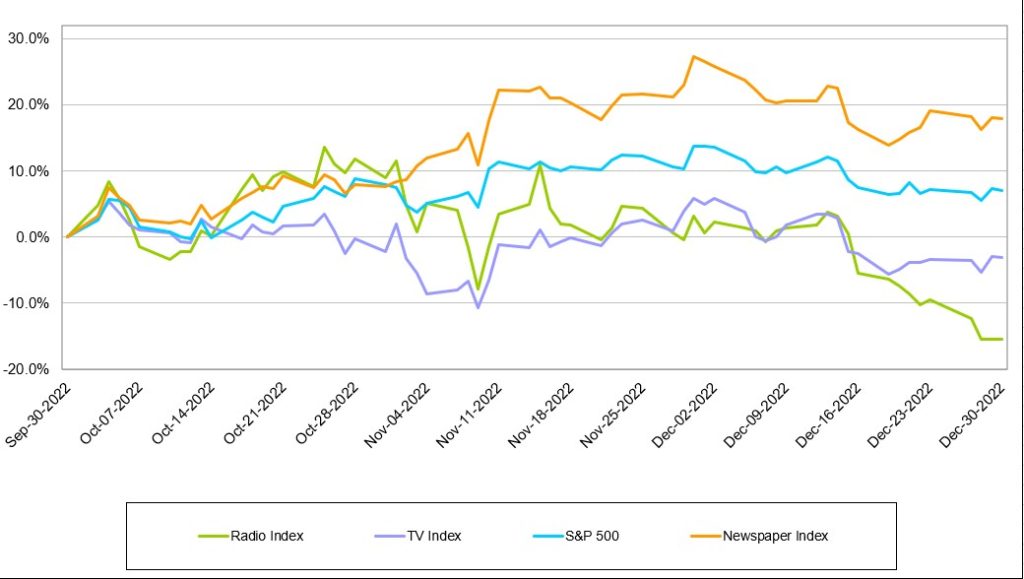
The Newspaper Index was the only traditional media sector that outperformed the general market in the past quarter and trailing 12 months, as illustrated in Figure #7 Traditional Media LTM Performance. In the latest quarter, Newspaper stocks outperformed the general market, up 20.4% versus down 11.2% for the general market as measured by the S&P 500 Index. Notably, our index performances are market cap weighted, meaning larger cap stocks have a greater impact on index return than small cap stocks. In Q4, only two stocks in the Newspaper index, NYT and NWSA, posted positive returns. These were the largest cap stocks in the index. In Q4, NWSA and NYT were up 22.4% and 18.9%, respectively. For full year 2023, four out of the five companies in the Newspaper index posted positive returns, the strongest performers were NYT and NWSA, up 50.9% and 34.9%, respectively. The Broadcast TV Index was up a modest 5.2% for the quarter and down 11% over the past year. The worst performing index over the last quarter was the Radio Broadcast index, down on 10.9%, as Illustrated in Figure #6 Traditional Media 3-Month Performance. Additionally, the Radio stocks were the worst performing group over the last year as well, down 34.9%. While the Radio Broadcast Index and Broadcast TV Index had a tough year in 2023, we believe both indices should improve in 2024. We highlight some of our favorites in the sector commentary below.
Figure #6 Traditional Media 3-month Performance
Source: Capital IQ
Figure #7 Traditional Media LTM Performance
Source: Capital IQ
Television Broadcast
Looking For A Better 2024
The Television industry had a tough year with soft core advertising and the absence of the year earlier Political advertising. Television revenues are estimated to have declined as much as 20% in 2023 inclusive of the absence of year earlier Political advertising. Total core television advertising is expected to have decline 3% in 2023, which excludes Political advertising, reflecting disproportionately weak National advertising and resilient Local advertising. Importantly, Television advertising accounts for less than 50% of total television revenue, with Retransmission revenue largely accounting for the balance. With growth in Retransmission revenue, we estimate that total Television revenue declined roughly 10% in 2023.
We believe that revenue trends will improve in 2024 for the TV industry, supported by an influx of Political advertising and moderating trends in core National advertising. Nonetheless, given the exceptional Political advertising year that is expected, core advertising is expected to decline in 2024, with some advertising being displaced by the large volume of Political. We anticipate that Core advertising will decline roughly 2.3% in 2024, with total TV advertising up nearly 30% (reflective of the influx of Political). Total Television revenue, which includes Retransmission revenues, are expected to increase roughly 20%.
We believe that the TV industry has some long term fundamental headwinds, which include continued weak audience trends, cord cutting (which adversely affects Retransmission revenue growth opportunities), and shifts in National advertising toward Digital and Influence Marketing. Offsetting these trends are Connected TV and prospects for new revenue opportunities offered by the new broadcast standard, ATSC 3.0. Importantly, the very high margin Political advertising every even year allows the industry to reduce debt and/or return capital to shareholders.
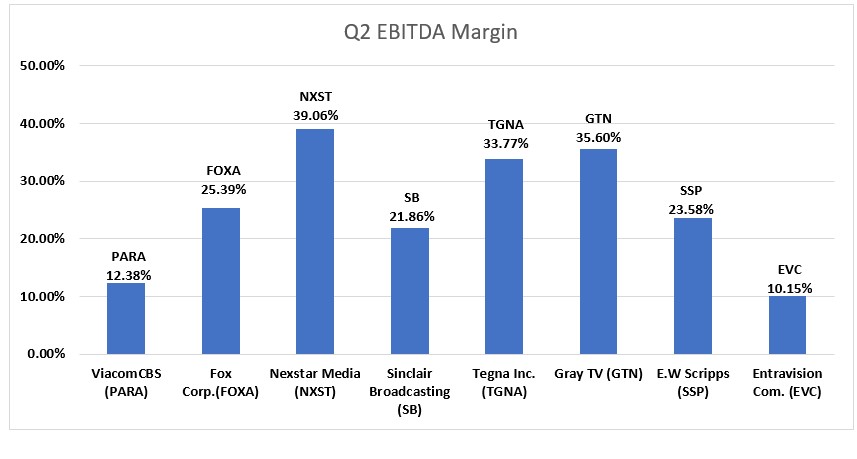
Our closely followed Television companies, E.W. Scripps and Gray TV, are among the two companies best positioned to benefit for the influx of Political advertising. Both are in swing markets that should disproportionately benefit from Political. In the case of E.W. Scripps, the company has a developed business model that benefits from cord cutting as consumers switch toward Connected TV and Over The Air Networks. Furthermore, in 2024, E.W. Scripps will benefit from double digit growth in Retransmission revenue as 75% of its subscribers have been renegotiated at significantly higher rates. Both companies, E.W. Scripps and Gray, are highly debt levered. As such, we believe that paring down debt should improve the equity value of the shares in 2024. In addition, we believe that both companies have compelling stock valuations. While the SSP and the GTN shares trade near the industry averages, the industry averages are well below past cycles. We would look for multiple expansion as economic prospects improve. At the same time, as free cash flow improves from high margin Political advertising, debt reduction should allow for a swing toward improved equity values. As such, the shares of SSP and GTN represent a compelling way to play both an improved economic outlook towards the second half of 2024 and influx of high margin Political advertising. Again, SSP has the benefit of strong growth of Retransmission revenue, as well.
E.W. Scripps (SSP): One of the nation’s largest TV station broadcasters and unique play on the trend toward cable cord cutting. Scripps has nationwide over the air networks that can be viewed with a digital antennae that do not require a cable or satellite service. Given its orientation toward national networks, the company is expected to disproportionately benefit from the influx of national advertising. In addition, the company’s TV stations are located in swing States and in hotly contested markets that should benefit from the influx of Political advertising in 2024. We believe the level of Political will be closely watched by investors as the high margin Political advertising will allow the company to aggressive pare down debt, assuaging investor concerns over its current leverage. For research reports and important disclosures, please click here.
Gray Television (GTN): One of the nation’s largest television broadcasters, the company has historically led the industry in terms of revenue and disproportionately benefits from the influx of Political advertising. In addition, the company is expected to benefit in 2024 from its investment in the development of its studios in the Atlanta area called Assembly Atlanta. The company has yet to disclose the full benefit of the current lease arrangement. We believe that the value of the development and the stream of lease payments are not fully reflected in the current stock valuation. Furthermore, the company is expected to aggressively pare down debt through the influx of high margin Political advertising and the lease payments. In our view, the shares should react well to debt reduction. For research reports and important disclosures, please click here.
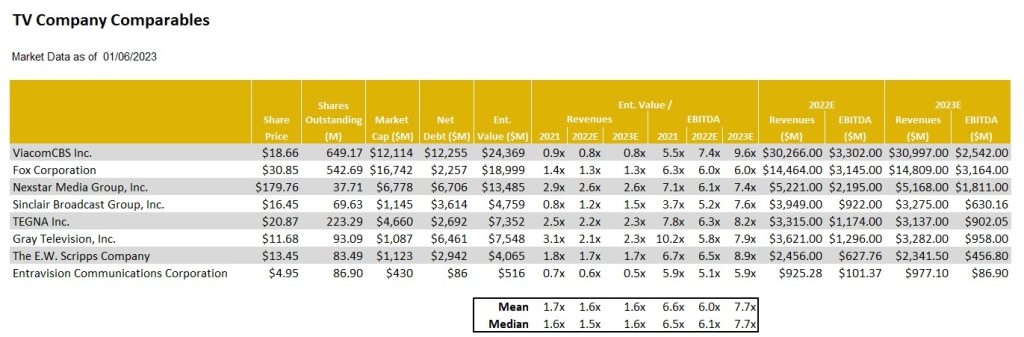
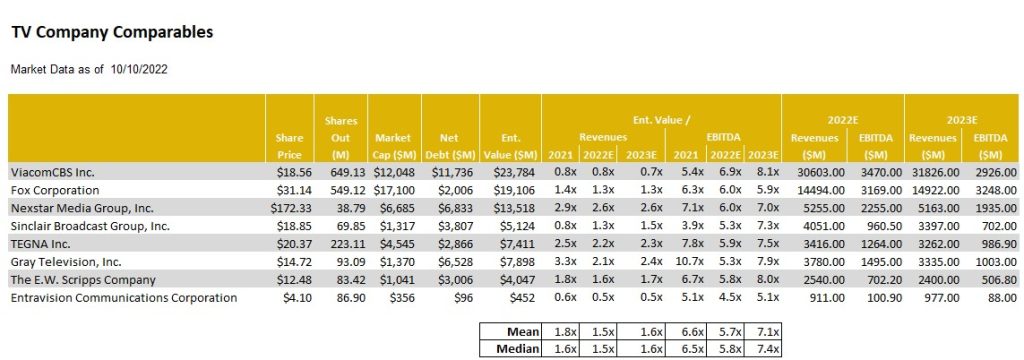
Figure #8 TV Industry Comparables
Source: Noble estimates & Company filings
Radio Broadcast
Debt Struggles
Based on our estimates and our closely followed companies, Radio advertising is expected to have decreased 5.5% for the full year 2023. Illustrated in Figure #9 Radio Advertising Revenue. This decline reflected the adverse impact of rising interest rates and significant inflation, which hurt many consumer oriented advertising categories, as well as financials. In addition, we believe that Radio struggled with some headwinds from declines in listenership, as many consumers continue to work remotely post Covid pandemic. Local advertising was more resilient than National, which tends to be more economically sensitive. We estimate that Local advertising was down 6%, while National was down 19%. The results are expected to reflect the absence of Political advertising from the year earlier biennial elections. Digital advertising was a bright spot, increasing 6%, largely offsetting the decline in National revenue.
Figure #9 Radio Advertising Revenue
Source: Statista
Looking forward toward 2024, we expect Radio advertising trends to improve throughout the year, with the expectation that December 2023 may have been the trough for this economic cycle. Both Local and National advertisers should begin to anticipate improved economic conditions with the expectation that the Fed will lower interest rates late in the first quarter. Even though the economy is anticipated to continue to weaken in the first half 2024, advertisers may advertise to drive customer traffic and in anticipation of improved economic conditions. We anticipate that the year will start off weak, with the first quarter 2024 revenue expected to be down, but a more moderate decrease between 3% to 4%. Notably, the industry does not receive a significant amount of Political advertising in the first quarter.
In 2024, we expect consumer spending to soften, which will have an adverse affect on consumer oriented advertising, particularly Retail. Auto advertising is expected to buck that trend. In our view, auto manufacturers and dealers will likely step up advertising and promotions to lure consumers. Assuming lowered interest rates, we expect that Financial advertising should improve in the second half of the year, as well. Revenues are expected to be second half weighted, with improving core advertising trends and the benefit of the influx of Political advertising. Radio does not typically receive a significant amount of Political advertising, but it accounts for a meaningful 3% of total core advertising for the year. Political advertising largely falls in the third and fourth quarter. In addition, National advertising trends should improve in the second half as economic prospects improve. Digital advertising is expected to grow but more moderately than 2023, which is expected to be up 6%. We believe that Digital will increase near 5%, but some companies that have less developed Digital businesses, should report faster growth.
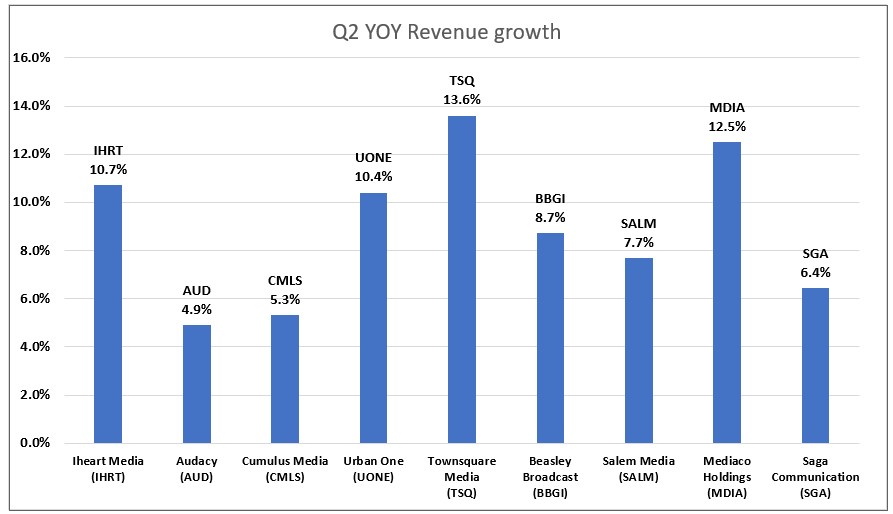
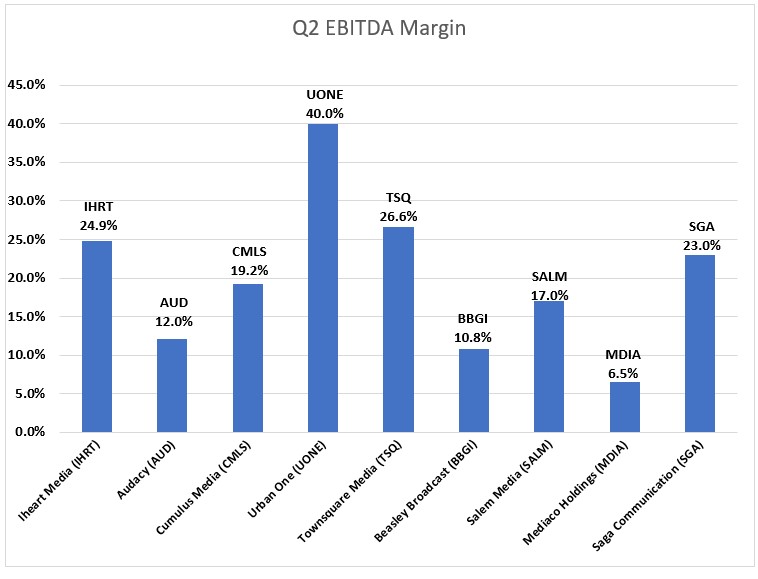
In total, based on our closely followed companies, we anticipate Radio revenue growth of 5.6% in 2024. Our estimate is inclusive of our Political advertising outlook.
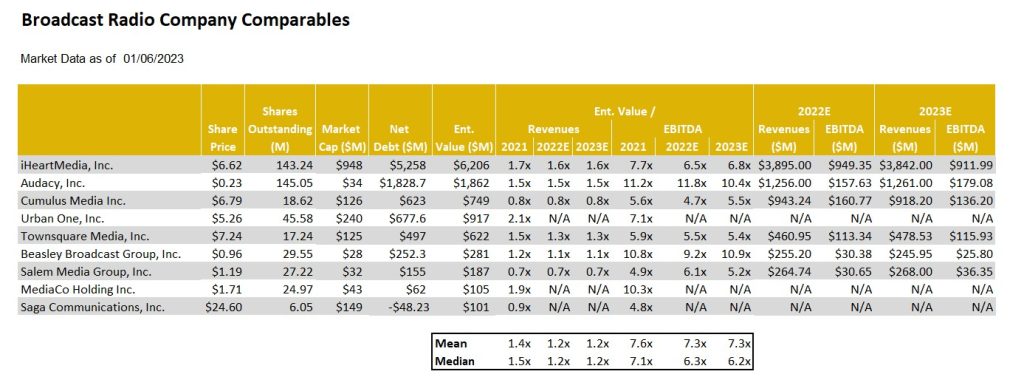
We encourage investors to take a basket approach to investing in the industry, as most companies should benefit from the improving fundamentals in 2024. Below we have outlined some of the investment highlights for our closely followed Radio companies. In addition, Figure #10 Radio Industry Comparables highlight the stock valuations of the sector, which are currently trading at recession type valuations levels.
Beasley Broadcast (BBGI): We believe that the company will reflect above average revenue and cash flow growth in 2024 due to the prospect of fast growth of its developing Digital businesses. Digital accounted for roughly 20% of the company’s total revenues in 2023 and are expected to be a key revenue driver in 2024. In addition, the company’s stations are located in large, swing State markets and should benefit from the influx of Political advertising. The company does carry above average debt loads, but we expect that the company will pare down debt by roughly $20 million from current levels. The company’s target debt levels are $250 million by year end. For a Beasley Broadcast report and important disclosures, please click here.
Cumulus Media (CMLS): The company is viewed as a leveraged play on a recovery in National advertising. Given the company’s Network business, which is virtually all National advertising, roughly 50% of total company revenues are derived from National advertising. This is significantly higher than the industry average, which is roughly 12%. National advertising is expected to rebound as economic prospects improve in 2024. In addition, the company should disproportionately benefit from the influx of Political advertising. We estimate $23.5 million in high margin Political advertising, a 20% increase from the last Presidential election cycle, expected to total roughly 3.7% of 2024 advertising revenues. For research reports and important disclosures, please click here.
Entravision (EVC): Radio represents a small portion of total company revenues as the company has transitioned toward a Digital agency business model. Over 80% of total company revenues comes from its Digital businesses. As such, Entravision should grow faster than Radio industry averages as its Digital business is expected to grow. Furthermore, Entravision has one of the best balance sheets in the industry, expected to have virtually no net debt by year end. Finally, the EVC shares are among the cheapest in the industry, as highlighted in Figure # Radio Industry Comparables. For research reports and important disclosures, please click here.
Saga Communications (SGA): Historically, the company has led the industry in terms of revenue and cash flow growth. Over the past few years, it lost that honor as the industry moved to expand its fast growing digital operations. Most recently, Saga has regained its top spot as it has developed its Digital operations and non traditional radio revenue. While the industry has moved Digital to account for as much as 50% of total company revenues, Saga currently is at a more modest %. Nonetheless, its nascent Digital operations are growing at a rapid rate, allowing total company revenues to exceed industry averages. Saga has one of the best balance sheets in the industry, with a large cash position and virtually no debt. Furthermore, the company pays an attractive dividend, and, as such, represents an attractive total return potential. The SGA shares are largely undiscovered, trading at one of the cheapest stock valuation in the radio sector. For research reports and important disclosures, please click here.
Salem Media Group (SALM): Salem has a relatively stable Radio advertising business given its orientation toward the sale of long and short form block programming. Recently, the company tripped a debt covenant which created investor anxiety over its high debt leverage. The company recently announced that it plans to sell its Salem Church Products division for $30 million, it refinanced its revolver, and announced the sale of its money losing book publishing company, Regnery. In addition to these measures, the company has streamlined its management team and lowered costs. Recently, the company decided to delist, rather than seek alternatives to remain on its current exchange. In addition, the company has not closed on its planned sale of its Church Products division. As such, we believe that the company has significant hurdles to put itself on a path toward free cash flow generation and debt reduction. For research reports and important disclosures, please click here.
Townsquare Media (TSQ): Townsquare has led the charge toward a Digital transformation, with over 50% of its revenues from its Digital businesses. Importantly, its Digital businesses have margins are in line or better than its traditional Broadcast business. While a segment of its Digital business declined in 2023, we expect that it will regain its revenue momentum in 2024, particularly in the second half. At that time, the company is expected to benefit from an influx of high margin Political advertising, as well. We believe that the company has one of the best Digital strategies in the industry and is widely viewed as the model for other aspiring Digital divisions at other Radio companies. The shares trade below that of its industry peers, in spite of its above average revenue and cash flow growth. For research reports and important disclosures, please click here.
Figure #10 Radio Industry Comparables
Source: Noble estimates & Company filings
GENERAL DISCLAIMERS
All statements or opinions contained herein that include the words “we”, “us”, or “our” are solely the responsibility of Noble Capital Markets, Inc.(“Noble”) and do not necessarily reflect statements or opinions expressed by any person or party affiliated with the company mentioned in this report. Any opinions expressed herein are subject to change without notice. All information provided herein is based on public and non-public information believed to be accurate and reliable, but is not necessarily complete and cannot be guaranteed. No judgment is hereby expressed or should be implied as to the suitability of any security described herein for any specific investor or any specific investment portfolio. The decision to undertake any investment regarding the security mentioned herein should be made by each reader of this publication based on its own appraisal of the implications and risks of such decision.
This publication is intended for information purposes only and shall not constitute an offer to buy/sell or the solicitation of an offer to buy/sell any security mentioned in this report, nor shall there be any sale of the security herein in any state or domicile in which said offer, solicitation or sale would be unlawful prior to registration or qualification under the securities laws of any such state or domicile. This publication and all information, comments, statements or opinions contained or expressed herein are applicable only as of the date of this publication and subject to change without prior notice. Past performance is not indicative of future results. Noble accepts no liability for loss arising from the use of the material in this report, except that this exclusion of liability does not apply to the extent that such liability arises under specific statutes or regulations applicable to Noble. This report is not to be relied upon as a substitute for the exercising of independent judgement. Noble may have published, and may in the future publish, other research reports that are inconsistent with, and reach different conclusions from, the information provided in this report. Noble is under no obligation to bring to the attention of any recipient of this report, any past or future reports. Investors should only consider this report as single factor in making an investment decision.
IMPORTANT DISCLOSURES
This publication is confidential for the information of the addressee only and may not be reproduced in whole or in part, copies circulated, or discussed to another party, without the written consent of Noble Capital Markets, Inc. (“Noble”). Noble seeks to update its research as appropriate, but may be unable to do so based upon various regulatory constraints. Research reports are not published at regular intervals; publication times and dates are based upon the analyst’s judgement. Noble professionals including traders, salespeople and investment bankers may provide written or oral market commentary, or discuss trading strategies to Noble clients and the Noble proprietary trading desk that reflect opinions that are contrary to the opinions expressed in this research report. The majority of companies that Noble follows are emerging growth companies. Securities in these companies involve a higher degree of risk and more volatility than the securities of more established companies. The securities discussed in Noble research reports may not be suitable for some investors and as such, investors must take extra care and make their own determination of the appropriateness of an investment based upon risk tolerance, investment objectives and financial status.
Company Specific Disclosures
The following disclosures relate to relationships between Noble and the company (the “Company”) covered by the Noble Research Division and referred to in this research report. Noble is not a market maker in any of the companies mentioned in this report. Noble intends to seek compensation for investment banking services and non-investment banking services (securities and non-securities related) with any or all of the companies mentioned in this report within the next 3 months
ANALYST CREDENTIALS, PROFESSIONAL DESIGNATIONS, AND EXPERIENCE
Senior Equity Analyst focusing on Basic Materials & Mining. 20 years of experience in equity research. BA in Business Administration from Westminster College. MBA with a Finance concentration from the University of Missouri. MA in International Affairs from Washington University in St. Louis. Named WSJ ‘Best on the Street’ Analyst and Forbes/StarMine’s “Best Brokerage Analyst.” FINRA licenses 7, 24, 63, 87
WARNING
This report is intended to provide general securities advice, and does not purport to make any recommendation that any securities transaction is appropriate for any recipient particular investment objectives, financial situation or particular needs. Prior to making any investment decision, recipients should assess, or seek advice from their advisors, on whether any relevant part of this report is appropriate to their individual circumstances. If a recipient was referred to Noble Capital Markets, Inc. by an investment advisor, that advisor may receive a benefit in respect of transactions effected on the recipients behalf, details of which will be available on request in regard to a transaction that involves a personalized securities recommendation. Additional risks associated with the security mentioned in this report that might impede achievement of the target can be found in its initial report issued by Noble Capital Markets, Inc.. This report may not be reproduced, distributed or published for any purpose unless authorized by Noble Capital Markets, Inc..
RESEARCH ANALYST CERTIFICATION
Independence Of View All views expressed in this report accurately reflect my personal views about the subject securities or issuers.
Receipt of Compensation No part of my compensation was, is, or will be directly or indirectly related to any specific recommendations or views expressed in the public appearance and/or research report.
Ownership and Material Conflicts of Interest Neither I nor anybody in my household has a financial interest in the securities of the subject company or any other company mentioned in this report.
Michael Kupinski, Director of Research, Noble Capital Markets, Inc.
Jacob Mutchler, Research Associate, Noble Capital Markets, Inc.
Refer to the bottom of the report for important disclosures
Overview: A new small-cap cycle?Small cap stocks have underperformed the large cap stocks for the past several years. Notably, there is a sizable valuation disparity between the two classes, one of the largest in over 20 years. Some of the small cap stocks we follow trade at a modest 2 times Enterprise Value to EBITDA, compared with large cap valuations as high as 13 to 15 times. Are we on a cusp of a small cap cycle?
Digital Media & Technology:Stocks Outperform – But Don’t Get Too Excited. Each of Noble’s Internet and Digital Media Indices, which are market cap weighted, outperformed the S&P 500 in the third quarter, but the double-digit gains from the previous quarter moderated significantly. Despite these relatively positive results, the prevailing theme within each sector was that the largest cap stocks performed the best, while smaller cap stocks across a variety of sectors struggled.
Television Broadcasting:Advertising Stabilizing?As we look toward the third quarter, local advertising appears to be weakening as the economy appears to be slowing. But, national appears to be improving. In addition, while it was assumed that Political would increase in the fourth quarter due to the run-off of the Republican presidential candidates, we believe that President Biden has recently stepped-up advertising in the third quarter, particularly in Hispanic communities.
Radio Broadcasting:Shoring up balance sheets.As many radio companies face a challenged revenue environment and at the same time invested in faster growth digital revenue, some companies have been caught carrying a substantial amount of debt. In this report, we highlight one company that was able to shore up its balance sheet through asset sales.
Publishing:Stocks outperform. It may be hard to imagine for some investors, but the Publishing stocks outperformed in both the latest quarter and for the trailing 12 months the S&P 500! But, there is still a wide valuation gap between most of Publishers and the shares of The New York Times, with the NYT shares at 15 times cash flow and the rest near 5.
Overview
The case for small caps
Small cap investors have gone through a rough period. For the past several years, investors have anticipated an economic downturn. With these concerns, investors turned toward “safe haven” large cap stocks, which typically have the ability to weather the economic headwinds and have enough trading volume should investors need to exit the position. Since 2018, small cap stocks have underperformed the general stock market, with annualized returns of just 3.7% as measured by the S&P 600 Small Cap Index versus the general market of 10.2% as measured by the S&P 500 Index. Another small cap index, the Russell 2000, increased a more modest 2.9% annually over the comparable period. The S&P 500 is larger cap, with the minimum market cap of $14.6 billion. The S&P 600 is smaller cap, a range of $850 million to $3.7 billion, with the Russell 2000 median market cap $950 million. Some of the even smaller cap stocks, those between $100 million to $850 million, have significantly underperformed the S&P 600. This is the first time that small caps underperformed a bullish period for all stocks since the 1940s. Notably, there is a sizable valuation disparity between the two classes, large and small cap, one of the largest in over 20 years.
Some of the small cap stocks we follow trade at a modest 2 times Enterprise Value to EBITDA, compared with large cap valuations as high as 13 to 15 times. By another measure, small cap stocks may be the only class trading below historic 25 year average to the median Enterprise Value to EBIT. Why the large valuation disparity? We believe that there is higher risk in the small cap stocks, especially given that some companies may not be cash flow positive, have capital needs, or have limited share float. But, investors seem to have thrown the baby out with the bathwater. While those small cap stocks are on the more speculative end of the scale, many small cap stocks are growing revenues and cash flow, have capable balance sheets, and/or are cash flow positive. For attractive emerging growth companies, the trading activity will resolve itself over time. Some market strategists suggest that small cap stocks trade at the most undervalued in the market, as much as a 30% to 40% discount to fair value.
Are we on a cusp of a small cap cycle? Some fund managers think so. Such a cycle could last 10 years or longer. In this report, we highlight a few of our small cap favorites in the Media sector, those include companies that have attractive growth characteristics, some with or without an improving economy, capable balance sheets, and limited capital needs. Our current favorites based on growth opportunity and stock valuation include: Direct Digital (DRCT), Entravision (EVC), E.W. Scripps (SSP), Gray Television (GTN), and Townsquare Media (TSQ).
After increasing by 8% in the second quarter of 2023, the S&P 500 was unable to hold onto those gains in the third quarter. The S&P Index decreased by 3.6% in the third quarter, a decline which we attribute to the market revising its interest rate expectations to one in which rates would remain “higher for longer”. Large cap stocks that weighed on the broad market index included tech stocks such as Apple (AAPL: -12%), Microsoft (MSFT: -7%) and Tesla (TSLA: -4%). Despite this small step backwards, the S&P 500 Index increased by 20% through the first nine months of the year.
Each of Noble’s Internet and Digital Media Indices, which are market cap weighted, outperformed the S&P 500 in the third quarter, but the double-digit gains from the previous quarter (2Q 2023) moderated significantly. Digital Media 3-Month Performance Sectors that outperformed the S&P 500’s 4% decrease include Noble’s Digital Media Index (+6%), Social Media Index (+4%), Gaming Index (+3%), Ad Tech Index (+1%) and MarTech Index (-3%). Despite these relatively positive results, the prevailing theme within each sector was that the largest cap stocks performed the best while smaller cap stocks across a variety of sectors struggled.
Figure #1 Digital Media 3-Month Performance
Source: Capital IQ
Perhaps more importantly, each of Noble’s Internet and Digital Media Indices have outperformed the S&P 500 over the latest twelve months as illustrated in Figure #2 Digital Versus S&P 500 LTM. The S&P 500 Index has increased by 20% over the last year (through 9/30/2023), which trailed the performance of the each of Noble’s Internet and Digital Media Indices, as shown in Figure #3 Digital Media LTM Performance.
Figure #2 Digital Versus S&P 500 LTM
Figure #3 Digital Media LTM Performance
Source: Capital IQ
Alphabet Powers Digital Media Index Higher Despite Broader-Based Sector Weakness
The best performing index during the quarter was the Noble’s Digital Media Index, but the sector’s “strong” performance is deceiving. Shares of Alphabet (a.k.a. Google: GOOGL) increased by 9% during the quarter, and the company size relative to its peers helps explain the vast majority of the sector’s performance. Google’s market cap is 8x larger than its next largest “peer” in Netflix, and it is 160 times that of the average market cap of its Digital Media peers. Google beat expectations across all metrics (revenue, EBITDA, free cash flow) and guided to improved profitability as it streamlines workflows. The company is also increasingly perceived as a beneficiary of AI. While Alphabet shares performed well, they mask the fact that shares of only 2 of the sector’s 12 stocks were up during the third quarter. The other Digital Media stock that performed well in the quarter was FUBO (FUBO), whose shares increased by 29% in 3Q 2023. Of the 10 other digital content providers in the sector, 7 of them posted double-digit stock price declines in the third quarter.
Large Cap Meta Powers the Social Media Index Higher
Shares in Meta Platforms (formerly Facebook) rose for the third straight quarter. Shares increased by 5% and were up 150% through the first nine months of the year. Meta shares increased by 8% at the start of the third quarter due to excitement around the launch of Threads, Meta’s answer to Twitter. Over 100 million people signed up for Threads within the first five days of its rollout and positions the company well for continued revenue growth once it begins to monetize this new opportunity.
As with the Digital Media Index, the Social Media Index masked underlying weakness across several smaller cap stocks. Of the 6 stocks in the Social Media Index, only Meta shares increased during the quarter. Several social media companies performed poorly during the quarter including Spark Networks (LOVL.Y: -59%), which filed to delist its shares, Nextdoor Holdings (KIND: -44%), which has struggled to reach profitability, and Snap (SNAP: -25%), which guided to revenue declines in 3Q 2023.
“No Love” For Small Cap Stocks
As was the case in the Digital Media and Social Media sectors, the same trends held true in the other sectors: in general, large cap stocks outperformed small cap stocks. For example, Noble’s Video Gaming Index increased by 3% in the third quarter, driven by Activision Blizzard (ATVI: +11%), and to a lesser extent SciPlay Corp (SCP: +16%). However, 7 other stocks in the video gaming sector posted stock price declines in the third quarter. Larger cap names such as EA Sports (EA: -7%) and Take-Two Interactive (TTWO: -5%) posted mid-single digit stock price declines while every small cap video gaming stock posted double digit declines.
Noble’s Ad Tech Index increased by 1% during the quarter driven by shares of AppLovin (APP: +55%), and Taboola (TBLA: +22%). However, just 7 of the sector’s 20 stocks were up for the quarter, and 10 stocks in the sector posted double digit declines. One of our favorites is an attractive growth, small cap company, Direct Digital. The DRCT shares declined 20% in the quarter, in spite of posting favorable Q2 revenue that beat expectations and raising full year revenue estimates. Direct Digital leads our list of favorites in the digital Ad Tech companies. As Figure #4 Ad Tech Comparables indicate, Direct Digital is among the cheapest in the industry trading at 4.7 Enterprise Value to our 2024 adj. EBITDA estimate, well below larger cap peers trading at multiples of 12, 13, or even much higher. Finally, Noble’s MarTech Index decreased by 3% (the only index that declined during the quarter), with the sector’s largest companies, Adobe (ADBE: +4%) and Shopify (SHOP: -16%) posting mixed results. Outside of these mega-cap stocks, the theme of underlying weakness prevailed: only 5 of the 20 stocks in the sector posted stock price increases, while one was flat and the other 14 were down. Eleven of the 20 stocks in the MarTech sector posted double digit stock price declines. One of our favorites in the sector, Harte Hanks performed well in the quarter up 18.8%. This was a welcomed bounce from the steep decline in the shares over the past 12 months, down 44%. The company stumbled on quarterly expectations. We believe that the sell-off was over done, providing a compelling opportunity for investors. As Figure #5 MarTech Comparables illustrates, the HHS shares trade at 3.8 times Enterprise Value to our 2024 adj. EBITDA estimate, a fraction of the multiples of many of its larger cap peers. We view the HHS shares as among our favorites in the sector.
Figure #4 Ad Tech Comparables
Source: Company filings & Eikon
Figure #5 MarTech Comparables
Source: Noble estimates & Company filings
Traditional Media
Virtually all traditional media stocks underperformed the general market in the past quarter and trailing 12 months, as illustrated in Figure #6 Traditional Media LTM Performance, save the Publishing group. In the latest quarter, Publishing stocks outperformed the general market, up 3.0% versus down 3.6% for the general market as measured by the S&P 500 Index. The average Publishing stock is up 6.9% over the past 12 months, with some of the larger cap publishing stocks up significantly more, over 20%. More details on the Publishing performance is in the Publishing section of this report. In the last quarter, the Radio stocks were the worse performing group, down on average 10.2%, As illustrated in Figure #7 Traditional Media 3-Month Performance. In addition, the Radio stocks were the worst performing group in the third quarter as well, down and average of 12.7% for the quarter.
Figure #6 Traditional Media LTM Performance
Source: Capital IQ
Figure #7 Traditional Media 3-Month Performance
Source: Capital IQ
Television Broadcasting
Have the TV stocks discounted too much?
We believe that the economic headwinds of rising interest rates and inflation have begun to hit local advertising. Local advertising had been relatively stable, favorably influenced by a resurgence of Auto advertising. Notably, local advertising fared much better than national advertising, which was down in the absence of Political advertising. As we look toward the fourth quarter, local advertising appears to be weakening. But, notably, national advertising appears to be doing much better, driven by an early influx of Political advertising. While it was assumed that Political would increase in the fourth quarter due to the run-off of the Republican presidential candidates, especially in early primary States, we believe that President Biden has recently stepped-up advertising, particularly to the Hispanic community. We have noticed Biden advertising even in Florida! So, what does this mean for media fundamentals?
It is difficult to predict where Political dollars will be spent and not all Political dollars will be spent evenly, geographically or by stations in a particular market. Furthermore, Political dollars may be pulled back in a market should a particular candidate pull ahead in the polls. Political dollars were anticipated to be spent in early primary States, specifically for the Republican candidates. But, the Biden money is a surprise. Biden appears to be spending early and in areas to solidify a key voting block, Hispanics. Of course, the Biden campaign may broaden its spending to other voting blocks as well. In our view, 2024 will be a banner year for Political advertising given the large amount of Political fundraising by the candidates and by Political Action Committees. The prospect of weak local advertising, however, may cast a pall over the current expected strong revenue growth in 2024. Many analysts, including myself, expected that economic prospects would improve in 2024, which would have provided a favorable tailwind for a significant improvement in total TV advertising in 2024. Certainly, it is likely that the Fed may lower interest rates in 2024, potentially providing a boost to local advertising prospects, but that improvement may come late in the year. But, overall, in spite of the weakening Local advertising environment, given the improving National advertising trends, overall TV advertising appears to have stabilized.
For now, we are cautiously optimistic about 2024, with the caveat that revenue growth may be somewhat tempered given the current weak local advertising trends. Nonetheless, we believe that we are nearing the trough for this economic cycle. Some companies, like E.W. Scripps, are in a favorable cycle for Retransmission renewals. Retransmission revenues now account for a hefty 50% of Scripps’ total broadcast revenue. In Scripps’ case, 75% of its subscribers are under renewal, which it recently announced was completed. As such, the company reaffirmed guidance that Retransmission revenue will increase 15% in 2024 and lead to a substantial increase in net Retransmission revenue. We remain constructive on TV stocks, as high margin Political advertising should boost balance sheets and improve stock valuations.
In the latest quarter, TV stocks underperformed the general market. As Figure #7 Traditional Media 3-Month Performanceillustrates, the Noble TV Index decreased 13.2%, underperforming the 3.6% decline in the general market as measured by the S&P 500. The poor performance of the latest quarter adversely affected the trailing 12 month performance, bringing the Noble TV Index to a 17.6% decline for the trailing 12 months. Individual stocks performed more poorly, with only the shares of Fox Corporation registering a modest gain for the trailing 12 months of 2.7%. The Noble TV Index is market cap weighted, and, as such, Fox with a $15 billion market cap, carried the index. Outside of the relatively strong performance of this large cap stock, all of the TV stocks were down and down big, between 18% to 59% over the past 12 months.
We believe that investors have shied away from cyclicals, smaller cap stocks, and from companies with higher debt levels. This accounts for the poor performance of Gray Television and E.W. Scripps, both of which have elevated debt leverage given recent acquisitions. Both were among the poorest performers for the latest quarter and for the trailing 12 months. The GTN shares were down 12% in the third quarter and 38% for the last 12 months; the SSP shares down 40% and 58%, respectively.
We believe that the sell-off has been overdone, especially as the industry is expected to cycle toward an improved fundamental environment in 2024. As Figure #8 TV Industry Comparables indicate, the Broadcast TV stocks trade at a modest 5.3 times Enterprise Value to our 2024 adj. EBITDA estimates, well below historic 20 year average trading multiples of 8 to 12 times. We believe that the depressed valuations largely discount the prospect of an economic downturn and do not reflect the revenue and cash flow upside as we cycle into a Political year. Given the steep valuation discount to historic levels, we believe that the stocks are 15% to 20% below levels where the stocks normally would be given a favorable Political cycle. Our favorites in the TV space include: Entravision (EVC), one of the beneficiaries of the influx of Political advertising to Hispanics; E.W. Scripps (SSP), a play on Political, with the favorable fundamental tailwind of strong Retransmission revenue growth; and, Gray Television (GTN), one of the leading Political advertising plays.
Figure #8 TV Industry Comparables
Source: Noble estimates & Eikon
Radio Broadcasting
Shoring up balance sheets.
The Radio industry has struggled in the first half as National advertising weakened throughout the year. On average National advertising was down roughly20% or more for many Radio broadcasters. Local held up relatively well, although down in the range of 3% to 5%. Fortunately, for many broadcasters, a push into Digital, which grew in the first half, helped to stabilize total company revenues. As we look to the fourth quarter, we believe that Local advertising is weakening, expected to be down in the range of 5% to 7%, or more in some of the larger markets. But, for some, National advertising is improving, driven by Political advertising. But, Political is not evenly spread. As such, we anticipate that there will be a cautious outlook for many in the industry for the second half of the year.
For some in the industry, the challenged revenue environment has put a strain on managing cash flows to maintain hefty debt loads. We believe that debt leverage is among the top concern for investors. Many of the poorest performing stocks in the quarter and for the trailing 12 months carry some of the highest debt leverage in the industry. The Noble Radio Index decreased a significant 13.7% in the latest quarter compared with a 3.7% decline for the general market. But, a look at the individual stock performance tells a more disappointing story. The shares of Salem Media declined 38% in the latest quarter, bringing 12 month performance to a 44% decline. The shares of iHeart Media decline 49% for the year.
Notably, Salem Media assuaged much of its liquidity concerns with recent asset sales. Such sales will bring in roughly $30 million, allowing it to fully pay off its $22 million revolver and have some flexibility with remaining cash on its balance sheet. We do not believe that investors have fully credited the significance of the recent asset sales.
One bright spot in the group has been the shares of Townsquare Media. While the TSQ shares gave back a significant 27% in the third quarter, the shares are still up 20% over the past 12 months, among one of the best performance in the industry. We believe that the company’s initiation of a substantial dividend resonated with investors.
While the industry faces fundamental headwinds given the current economic challenges, we believe that most companies have made a shift toward faster growth, digital business models. In addition, we believe that Radio will see a lift from Political advertising in 2024, although not to the extent that the TV industry will see. Nonetheless, we look for an improving advertising scenario in 2024. As such, we are constructive on the industry. One of our current favorites leads the industry in its Digital transition, Townsquare Media. As Figure #9 Radio Industry Comparables indicates, the TSQ shares are among the cheapest in the industry, trading at 5.1 times EV to our 2024 adj. EBITDA estimate, well below the average of 7.1 times for the industry. In addition, we like Saga Communications, one of the cheapest stocks in the industry, trading near 4 times EV to 2024 adj. EBITDA.
Figure #9 Radio Industry Comparables
Source: Noble estimates & Eikon
Publishing
Further cost cutting will cut deep.
Publishers are not likely to be spared from the weakening local advertising business. But, publishers have a play book on areas to cut expenses to manage cash flows. Certainly, we believe that its Digital businesses should help offset some of the anticipated revenue declines on its print legacy business. We believe that publishers are eliminating print days. Such a move likely will indicate further pressure on print revenues, but would not proportionately decrease cash flow. Some print days have very little advertising and/or advertisers may shift some spending to other print days. Lee Enterprises indicated in its last call that it will go down to 3 print days in 44 of its smaller markets. We believe that the move has been a success. While revenues may have decreased slightly more than expected given the current weak advertising environment, we believe that cost savings have been more than anticipated.
While many publishers would like to have a long runway for its cash flowing print business, such possible moves would necessarily increase the digital transition. Notably, with just some stabilization of revenues on the print side, many publishers have the potential to show total company revenue growth given benefit from digital revenue. With the prospect of strategies that may cut print days and the current weak local advertising environment, we believe that total revenue growth may be pushed out to 2025.
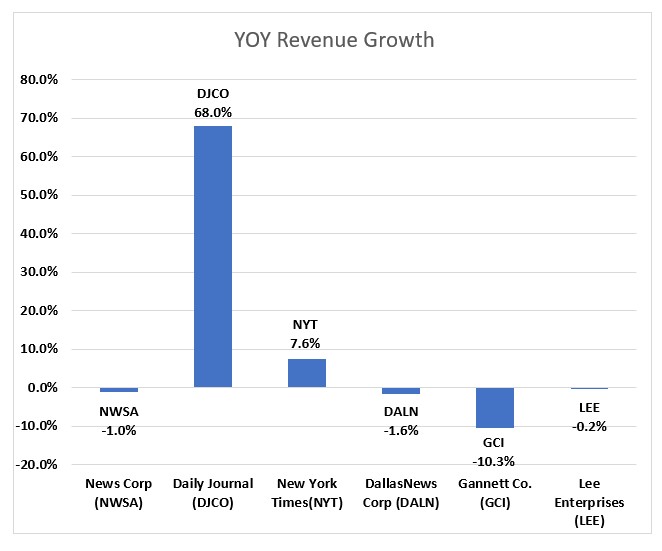
Many of the Publishing stocks were written off long ago. But, surprisingly, the Publishing stocks have been among the best stock performers in the latest quarter and for the trailing 12 months. The Noble Publishing Index increased a solid 36% in the trailing 12 months, outperforming the general market (as measured by the S&P 500) of 19% in the comparable time frame. In the third quarter, Publishing stocks increased 3.5%, outperforming the S&P 500, which declined 3.7%. All of the publishers increased, with the exception of Lee Enterprises. The Lee shares increased substantially a year earlier on takeover rumors. Since then the shares have come back down to earth, while the rest of the industry moved higher. The stronger performers in the industry, however, were the larger cap companies, such as News Corp and The New York Times. In the latest quarter, the shares of The New York Times increased roughly 5% and the shares are up 27% for the trailing 12 months. The shares of Gannett increased a solid 9% in the latest quarter, as well.
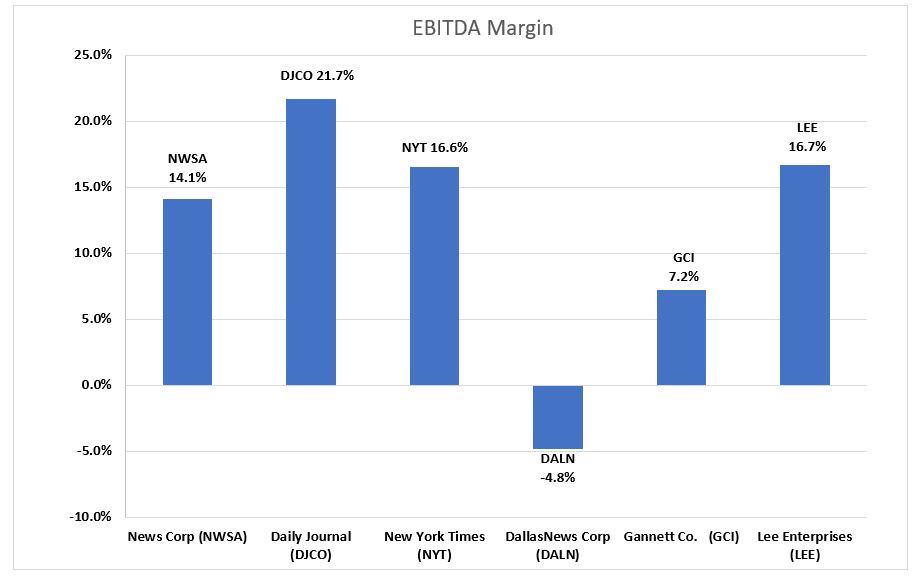
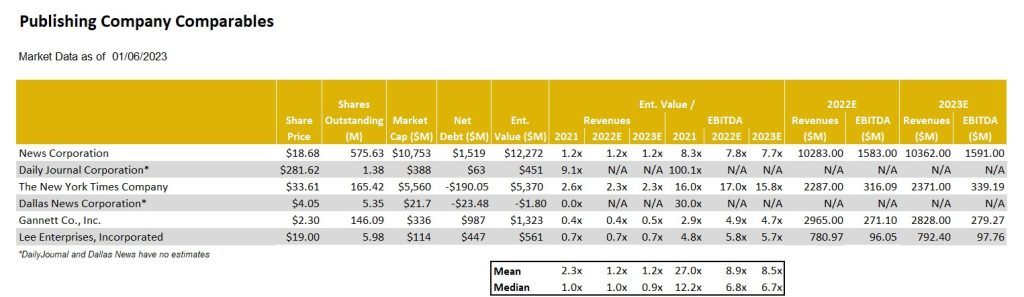
As Figure #10 Publishing Industry Comparables illustrate, there is a disparity among some of the larger, more diversified companies, like The New York Times and News Corporation. The NYT shares trade at a hefty 15.7 times EV to 2024 adj. EBITDA estimates, well above much of the pack currently trading in the 5 multiple range. We believe that this valuation gap should narrow, especially as many of the companies, like Lee and Gannett, have a burgeoning Digital business. While the industry faces secular challenges of its Print business and there are economic headwinds in the very near term, we believe that companies like Lee Enterprises have the ability to manage cash flows and grow its Digital businesses. Given the compelling stock valuation disparity, the shares of Lee Enterprises lead our list of favorites in the sector.
Figure #10 Publishing Industry Comparables
Source: Noble estimates & Eikon
For more information and disclosures on companies mentioned in this report, click on the following:
All statements or opinions contained herein that include the words “we”, “us”, or “our” are solely the responsibility of Noble Capital Markets, Inc.(“Noble”) and do not necessarily reflect statements or opinions expressed by any person or party affiliated with the company mentioned in this report. Any opinions expressed herein are subject to change without notice. All information provided herein is based on public and non-public information believed to be accurate and reliable, but is not necessarily complete and cannot be guaranteed. No judgment is hereby expressed or should be implied as to the suitability of any security described herein for any specific investor or any specific investment portfolio. The decision to undertake any investment regarding the security mentioned herein should be made by each reader of this publication based on its own appraisal of the implications and risks of such decision.
This publication is intended for information purposes only and shall not constitute an offer to buy/sell or the solicitation of an offer to buy/sell any security mentioned in this report, nor shall there be any sale of the security herein in any state or domicile in which said offer, solicitation or sale would be unlawful prior to registration or qualification under the securities laws of any such state or domicile. This publication and all information, comments, statements or opinions contained or expressed herein are applicable only as of the date of this publication and subject to change without prior notice. Past performance is not indicative of future results. Noble accepts no liability for loss arising from the use of the material in this report, except that this exclusion of liability does not apply to the extent that such liability arises under specific statutes or regulations applicable to Noble. This report is not to be relied upon as a substitute for the exercising of independent judgement. Noble may have published, and may in the future publish, other research reports that are inconsistent with, and reach different conclusions from, the information provided in this report. Noble is under no obligation to bring to the attention of any recipient of this report, any past or future reports. Investors should only consider this report as single factor in making an investment decision.
IMPORTANT DISCLOSURES
This publication is confidential for the information of the addressee only and may not be reproduced in whole or in part, copies circulated, or discussed to another party, without the written consent of Noble Capital Markets, Inc. (“Noble”). Noble seeks to update its research as appropriate, but may be unable to do so based upon various regulatory constraints. Research reports are not published at regular intervals; publication times and dates are based upon the analyst’s judgement. Noble professionals including traders, salespeople and investment bankers may provide written or oral market commentary, or discuss trading strategies to Noble clients and the Noble proprietary trading desk that reflect opinions that are contrary to the opinions expressed in this research report. The majority of companies that Noble follows are emerging growth companies. Securities in these companies involve a higher degree of risk and more volatility than the securities of more established companies. The securities discussed in Noble research reports may not be suitable for some investors and as such, investors must take extra care and make their own determination of the appropriateness of an investment based upon risk tolerance, investment objectives and financial status.
Company Specific Disclosures
The following disclosures relate to relationships between Noble and the company (the “Company”) covered by the Noble Research Division and referred to in this research report. Noble is not a market maker in any of the companies mentioned in this report. Noble intends to seek compensation for investment banking services and non-investment banking services (securities and non-securities related) with any or all of the companies mentioned in this report within the next 3 months
ANALYST CREDENTIALS, PROFESSIONAL DESIGNATIONS, AND EXPERIENCE
Senior Equity Analyst focusing on Basic Materials & Mining. 20 years of experience in equity research. BA in Business Administration from Westminster College. MBA with a Finance concentration from the University of Missouri. MA in International Affairs from Washington University in St. Louis. Named WSJ ‘Best on the Street’ Analyst and Forbes/StarMine’s “Best Brokerage Analyst.” FINRA licenses 7, 24, 63, 87
WARNING
This report is intended to provide general securities advice, and does not purport to make any recommendation that any securities transaction is appropriate for any recipient particular investment objectives, financial situation or particular needs. Prior to making any investment decision, recipients should assess, or seek advice from their advisors, on whether any relevant part of this report is appropriate to their individual circumstances. If a recipient was referred to Noble Capital Markets, Inc. by an investment advisor, that advisor may receive a benefit in respect of transactions effected on the recipients behalf, details of which will be available on request in regard to a transaction that involves a personalized securities recommendation. Additional risks associated with the security mentioned in this report that might impede achievement of the target can be found in its initial report issued by Noble Capital Markets, Inc.. This report may not be reproduced, distributed or published for any purpose unless authorized by Noble Capital Markets, Inc..
RESEARCH ANALYST CERTIFICATION
Independence Of View All views expressed in this report accurately reflect my personal views about the subject securities or issuers.
Receipt of Compensation No part of my compensation was, is, or will be directly or indirectly related to any specific recommendations or views expressed in the public appearance and/or research report.
Ownership and Material Conflicts of Interest Neither I nor anybody in my household has a financial interest in the securities of the subject company or any other company mentioned in this report.
A Focus on Profitability Drives A Strong Start to the Year
Last quarter we wrote that the S&P 500 increased for the first time since the fourth quarter of 2021 and that we were beginning to see signs of life in Noble’s Internet and Digital Media Indices as well. Those signs of life continued to bear fruit throughout the first quarter, as every one of Noble’s Internet and Digital Media Indices not only finished the quarter up, but significantly outperformed the S&P 500. The best performing index was Noble’s Social Media Index, which increased by 70% in the first quarter of 2023, followed by Noble’s eSports & iGaming Index (+32%), Ad Tech Index (+31%), MarTech Index (+30%), and Digital Media Index (+18%).
Noble’s Indices are market cap weighted, and we attribute the strength of the Social Media Index to its largest constituent, Meta Platforms (META; a.k.a. Facebook) whose shares increased by 76% in the first quarter. We attribute this increase to management’s 4Q 2022 earnings call when they spent most of their time talking about “efficiency”, which investors interpreted to mean that Meta was newly focused on profitability. After a relatively disastrous 3Q 2022 earnings call, after which shares fell by 25%, the company demonstrated on its 4Q 2022 earnings call that it clearly had
gotten the message: investors were not enamored about the company’s plans in October 2022 to spend billions of dollars to develop its Metaverse initiatives. Rather, on its fourth quarter call, management focused on driving its short form video initiative Reels (i.e., becoming more TikTok like), reducing its headcount by reducing layers of management, lowering its operating expenses and reducing its capital expenditures. Investors applauded this newfound focus on profitability and shares rebounded from a low of $88.90 per share in early November to $211.94 at the March quarter-end.
Noble’s eSports and iGaming Index increased by 32% as 9 of the 16 stocks in the index posted gains, the two largest market cap weighted stocks. Shares of the largest stock in the index, Flutter Entertainment (FLTR) increased by 31%) while shares of the second largest stock in the index, DraftKings (DKNG) increased by 70%. Flutter’s improvement is likely due to an improved inflection point in the company’s U.S. operations which include its FanDuel operations. DraftKings also beat revenue and EBITDA expectations in 4Q 2022 and appears to be proving out its path to profitability. In both cases, investors are rewarding companies who are accelerating their path to profitability.
The next best performing index was Noble’s Ad Tech Index which increased by 31% during 1Q 2023. Fourteen of the 23 stocks in the index were up in the first quarter. Standouts during the quarter were Integral Ad Science (IAS; +62%) and Perion Networks (PERI; +56%). Integral Ad Science exceeded expectations in its fourth quarter results and guided to better-than-expected results in 1Q 2023. The company continues to expand its product suite, scale its social media offerings (i.e., for TikTok) and is well positioned to continue to benefit from the shift from linear TV to connected TV (CTV). Perion shares continued their winning streak: Perion was the only ad tech stock whose shares were up in 2022. Perion’s 56% increase in 1Q 2023 reflected beat on both revenues (by 2%) and EBITDA (by 10%) as well as improved guidance for 1Q 2023. Perion’s profitability increased significantly in 2022, with EBITDA nearly doubling (+90%) from $70 million in 2021 to $132 million in 2022.
Noble’s MarTech Index increased by 30% with 14 of the 22 stocks in the index posting increases in 1Q 2023. The best performing stocks were Qualtrics (XM; +70%) Sprinklr (CXM; +59%), Salesforce (CRM; +51%), Hubspot (HUBS; +48%) and Yext (YEXT; +47%). Qualtrics agreed to be acquired for $12.5 billion by Silver Lake and the Canadian Pension Plan Investment Board, which came at a 73% premium to its 30-day volume weighted stock price. Sprinklr beat revenue expectations and significantly beat EBITDA expectations (doubling the Street expectations) and guided to a current year forecast that focuses more on efficiency and profitability. MarTech stocks have been victims of their own success. Two years ago at this time the sector was trading at 11.3x forward revenue estimates, and a year ago the group was trading at 6.5x forward revenues. Today the group trades at 4.1x forward revenues and investors appear to be wading back into the sector.
Finally, Noble’s Digital Media Index, while lagging that of its digital peers posted an 18% increase and significantly outperformed the S&P 500 (+7%) with a broad based recovery in which 9 of the sector’s 11 stocks increase during 1Q 2023. The best performing stock was Spotify (SPOT; +69%), whose revenues fell short of expectations by less than 1%, significantly beat consensus Street EBITDA expectations by $58M and more importantly pivoted towards demonstrating operating leverage. Spotify, which posted an EBITDA loss of nearly $500 million 2022 is expected to generate $650 million in EBITDA in 2024, according Street estimates. A deteriorating ad market 2022 combined with higher interest rates likely prompted the company to shift its priorities to running a profitable company and doing it more quickly. The second best performing stock was Travelzoo (TZOO; +36%), as the company’s 4Q 2022 revenues and EBITDA increased by 31% and 328%, respectively. Notably, Travelzoo’s EBITDA came in 58% higher than Street consensus. The company appears to be benefiting from pent up demand for travel and management highlighted the opportunity for margin expansion in the coming quarters.
Sluggish M&A Market Carries Over into 2023
Last quarter we remarked that M&A deals in the Internet and Digital Media sector had held up well through the first three quarters of 2022 despite economic headwinds. However, the number of deals slowed in 4Q 2022 (by 17%) and total deal value fell dramatically (by 70%). The slowdown carried over into 1Q 2023. According to Dealogic, Global M&A fell by 48% to $575 billion in 1Q 2023 compared to $1.1 trillion in 1Q 2022. Global M&A dollar values fell to their lowest level in a decade. In the U.S., deal values fell by 44% to $283 billion from $176 billion in 1Q 2022.
The M&A market had weathered stock price declines, Fed rate hikes, elevated inflation, and geopolitical conflict in 2022. In 1Q 2023, to this “recession that never comes” economic environment we added increased volatility and uncertainty caused by banking failures. One of the biggest impediments to deals is debt financing. Private equity firms have had to write larger check in lieu of a robust debt financing market. Banks have been less willing to provide financing because some have had to hold loans on their balance sheet or take losses when selling debt to investors while smaller regional banks have seen deposits flee to larger banks, especially those considered too big to fail.
Finally, increased antitrust scrutiny likely has played a role in the M&A deal slowdown. Lengthy merger reviews resulted in three public transactions being blocked by regulators: Standard General’s acquisition of Tegna; JetBlue’s acquisition of Spirit Airlines, and Intercontinental Exchange’s acquisition of Black Knight, Inc.
1Q 2023 Internet and Digital Media M&A: A Dearth of Large Deals
Based on Noble’s analysis, deal making in the first quarter of 2023 in the Internet and Digital Media sectors actually increased by 11% compared to 1Q 2022. The total number of deals we tracked in the Internet and Digital Media space increased to 202 deals in 1Q 2023 compared to 182 deals in 1Q 2022. On a sequential basis, the total number of deals increased by 39% compared to 145 deals in 4Q 2022. The only explanation we can provide for this is that with the expectation that an economic slowdown was pending, many companies likely made the decision to sell in mid-2022, with the deals being announced in 1Q 2023.
The biggest change was in the first quarter’s M&A deal value, where the total dollar value of deals fell by 95% to $5.4 billion of announced deals in 1Q 2023 compared to $108.5 billion in announced deals in 1Q 2022. On a sequential basis, deal value fell by 40% from $9.1 billion in deal value in 4Q 2022.
From a deal volume perspective, the most active sectors we tracked were Digital Content (59 deals), Agency & Analytics (51 deals), and MarTech (39), followed by Information Services (17 deals), Ad Tech (11 deals) and eCommerce sectors (10 deals). From a dollar value perspective, MarTech led the way with $1.6 billion in transactions, followed by Information Services ($1.4 billion), Digital Content ($922 million) and Agency and Analytics ($875 million). The largest deals in the quarter by dollar value are shown below.
Notably, there were no mega deals ($10B+) in the first quarter of 2023, compared to the first quarter of 2022 when Microsoft agreed to by Activision Blizzard for $68 billion and Take-Two Interactive agreed to acquire Zynga for $12 billion. Once the Fed stops hiking rates and visibility into operating trends returns, we may begin to see an environment in which mega deals will be contemplated again.
TRADITIONAL MEDIA COMMENTARY
The following is an excerpt from a recent note by Noble’s Media Equity Research Analyst Michael Kupinski
The NAB Show Stopper
Media investors are unpacking all of information from last week’s National Association of Broadcasters (NAB) convention. There is a lot to digest given that there were over 1,400 exhibits, and 140 new exhibitors this year. Because of the overwhelming number of exhibitors, many that go to Vegas for this annual convention do not go to the convention floor. It is a shame. There is a lot to see and learn. Noble’s Media & Entertainment Analyst Michael Kupinski walked the convention floor, which covers 4.6 million square feet of exhibit halls and meeting rooms. He stopped by booths and taped presentations to explain the new technologies, the plan for implementation of new services, and the prospect for revenue monetization. One important demonstration focused on the new broadcast standard, ATSC 3.0, the hope for a bright future for the television industry. This new standard should allow the industry to become more contemporary in terms of how its audience consumes video and information. In addition, it offers the ability for the industry to participate in new revenue streams, including datacasting, which may become bigger than Retransmission revenue in the future.
In addition to touring the floor, he participated in NAB panel discussions and hosted meetings with media management teams in a fireside chat format to discuss current business trends, the new technologies (including Artificial Intelligence (AI)) and the new broadcast standard. In addition, these C-suite management teams provided their key takeaways from the NAB convention and offered why they participated in the conference this year. These discussions will be available for free to Channelchek users on Channelchek.com on April 27th as a virtual conference. In this upcoming Channelchek Takeaway Series on the NAB Show, Michael offers his key takeaways, including the current advertising outlook, his take on the monetization of the new technologies and what media investors should do now given the current economic and advertising environment. Free registration to this informative event is available here.
This report highlights the performance of the media sectors over the past 12 months and past quarter. Overall, media stocks struggled in the past year, but there has been some improved quarterly performance, particularly in Digital Media and Broadcast Television, discussed later. All media stocks are struggling to offset losses over the course of the past year with trailing 12 months stocks down in the range of 5% on the low end to as high as down 68%.
In the first quarter, stock performance was mixed. The best performers in the traditional media sectors were Broadcast Television stocks, up nearly 10% versus the general market which increased 7% in the comparable period. However, the individual TV stock performance reflected a different story, explained later in this report. The worse performer for the quarter were the radio stocks, driven by a Wall Street downgrade of one of the leading radio broadcasters. We believe that stock performance will be a roller coaster for at least another quarter or two as the weight of the Fed rate increases begin to adversely affect the economy.
While national advertising has remained weak, we believe that local advertising is now beginning to moderate as well. The local advertising weakness appears to be in the smaller markets as well as the larger markets. This is somewhat different than the most recent economic cycles whereby the smaller markets were somewhat resilient. It seems that the smaller markets are feeling the adverse affects from inflation, rising employment costs and tightening bank credit. In our view, the disappointing advertising outlook likely will cause second quarter revenue estimates to come down, creating a difficult environment for media stocks.
Broadcast Television
Weak Current Revenue Trends
TV stocks outperformed the general market in the first quarter. This market cap weighted index masked the performance of many poor performing stocks in the quarter. Sinclair Broadcasting (up 10%), Entravision (up a strong 26%), and Fox (up 12%) were the best performing stocks and favorably influenced the TV index in the quarter. But, there were many poor performing stocks including E.W. Scripps (down 29%), Gray Television (down 22%) and Tegna (down 20%). We believe that there was heightened interest in Entravision given its favorable Q1 results which was fueled by its fast growing digital advertising business. Entravision’s Q4 revenue performance was among the best in the industry. While Entravision was among the best revenue performer, its margins are below that of its peer group EBITDA Margins. This is due to the accounting treatment of its digital revenues given that it is an agency business.. The poorer performing stocks are among the higher debt levered in the industry. The underperformance reflects concern of a slowing economy and investors flight to quality in the sector.
We do not believe that we are out of the woods with the TV stocks and the market is expected to be volatile. The advertising environment appears to be deteriorating given weakening economic conditions. There are bright spots which include some improvement in the Auto category. Dealerships appear to be stepping up advertising given higher inventory levels. In addition, broadcasters appear optimistic about political advertising, which could begin in the third quarter 2023. There is a planned Republican presidential candidate debate schedule in August. There is some promise that candidates will advertise in advance of that debate and into the fourth quarter given the early primary season. We do not believe that political and auto will be enough to offset the weakness in national and Local advertising. In our view, Q2 and full year 2023 estimates are likely to come down. Furthermore, we believe that broadcasters will be shy about predicting political advertising even into 2024 given the past disappointments in management forecasts in the last political cycle.
Broadcast Radio
All Out of Love
Radio stocks had another tough quarter, down 17% versus a 7% gain for the general market. Notably, there was a wide variance in the individual stock performance, with the largest stocks in the group having the worst performance in the quarter, including Audacy (AUD down 40%), Cumulus Media (CMLS down 41%) and iHeart Media (IHRT down 36%). The first quarter stock performance did not appear to reflect the fourth quarter results, during which revenues were relatively okay, with some exceptions. Some of the larger radio companies which have a large percentage of national advertising, underperformed relative to the more diversified radio companies, especially those with a strong digital segment presence. Margins for the industry remain relatively healthy.
The weakness in the Radio stocks was fueled in the quarter from a downgrade to Underperform on the shares of iHeart by a Wall Street firm. Many radio stocks were down in sympathy. The analyst attributed the downgrade to the current macro environment and its heavy floating rate debt burden. The company is not expected to generate enough free cash flow to de-lever its balance sheet. We believe the downgrade as well as the excessive debt profile of Audacy, another industry leader which likely will need to restructure, sent all radio stocks tumbling. Some stocks performed better than others. While Cumulus Media’s debt profile is not as levered as iHeart or Audacy, the shares were caught in the net of a weak advertising outlook. Cumulus is among the most sensitive to national advertising, which currently continues to be weak.
Some of our favorite stocks which are diversified and have developing digital businesses performed better. Those stocks included Townsquare Media (TSQ, up 10%), and Salem Media (SALM, up 4%). Notably, while the shares of Beasley Broadcasting (BBGI) were down 10%, the shares performed better than the 17% decline for the industry in the quarter. Importantly, Beasley recently provided favorable updated Q1 guidance for the first quarter. Q1 revenues are expected to increase 1% to 2.5% and EBITDA growth is expected to be in the range of 40% to 50%, significantly better than our estimates. Furthermore, management provided a sanguine outlook for 2023 and 2024. Digital revenue is expected to reach 20% to 30% of total revenue with a goal of reaching 40% in 2024. By comparison, digital revenue was 17% of total revenue in the fourth quarter 2022. Furthermore, the company is sitting on roughly $35 million in cash. It has opportunistically repurchased $10 million of its bonds at a significant discount. We believe that it is likely to maintain a strong cash position given the economic uncertainty.
Townsquare Media (TSQ), Salem Media (SALM) and Beasley Broadcast (BBGI) are all diversifying their revenue streams. While these companies are not immune to the economic headwinds, we believe theirdigital businesses should offer some ballast to its more sensitive Radio business. In the case of Salem, 30% of its revenues are relatively stable with block programming.
Publishing
After a period of moderating revenue trends, publishers reported a weakened advertising environment. Revenue trends deteriorated with print advertising taking a nose dive. This trend was illustrative in the results from Lee Enterprises. After a fiscal fourth quarter flat revenue performance, the company reported a 8.5% decline in its fiscal first quarter. The Q1 revenue performance reflected an 18.5% decrease in print advertising, an acceleration in the rate of the 11% decline in the previous quarter.
The surprisingly weak quarter hit the company’s adj. EBITDA margins. Traditionally, Lee maintained some of the best margins in the industry., but the company fell in ranking to among the lowest in the sector. Importantly, in spite of the revenue weakness, the company maintained its previous adj. EBITDA guidance of $94 million to $100 million for F2023. To achieve its cash flow target in light of the soft revenue outlook, Lee implemented a round of expense cuts to bolster cash flow. Cost reductions are expected to result in $40 million of savings in FY 23, and $60 million in annualized savings going forward. While the company’s print business declined more than expected , the company’s digital businesses remains favorably robust. In addition, its digital business is turning toward contributing margins; another step in the company’s digital evolution.
This newsletter was prepared and provided by Noble Capital Markets, Inc. For any questions and/or requests regarding this news letter, please contact Chris Ensley
DISCLAIMER
All statements or opinions contained herein that include the words “ we”,“ or “ are solely the responsibility of NOBLE Capital Markets, Inc and do not necessarily reflect statements or opinions expressed by any person or party affiliated with companies mentioned in this report Any opinions expressed herein are subject to change without notice All information provided herein is based on public and non public information believed to be accurate and reliable, but is not necessarily complete and cannot be guaranteed No judgment is hereby expressed or should be implied as to the suitability of any security described herein for any specific investor or any specific investment portfolio The decision to undertake any investment regarding the security mentioned herein should be made by each reader of this publication based on their own appraisal of the implications and risks of such decision This publication is intended for information purposes only and shall not constitute an offer to buy/ sell or the solicitation of an offer to buy/sell any security mentioned in this report, nor shall there be any sale of the security herein in any state or domicile in which said offer, solicitation or sale would be unlawful prior to registration or qualification under the securities laws of any such state or domicile This publication and all information, comments, statements or opinions contained or expressed herein are applicable only as of the date of this publication and subject to change without prior notice Past performance is not indicative of future results.
Please refer to the above PDF for a complete list of disclaimers pertaining to this newsletter
The S&P 500 increased by 7% during the fourth quarter of 2022, marking the first time the Index had increased since fourth quarter of 2021. We also saw signs of life in two of Noble’s Internet and Digital Media Indices: Noble’s eSports and iGaming Index increased (+13%) and outperformed the broader market (which we define as the S&P 500) while Noble’s MarTech Index also increased (+6%), roughly in-line with the market. This marked the second quarter in a row in which the eSports and iGaming Index not only increased but significantly outperformed the broader market, following several quarters of underperformance. Laggards during the fourth quarter were Noble’s Digital Media Index (-5%), Social Media Index (-7%) and Ad Tech Index (-20%).
Noble Indices are market cap weighted, and we attribute the relative strength of the eSports and iGaming Index to its largest constituent, Flutter Entertainment (ISE: FLTR). Flutter shares finished the year at $127.80, down only 8% from the start of the year, despite trading as low as $76 per share in mid-July. Investors appear to appreciate Flutter’s FanDuel business and its market leading position and competitive advantage, something that Flutter management highlighted during a November Investor Day. Management also laid out a case to increase U.S. revenues by 5x and achieve margins of 25%-30% implying EBITDA of up to $5 billion in 8 years-time, quadruple its levels today. Despite the overall strength of the eSports and iGaming Index, share price gains within the sector were not widely dispersed. Only 3 of the 16 stocks in eSports and iGaming sector finished the quarter up, including Engine Gaming and Media (GAME, +71%) and SportRadar Group (SRAD; +13%).
Noble’s MarTech Index increased by 6% with 11 of the 22 stocks in the index posting gains, led by Yext (YEXT; +46%), Shopify (SHOP; +29%), LiveRamp (RAMP; +29%) and Adobe (ADBE; +22%). This marks significant improvement from last quarter when only 4 of the sectors’ stocks finished the quarter in positive territory. MarTech stocks have suffered from a market resetting of revenue multiples which began when the Fed began raising rates. MarTech share price declines in the first, second and third quarters of 2022 were mostly driven by multiple compression as investors rotated out of high-flying tech sectors where companies had chased growth at all costs (at the expense of profitability). Only 7 of the MarTech companies in the Index posted positive EBITDA in the latest quarter.
2022 – A Year That Internet and Digital Media Investors Would Like to Forget
While there were signs of life in the fourth quarter of 2022 for the Internet and Digital Media sectors, 2022 was a year most investors in these sectors would like to forget. Every one of these sectors substantially underperformed the S&P 500 last year. The S&P 500 Index finished the year down 19% which was substantially better than Noble’s eSports and iGaming Index (-35%), Digital Media Index (-41%), MarTech Index (-52%), Social Media Index (-63%), and Ad Tech Index (-63%). Rather than focus on the stocks that significantly underperformed their respective Indices (and there are many), we would rather focus on the three stocks that finished 2022 up for the year.
Harte Hanks (HHS) – Shares of Harte Hanks increased by 53% in 2022, which continued its multi-year turnaround from a highly levered and unprofitable business (in 2019), to a double-digit EBITDA margin business with a debt-free balance sheet (in 2022).
Tencent (TME) – Shares of Tencent increased by 21% in 2022. Shares declined earlier in the year as China’s economy slowed as it maintained its Zero Covid-19 lockdown, but surged in the fourth quarter as it appeared that the company would enjoy an increase in demand as China begins easing Covid restrictions.
Perion Networks (PERI) – Perion shares increased by 5% in 2022 as Perion consistently beat expectations and raised its guidance throughout 2022. In the first week of 2023, the company once again pre-announced better than expected results for the fourth quarter, and shares are already up 18% since the start of the new year.
2022 M&A – A Tale of Two Halves
When we look back at last year from an M&A perspective, we can say that 2022 was another year of robust M&A activity. The total number of deals increased by just under 2%, as we tracked 667 deals in 2022 compared to 657 deals in 2021. Deal values were up a robust 71% in 2022 to $241 billion, up from $141 billion in 2021. The fact that deal value was so significantly higher happened despite the fact that there were far fewer deals where the transaction value was disclosed in 2022 compared to 2021. In 2022, there were 184 deals where the purchase price was disclosed, significantly lower than the 264 deals where the purchase price was disclosed in 2021.
2022 – A Year of Mega Deals
The biggest difference between 2022 and 2021 was two “mega” deals that were announced in 2022: Microsoft’s $69 billion announced acquisition of Activision Blizzard (which the Federal Trade Commission is seeking to block) and Elon Musk/Kingdom Holding’s $46 billion acquisition of Twitter. In fact, there were six transactions in 2022 that exceeded $10 billion in deal value, while there were only 2 such deals in 2021. Five of the 6 largest transactions of 2022 took place in the first half of the year. Half the largest M&A deals in 2022 were in the video or mobile gaming sector.
Only Adobe’s $19 billion announced acquisition of Figma took place in the second half of the year, which is not surprising given that the cost of financing M&A transactions using debt increased by approximately 300 basis points as the Fed continued to raise rates to fight inflation. Given the higher cost of financing deals, in 2023 we are not likely to see as many mega deals particularly at the relatively elevated EBITDA multiples shown above.
4Q 2022 M&A: A Chink in the Armor – M&A Activity and Deal Values Slide
Through the first three quarters of the year in 2022, we noted how well M&A had held up despite public equity market declines, Fed rate hikes, elevated inflation, contractionary monetary policy and geopolitical conflict. While the M&A market stayed resilient throughout most of 2022, it is clear that we began to see some “chinks in the armor” in 4Q 2022. We are not surprised by this relative weakness given the economic uncertainty and an inability to accurately forecast revenue and earnings trends for both acquirors and target companies alike.
Deal making in the fourth quarter of 2022 slowed both from a deal volume and deal value perspective. The total number of deals we tracked in the Internet and Digital Media space fell by 17% to 145 deals in 4Q 2022 compared to 174 deals in 4Q 2021. On a sequential basis, the total number of deals fell by 14% to 143 deals compared to 167 deals in 3Q 2022.
The biggest change was in deal value, where the total dollar value of deals fell by 70% to $9.1 billion in 4Q 2022 compared to $30.1 billion in 4Q 2021. On a sequential basis, deal value fell by 69% in 4Q 2022 from $29.1 billion in deal value in 3Q 2022.
The tale of two halves is best represented by the chart below.
From a deal volume perspective, the most active sectors we tracked were Digital Content (40 deals), Marketing Tech (36 deals), Agency & Analytics (32 deals) and Information Services (12 deals). From a deal value perspective, the Information Services sector had the largest dollar value of transactions ($3.3 billion), followed by eCommerce ($1.7 billion), Mar Tech ($1.2 billion), and Mobile ($1.2 billion).
During the fourth quarter there were a dozen announced deals in the video gaming sector, but the sector did not register as a top sector based on deal value. In fact, only 2 of the 12 deals that were announced included the purchase price: Churchill Down’s $250 million acquisition of horse racing game provider Exacta Systems and Playstudios’ $97 million acquisition of mobile game developer Branium Studios. The largest deals in the quarter by dollar value are shown below.
Digital Advertising
Digital Advertising Outlook for 2023
Last October eMarketer revised lower its 2023 U.S. digital advertising forecast by $5.5 billion, from $284.1 billion to $278.6 billion. While this sounds like a substantial drop, in percentage terms they lowered their 2023 forecast by only 2 percentage points, from 14% growth to 12% growth. Most of the global ad agencies expect digital to continue to grow by double digits driven by dollars migrating to such digital ad channels as retail media and connected TV. Both sectors continue to demonstrate impressive growth.
Retail Media – A retail media network is a retailer-owned advertising service that allows marketers to purchase advertising space across all digital assets owned by a retail business, using the retailer’s first-party data to connect with shoppers throughout their buying journey. eMarketer forecasts that retail media ad spending in the U.S. grew by 31% last year to $41 billion and will grow to $61 billion over the next two years, by which time it will equate to 20% of all digital advertising. The leaders in retail media are Amazon, Walmart and Instacart.
Through a retail media network, partners (advertisers) get direct access to a retailer’s customers. The benefit to the partners/advertisers is that they get access to first party data. Retailers own and store this data and allow advertisers to access them through their retail media programs. The first party data is valuable because it is collected at the point of sale allowing brands to get better insights into purchase behavior. Traditional retailers are beginning to follow suit. Traditional retailers with the largest digital audiences (per comScore) are Walmart, Target, Home Depot, Lowes, CVS, Walgreens, Costco and Kohls.
On January 10th, Microsoft announced that it intended to create the industry’s most complete omnichannel retail media technology stack supported by its Promote IQ platform, a company Microsoft acquired in 2019. We expect companies that serve the retail media sector from an Ad Tech or Mar Tech standpoint are poised to benefit from secular trends in this sector.
Connected TV (CTV) – Last July, Nielsen announced that for the first time U.S. streaming TV viewership was larger than cable TV viewing. In July 2022, eMarketer forecast that CTV advertising would reach $18.9 billion in 2022. However, in October 2022,
eMarketer raised its forecast for CTV advertising by $2.3 billion to $21.2 billion in 2022. In October, the forecaster also raised its 2023 CTV advertising forecast by $3 billion to $26.9 billion, up from $23.9 billion in the July 2022 forecast. The big increase is due primarily to Netflix and Disney+ announcing they were launching ad supported tiers to their streaming offerings.
The ability to target specific audiences and measure specific outcomes tied to the ads that viewers watched has made CTV a force to be reckoned with, particularly for those advertisers that are never quite sure which of their advertising mediums provide the highest returns. Historically, TV was a mass medium used by large brands that wanted massive reach. CTV has opened the door to a wider variety of advertisers that are looking to reach more targeted, even niche, audiences. According to MNTN, a connected TV performance marketing platform, many CTV advertisers are first-time TV advertisers. With new FAST (Free Ad-Supported Streaming TV) channels coming online every month, there is no shortage of supply coming to market. This is just one reason why eMarketer predicts CTV advertising to grow by $10+ billion over the next two years and reach nearly $32 billion in advertising revenue in 2024. Ad Tech or Mar Tech companies that serve this market are also poised to benefit from secular viewing trends and the advertising dollars that are migrating to these platforms.
TRADITIONAL MEDIA COMMENTARY
The following is an excerpt from a recent note by Noble’s Media Equity Research Analyst Michael Kupinski
Overview – Will It Be A Happy New Year?
2022 was one of the worst for media stock performance in recent memory, with stocks across traditional and digital media sectors down over 40% or more. Media stocks underperformed the general market, as measured by the S&P 500 Index, which was down a more moderate 19% on a comparable basis for the full year 2022. It is typical for media stocks to underperform in a late-stage economic cycle or in the midst of an economic downturn, but the significant stock declines are stunning. Macro-economic issues including inflation, rising interest rates, and the prospect of a looming economic downturn all contributed to the poor performance.
The question is “will 2023 be better?” We believe so. There has been recent signs of life. The S&P 500 increased by 7% during the fourth quarter of 2022, marking the first time the Index had increased since fourth quarter of 2021. Notably, the Noble Publishing Index outperformed the general market in the latest quarter. However, the full impact of the recent interest rate increase likely have not been reflected in the economy. Many media stocks seem to anticipate an economic downturn, but current fundamentals do not appear to be in a freefall and may be better than expected. If the economy further deteriorates from the recent or future rate hikes, it appears now that it may adversely affect the second half of 2023. Advertising pacings appear to be holding up well so far in the first half 2023. Notably, media stocks may begin to anticipate an improving economic outlook and overlook the weak fundamental environment in the second half.
Conventional thought anticipates that increasing concerns over an economic recession may prompt mortgage rates to trend lower in 2023. Furthermore, it is possible that the Fed may lower interest rates if inflation moderates, although the Fed is not currently anticipating rate decreases in 2023. Nonetheless, this paints a favorable picture for media stocks in 2023. Traditionally, the best time to buy media stocks is in the midst of an economic downturn. In addition, these consumer cyclical stocks tend to be among the first movers in an early-stage economic cycle and tend to perform well in a moderating interest rate environment. As mentioned earlier, the stocks may currently be oversold given the prospect that the current fundamental environment is better than anticipated.
What is the risk to this favorable outlook? We believe that the resurging Chinese economy may be disruptive. Within the last month, China’s economy has been reopened from Covid lockdowns, which may put pressure on global energy prices. Such a prospect may make the Fed’s fight on inflation more stubborn to combat, potentially throwing off our favorable outlook for moderating interest rates. Given the prospect that these stocks tend to outperform the market in an early-stage economic recovery, we believe it is time for investors to accumulate positions in the media sectors.
Traditional Media – Another Quarter of Moderating Stock Performance
Traditional media stocks underperformed the general market in 2022, with the Radio sector the hardest hit. The Noble Radio Index declined 64% versus 19% for the general market, as measured by the S&P 500, in a comparable time period. Television and Publishing stocks were down 23% and 25%, respectively, more in line with the general market returns. But there were notable company stock performance disparities within each sector, highlighted later in this report. Larger market capitalized companies performed better, which skewed the market cap weighted Indices.
Traditional media stocks seemed to have stabilized from the rapid declines in early 2022. The Publishing sector once again outperformed the general market in the quarter. Noble’s Television Index declined 3%, but this decline moderated from the 10% decline in the third quarter. The Radio industry still has not yet stabilized, with the Noble Radio Index down 15% in the latest quarter.
Broadcast Television
Will Netflix suck the air out of the room?
Netflix launched a new pricing plan on November 3rd which offers a basic tier with advertising at a low price point of $6.99. This compares with its previous tiers of $9.99 and $19.99 for advertising-free streaming. While reports indicate that the advertising platform is off to a slow start, we believe that the Netflix move could be disruptive to the broadcast television network business as its lower price basic service gains traction. It is likely that there will be some cannibalization from its higher pricing tier, but we believe that the move will broaden its subscriber base. While Netflix has not considered offering live sports on its streaming platform given the cost of sports rights, we believe that the potential success of its subscription/advertising tier may provide a platform to upend that decision. There is a strong tailwind for viewership trends on streaming platforms, which now exceed that of broadcast television viewing. A decision to enter sports will be a big deal and disruptive to network broadcasting.
Streaming viewership not only eclipsed television viewing in July 2022, but also that of cable viewing, 34.8% versus 34.4%. In addition, based on the latest Nielsen data from November 2022, streaming now accounts for 38.2% of total viewing with Broadcast at 25.7% and cable at 31.8%, as shown in the chart below. While TV viewership increased 7.8% in November, largely due to sports content, streaming usage year over year was up more than 41%.
Scripps Plans To Expand Sports
The declining cable subscriptions and cable viewership, especially on regional sports networks, led E.W. Scripps to launch a new Scripps Sports division. This division plans to seek broadcast rights from teams and leagues and bring that programming to broadcast television. The company plans to obtain rights either in local TV markets where it can partner with local teams or on a national basis, utilizing its distribution on its Ion Network. It is important to note that ION is unique from other networks. Ion’s distribution is nearly 100% of the US television market given that it has local licenses and local towers in every market, it is fully distributed on cable and satellite, and is offered over the air. As such, we believe that Scripps offers a unique proposition to sports teams interested in building its audiences.
Will ATSC 3.0 Stream The Tide?
Furthermore, the broadcast industry appears to be more aggressively ramping its own streaming capabilities with the rollout of its new broadcast standard, ATSC 3.0. ATSC 3.0 is built on the same Internet Protocol as other streaming platforms which enables broadcast programming and internet content to be accessible in the car, on mobile devices, and in the home. While there are many opportunities for the new standard, services and offerings are still being developed. ATSC 3.0 offers promising opportunities for broadcasters to compete with streaming services in the future. We expect that the industry will make more announcements about this promising technology at future events, including the upcoming NAB Show, April 16-19 in Las Vegas, NV.
Are We In A Recession?
In our view, the current fundamentals may be better than the stocks project. Advertising seems to be holding up, post political advertising. Most companies in the industry reported strong Q3 revenue growth, influenced by a large influx of political advertising. The largest broadcasters, particularly Nexstar, have the largest EBITDA margins. The two stocks with the highest revenue growth in the quarter, Entravision and E.W. Scripps, saw their shares perform the best in the fourth quarter.
Notably, local advertising appears to be fairing better than national advertising. Based on our estimates, core local advertising is expected to be down in the range of 5% to 8%, with core national down as much as double digits. We believe that some large advertising categories like auto, retail and home improvement will show improving trends. The first quarter 2023 appears to be consistent with the fourth quarter. Broadcast network TV is another story, which we believe is weak. Network has potential heightened competition from streamers such as Netflix and Disney+ which have just launched ad-supported streaming tiers.
Is There Room For Upside?
Most TV stocks are trading in a tight range of each other. The biggest variance in stock valuations is Entravision, which is trading at 5.9x EV to our 2023 EBITDA estimate, well below that of its industry peers which trade on average at 7.7x. One might argue that Entravision, which has migrated to become a leading Digital Media company which contributes roughly 80% of its total company revenues, ought to trade at a premium to its broadcast peers, rather than at a discount. Investors appear to be somewhat confused by the company’s relatively low EBITDA margins, which is a function of how revenues are accounted for in its digital media division. We would also note that its capital structure is among the best in the industry, with a large cash position and modest net debt position.
As mentioned earlier, the Noble Broadcast TV Index declined 3% in the latest quarter, underperforming the general market’s 7% advance. E.W. Scripps, which increased 6% and Entravision, which increased 5% were among the strongest revenue performers in the third quarter. Among the poor performers were shares of Gray Television, down a significant 34% and Sinclair Broadcasting, which was down 24%. With the TV stocks down a significant 23% for the year, have the stocks already assumed that the industry is in an economic downturn? We believe that the stocks may be oversold based on the prospect that advertising is currently holding up in the first quarter.
Broadcast Radio
Digital Is Bolstering Performance
The radio industry index was the worst performing index in the traditional media segment, declining 15% in 4Q22 and 64% for the year. The radio industry is feeling the pressure that recessionary concerns place on the demand for advertising. In addition to increased competition for audiences from digital music providers and shifting advertising dollars from radio to a more targeted advertising medium, digital media.
For the third quarter Urban One and Townsquare Media top its peers with revenue growth of 9% and 8%, respectively. A common theme with companies that grew fastest was diversified revenue streams. Salem Media and Beasley Broadcast Group grew less quickly but are taking steps to further diversify revenue. Salem has diversified into content creation and digital media and Beasley is continuing to pursue a digital agency model. The median Q3 revenue growth rate was 1.5%, and the average revenue growth was -1%. The average growth rate of -1% is skewed due to the poor performance of Medico Holdings (MDIA). In previous quarters Medico benefited from Covid-19 vaccine advertising campaigns and ticket sales for an annual outdoor live event that took place in Q3 of 2021. Without Covid vaccine advertising and Medico’s concert being held in Q2 2022 instead of Q3 resulted in revenue declining 34% on a year over year basis.
After the 2022 calendar year ended, Moody’s downgraded Cumulus Media’s Corporate Family Rating to B3 from B2. Moody’s believes Cumulus Media will face a further decline in advertising demand as the economy weakens. Moody’s could upgrade its rating if leverage decreases to 5x as a result of positive performance and could downgrade its rating if leverage ratio increases to 7x as a result of poor performance. It should be noted that Cumulus has a large cash position of $118 million and could access an additional $100 million through an asset backed loan.
However, there are several companies in the radio industry with improving leverage profiles. We believe that radio companies are diversifying traditional revenue streams with digital revenue. In our view, companies that achieved a greater degree of digital transformation and are better shielded from macroeconomic headwinds. Townsquare Media, Cumulus Media, and Salem Media are among the cheapest in the group. For those companies with substantial digital media businesses that are growing rapidly, like Townsquare Media and Beasley, we believe that advertising pacings in the first quarter are likely to be positive. On the low end pacings are expected to be flat to plus 3% and may even be stronger, up 8% or more in the second quarter (although this is too early to bank). In our view, advertising for these companies do not appear to be falling off of a cliff as the stocks seem to project. Therefore, we believe that the Radio sector appears to be in an oversold position and should have some upside prospects in 2023.
Publishing
Publishing stocks had a pretty good quarter, up 18% as measured by the Noble Publishing Index versus the general market as measured by the S&P 500 Index up 7%. But the largest stocks in the index, New York Times and News Corp, were the only stocks that were up in the sector. Given that the Noble Publishing Index is market cap weighted, it was the reason that the Index was up in the quarter. Lee Enterprises was down a very modest 2% in the quarter. The relatively favorable performance of the index was primarily due to its largest constituents, News Corp. and The New York Times, which rebounded from -30% and -39%, respectively in Q2 2022, to -3% and +3%, respectively, in Q3 2022 and then up 17% and 16%, respectively, in Q4 2022.
We believe that Gannett, the nation’s largest newspaper company, continues to create a pall over the publishing group as it continues to struggle to manage cash flows with its heavy debt burden. In August, the company announced a round of layoffs of 400 employees and then announced another 200 in December. We believe that the company is trying to shore up its cash flow amidst a weak fundamental environment. Not surprisingly, GCI shares (-30%) were among the worst performers in the sector in the fourth quarter. To a large extent, the stock performance in the latest quarter reflected the various company results in Q3.
Q3 publishing revenue declined on average 1%, which excludes the strong revenue growth of the Daily Journal. The company benefited from its Journal Technologies consulting fees which bolstered revenues in its fiscal Q4 results. In addition, during the year, the company sold marketable securities for roughly $80.6 million, realizing net gains of $14.2 million. We have backed out the extraordinary results of the Daily Journal from our industry averages. Notably, Gannett had the weakest revenue performance in the fourth quarter, down 10%.
Notable exceptions to the overall weak industry revenue performance was The New York Times, up 7.5% in Q3 revenues, which reflected a moderation in revenue growth from the prior quarter of an increase of 12%. News Corp, declined 1%, which was well below the 7% gain in the prior quarter. Importantly, Lee Enterprises’ fiscal quarter revenue was down a modest 0.2%, a sequential improvement from the modest 0.7% decrease in the prior fiscal quarter. We believe that Lee’s digital strategy continues to gain traction and that the company is very close to an inflection point toward revenue growth. We continue to note that Lee’s digital subscriptions currently lead the industry. The company has exceeded all of its peers in terms of digital subscription growth in the past 11 consecutive quarters. Furthermore, over 50% of its advertising is derived from digital. Currently, roughly 30% of the company’s total revenues are derived from digital, still short of the 55% at The New York Times, but closing the gap.
Not only is Lee performing well on the digital revenue front, but the company has industry leading margins. Lee’s Q3 EBITDA margins were industry leading at 16.7%. We believe that Lee’s margins are notable given that it demonstrates that the company is managing its margins in spite of the investments in its digital media businesses. Its margins place it on par with its digital media focused peers, such as the New York Times.
LEE’s shares trade at an average industry multiple of 5.7x Enterprise Value to our 2023 adj. EBITDA estimate. Notably, the company is closing the gap with its digital media revenue contribution to that of New York Times. The New York Times carries a significantly higher stock valuation, currently trading at an estimated 15.8x EV to 2023 adj. EBITDA. We believe that the valuation gap with the New York Times should close.
This newsletter was prepared and provided by Noble Capital Markets, Inc. For any questions and/or requests regarding this news letter, please contact Chris Ensley
DISCLAIMER
All statements or opinions contained herein that include the words “ we”,“ or “ are solely the responsibility of NOBLE Capital Markets, Inc and do not necessarily reflect statements or opinions expressed by any person or party affiliated with companies mentioned in this report Any opinions expressed herein are subject to change without notice All information provided herein is based on public and non public information believed to be accurate and reliable, but is not necessarily complete and cannot be guaranteed No judgment is hereby expressed or should be implied as to the suitability of any security described herein for any specific investor or any specific investment portfolio The decision to undertake any investment regarding the security mentioned herein should be made by each reader of this publication based on their own appraisal of the implications and risks of such decision This publication is intended for information purposes only and shall not constitute an offer to buy/ sell or the solicitation of an offer to buy/sell any security mentioned in this report, nor shall there be any sale of the security herein in any state or domicile in which said offer, solicitation or sale would be unlawful prior to registration or qualification under the securities laws of any such state or domicile This publication and all information, comments, statements or opinions contained or expressed herein are applicable only as of the date of this publication and subject to change without prior notice Past performance is not indicative of future results.
Please refer to the above PDF for a complete list of disclaimers pertaining to this newsletter
Michael Kupinski, Director of Research, Noble Capital Markets, Inc.
Jacob Mutchler, Research Associate, Noble Capital Markets, Inc.
Refer to the bottom of the report for important disclosures
Overview:Will It Be A Happy New Year? The full impact of the recent increase in interest rates likely have not been fully reflected in the economy. But, many media stocks seem to anticipate that the industry is in a downturn now. Notably, some stocks have recently performed better and the current fundamentals are not falling off of a cliff.
Digital Media: Coming Off Of Its Sugar High?While Google now plans to phase out cookies in the second half of 2024, it is likely that the plan will affect 2023 as marketers and publishers prepare for the deprecation of cookies.
Television Broadcasting: A Watershed Year For Streaming. Streaming has now eclipsed both broadcast TV and cable TV in terms of viewing based on Nielsen data. Recently, Netflix launched a new pricing plan on November 3 which offers a basic tier, with advertising, at a low price point of $6.99. What does this mean for the TV industry?
Radio Broadcasting:Digital Is Bolstering Performance. It has been a bloodbath for Radio stocks, but the fundamentals appear better than the stock performance might suggest. Radio broadcasters with significant digital businesses are anticipated to report favorable pacings in Q1.
Publishing: You Are Golden If You Have Digital. The trouble with the largest newspaper company, Gannett, has created a pall over the group as it struggles to cut expenses. But, companies with substantial digital operations have performed well. We highlight one of our current favorites Lee Enterprises (LEE).
Overview
Will It Be A Happy New Year?
2022 was one of the worse for media stock performance in recent memory, with stocks across traditional and digital media sectors down over 40% or more. Media stocks underperformed the general market, as measured by the S&P 500 Index, which was down a more moderate 19.4% on a comparable basis for the full year 2022. It is typical for media stocks to underperform in a late-stage economic cycle or in the midst of an economic downturn. But, the significant stock declines are stunning. Macro-economic issues including inflation, rising interest rates, and the prospect of a looming economic downturn, all contributed to the poor performance.
The question is “will 2023 be better?” We believe so. There has been recent signs of life. The S&P 500 increased by 7% during the fourth quarter of 2022, marking the first time the Index had increased since fourth quarter of 2021. Notably, the Noble Publishing and Noble MarTech Indices outperformed the general market in the latest quarter. But, the full impact of the recent interest rate increase likely have not been reflected in the economy. Many media stocks seem to anticipate an economic downturn, but current fundamentals do not appear to be in a freefall and may be better than expected. If the economy further deteriorates from the recent or future rate hikes, it appears now that it may adversely affect the second half of 2023. Advertising pacings appear to be holding up well so far in the first half 2023. Notably, media stocks may begin to anticipate an improving economic outlook and overlook the weak fundamental environment in the second half.
Conventional thought anticipates that increasing concerns over an economic recession may prompt mortgage rates to trend lower in 2023. Furthermore, it is possible that the Fed may lower interest rates if inflation moderates, although the Fed is not currently anticipating rate decreases in 2023. Nonetheless, this paints a favorable picture for media stocks in 2023. Traditionally, the best time to buy media stocks is in the midst of an economic downturn. In addition, these consumer cyclical stocks tend to be among the first movers in an early-stage economic cycle and tend to perform well in a moderating interest rate environment. As mentioned earlier, the stocks may currently be oversold given the prospect that the current fundamental
environment is better anticipated.
What is the risk to this favorable outlook? We believe that the resurging Chinese economy may be disruptive. Within the last month, the China’s economy has been reopened from Covid lockdowns, which may put pressure on global energy prices. Such a prospect may make our fight on inflation more stubborn to combat, potentially throwing off our favorable outlook for moderating interest rates. In our view, we are closer to the light at the end of the tunnel than we were last year. Given the prospect that these stocks tend to outperform the market in an early stage economic recovery, we believe it is time for investors to accumulate positions in the media sectors. In this quarterly, we highlight some of our favorite plays in the Digital, Media & Technology space.
Digital Media & Technology
A Year To Forget
While there were signs of life in the fourth quarter of 2022 for the Internet and Digital Media sectors, 2022 was a year most investors in these sectors would like to forget. As Figure #1 LTM Internet & Digital Technology Performance illustrates, every one of these sectors substantially underperformed the S&P 500 last year. The S&P 500 Index finished the year down 19% which was substantially better than Noble’s Digital Media Index (-41%), MarTech Index (-52%), Social Media Index (-63%), and Ad Tech Index (-63%). Rather than focus on the stocks that significantly underperformed their respective Indices (and there are many), we would rather focus on the three stocks that finished 2022 up for the year.
The shares of one of our favorites, Harte Hanks (HHS)increased by 53% in 2022. The company continued its multi-year turnaround from a highly levered and unprofitable business (in 2019), to a double digit EBITDA margin business with a debt-free balance sheet. Furthermore, we believe that many of the company’s business lines have recession resilient qualities. The other stocks that performed well are Tencent (TME), whichincreased by 21%in 2022. Shares declined earlier in the year as China’s economy slowed as it maintained its Zero Covid-19 lockdowns, but surged in the fourth quarter as it appeared that the company would enjoy an increase in demand as China begins easing Covid restrictions. Finally, the shares of Perion Networks (PERI) increased by 5% in 2022 as Perion consistently beat expectation and raised its guidance throughout 2022. In the first week of 2023, the company once again pre-announced better than expected results for the fourth quarter, and shares are already up 14% since the start of the new year.
As Figure #2 Q4 Internet & Digital Technology Performancehighlights, there has been signs of life in Noble’s MarTech Index which increased 6%, roughly in-line with the market. In Noble’s MarTech Index, 11 of the 22 stocks in the index posted gains, led by Yext (YEXT; +46%), Shopify (SHOP; +29%), LiveRamp (RAMP; +29%) and Adobe (ADBE; +22%). This marks significant improvement from last quarter when only 4 of the sectors’ stocks finished the quarter in positive territory. MarTech stocks have suffered from a market reset to revenue multiples that began when the Fed began raising rates. MarTech share price declines in the first, second and third quarters of 2022 were mostly driven by multiple compression as investors rotated out of high-flying tech sectors where companies had chased growth at all costs (at the expense of profitability). Only 7 of the MarTech companies in the Index posted positive EBITDA in the latest quarter. Laggards during the fourth quarter were Noble’s Digital Media Index (-5%), Social Media Index (-7%) and Ad Tech Index (-20%).
Coming Off Of A Sugar High?
One of the largest issues affecting the Digital Media industry in 2023 will be the phase out of the use of third-party cookies. Cookies were used to track a user visits on internet sites and that data was used to model behavior. The industry has moved away from the use of cookies as governments and consumers have raised concerns over privacy issues and as consumers wanted more control over how their data is used. Governments have taken a more active role in protecting consumer privacy. California, Colorado, Connecticut, Utah, and Virginia have passed privacy laws. It is likely that there will be a federal privacy law at some point.
How will this affect the industry? We believe that there has been plenty of time to “work around” this issue. The implementation of the phase out of cookies has been delayed several times, originally announced by Google in 2020. Google now plans to phased out cookies in the second half of 2024, if it is not delayed again. As marketers and publishers prepare for the deprecation of cookies, digital advertising likely will be begin to affect 2023.
Digital Advertising Outlook for 2023
Last October eMarketer revised lower its 2023 U.S. digital advertising forecast by $5.5 billion, from $284.1 billion to $278.6 billion. While this sounds like a substantial drop in percentage terms, the 2023 guidance was lowered from 14% growth to 12% growth. Most of the global ad agencies expect digital to continue to grow by double digits driven with dollars migrating to such digital ad channels as retail media and connected TV. Both sectors continue to demonstrate impressive growth.
Retail Media – A retail media network is a retailer-owned advertising service that allows marketers to purchase advertising space across all digital assets owned by a retail business, using the retailer’s first-party data to connect with shoppers throughout the buying journey. eMarketer forecasts that retail media ad spending grew by 31% last year to $41 billion and will grow to $61 billion over the next two years, by which time it will equate to 20% of digital advertising. The leaders in retail media are Amazon, Walmart and Instacart.
Through a retail media network, partners (advertisers) get direct access to a retailer’s customers. The benefit to the partners/advertisers is that they get access to first party data. Retailers own and store this data and allow advertisers to access them through their retail media programs. The first party data is valuable because it is collected at the point of sale allowing brands to get better insights into purchase behavior. Traditional retailers are beginning to follow suit. Traditional retailers with the largest digital audiences (per comScore) are Walmart, Target, Home Depot, Lowes, CVS, Walgreens, Costco and Kohls.
On January 10th, Microsoft announced that it intended to create the industry’s most complete omnichannel retail media technology stack supported by its Promote IQ platform, a company Microsoft acquired in 2019. We expect companies that serve the retail media sector from an Ad Tech or Mar Tech standpoint are poised to benefit from secular trends in this sector.
Connected TV (CTV) – Last July, Nielsen announced that for the first time U.S. streaming TV viewership was larger than cable TV viewing. In July 2022, eMarketer forecast that CTV advertising would reach $18.9 billion in 2022. However, in October 2022, eMarketer raised its forecast for CTV advertising by $2.3 billion to $21.2 billion in 2022. In October, the forecaster also raised its 2023 CTV advertising forecast by $3 billion to $26.9 billion, up from $23.9 billion in the July 2022 forecast. The big increase is due primarily to Netflix and Disney+ announcing they were launching ad supported tiers to their streaming offerings. Ad Tech or Mar Tech companies that serve this market are also poised to benefit from secular viewing trends and the advertising dollars that are migrating to these platforms, discussed later in this report.
The ability to target specific audiences and measure specific outcomes tied to the ads that viewers watched, has made CTV a force to be reckoned with, particularly for those advertisers that are never quite sure which advertising mediums provide the highest returns. Historically, TV was a mass medium used by large brands that wanted massive reach. CTV has opened the door to a wider variety of advertisers that are looking to reach more targeted, even niche, audiences. According to MNTN, a connected TV performance marketing platform, many CTV advertisers are first-time TV advertisers. With new FAST (Free Ad-Supported Streaming TV) channels coming online every month, there is no shortage of supply coming to market. This is just one reason why eMarketer predicts CTV advertising to grow by $10+ billion over the next two years and reach nearly $32 billion in advertising revenue in 2024.
As we look toward 2023, our current favorites include Harte Hanks (HHS) and Direct Digital (DRCT). In terms of Harte Hanks, we believe that the company has recession resilient qualities and that the company’s balance sheet is in a sound position. Furthermore, given the recent rising interest rate environment, the company’s unfunded pension liabilities have dramatically improved. The company may have the opportunity to further mitigate its pension liabilities in 2023. Figure #3 Marketing Tech Comparables highlights, the shares of HHS are trading well below its peers. We believe that there is meaningful upside potential in the shares as it closes the valuation gap with its peers.
While the deprecation of cookies has created a pall over the sector, we believe that Direct Digital has worked with its Publishers to mitigate this issue. In addition, the company is a relatively small player in a very large marketplace. As such, we believe that the company has the ability to attractively grow in 2023. In our view, the shares appear to be oversold given the continuation of favorable advertising trends. Figure #4 Advertising Tech Comparables illustrates that the DRCT shares trade below the average valuation in its Advertising Marketing peer set. In our view, the valuation should be higher than the averages given that the company has leading industry revenue growth. Closing this valuation gap offers compelling stock appreciation potential.
Figure #1 LTM Internet & Digital Technology Performance
Source: Capital IQ
Figure #2 Q4 Internet & Digital Technology Performance
Source: Capital IQ
Marketing Technology
Figure #3 Marketing Tech Comparables
Source: Eikon, Company filings and Noble estimates
Figure #4 Advertising Tech Comparables
Source: Eikon, Company filings and Noble estimates
Traditional Media
Another Quarter Of Moderating Stock Performance
Traditional media stocks underperformed the general market in 2022, with the Radio sector the hardest hit. As Figure #5 LTM Traditional Media Performance Chart illustrates, the Noble Radio Index declined 63.8% versus 19.4% for the general market, as measured by the S&P 500, in a comparable time period. Television and Publishing stocks were down 23.2% and 25.4%, respectively, more in line with the general market returns. But, there were notable company stock performance disparities within each sector, highlighted later in this report. Larger market capitalized companies performed better, which skewed the market cap weighted Indices.
The traditional media stocks seemed to have stabilized from the rapid declines earlier in the year. Possible signs of life in the traditional media sector as well? As Figure #6 Q4 Traditional Media Performance highlights, the Publishing sector once again outperformed the general market in the quarter. The Noble Television Index declined 3.2%, but this decline moderated from the 10.1% decline in the third quarter. The Radio industry still has not yet stabilized, with the Noble Radio Index down 15.4% in the latest quarter.
Figure #5 LTM Traditional Media Performance
Source: Capital IQ
Figure #6 Q4 Traditional Media Performance
Source: Capital IQ
Television Broadcast
Will Netflix suck the air out of the room?
Netflix launched a new pricing plan on November 3 which offers a basic tier, with advertising, at a low price point of $6.99. This compares with its previous tiers of $9.99 and $19.99 for advertising free streaming. While reports indicate that the advertising platform is off to a slow start, we believe that the Netflix move could be disruptive to the Broadcast Television Network business as its lower price basic service gains traction. It is likely that there will be some cannibalization from its higher pricing tier, but we believe that the move will broaden its subscriber base. While Netflix has not considered offering live sports on its streaming platform given the cost of sports rights, we believe that the potential success of its subscription/advertising tier may provide a platform to upend that decision. There is a strong tailwind for viewership trends on streaming platforms, which now exceed that of broadcast television viewing. A decision to enter sports will be a big deal and disruptive to Network broadcasting.
Streaming viewership not only eclipsed television viewing in July 2022, but also that of cable viewing, 34.8% versus 34.4%. In addition, based on the latest Nielsen data from November 2022, streaming now accounts for 38.2% of total viewing with Broadcast at 25.7% and cable at 31.8%. Figure #7 Viewership illustrates the November viewership data. While TV viewership increased 7.8% in November, largely due to sports content, streaming usage year over year was up more than 41%.
Figure #7 Viewership
Source: Nielsen Media Insights
Scripps Plans To Expand Sports
The declining cable subscriptions and cable viewership, especially on regional sports networks, led E.W. Scripps to launch a new Scripps Sports division. This division plans to seek broadcast rights from teams and leagues and bring that programming to broadcast television. The company plans to obtain rights either in local TV markets where it can partner with the the teams or on a national basis, utilizing its distribution on its Ion Network. It is important to note that ION is unique from other networks. Ion’s distribution is nearly 100% of the US television market given that it has local licenses and local towers in every market, it is fully distributed on cable and satellite, and is offered over the air. As such, we believe that Scripps offers a unique proposition to sports teams interested in building its audiences.
Will ATSC 3.0 Stream The Tide?
Furthermore, the broadcast industry appears to be more aggressively ramping its own streaming capabilities with the rollout of its new broadcast standard, ATSC 3.0. ATSC 3.0 is built on the same Internet Protocol as other streaming platforms, and, as such, broadcast programming and internet content can be accessible in the car, on mobile devices, as well as in the home. Importantly, the new standard can handle signal shifting, like if you were moving in a car, and the signal is more robust so you may be able to pick up more stations in a local market. While there are many opportunities for the new standard, services and offerings are still being developed. But, it offers promising opportunities for broadcasters to compete with streaming services in the future. We expect that the industry will make more announcements about this promising technology at future events, including the upcoming NAB Show, April 16-19 in Las Vegas, NV.
Are We In A Recession?
In our view, the current fundamentals may be better than the stocks project. Advertising seems to be holding up, post political advertising. As Figure #8 TV Q3 YoY Revenue Growth highlights, most companies in the industry reported strong Q3 revenue growth, influenced by a large influx of Political advertising. Figure #9 TV Q3 EBITDA Margins illustrates that the largest broadcasters, particularly Nexstar, has the largest EBITDA margins. Notably, the two stocks with the highest revenue growth in the quarter, Entravision and E.W. Scripps, performed the best in the fourth quarter, discussed later.
Notably, Local advertising appears to be fairing better than National advertising. Based on our estimates, core local advertising is expected to be down in the range of 5% to 8%, with core National down as much as the double digits. We believe that some large advertising categories like Auto, Retail and Home Improvement will show improving trends. The first quarter 2023 appears to be consistent with the fourth quarter. Smaller market TV likely will perform at the lower end of the range, while larger market TV will be at the higher end (greater core revenue decline). Broadcast Network is another story, which we believe is weak. Network has potential heightened competition. Figure #8 TV Q3 YoY Revenue Growth
Source: Eikon and Company filings
Figure #9 TV Q3 EBITDA Margins
Source: Eikon and Company filings
As mentioned earlier, the Noble Television Broadcast Index declined 3.2% in the latest quarter, underperforming the general market’s 7.2% advance. Importantly, the 3.2% decline in valuations was a moderation from the 10.1% decline in the third quarter. There were variances in the performance and some notable performers including two of our favorites: E.W. Scripps, which increased 5.8% and Entravision, which increase 5.3%. Both of these companies were among the strongest revenue performers in the third quarter. Among the poor performers was Gray Television, down a significant 33.7% and Sinclair Broadcasting, down 24.0%. With the TV stocks down a significant 23.2% for the year, have the stocks already assumed that the industry is in an economic downturn? We believe that the stock may be oversold based on the prospect that advertising is currently holding up in the first quarter.
Is There Room For Upside?
As Figure # 10 TV Industry Comparables highlight, most TV stocks are trading in a tight range of each other. The biggest variance in stock valuations is our current favorite Entravision, trading at 5.9 times EV to our 2023 EBITDA estimate, well below that of its industry peers which trade on average at 7.7 times. We believe that Entravision, which has migrated to become a leading Digital Media company which contributes roughly 80% of its total company revenues, should trade at a premium to its broadcast peers, rather than at a discount. Investors appear to be somewhat confused by the company’s relatively low EBITDA margins, which is a function of how revenues are accounted for in its Digital Media Division. We would also note that its financial profile is among the best in the industry, with a large cash position and modest net debt position of $86 million. As such, EVC leads our favorites in this sector.
Figure #10 TV Industry Comparables
Source: Eikon, Company filings and Nobles estimates
Radio Broadcast
Digital Is Bolstering Performance
The radio industry index was the worst performing index in the traditional media segment, declining 15.4% in the quarter and 63.8% for the year. The radio industry is feeling the pressure that recessionary concerns place on the demand for advertising. In addition to increased competition for audiences from digital music providers and shifting advertising dollars from radio to a more targeted advertising medium, digital media.
Figure #11 Radio Industry Q3 YoY Revenue Growth chart illustrates the year over year change in revenue for the third quarter. Urban One and Townsquare Media top their peers with revenue growth of 8.9% and 8.4%, respectively. A common theme with companies at the top of the list are diversified revenue streams. Salem Media and Beasley Broadcast Group are in the middle of the pack and are both taking steps to further diversify revenue. Salem has diversified into content creation and digital media and Beasley is continuing to pursue digital agency model. The median Q3 revenue growth rate was 1.5%, and the average revenue growth was -1%. The Average growth rate of -1% is skewed due to the poor performance of Medico holdings. In previous quarters Medico benefited from Covid-19 vaccine advertising campaigns and ticket sales for an annual outdoor live event that took place in Q3 of 2021. Without Covid vaccine advertising and Medico’s concert being held in Q2 2022 instead of Q3 resulted in revenue declining 33.6% on a year over year basis.
Industry adj. EBITDA margins were healthy, as Figure #12 Radio Industry Q3 EBITDA margins illustrates, Urban one, Townsquare Media and Iheart Media top the list with adj. EBITDA margins of 30.6%, 25.6% and 25.5%, respectively.
After the 2022 calendar year ended, Moody’s downgraded Cumulus Media’s Corporate Family Rating to B3 from B2. Moody’s believes Cumulus Media will face a further decline in advertising demand as the economy weakens. Moody’s could upgrade its rating if leverage decreases to 5x as a result of positive performance and could downgrade its rating if leverage ratio increases to 7x as a result of poor performance. It should be noted that Cumulus has a large cash position of $118 million and could access an additional $100 million through an asset backed loan.
However, there are several companies in the Radio industry with improving leverage profiles. Moreover, we believe that radio companies are diversifying traditional revenue streams with digital revenue. In our view, companies that achieved a greater degree of digital transformation and are better shielded from macroeconomic headwinds. Figure #13 Radio Industry Comparables highlights, Townsquare Media, Cumulus Media, and Salem Media are among the cheapest in the group. For those companies with substantial digital media businesses that are growing rapidly, like Townsquare Media and Beasley, we believe that advertising pacings in the first quarter are likely to be positive. On the low end pacings are expected to be flat to plus 3% and may even be stronger, up 8% or more in the second quarter (although this is too early to bank). In our view, advertising for these companies do not appear to be falling off of a cliff as the stocks seem to project. As such, we believe that the Radio sector appears to be in an oversold position and should have some upside prospects in 2023. Our favorites include TSQ, SALM, BBGI, and CMLS.
Figure #11 Radio Industry Q3 YoY Revenue Growth
Source: Eikon and Company filings
Figure #12 Radio Industry Q3 EBITDA Margins
Source: Eikon and Company filings
Figure #13 Radio Industry Comparables
Source: Eikon, Company filings and Nobles estimates
Publishing
Illustrated above in Figure #6 Q4 Traditional Media Performance, the Publishing stocks had a pretty good quarter, up 17.9% as measured by the Noble Publishing Index versus the general market as measured by the S&P 500 Index up 7.1%. But the largest stocks in the index, New York Times and News Corp, were the only stocks that were up in the sector. Given that the Noble Publishing Index is market cap weighted, it was the reason that the Index was up in the quarter. Importantly, one of our favorites, Lee Enterprises was down a very modest 2.3% in the quarter. Again, the relatively favorable performance of the index was primarily due to its largest constituents, News Corp. and The New York Times, which rebounded from -29.7% and -39.1%, respectively in Q2, to -3% and +3%, respectively, in Q3 and then up 16.8% and 16.3%, respectively, in Q4.
We believe that Gannett, the nation’s largest newspaper company, continues to create a pall over the publishing group as it continues to struggle to manage cash flows with its heavy debt burden. In August, the company announced a round of lay offs of 400 employees and then announced another 200 in December. We believe that the company is trying to shore up its cash flow amidst a weak fundamental environment. Not surprisingly, the GCI shares were among the worse performers in the sector in the latest quarter, down 30%. To a large extent, the stock performance in the latest quarter reflected the various company results in Q3.
As Figure #14 Publishing Industry Q3 YoY Revenue Performance chart illustrates, Q3 publishing revenue declined on average 1.1%, which excludes the strong revenue growth of the Daily Journal. The company benefited from its Journal Technologies consulting fees which bolstered revenues in its fiscal Q4 results. In addition, during the year, the company sold marketable securities for roughly $80.6 million, realizing net gains of $14.2 million. As such, we have backed out the extraordinary results of the Daily Journal from our industry averages. Notably, Gannett had the weakest revenue performance in the latest quarter, down 10%.
The notable exceptions to the overall weak industry revenue performance was The New York Times, up 7.5% in Q3 revenues, which reflected a moderation in revenue growth from the prior quarter of an increase of 11.5%. News Corp, declined 1%, which was well below the 7.3% gain in the prior quarter. Importantly, Lee Enterprises fiscal quarter revenue was down a modest 0.2%, a sequential improvement from the modest 0.7% decrease in the prior fiscal quarter. We believe that Lee’s digital strategy continues to gain traction and that the company is very close to an inflection point toward revenue growth. We continue to note that Lee’s digital subscriptions currently lead the industry. The company has exceeded all of its peers in terms of digital subscription growth in the past 11 consecutive quarters. Furthermore, over 50% of its advertising is derived from digital. Currently, roughly 30% of the company total revenues are derived from Digital, still short of the 55% at The New York Times, but closing the gap.
Not only is Lee performing well on the Digital revenue front, it has industry leading margins. As Figure #15 Publishing Industry Q3 EBITDA Margins illustrates, Lee’s Q3 EBITDA margins were industry leading at 16.7%, again, excluding the extraordinary results at the Daily Journal which benefited from marketable securities trading. We believe that Lee’s margins are notable given that it demonstrates that the company is managing its margins in spite of the investments in its Digital Media businesses. Its margins place it on pare with its Digital Media focused peers, such as the New York Times.
As Figure #16 Publishing Industry Comparables chart illustrates, the LEE shares trade at an average industry multiple of 5.7 times Enterprise Value to our 2023 adj. EBITDA estimate. Notably, the company is closing the gap with its Digital Media revenue contribution to that of New York Times. The New York Times carries a significantly higher stock valuation, currently trading at an estimated 15.8 times EV to 2023 adj. EBITDA. We believe that the valuation gap with the New York Times should close. As such, we view the LEE shares as among our favorites in the industry.
Figure #14 Publishing Industry Q3 YoY Revenue Growth
Source: Eikon and Company filings
Figure #15 Publishing Industry Q3 EBITDA Margins
Source: Eikon and Company filings
Figure #16 Publishing Industry Comparables
Source: Eikon, Company filings and Nobles estimates.
For additional disclosures and information on companies mentioned in this report, please click on the company name:
All statements or opinions contained herein that include the words “we”, “us”, or “our” are solely the responsibility of Noble Capital Markets, Inc.(“Noble”) and do not necessarily reflect statements or opinions expressed by any person or party affiliated with the company mentioned in this report. Any opinions expressed herein are subject to change without notice. All information provided herein is based on public and non-public information believed to be accurate and reliable, but is not necessarily complete and cannot be guaranteed. No judgment is hereby expressed or should be implied as to the suitability of any security described herein for any specific investor or any specific investment portfolio. The decision to undertake any investment regarding the security mentioned herein should be made by each reader of this publication based on its own appraisal of the implications and risks of such decision.
This publication is intended for information purposes only and shall not constitute an offer to buy/sell or the solicitation of an offer to buy/sell any security mentioned in this report, nor shall there be any sale of the security herein in any state or domicile in which said offer, solicitation or sale would be unlawful prior to registration or qualification under the securities laws of any such state or domicile. This publication and all information, comments, statements or opinions contained or expressed herein are applicable only as of the date of this publication and subject to change without prior notice. Past performance is not indicative of future results. Noble accepts no liability for loss arising from the use of the material in this report, except that this exclusion of liability does not apply to the extent that such liability arises under specific statutes or regulations applicable to Noble. This report is not to be relied upon as a substitute for the exercising of independent judgement. Noble may have published, and may in the future publish, other research reports that are inconsistent with, and reach different conclusions from, the information provided in this report. Noble is under no obligation to bring to the attention of any recipient of this report, any past or future reports. Investors should only consider this report as single factor in making an investment decision.
IMPORTANT DISCLOSURES
This publication is confidential for the information of the addressee only and may not be reproduced in whole or in part, copies circulated, or discussed to another party, without the written consent of Noble Capital Markets, Inc. (“Noble”). Noble seeks to update its research as appropriate, but may be unable to do so based upon various regulatory constraints. Research reports are not published at regular intervals; publication times and dates are based upon the analyst’s judgement. Noble professionals including traders, salespeople and investment bankers may provide written or oral market commentary, or discuss trading strategies to Noble clients and the Noble proprietary trading desk that reflect opinions that are contrary to the opinions expressed in this research report. The majority of companies that Noble follows are emerging growth companies. Securities in these companies involve a higher degree of risk and more volatility than the securities of more established companies. The securities discussed in Noble research reports may not be suitable for some investors and as such, investors must take extra care and make their own determination of the appropriateness of an investment based upon risk tolerance, investment objectives and financial status.
Company Specific Disclosures
The following disclosures relate to relationships between Noble and the company (the “Company”) covered by the Noble Research Division and referred to in this research report. Noble is not a market maker in any of the companies mentioned in this report. Noble intends to seek compensation for investment banking services and non-investment banking services (securities and non-securities related) with any or all of the companies mentioned in this report within the next 3 months
ANALYST CREDENTIALS, PROFESSIONAL DESIGNATIONS, AND EXPERIENCE
Senior Equity Analyst focusing on Basic Materials & Mining. 20 years of experience in equity research. BA in Business Administration from Westminster College. MBA with a Finance concentration from the University of Missouri. MA in International Affairs from Washington University in St. Louis. Named WSJ ‘Best on the Street’ Analyst and Forbes/StarMine’s “Best Brokerage Analyst.” FINRA licenses 7, 24, 63, 87
WARNING
This report is intended to provide general securities advice, and does not purport to make any recommendation that any securities transaction is appropriate for any recipient particular investment objectives, financial situation or particular needs. Prior to making any investment decision, recipients should assess, or seek advice from their advisors, on whether any relevant part of this report is appropriate to their individual circumstances. If a recipient was referred to Noble Capital Markets, Inc. by an investment advisor, that advisor may receive a benefit in respect of transactions effected on the recipients behalf, details of which will be available on request in regard to a transaction that involves a personalized securities recommendation. Additional risks associated with the security mentioned in this report that might impede achievement of the target can be found in its initial report issued by Noble Capital Markets, Inc.. This report may not be reproduced, distributed or published for any purpose unless authorized by Noble Capital Markets, Inc..
RESEARCH ANALYST CERTIFICATION
Independence Of View All views expressed in this report accurately reflect my personal views about the subject securities or issuers.
Receipt of Compensation No part of my compensation was, is, or will be directly or indirectly related to any specific recommendations or views expressed in the public appearance and/or research report.
Ownership and Material Conflicts of Interest Neither I nor anybody in my household has a financial interest in the securities of the subject company or any other company mentioned in this report.
Salem Media Group is America’s leading multimedia company specializing in Christian and conservative content, with media properties comprising radio, digital media and book and newsletter publishing. Each day Salem serves a loyal and dedicated audience of listeners and readers numbering in the millions nationally. With its unique programming focus, Salem provides compelling content, fresh commentary and relevant information from some of the most respected figures across the Christian and conservative media landscape.
Michael Kupinski, Director of Research, Noble Capital Markets, Inc.
Patrick McCann, Research Associate, Noble Capital Markets, Inc.
Refer to the full report for the price target, fundamental analysis, and rating.
Q3 meets expectations. The company reported Q3 revenue of $66.9 million, in line with our estimate of $66.6 million. Adj. EBITDA of $6.1 million was slightly better than our forecast of $5.5 million, illustrated in Figure #1 Q3 Variance. Notably, we are adjusting EBITDA for a one-time legal settlement fee paid by the company during the quarter.
Weak Q4 pacing. Management guided Q4 revenue down 3-5% year-over-year compared with our expectation of 7% growth. Management cited a weak Publishing outlook as well as an ongoing pullback in the company’s #1 broadcast advertising category (mortgage companies) as primary factors in the challenged outlook.
This Company Sponsored Research is provided by Noble Capital Markets, Inc., a FINRA and S.E.C. registered broker-dealer (B/D).
*Analyst certification and important disclosures included in the full report. NOTE: investment decisions should not be based upon the content of this research summary. Proper due diligence is required before making any investment decision.
Michael Kupinski, Director of Research, Noble Capital Markets, Inc.
Patrick McCann, Research Associate, Noble Capital Markets, Inc.
Jacob Mutchler, Research Associate, Noble Capital Markets, Inc.
Refer to the bottom of the report for important disclosures
Overview. Develop a shopping list.This report focuses on the looming economic recession and how investors should position portfolios for the prospect of an economic recovery. But, a more important theme of this report is for investors not to look for the past leaders in the industry as the best way to play a rebound. In this report, we look beyond a rebound play and focus on our favorite growth plays.
Digital Media: The smaller beat the goliaths.Two of our current favorites in the AdTech and MarTech industries performed better than most of its respective peers in the quarter. Can the momentum continue?
Television Broadcasting: Will political carry the quarter? With signs of weakening National advertising, broadcasters are looking forward toward Q4 Political as an offset. Political advertising, however, is not usually evenly spent across all markets. There may be winners and some losers.
Radio Broadcasting: Polishing its tarnished image.One of the epic fails of the radio industry has been Audacy, once one of the leadership companies of the industry. The AUD shares are down a staggering 95% from highs in March 2021. New industry leaders are emerging and they are not focused on radio. We highlight a few of our current favorites.
Publishing: Once a leader, now a loser.It is hard to believe that Gannett was once a $90 stock and held a record for one of the longest strings of quarterly earnings gains in the S&P 500 Index. The shares are down 80% from year earlier highs to near $1.37. We believe that investors should take a look at a company that has developed into an impressive Digital Media publisher.
Overview
Develop A Shopping List
The best time to buy stocks is typically in the midst of an economic recession. Investors begin to look beyond the economic weakness and begin positioning portfolios for an economic rebound. The hard part is determining when the economy is in the middle of the downturn. It appears by all standard definitions of an economic downturn that the U.S. is in an economic recession. But, how long will a downturn last? Should investors try to be cute to predict the midpoint of the downturn?
Many economic pundits paint the current state of the economy against the canvas of the 1970s, a period of high inflation and low economic growth. There are many similarities. The Federal Reserve in the early 70s was willing to provide cheap money to fuel the economy, without much concern about inflation. In the second half of the 70s, the economy was rocked by fuel supply shortages and high inflation. During the Covid pandemic, both fiscal and monetary policy was designed to provide liquidity and to make sure that people were able to pay their bills during the economic lockdowns. This had the affect of increasing personal income, even though GDP declined 31.4% in 2020. As the economy reopened, there was significant demand for goods and services, some of which were in short supply because of the previous and recurring economic lock downs. Simplistically, this fueled inflation, high demand with a consumer that had disposable income and limited supply.
As Figure #1 Early 1970s chart illustrates, the US economy grew 9.8%, as measured by real GDP, from January 1972 to September 1975. Notably, the stock market, as measured by the S&P 500 Index, declined a significant 18.6%. This was a period marked by rising inflation due to government spending. The inflation rate, as measured by the US Bureau of Labor Statistics, was a reasonable 3.3% in 1972, but increased to 11.1% in 1974 and then moderated slightly to 9.1% in 1975. The inflation rate remained above 5% for the following 3 years.
Figure #1 Early 1970s
Source: US Bureau of Economic Analysis and Yahoo Finance.
Given the current state of rising energy prices, many pundits paint the current US economic plight similar to the period of fuel shortages of the late 1970s. As Figure #2 Late 1970s illustrates, the US economy, as measured by real GDP, grew 13.5% from January 1977 to October 1981, an average of slightly more than 3% per year. Notably, inflation increased significantly, from 6.5% in 1977 to 11.3% in 1979, followed by 13.5% in 1980, and 10.3% in 1981. The stock market, as measured by the S&P 500 Index, did not react well, up 9.3% from January 1977 to October 1981, an average of 2.3% growth.
Figure #2 Late 1970s
Source: US Bureau of Economic Analysis and Yahoo Finance.
So, where are we now? In the present, the Covid induced government spending and stimulus related fiscal policy, large spending on the Ukraine war, and a Fed unwilling to rein in early signs of inflation has put the US in a dire economic position. Certainly, supply chain shortages contributed to the current rise in inflation, as well. The Fed now appears to have religion on inflation and is aggressively raising interest rates. The Fed indicated that it is willing to create economic pain to arrest inflationary pressures. Most certainly this will cause additional economic weakness. The stock market in the near to intermediate term will need to digest the likelihood of weakening corporate profits, as well. Furthermore, as it relates to the equity markets, other investment classes, such as bonds, may become more appealing, taking demand from the stock market.
We believe that arresting inflation would set a favorable trajectory for the stock market, as investors position for the prospect of an economic recovery. To some degree, the 24.4% drop in the stock market, as measured by the S&P 500 index, from January 2022 to near current levels, anticipate some of the headwinds for investors described earlier in this report, including weakening corporate profits, the prospect of a further weakened US, and, even global economy, a move toward other investment classes, and stubborn inflation. What is different this time is that the Fed now appears to be aggressively tackling inflation. As such, the 47% drop in the stock market from highs in 1973 to the low in 1974 may not be a prelude to the current environment. It was a different Fed and it took different actions.
We encourage a different approach than trying to time the market. Our advice is for investors to develop a shopping list and begin accumulating. But, be selective.
We believe that the leadership companies of the past economic downturns are not likely to be the best positioned for the looming economic downturn or the recovery. Many of the larger cap names in each sector have fallen on hard times. This is discussed more fully in the following sector reports. Those that appear to be well positioned are companies that have diversified revenue streams, transitioned to faster growth digital businesses, and pared down debt. We encourage investors to focus on these companies given the prospect of faster revenue and cash flow growth coming out of the possible recession. Some of our current favorites include Entravision, Townsquare Media, Salem Media, Harte Hanks, Direct Digital, and Lee Enterprises. These companies are discussed in the following sector summaries.
Internet & Digital Media
Internet and Digital Media stocks declined for the fourth consecutive quarter in a row, as Figure #3 Internet & Digital Media Stock Performance illustrates. It wasn’t all bad, as Noble’s Ad Tech Index outperformed the general market, as measured by the S&P 500 Index, up +7%. Comparatively, the S&P 500 Index decreased by 5%. Figure #4 Internet & Digital Media Q3 Performance reflects the outperformance of the AdTech sector. AdTech also materially outperformed Noble’s other Internet & Digital Media subsectors, including Noble’s Digital Media Index (-10%); Social Media Index (-15%) and MarTech Index (-16%). Notably, some of our closely followed companies significantly outperformed the respective peer group and outperformed the general market, discussed later in this report.
Figure #3 Internet & Digital Media LTM Stock Performance
Source: Capital IQ
Figure #4 Internet & Digital Media Q3 Stock Performance
Source: Capital IQ
Marketing Technology
Harte Hanks shines in MarTech
The worst performing sector was the MarTech sector, which is also the least profitable sector. This likely explains the sector’s underperformance. Only 4 of the 24 companies we monitor in this sector generate positive EBITDA, and investors migrated away from unprofitable growth stocks towards more profitable companies or defensive sectors that might withstand a recession better. Investors would clearly like to see companies in this sector accelerate their path to profitability, and most companies in the sector are responding accordingly. To be fair, some of the companies that aren’t EBITDA positive do generate positive cash flow from operations, which is a quirk of SaaS software accounting. Of the two dozen companies in this sector, the only stock that was up during the quarter was Harte-Hanks (HHS), whose shares increased by 68%. HHS continues to generate improved operating results while lowering its debt and pension obligations.
MarTech stocks have also been victims of their own success. Earlier this year the group traded at average revenue and EBITDA multiples of 8.5x and 70.8x, respectively. Today the same group trades at average revenue and EBITDA multiples of 4.5x and 30.1x, respectively. Stocks like Shopify (SHOP), and Hubspot (HUBS) entered the year trading at 22.2x and 14.7x 2022E revenues, respectively, and now trade at 5.3x, and 7.7x, respectively. Some of this appears to be a Covid-related hangover: when Covid hit, retail companies needed to emphasize their online channels, and companies like Shopify benefited. As consumers return to stores, growth has moderated. Shopify aside, the broader message investors seem to be sending is that recurring revenues are great, but not if they are paired with EBITDA losses at a time when economy appears to be heading into a potential recession.
As Figure #5 Marketing Tech Comparables illustrate, the shares of Harte Hanks is among the cheapest in the sector, currently trading at 5.1 times Enterprise Value to our 2023 adj. EBITDA estimate. We believe that the modest stock valuation relative to peers, currently trading on average at 12.9 times, illustrates the head room for the stock in spite of the 68% move in the latest quarter. The shares of HHS continue to be among our favorites in the sector.
Figure #5 Marketing Tech Comparables
Source: Eikon, Company filings and Nobles estimates
Advertising Technology
Direct Digital exceeds peers
Noble’s AdTech Index was the worst performing Index of the group in the second quarter when it was down 39%. As such, it was nice to see a better performance in the third quarter. In addition, Noble Indices are market cap weighted, and we attribute the relative strength of the Ad Tech Index to the performance of The Trade Desk (TTD), the Ad Tech sectors largest market cap company, whose shares were up 42% during the quarter. Other notable performers were Digital Media Solutions (DMS; +73%) which announced a deal to be taken private, and Zeta Global (ZETA; +46%), whose 2Q results significantly exceeded guidance. Despite the relative strength of the sector, returns were not broad-based: only 9 of the 23 stocks in the Ad Tech sector were up during the quarter.
One of our closely followed companies, Direct Digital (DRCT) had a strong performance, up 75% in the quarter. The company’s second quarter exceeded expectations and the company raised full year 2022 revenue and cash flow guidance by a significant 40%. The company appears to be bucking the downward trend in National advertising, which is reflected in its peer group quarterly performance.
As Figure #6 Advertising Tech Comparables illustrate, Direct Digital Holdings is trading near the averages in terms of Enterprise Value to the 2023 adj. EBITDA estimate. We would note that this valuation is low considering that the company is outperforming its peers. As such, we believe that there is a valuation gap and we continue to view DRCT shares as among our favorites.
Figure #6 Advertising Tech Comparables
Source: Eikon, Company filings and Nobles estimates
Traditional Media
Downward trends, but some bright spots
The Traditional Media stocks have had tough sledding this year. As Figure #7 Traditional Media LTM Stock Performance illustrates, all of Noble’s Traditional Media Indices have declined over the past 12 months and each have underperformed the general market. The downward spiral seemed to have moderated somewhat in the third quarter.
Notably, during the third quarter, many of the stocks had a very nice bounce before resuming a downward trend, as Figure #8 Traditional Media Q3 Stock Performance illustrates. At one point in the latest quarter, stocks were up as high as 30% from the second quarter end. It is important to note that only the Publishing stocks outperformed the general market in the latest quarter. A description of the traditional media sectors follow with our favorite picks for the upcoming quarter and year.
Figure #7 Traditional Media LTM Stock Performance
Source: Capital IQ
Figure #8 Traditional Media Q3 Stock Performance
Source: Capital IQ
Television Broadcasting
Noble’s TV Index dropped 10.1% in the third quarter, underperforming the broader market (-5.3%), illustrated in Figure #8 Traditional Media Q3 Stock Performance. As we indicated in our previous quarterly report, we believe that there would be a trading opportunity in the media stocks. The latest quarter stock performance indicated that. Many of the TV stocks had a strong performance from the end of the second quarter (June 30) to highs achieved in August. Many of the TV stocks increased a strong 25% on average. It is instructive to know that E.W. Scripps had the largest advance from June 30 lows, up 31% to highs achieved August 16. When the industry is in favor, the shares of E.W. Scripps tends to outperform its industry peers. The shares of Entravision (EVC) were the next best performing within the quarter, up 30%, before trading lower and ending down 12%.
The TV stocks were challenged by macro economic pressures such as inflation, rising cost of borrowing, and a Fed determined to curb inflation by slowing the economy. In the end, interest rate increases by the Fed curbed enthusiasm for TV stocks and the Noble TV Index ended the third quarter down.
As Figure #9 Q2 YOY Revenue Growth illustrates, the average television company reported 11.1% revenue growth in the latest quarter. Most broadcasters were very optimistic about Political advertising, with some raising forecasts to be near the levels of the Presidential election, a highwater mark. We would note that Entravision had the highest revenue performance in the quarter, up 24%, as the company continues to benefit from its transition toward faster growth Digital, which now accounts for over 80% of its total company revenues.
Industry adj. EBITDA margins were healthy, as Figure #10 Q2 EBITDA margins illustrate, with the average margin for the industry at 25.5%. It is notable to mention that Entravision margins appear to be significantly below that of the industry at 10.1%. Its Digital business is a rep business, and, as such, the company reports revenues on a net basis and not gross revenues. While a rep business tends to be a lower margin business, the reporting of rep revenues gives the appearance of very low margins. The company is in a strong cash flow and free cash flow position.
Most companies will be reporting third quarter financial results in the first two weeks in November. We believe that the third quarter will reflect an influx of Political advertising, even though the lion’s share of the Political advertising likely will fall in the fourth quarter. Consequently, we believe that the third quarter revenue growth will be better than the second quarter, showing some acceleration. With signs of weakening National advertising, and a likely weakening Local advertising environment in some larger markets, broadcasters are looking forward toward Q4 Political as an offset. Many broadcasters indicated that Political advertising may be at record levels in 2022, even higher than the Presidential election year of 2020. Political advertising, however, is not usually evenly spent across all markets. As such, there may be winners and some disappointment.
Investors are not encouraged to buy a Television broadcaster on the basis of the upcoming fourth quarter Political advertising influx. There are broader issues at play, like cord cutting, slowing Retransmission revenue growth, and the prospect for a weakening economy. We believe broadcasters with minimal emphasis on National advertising, a larger focus on small to medium size markets and local advertising, are best positioned to weather an economic downturn. We also like companies that do not have high debt leverage. In addition, we like diversified companies that can benefit from cord cutting, like E.W. Scripps, or have diversified revenue streams and large fast growing digital businesses, like Entravision. As Figure #11 TV Industry Comparables illustrate, the shares of Entravision are among the cheapest in the industry and the EVC shares leads our favorites in the industry.
Figure #9 TV Industry Q2 YoY Revenue Growth
Source: Eikon and Company filings
Figure #10 TV Industry Q2 EBITDA Margins
Source: Eikon and Company filings
Figure #11 TV Industry Comparables
Source: Eikon, Company filings and Nobles estimates
Radio Broadcasting
Polishing its tarnished image
One of the epic fails of the radio industry has been Audacy, once one of the leadership companies in the industry. The AUD shares are down a staggering 95% from highs in March 2021. The poor stock performance reflects the poor revenue and cash flow performance and high debt levels at the company. Recently, the company announced that it plans to sell some of its prized assets, including its podcasting business, Cadence 13, in an effort to more aggressively pare down debt. While Audacy struggles, there are emerging leaders in the industry, many that are not focused on its radio business, discussed later in this report.
As Figure #12 Radio Industry Q2 YoY Revenue Growth chart illustrates, the average radio revenue grew 8.9%. Companies that were at the top of the list of revenue growth had diversified revenue streams. Townsquare Media was the best performer, with Q2 revenue growth of 13.6%. We believe that Townsquare also benefits from significantly lower National advertising and concentration on less cyclical larger markets. Other diversified companies that performed better than the lower growth companies in the group were Salem Media and Beasley Broadcasting. Salem Media has diversified into content creation and digital media and Beasley recently accelerated its push into Digital Media. Separately, Beasley recently announced a station swap with Audacy, which will enhance its position with its four existing stations in Las Vegas.
On the margin front, Townsquare Media also was among the leaders in the industry. Notably, Townsquare Media’s digital business carries margins similar to its Radio businesses, near 30%. As such, its investments in Digital Media are not depressing its total company margins. As Figure #13 Q2 Radio Industry EBITDA Margins illustrate, Townsquare’s Q2 adj. EBITDA margins were 26.6%, well above that of the larger industry peers like iHeart (24.9%), Cumulus Media (19.2%), and Audacy (12.0%).
In looking forward toward the upcoming third quarter results, which will be released in coming weeks, we believe that the effects of rising inflation and weakening economy will start to show. Many of the larger broadcasters which focus on larger markets, have national network business, may disappoint. In addition, we believe that there will be spotty Political advertising performances. In our view, the resulting potential weakness in the stocks may create an opportunity to more aggressively accumulate or establish positions.
Radio stocks largely mirrored the performance of the TV industry, falling 9% in the third quarter, illustrated above, in Figure #8 Traditional Media Q3 Stock Performance. Last quarter we pointed out that large industry players such as Audacy and iHeart had an outsized negative impact on the market cap-weighted index. This was due to the stocks being downgraded by a Wal Street firm on the basis of high leverage in a time of recession.
However, there are several broadcasters in the Radio industry with improving leverage profiles. Furthermore, we believe that in a time when traditional radio companies are making a transition to more digitally based revenue sources, investors would do well to differentiate among them on that basis as well. In our view, certain companies are ahead of peers in the digital transformation and are better shielded from certain fundamental headwinds that have traditionally plagued radio broadcasters in prior recessions. We encourage investors to focus on Townsquare Media (TSQ), Salem Media (SALM), and Beasley Broadcasting (BBGI). As Figure #14 Radio Industry Comparables highlights, Townsquare Media, Cumulus Media, and Salem Media are among the cheapest in the group.
Figure #12 Radio Industry Q2 YoY Revenue Growth
Source: Eikon and Company filings
Figure #13 Q2 Radio Industry EBITDA Margins
Source: Eikon and Company filings
Figure #14 Radio Industry Comparables
Source: Eikon, Company filings and Nobles estimates
Publishing
Once a leader, now a loser
It is hard to believe that Gannett was once a $90 stock and held a record for one of the longest strings of quarterly earnings gains in the S&P 500 Index. The shares are down 80% from year earlier highs to near $1.37. For some anti newspaper investors, this is a “told you so” moment. But, this view missed notable exceptions, like the New York Times, which seemed to transition more quickly toward Digital revenues. There are publishers that are set apart from the weak trends at Gannett and are on a favorable trajectory toward a Digital future. As such, we believe that investors should not throw the baby out with the bathwater or avoid the industry. There are gems here, which is discussed later in this report.
There were sizable differences in the financial performance of the companies in the publishing group. As Figure #15 Publishing Industry Q2 YoY Revenue Performance chart illustrates, Q2 publishing revenue declined on average 1.5%. The notable exceptions to this performance was The New York Times, up 11.5%, News Corp, up 7.3%, and Lee Enterprises, down a modest 0.7%. The improved performance into the ranks of the leaders in the industry is quite notable. Lee’s digital subscriptions currently lead the industry. The company has exceeded all of its peers in terms of digital subscription growth in the past 11 consecutive quarters. Furthermore, over 50% of its advertising is derived from digital. Currently, roughly 30% of the company total revenues are derived from Digital, still short of the 55% at The New York Times, but closing the gap.
Not only is Lee performing well on the Digital revenue front, it has industry leading margins. As Figure #16 Q2 Publishing Industry EBITDA Margins illustrates, Lee’s Q2 EBITDA margins were 11.8%, in line with News Corp and second only to the New York Times at 17.4%. We believe that margins should improve over time as the company continues to migrate toward a higher digital margin business model.
Illustrated above in Figure #8 Traditional Media Q3 Stock Performance is Noble’s Publishing Index, which decreased a modest 2.4% in the quarter, outperforming the S&P (-5.3%). The relatively favorable performance of the index was primarily due to its largest constituents, News Corp. and The New York Times, which rebounded from -29.7% and -39.1%, respectively in Q2, to -3% and +3%, respectively, in Q3. The average percentage change of the stocks in the industry was -16.2%, more in line with Traditional Media as a whole. One of the poor performing stocks in the index for the quarter was Gannett (GCI) which declined 47%. It was recently reported that the company implemented austerity measures included unpaid leave and voluntary layoffs. In the case of Lee Enterprises, the shares were down a much more modest 7%, more in line with the general market. In our view, the company is expected to report favorable third quarter results and the shares are undervalued.
As Figure #17 Publishing Industry Comparables chart illustrates, the LEE shares trade at an average industry multiple of 5.8 times Enterprise Value to our 2023 adj. EBITDA estimate. Notably, the company is closing the gap with its Digital Media revenue contribution to that of New York Times, which is currently trading at an estimated 14.5 times EV to 2023 adj. EBITDA. We believe that the valuation gap with the New York Times should close as well. In recent Lee Enterprise news, a buyout specialist investor filed a 13D and indicated interest in taking the company private.While financial players continue to circle the wagons for Lee, we believe that investors should take note. In our view, the LEE shares are compelling and offer a favorable risk/reward relationship.
Figure #15 Publishing Industry Q2 YoY Revenue Growth
Source: Eikon and Company filings
Figure #16 Q2 Publishing Industry EBITDA Margins
Source: Eikon and Company filings
Figure #17 Publishing Industry Comparables
Source: Eikon, Company filings and Nobles estimates
Reports with important disclosure information of companies highlighted in this report may be found here:
All statements or opinions contained herein that include the words “we”, “us”, or “our” are solely the responsibility of Noble Capital Markets, Inc.(“Noble”) and do not necessarily reflect statements or opinions expressed by any person or party affiliated with the company mentioned in this report. Any opinions expressed herein are subject to change without notice. All information provided herein is based on public and non-public information believed to be accurate and reliable, but is not necessarily complete and cannot be guaranteed. No judgment is hereby expressed or should be implied as to the suitability of any security described herein for any specific investor or any specific investment portfolio. The decision to undertake any investment regarding the security mentioned herein should be made by each reader of this publication based on its own appraisal of the implications and risks of such decision.
This publication is intended for information purposes only and shall not constitute an offer to buy/sell or the solicitation of an offer to buy/sell any security mentioned in this report, nor shall there be any sale of the security herein in any state or domicile in which said offer, solicitation or sale would be unlawful prior to registration or qualification under the securities laws of any such state or domicile. This publication and all information, comments, statements or opinions contained or expressed herein are applicable only as of the date of this publication and subject to change without prior notice. Past performance is not indicative of future results. Noble accepts no liability for loss arising from the use of the material in this report, except that this exclusion of liability does not apply to the extent that such liability arises under specific statutes or regulations applicable to Noble. This report is not to be relied upon as a substitute for the exercising of independent judgement. Noble may have published, and may in the future publish, other research reports that are inconsistent with, and reach different conclusions from, the information provided in this report. Noble is under no obligation to bring to the attention of any recipient of this report, any past or future reports. Investors should only consider this report as single factor in making an investment decision.
IMPORTANT DISCLOSURES
This publication is confidential for the information of the addressee only and may not be reproduced in whole or in part, copies circulated, or discussed to another party, without the written consent of Noble Capital Markets, Inc. (“Noble”). Noble seeks to update its research as appropriate, but may be unable to do so based upon various regulatory constraints. Research reports are not published at regular intervals; publication times and dates are based upon the analyst’s judgement. Noble professionals including traders, salespeople and investment bankers may provide written or oral market commentary, or discuss trading strategies to Noble clients and the Noble proprietary trading desk that reflect opinions that are contrary to the opinions expressed in this research report. The majority of companies that Noble follows are emerging growth companies. Securities in these companies involve a higher degree of risk and more volatility than the securities of more established companies. The securities discussed in Noble research reports may not be suitable for some investors and as such, investors must take extra care and make their own determination of the appropriateness of an investment based upon risk tolerance, investment objectives and financial status.
Company Specific Disclosures
The following disclosures relate to relationships between Noble and the company (the “Company”) covered by the Noble Research Division and referred to in this research report. Noble is not a market maker in any of the companies mentioned in this report. Noble intends to seek compensation for investment banking services and non-investment banking services (securities and non-securities related) with any or all of the companies mentioned in this report within the next 3 months
ANALYST CREDENTIALS, PROFESSIONAL DESIGNATIONS, AND EXPERIENCE
Senior Equity Analyst focusing on Basic Materials & Mining. 20 years of experience in equity research. BA in Business Administration from Westminster College. MBA with a Finance concentration from the University of Missouri. MA in International Affairs from Washington University in St. Louis. Named WSJ ‘Best on the Street’ Analyst and Forbes/StarMine’s “Best Brokerage Analyst.” FINRA licenses 7, 24, 63, 87
WARNING
This report is intended to provide general securities advice, and does not purport to make any recommendation that any securities transaction is appropriate for any recipient particular investment objectives, financial situation or particular needs. Prior to making any investment decision, recipients should assess, or seek advice from their advisors, on whether any relevant part of this report is appropriate to their individual circumstances. If a recipient was referred to Noble Capital Markets, Inc. by an investment advisor, that advisor may receive a benefit in respect of transactions effected on the recipients behalf, details of which will be available on request in regard to a transaction that involves a personalized securities recommendation. Additional risks associated with the security mentioned in this report that might impede achievement of the target can be found in its initial report issued by Noble Capital Markets, Inc.. This report may not be reproduced, distributed or published for any purpose unless authorized by Noble Capital Markets, Inc..
RESEARCH ANALYST CERTIFICATION
Independence Of View All views expressed in this report accurately reflect my personal views about the subject securities or issuers.
Receipt of Compensation No part of my compensation was, is, or will be directly or indirectly related to any specific recommendations or views expressed in the public appearance and/or research report.
Ownership and Material Conflicts of Interest Neither I nor anybody in my household has a financial interest in the securities of the subject company or any other company mentioned in this report.
Internet and Digital Media stocks declined for the fourth consecutive quarter in a row. It wasn’t all bad, as two of Noble’s Internet and Digital Media Indices outperformed the broader market (which we define as the S&P 500). Noble’s Ad Tech (+7%) and eSports & iGaming (+7%) Indices each finished up for the quarter, and significantly outperformed the S&P 500 Index in the process, which decreased by 5% in 3Q 2022. These two sectors also materially outperformed Noble’s other Internet & Digital Media subsectors, including Noble’s Digital Media Index (-10%); Social Media Index (-15%) and MarTech Index (-16%).
Noble Indices are market cap weighted, and we attribute the relative strength of the Ad Tech Index to The Trade Desk (TTD), the Ad Tech sector’s largest market cap company, whose shares were up 42% during the quarter. Other notable performers were Digital Media Solutions (DMS; +73%) which announced a deal to be taken private, and Zeta Global (ZETA; +46%), whose 2Q results significantly exceeded guidance. Despite the relative strength of the sector, returns were not broad-based: only 9 of the 23 stocks in the Ad Tech sector were up during the quarter.
The relative strength of Noble’s eSports and iGaming sector was also driven by the largest cap stocks in the sector. Shares of Draft Kings (DKNG) increased by 30% while shares of Flutter Entertainment (ISE:FLTR), the owner of FanDuel, increased by 17%. Shares of sports betting stocks have been battered this year as investors have become skeptical of the time it might take for these companies to reach profitability amidst a backdrop of a slowing economy and consumer propensity to spend.
Year-to-date, FLTR shares are down 19% while DKNG shares are down 45%. Shares are down even more relative to their highs reached in 4Q 2020. Like the Ad Tech sector, the eSports & iGaming sector’s relative strength was not broad-based: only 4 of the 16 stocks in this sector were up during the third quarter, and all of stocks in the sector are down year-to-date.
The worst performing sector was the MarTech sector, which is also the least profitable sector, which likely explains the sector’s underperformance. Only 4 of the 24 companies we monitor in this sector generate positive EBITDA, and investors migrated away from unprofitable growth stocks towards more profitable companies or defensive sectors that might withstand a recession better. Investors would clearly like to see companies in this sector accelerate their path to profitability, and most companies in the sector are responding accordingly. To be fair, some of the companies that aren’t EBITDA positive do generate positive cash flow from operations, which is a quirk of SaaS software accounting. Of the two dozen companies in this sector, the only stock that was up during the quarter was Harte-Hanks (HHS), whose shares increased by 68%. HHS continues to generate improved operating results while lowering its debt and pension obligations.
MarTech stocks have also been victims of their own success. Earlier this year the group traded at average revenue and EBITDA multiples of 8.5x and 70.8x, respectively. Today the same group trades at average revenue and EBITDA multiples of 4.5x and 30.1x, respectively. Stocks like Shopify (SHOP), and Hubspot (HUBS) entered the year trading at 22.2x and 14.7x 2022E revenues, respectively, and now trade at 5.3x, and 7.7x, respectively. Some of this appears to be a Covid-related hangover: when Covid hit, retail companies needed to emphasize their online channels, and companies like Shopify benefited. As consumers return to stores, growth has moderated. Shopify aside, the broader message investors seem to be sending is that recurring revenues are great, but not if they are paired with EBITDA losses at a time when economy appears to be heading into a potential recession.
M&A Continues to Hold Up Well Despite Macro Headwinds
Overall, we are impressed with the resiliency of the M&A marketplace in the Internet & Digital Media sectors. Despite a background that includes public equity market volatility, Fed rate hikes, persistent inflation, contractionary monetary policy, and geopolitical conflict, the M&A marketplace has held up relatively well, all things considered. Noble tracked 163 transactions in the third quarter of 2022 in the TMT sectors we follow, a 9% increase compared to the third quarter of 2021, when we tracked 150 deals, and 6% sequential slowdown compared to 2Q 2022, when we tracked 174 transactions. Year-to-date, the number of M&A transactions is up 7% vs. the year ago period, with 516 announced transactions this year compared to 483 transactions announced through the end of last year’s third quarter.
The real difference between 2022 and 2021 is the dollar value of transactions. Total deal value in 3Q 2022 fell by 36% to $28.4 billion, down from $44.1 billion in 3Q 2021. On a sequential basis, the $28.4 billion in deal value represents a 70% decrease from 2Q 2022 levels of $94.5 billion, nearly half of which reflects Elon Musk’s $46 billion offer to acquire Twitter (TWTR).
In looking at the M&A trends in the chart on the previous page, the biggest change is not the number of deals, but primarily the number of mega-deals. There was only one transaction in 3Q 2022 that was greater than $10 billion dollars: Adobe’s $19.4 billion acquisition of Figma, a collaborative all-in-one design platform. This decline in larger deal activity suggests acquirers are becoming more cautious about making big bets in the current environment or it could also mean that arranging for financing to close on larger deals is becoming more challenging. No doubt the cost to incur debt to close on transactions today are higher than they were just a few months ago, which lowers the return on debt financed M&A transactions. Referencing the Twitter deal again, according to media reports, Apollo Global Management and Sixth Street Partners, which had agreed to provide financing for the Twitter deal when it was first announced in April, are no longer in talks with Elon Musk to provide financing.
From a deal volume perspective, the most active sectors we tracked were Marketing Tech (44 deals), Digital Content (43 deals) and Agency & Analytics (28 deals) and Information (25 deals). From a deal value perspective, the largest transaction was Adobe’s nearly $20 billion acquisition of Figma, a collaborative design software company. Other active sectors were Marketing Tech ($4.9 billion), Information ($1.1 billion, and Digital Content ($1.1B).
Video Game M&A Declines Precipitously
For the last several quarters we have noted how strong M&A activity was in the current quarter. Perhaps the biggest surprise of the third quarter M&A analysis was the steep drop in M&A in North America in the video gaming sector. Interest in the video gaming sector exploded at the onset of the pandemic as work form home edicts resulted in less commuting time and more time playing video games. As the pandemic has subsided and consumers return to work, the sector has faced difficult comparions, and growth has been challenged.
As shown in the chart below, over the last several quarters, the sector had averaged 21 deals per quarter and $18+ billion in deal value. In the third quarter, there were only 11 announced transactions, and only one with a transaction price announced, resulting in just $3 million of deal value. Perhaps there is some consolation in that the second largest transaction in 3Q 2022 was a gaming related transaction: Unity Software’s agreement to buy IronSource Ltd, a lead generation platform for in-game advertising, for $4.4 billion.
While we expect M&A transactions to moderate given the difficult economic backdrop and an increase in the cost of financing transactions, we expect M&A marketplace to remain resilient. In our discussions with management teams in Internet & Digital Media sectors, we are struck by how many companies believe that industry consolidation is either beneficial or necessary. Scale is widely seen as a panacea to potential slowing or declining revenue trends.
iGaming
The following is an excerpt from a recent note by Noble’s Media Equity Research Analyst Michael Kupinski
The past year has been tough on the iGaming industry. The Noble iGaming Index is down nearly 54% versus a negative 17% for the general market, as measured by the S&P 500 Index. In the latest quarter, the iGaming stocks seemed to have stabilized, up 2% versus a continued general market decline, down 5% for the general market. Interestingly, the iGaming sector was the best performing sector among the Entertainment and Esports sectors, which were up a modest 1% and down 38%, respectively.
The shares of Codere Online (CDRO) could not fight the headwinds of the industry-wide selling pressure. CDRO shares dropped 70% from its post de-SPACing in December 2021. The weakness in the shares has been in spite of the company executing on its growth strategy as planned and maintaining its fundamental pace to meet full-year guidance. In the latest quarter, the shares drifted lower (-4%) versus the industry which increased 2%.
The poor performance of the iGaming industry in many respects is due to the developmental nature of the industry. Many of the companies included in the Noble iGaming index do not generate positive cash flow, with balance sheets supporting growth investment. Certainly, there will be a shake-out of players in the industry that do not have the financial capability to invest for growth, but we believe that Codere Online is one of the survivors.
Although the company is not yet cash flow positive, its operations in Spain generated its highest quarterly cash flow since Q2 2020. Adj. EBITDA in Spain was $3.6 million, enough to offset 87% of the $4.1 million adj. EBITDA loss from the company’s operations in Mexico. Interestingly, the marketing restrictions in the country came with a silver lining of lower competition. This is because the restrictions make it harder for newer operators to establish their brands in the country. Additionally, the lower marketing costs contributed to the strong cash flow generation. Notably, management expects similar cash flow generation going forward for the Spanish operations. We view the situation in Spain favorably as the consistent cash flow profile will help fund the expansion in Latin America and have a mitigating impact on the company’s cash burn.
eSports
The Esports industry had a difficult year and a difficult quarter in terms of stock performance. The horrible stock performance does not reflect the overall industry trends. Video gaming is still on the rise. It is estimated that there are 2.7 billion gamers worldwide, expected to achieve an estimated 3.0 billion gamers in 2023, based on Newzoo’s numbers. The video game market is expected to reach $159.3 billion this year and grow to $200.0 billion in 2023. So, what about the Esports industry? Esports viewership was elevated during the Covid lockdowns, with viewership significantly higher. Viewership trends are expected to increase even from the elevated 2020 levels to over 640 million viewers in 2025.
TRADITIONAL MEDIA COMMENTARY
The following is an excerpt from a recent note by Noble’s Media Equity Research Analyst Michael Kupinski
Overview
Downward trends, but some bright spots
Traditional Media stocks have had tough sledding this year. All of Noble’s Traditional Media Indices have declined over the past 12 months and each have underperformed the general market. The downward spiral seemed to have moderated somewhat in the third quarter.
Notably, during the third quarter, many of the stocks had a very nice bounce before resuming a downward trend. At one point in the latest quarter, stocks were up as high as 30% from the second quarter end. It is important to note that only the Publishing stocks outperformed the general market in the latest quarter.
Broadcast Television
Will Political Carry The Quarter?
Noble’s TV Index dropped 10% in the third quarter, underperforming the broader market (-5%) As we indicated in our previous quarterly report, we believe that there would be a trading opportunity in media stocks. The latest quarter stock performance indicated that. Many of the TV stocks had a strong performance from the end of the second quarter (June 30) to highs achieved in August. Many of the TV stocks increased a strong 25% on average. It is instructive to know that E.W. Scripps had the largest advance from June 30 lows, up 31% to highs achieved August 16. When the industry is in favor, the shares of E.W. Scripps tends to outperform its industry peers. The shares of Entravision (EVC) were the next best performing within the quarter, up 30%, before trading lower and ending down 12%.
TV stocks were challenged by macro-economic pressures such as inflation, the rising cost of borrowing, and a Fed determined to curb inflation by slowing the economy. In the end, interest rate increases by the Fed curbed enthusiasm for TV stocks and the Noble TV Index ended the third quarter down.
The average television company reported 11% revenue growth in the latest quarter. Most broadcasters were very optimistic about political advertising, with some raising forecasts to be near the levels of the Presidential election, a highwater mark. We would note that Entravision had the highest revenue performance in the quarter, up 24%, as the company continues to benefit from its transition toward faster growth digital advertising, which now accounts for over 80% of its total company revenues.
EBITDA margins were healthy, with the average margin for the industry at 25.5%. It is notable to mention that Entravision’s margins appear to be significantly below that of the industry at 10%. Its digital advertising business is a rep firm business, and, as such, the company reports revenues on a net basis and not gross revenues. While a rep firm business tends to be a lower margin business, the accounting treatment for rep revenues gives the appearance of very low margins. The company is in a strong cash flow and free cash flow position.
Most companies will be reporting third quarter financial results in the first two weeks in November. We believe that the third quarter will reflect an influx of political advertising, even though the lion share of the political advertising likely will fall in the fourth quarter. Consequently, we believe that the third quarter revenue growth will be better than the second quarter, showing some acceleration. With signs of weakening national advertising, and a likely weakening local advertising environment in some larger markets, broadcasters are looking forward toward Q4 political advertising as an offset. Many broadcasters indicated that political advertising may be at record levels in 2022, even higher than the Presidential election year of 2020. Political advertising, however, is not usually evenly spent across all markets. As such, there may be winners and some disappointment.
Investors are not encouraged to buy a Television broadcaster on the basis of the upcoming fourth quarter political advertising influx. There are broader issues at play, like cord cutting, slowing retransmission revenue growth, and the prospect for a weakening economy. We believe broadcasters with minimal emphasis on national advertising, a larger focus on small to medium size markets and local advertising, are best positioned to weather an economic downturn. We also like companies that do not have high debt leverage. In addition, we like diversified companies that can benefit from cord cutting, like E.W. Scripps, or have diversified revenue streams and large fast growing digital businesses, like Entravision.
Broadcast Radio
Polishing its tarnished image
One of the epic fails of the radio industry has been Audacy (AUD), once one of the leadership companies in the industry. AUD shares are down a staggering 95% from highs in March 2021. The poor stock performance reflects the poor revenue and cash flow performance and high debt levels at the company. Recently, the company announced that it plans to sell some of its prized assets, including its podcasting business, Cadence 13, in an effort to more aggressively pare down debt.
While Audacy struggles, there are emerging leaders in the industry, many that are not focused on its radio business. The average radio revenue grew 8.9%. Companies that were at the top of the list of revenue growth had diversified revenue streams. Townsquare Media (TSQ) was the best performer, with Q2 revenue growth of 13.6%. We believe that Townsquare also benefits from significantly lower national advertising and concentration on less cyclical larger markets. Other diversified companies that performed better than the lower growth companies in the group were Salem Media and Beasley Broadcasting. Salem Media has diversified into content creation and digital media and Beasley recently accelerated its push into Digital Media. Separately, Beasley recently announced a station swap with Audacy, which will enhance its position in with its four existing stations in Las Vegas.
On the margin front, Townsquare Media also was among the leaders in the industry. Notably, Townsquare Media’s digital business carries margins similar to its radio businesses, near 30%. As such, its investments in Digital Media are not depressing its total company margins. Townsquare’s Q2 adj. EBITDA margins were 27%, well above that of the larger industry peers like iHeart (25%), Cumulus Media (19%), and Audacy (12%).
In looking forward toward the upcoming third quarter results, which will be released in coming weeks, we believe that the effects of rising inflation and weakening economy will start to show. Many of the larger broadcasters which focus on larger markets, have national network business, may disappoint. In addition, we believe that there will be spotty political advertising performances. In our view, the resulting potential weakness in the stocks may create an opportunity to more aggressively accumulate or establish positions.
Radio stocks largely mirrored the performance of the TV industry, falling 9% in the third quarter. Last quarter we pointed out that large industry players such as Audacy and iHeart had an outsized negative impact on the market cap-weighted index. This was due to the stocks being downgraded by a Wall Street firm on the basis of high leverage in a time of recession.
However, there are several broadcasters in the radio industry with improving leverage profiles. Furthermore, we believe that in a time when traditional radio companies are making a transition to more digitally based revenue sources, investors would do well to differentiate among them on that basis as well. In our view, certain companies are ahead of peers in the digital transformation and are better shielded from certain fundamental headwinds that have traditionally plagued radio broadcasters in prior recessions, such as Townsquare Media (TSQ), Salem Media (SALM), and Beasley Broadcasting (BBGI).
Publishing
Once a leader, now a laggard
It is hard to believe that Gannett was once a $90 stock and held a record for one of the longest strings of quarterly earnings gains in the S&P 500 Index. The shares are down 80% from year earlier highs to near $1.37. For some anti newspaper investors, this is a “told you so” moment. But, this view missed notable exceptions, like the New York Times, which seemed to transition more quickly toward digital revenues. There are publishers that are set apart from the weak trends at Gannett and are on a favorable trajectory toward a digital future. As such, we believe that investors should not throw the baby out with the bathwater or avoid the industry. There are gems here, which is discussed later in this report.
There were sizable differences in the financial performance of the companies in the publishing group.Q2 publishing revenue declined on average 1.5%. The notable exceptions to this performance was The New York Times, up 11.5%, News Corp, up 7.3%, and Lee Enterprises, down a modest 0.7%. The improved performance into the ranks of the leaders in the industry is quite notable. Lee’s digital subscriptions currently lead the industry. The company has exceeded all of its peers in terms of digital subscription growth in the past 11 consecutive quarters. Furthermore, over 50% of its advertising is derived from digital. Currently, roughly 30% of the company total revenues are derived from digital, still short of the 55% at The New York Times, but closing the gap.
Not only is Lee performing well on the digital revenue front, it has industry leading margins. Lee’s Q2 EBITDA margins were 12%, in line with News Corp and second only to the New York Times at 17%. We believe that margins should improve over time as the company continues to migrate toward a higher digital margin business model.
Noble’s Publishing Index, which decreased a modest 2% in the quarter, outperforming the S&P (-5%). The relatively favorable performance of the index was primarily due to its largest constituents, News Corp. and The New York Times, which rebounded from -30% and -39%, respectively in Q2, to -3% and +3%, respectively, in Q3. The average percentage change of the stocks in the industry was -16%, more in line with Traditional Media as a whole. One of the poor performing stocks in the index for the quarter was Gannett (GCI) which declined 47%. It was recently reported that the company implemented austerity measures included unpaid leave and voluntary layoffs. In the case of Lee Enterprises, the shares were down a much more modest 7%, more in line with the general market.
LEE shares trade at an average industry multiple of 5.8 times Enterprise Value to our 2023 adj. EBITDA estimate. Notably, the company is closing the gap with its Digital Media revenue contribution to that of New York Times, which is currently trading at an estimated 14.5 times EV to 2023 adj. EBITDA. We believe that the valuation gap with the New York Times should close as well. In recent Lee Enterprise news, a buyout specialist investor filed a 13D and indicated interest in taking the company private. While financial players continue to circle the wagons for Lee, we believe that investors should take note.
This newsletter was prepared and provided by Noble Capital Markets, Inc. For any questions and/or requests regarding this news letter, please contact Chris Ensley
DISCLAIMER
All statements or opinions contained herein that include the words “ we”,“ or “ are solely the responsibility of NOBLE Capital Markets, Inc and do not necessarily reflect statements or opinions expressed by any person or party affiliated with companies mentioned in this report Any opinions expressed herein are subject to change without notice All information provided herein is based on public and non public information believed to be accurate and reliable, but is not necessarily complete and cannot be guaranteed No judgment is hereby expressed or should be implied as to the suitability of any security described herein for any specific investor or any specific investment portfolio The decision to undertake any investment regarding the security mentioned herein should be made by each reader of this publication based on their own appraisal of the implications and risks of such decision This publication is intended for information purposes only and shall not constitute an offer to buy/ sell or the solicitation of an offer to buy/sell any security mentioned in this report, nor shall there be any sale of the security herein in any state or domicile in which said offer, solicitation or sale would be unlawful prior to registration or qualification under the securities laws of any such state or domicile This publication and all information, comments, statements or opinions contained or expressed herein are applicable only as of the date of this publication and subject to change without prior notice Past performance is not indicative of future results.
Please refer to the above PDF for a complete list of disclaimers pertaining to this newsletter
Michael Kupinski, Director of Research, Noble Capital Markets, Inc.
Patrick McCann, Research Associate, Noble Capital Markets, Inc.
Refer to the full report for the price target, fundamental analysis, and rating.
Non-deal roadshow highlights. Last week, Direct Digital President, Keith Smith, and CFO, Susan Echard hosted meetings for investors in St. louis. This report highlights some of the key takeaways from the roadshow.
Re-iterated guidance. Management noted that the company remains on track to reach its upwardly revised full year 2022 revenue target of$70-$75 million. We are forecasting revenue of $70 million and adj. EBITDA of $8.4 million, for the full year.
This Company Sponsored Research is provided by Noble Capital Markets, Inc., a FINRA and S.E.C. registered broker-dealer (B/D).
*Analyst certification and important disclosures included in the full report. NOTE: investment decisions should not be based upon the content of this research summary. Proper due diligence is required before making any investment decision.
Salem Media Group is America’s leading multimedia company specializing in Christian and conservative content, with media properties comprising radio, digital media and book and newsletter publishing. Each day Salem serves a loyal and dedicated audience of listeners and readers numbering in the millions nationally. With its unique programming focus, Salem provides compelling content, fresh commentary and relevant information from some of the most respected figures across the Christian and conservative media landscape.
Michael Kupinski, Director of Research, Noble Capital Markets, Inc.
Patrick McCann, Research Associate, Noble Capital Markets, Inc.
Refer to the full report for the price target, fundamental analysis, and rating.
Updates Q3 guidance. Management lowered Q3 revenue guidance from a range of 6% to 8% growth to a range of flat to a positive 2%. The company indicated that the lower revenue outlook was due to a shift in revenue related to the Dinesh D’Souza book slipping into Q4 and softer expectations in its SalemNow segment.
SalemNow likely disappointing. We believe that the softer revenue expectations in SalemNow is likely related to a poor performance for Uncle Tom II. We like the company’s expansion into content, which can be very lucrative, but the success of the content is hard to predict.
This Company Sponsored Research is provided by Noble Capital Markets, Inc., a FINRA and S.E.C. registered broker-dealer (B/D).
*Analyst certification and important disclosures included in the full report. NOTE: investment decisions should not be based upon the content of this research summary. Proper due diligence is required before making any investment decision.